 Christoph Steinhausen1*
 Valerie Gerber1
 Rolf Stierle2Andreas Preusche3Andreas Dreizler3Joachim Gross2Bernhard Weigand1Grazia Lamanna1
- 1Institute of Aerospace Thermodynamics, University of Stuttgart, Stuttgart, Germany
- 2Institute of Thermodynamics and Thermal Process Engineering, University of Stuttgart, Stuttgart, Germany
- 3Institute Reactive Flows and Diagnostics, Technical University of Darmstadt, Darmstadt, Germany
With technical progress, combustion pressures have been increased over the years, frequently exceeding the critical pressure of the injected fluids. For conditions beyond the critical point of the injected fluids, the fundamental physics of mixing and evaporation processes is not yet fully understood. In particular, quantitative data for validation of numerical simulations and analytical models remain sparse. In previous works, transient speed of sound studies applying laser-induced thermal acoustics (LITA) have been conducted to investigate the mixing behaviour in the wake of an evaporating droplet injected into a supercritical atmosphere. LITA is a seedless, non-intrusive measurement technique capable of direct speed of sound measurements within these mixing processes. The used setup employs a high-repetition-rate excitation laser source and, therefore, allows the acquisition of time-resolved speed of sound data. For the visualisation of the evaporation process, measurements are accompanied by direct, high-speed shadowgraphy. In the present work, the measured speed of sound data are evaluated by applying an advection-controlled mixing assumption to estimate both the local mole fraction and mixing temperature. For this purpose, planar spontaneous Raman scattering results measured under the same operating conditions are evaluated using an advection-controlled mixing assumption with the perturbed-chain statistical associating fluid theory (PC-SAFT) equation of state. Successively, the resulting concentration–temperature field is used for the estimation of local mixture parameters from the detected speed of sound data. Moreover, models using the PC-SAFT equation of state and the NIST database for the computation of the speed of sound are compared. The investigations indicate a classical two-phase evaporation process with evaporative cooling of the droplet. The subsequent mixing of fluid vapour and ambient gas also remains subcritical in the direct vicinity of the droplet.
1 Motivation and introduction
The continuously increasing global electrical energy demands in combination with both political and social aspirations to reduce greenhouse gas emissions drive improvements in the efficiency of both renewable and non-renewable power generation processes. Since the specific entropy production is inversely proportional to the product of density and temperature, it decreases with increasing density. Assuming the same heat transfer and dissipation rates, higher operating pressures in energy conversion processes lead to a reduction in entropy production and concordantly to higher efficiencies. By virtue of this fact, operating pressures in energy conversion processes have increased in the past decade, leading to operating conditions that now exceed the critical values of the operating fluids or injected fuels. However, at supercritical pressure conditions, fundamental changes in fluid behaviour occur and their influence on the processes prior to combustion, such as fluid injection, disintegration, evaporation and mixing, are not yet fully understood. The latter becomes apparent when considering recent investigations on supercritical fluid injection by Falgout et al. [2], Müller et al. [3], Baab et al. [4], Crua et al. [5], Lamanna et al. [6], and Gerber et al. [7]. Moreover, research on near-critical evaporation and the search for a criterion to predict the onset of transcritical dense-fluid mixing have been performed by Dahms and Oefelein [8], Qiu and Reitz [9], and Banuti [10]. Lamanna et al. [11] have presented a detailed review and discussion on the validity of these criteria. Despite the increasing demand, quantitative data for the validation of numerical simulation and analytical models remain sparse and are an ongoing objective [5–7, 12–14].
Laser-induced thermal acoustics (LITA), also known as laser-induced (transient) grating spectroscopy (LIGS), is a seedless, non-intrusive measurement technique based on inelastic stimulated Brillouin scattering, which is capable of directly obtaining the data of speed of sound and flow velocity solely using the frequency domain of the measured signal. Cummings [15] has been among the first to introduce this technique to the scientific community. LITA is commonly applied to measure transport properties in quiescent environments, where a high spatial resolution is not the main objective of the investigation. Focusing on the determination of thermal and mass diffusion, as well as sound propagation, Kimura et al. [16] were among the first to apply the transient grating method in high-pressure fluids. A detailed review on the utilisation of LIGS in gas-phase diagnostics has been presented by Stampanoni-Panariello et al. [17]. The authors have performed thermometry, velocimetry, and concentration measurements, as well as investigations on energy transfer processes. By analysing the lifetime of the induced grating, Willman et al. [18] were able to determine the given pressure conditions. The feasibility of time-resolved thermometric investigations using LITA has been demonstrated by Förster et al. [19] under static and transient cell conditions. It is important to emphasise that for studies applying an optical arrangement with unfocused excitation beams, infinite wave fronts can be assumed. This leads to the simplified theoretical signal models presented by Cummings [15] or Stampanoni-Panariello et al. [20]. Unfortunately, unfocused excitation beams result in a large optical grid spacing with an order of magnitude up to
The objective of the present work is the presentation of the post-processing and experimental setups of the previously measured transient speed of sound data in more detail and the evaluation of these data by applying an advection-controlled mixing assumption to estimate the time-resolved local mole fraction and mixing temperature. For this purpose, complementary, planar spontaneous Raman scattering results measured under the same operating conditions by Bork [27] and Preusche et al. [28] are evaluated using an advection controlled mixing assumption applying the perturbed-chain statistical associating fluid theory (PC-SAFT) equation of state. Successively, the resulting averaged, two-dimensional concentration–temperature field is used for the evaluation of the LITA data, which results in the estimation of the local time-resolved mixture parameters. It should be noted that the applied assumption is justified by the short falling time of the droplet, which never exceeds 100 ms. The LITA-based time-resolved local mixing temperature and concentration data in the droplet wake are then used to determine the thermodynamic state of the mixture. The investigations indicated a classical two-phase evaporation process, resulting in evaporative cooling of the droplet and a subsequent subcritical mixing process in its wake in direct vicinity of the droplet. Moreover, the temporal evolution of the speed of sound data further verifies the advection controlled mixing assumption. Last, the present results provide a database for the validation of near- and trans-critical evaporation and mixture models and simulations.
2 Physical fundamentals and thermodynamic framework
The physical fundamentals of the LITA technique are presented, hereafter, together with the necessary thermodynamic framework to estimate the mixing temperature and concentration from the detected transient speed of sound data.
2.1 Introduction into laser-induced thermal acoustics
The LITA measurement technique is based on the non-linear interaction of matter with an optical interference pattern. This spatially periodic modulated polarisation/light intensity distribution is created by two short-pulsed laser beams with the same orientation of linear polarisation. By crossing these two beams, an optical grating is formed. The latter induces a spatially periodic modulated perturbation in density. Two different opto-acoustic effects are the cause of the density grating. In the case of a non-resonant process, i.e., no absorption cross-section of the investigated fluid/mixture, pure electrostriction is observed. For a resonant substance, an additional thermal grating is induced on top of the electrostrictive grating. It is important to emphasise that these perturbations in temperature are small ΔT ≪ 1 K [24]. The resulting spatially periodic perturbations in density within the probe volume are interrogated with a third input wave, which is scattered by these perturbations. The acousto-optic light scattering effects were classified by Eichler et al. [29] in different categories. Light scattering from a purely electrostrictive, non-resonant grating is referred to as stimulated Brillouin scattering. In the case of a resonant, thermal grating, stimulated (thermal) Rayleigh scattering is additionally observed. A comprehensive theoretical approach explaining the creation of the laser-induced grating together with the inherent thermon–photon and phonon–photon interaction is presented by Cummings et al. [21]. Additionally, a detailed review of the theoretical framework is discussed by Stampanoni-Panariello et al. [20].
The frequency of the detected LITA signal depends on the speed of sound of the probed fluid. The only parameter necessary to determine the speed of sound is the spacing of the optical grid Λ, which is a geometrical parameter of the optical arrangement. Hence, the speed of sound measurement is direct, and no equation of state or modelling assumptions are necessary. Moreover, since only the frequency of an intensity signal is evaluated, the analysis becomes independent from signal intensity. It is important to emphasise that thermometry can only be performed at a known gas composition and pressure, by applying a suitable model for the speed of sound. Hence, the probed temperature is only indirectly determined and depends on the chosen model for the fluid or the mixture under investigation. Following the theoretical considerations by Hemmerling and Kozlov [30], the speed of sound cs of a probed fluid can be estimated with
Here, the constant j is an indicator for resonant (j = 1) or non-resonant (j = 2) fluid behaviour at the wavelength of the excitation beam, and the beat frequency of the detected signal is indicated with
2.2 Thermodynamic framework for droplet temperature estimation
The local speed of sound of a probed mixture detected with the LITA technique cs,LITA depends on the ambient pressure pamb and the local temperature of the mixture Tmix. The mole fraction of a binary mixture is defined by X ∈ {X1, X2}, leading to the following dependency:
In well-controlled experiments, the ambient pressure pamb is a known quantity, which leaves local temperature and concentration to fully describe the mixing process. In the present work, the local speed of sound has been detected. Hence, an additional model to connect mixing temperature and concentration is necessary. The applicability of an advection controlled mixing assumption in a mixing process subsequent to an injection process, such as the mixing of fluid vapour in the wake of an evaporating droplet, is discussed in detail by Lamanna et al. [6, 11] and Gerber et al. [7]. In the following sections, this assumption is briefly introduced and validated.
2.2.1 Advection-controlled mixing
To relate the local mole fraction of a mixture with the local temperature, we consider the energy equation for a compressible flow of a Newtonian fluid with negligible bulk viscosity
with τ indicating the viscous stresses, h is the molar enthalpy, ρ(n) the molar density, u the velocity, p the pressure, and t the time. The diffusive flux of internal energy Je = Jq + Ji includes the energy flux Jq due to heat conduction (Fourier’s law), and the energy flux Ji due to mass diffusion resulting from a concentration gradient (Dufour effect). For isobaric conditions, the third term on the right side of Eq. 3 is removed. Moreover, in the case of advection-dominated processes, the diffusive fluxes Jq and Ji as well as the viscous stress τ can be neglected compared to convective terms. Finally, at short observation times, such as a nanosecond-duration laser pulse, the process can be considered to be quasi-steady. Hence, the temporal change in enthalpy
This equation inherently implies a conservation of energy within the observed volume and time. It is important to emphasise that the adiabatic assumption (∇ ⋅ Jq = 0) is only a necessary condition, but not sufficient. To derive Eq. 4, all previously discussed assumptions, namely, ∇ ⋅ Je = 0, (Dp)/(Dt) = 0, τ: ∇u = 0, and
The temperature of the mixture is indicated with Tmix, while the temperatures and mole fractions of the components are Ti and Xi, respectively. In their work on non-invasive, spatially resolved temperature and concentration measurements, Preusche et al. [28] applied the advection-controlled mixing assumption in Eq. 5 using the PC-SAFT equation of state to estimate the mixing temperature from a concentration-density field in the wake of the evaporation of a free-falling droplet in a near-critical atmosphere. The concentration-density data have been obtained using planar spontaneous Raman scattering, see Bork [27] for information on the measurement technique. As presented in detail by Preusche [31], the two-dimensional mole fraction distribution and the relative number density in the droplet wake were evaluated for the estimation of the mixing temperature. For this purpose, the mixture fraction correlated number density is translated into an equivalent temperature assuming advection-controlled mixing. As boundary conditions, the residual mixture fraction in the far field is set to the chambers’ ambient temperature and pressure. The initial temperature of the liquid is unknown and varied as a fitting parameter until the difference of the number density of the PC-SAFT fit and the experiment is minimised. It is important to emphasise that this liquid temperature is a non-physical value, as the actual experiment is in a non-equilibrium state due to the evaporation process. The result is a concentration–temperature field in the wake of the evaporating droplet that quantifies the mixing process. In the case of an acetone droplet with an initial fluid temperature of Td = 453 ± 1 K evaporating in a nitrogen atmosphere at a pressure of pamb = 6 ± 0.03 MPa with a temperature of Tamb = 513 ± 2 K, the resulting concentration–temperature data are depicted in Figure 1.
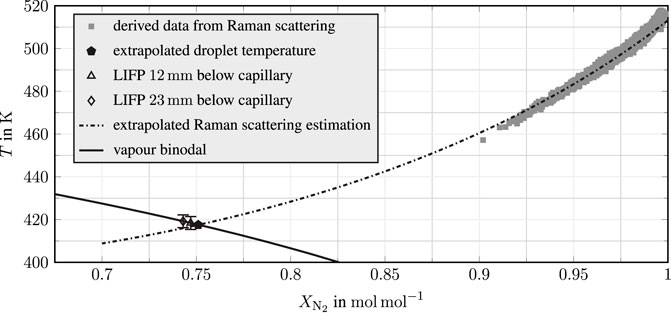
FIGURE 1. Concentration–temperature data in the wake of an acetone droplet evaporating in a nitrogen atmosphere. Squares: data derived from Raman scattering; pentagon: PC-SAFT and Raman-based extrapolated droplet temperature assuming advection-controlled mixing; triangle and diamond: droplet temperature measurements using LIFP; dash-dotted line: PC-SAFT-based curve fit to Raman scattering data; solid line: vapour binodal; experimental conditions: pamb = 6 MPa, Tamb = 513 K, Td = 453 K, and rd,t=1 s=0.7 mm. Reduced conditions: Tr,d = 0.89, Tr,amb = 1.01, and pr,amb = 1.28. LIFP and Raman scattering data are taken from Preusche [31].
The data derived from Raman scattering investigations are presented in Figure 1 as squares, while temperature extrapolation is shown by a dash-dotted line. This extrapolation is again computed using the PC-SAFT equation of state together with an advection-controlled mixing assumption. It is to be noted that this computation has been performed up to the vapour spinodal. The intersection (pentagon) of the extrapolation curve with the vapour binodal (solid line) is a Raman-based estimation of the temperature of the droplet. The deviation between the PC-SAFT fit and the Raman data at high nitrogen concentration for nearly ambient temperature conditions is caused by the advection controlled mixing assumption. The far field in Raman scattering measurements is not within the droplet’s wake, but at the right and left edge of the field of view. At this location, the mixing process is diffusion-dominated; hence, the advection-controlled mixing model does not describe the process leading to the observed deviation. The PC-SAFT-based extrapolated droplet temperature estimation of the Raman data has been validated by Preusche et al. [28] by independent laser-induced fluorescence and phosphorescence (LIFP) temperature measurements of the droplet itself. These measurements are depicted in Figure 1 for two different measurement positions as a triangle and a diamond. A more detailed view of the comparison of the Raman extrapolated droplet temperature (pentagon) and the LIFP droplet temperature at two different locations below the capillary (triangle and diamond) are depicted in Figure 2. For further verification of the advection-controlled mixing assumptions, the temporal evolution of droplet radius and temperature is analytically investigated with the evaporation model by Young [32] and presented in Figure 2 as solid lines. As the droplet is anchored at the capillary for most of the injection process, only natural convection effects are considered using the correlations by Pinheiro and Vedovoto [33]. The binary diffusion coefficient is computed with the model proposed by Wilke and Lee [34], and the effects of solubility of nitrogen into acetone are considered. Thermodynamic data are taken from the NIST database by Lemmon et al. [1]. A detailed assessment on the choice of the evaporation model can be found in the work of Lamanna et al. [6]. In the observed process, the total dwell time of the droplet prior to Raman and LIFP investigation is 1 s, while the falling time is only 100 ms. The comparison shows a good agreement of LIFP measurements with both Raman scattering-based extrapolated temperature and the evaporation model by Young [32]. Hence, the advection-controlled mixing assumption, used for computing the mixture temperature in the droplet wake during fall time, is valid for the mixing process observed here.
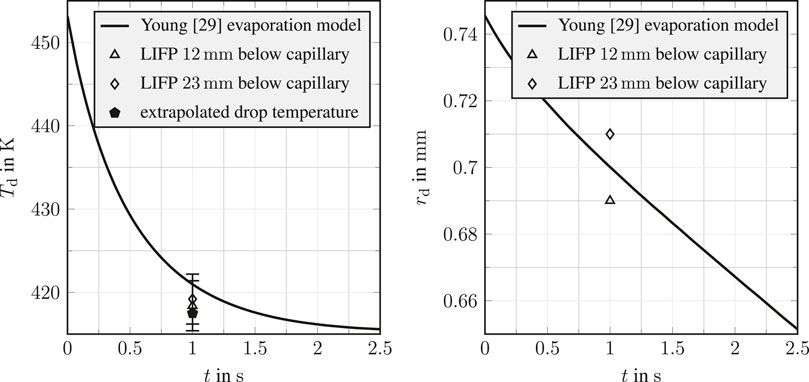
FIGURE 2. Temporal evolution of droplet temperature and size of a free-falling acetone droplet in a nitrogen atmosphere. Pentagon: PC-SAFT and Raman-based extrapolated droplet temperature assuming advection-controlled mixing; triangle/diamond: droplet temperature measurements using LIFP; solid line: analytical investigation with the model by Young [32]; experimental conditions: pamb = 6 MPa and Tamb = 513 K; test fluids: acetone in nitrogen; initial temperature: Td = 453 K; far-field acetone mole fraction: XAc,amb = 0.0051 mol mol−1; and droplet radius: rd,t=1 s = 0.7 mm. Reduced conditions: Tr,d = 0.89, Tr,amb = 1.01, and pr,amb = 1.28. LIFP and Raman scattering data are taken from Preusche [31].
2.2.2 Speed of sound from Helmholtz energy-based equations of state
Laser-induced thermal acoustics determines the isentropic speed of sound of the probed fluid or mixture. Together with the previously presented advection-controlled mixing assumption and the resulting concentration–temperature field in the droplet wake shown in Figure 1, mixing parameters can be estimated using the speed of sound data detected by LITA. As a result, the isentropic speed of sound has to be modelled for the considered mixture. The isentropic speed of sound is defined as
with the mass density ρ(m) and the specific entropy s. Using a Helmholtz energy equation of state where the residual contribution to the reduced Helmholtz energy
is modelled as a function of temperature T, volume V, and the amount of substance
with the molecular mass Mi, the universal gas constant
with the pressure calculated according to
The contribution of the intra-molecular degrees of freedom in the ideal gas state enters through the pure component isobaric molar heat capacities
2.2.3 PC-SAFT equation of state
In this work, we calculate the speed of sound for the mixture from a combination of parametrized correlation functions for the pure component isobaric molar heat capacities in the ideal gas state, namely,
with parameters A, B, C, and D, as well as a molecular-based equation of state for the residual reduced Helmholtz energy,
namely, hard-sphere
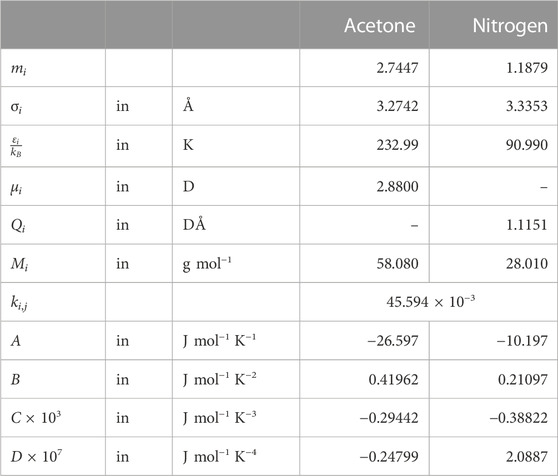
TABLE 1. PC-SAFT pure component and binary interaction parameters for acetone and nitrogen and the
2.2.4 Speed of sound in the droplet wake assuming advection-controlled mixing
The extrapolated advection-controlled mixing Raman scattering estimation (dashed–dotted line) in Figure 1 is evaluated by solving Eq. 8 with the presented PC-SAFT equation of state. Due to the constant pressure conditions of the experiment, this results in a unique function of the local speed of sound on species mole fraction and mixing temperature. Figure 3 shows this dependency of the local speed of sound on mixing temperature and species mole fraction in the wake of an acetone droplet evaporating in a nitrogen atmosphere, see Eq. 2, as a curve in the cs,mix-
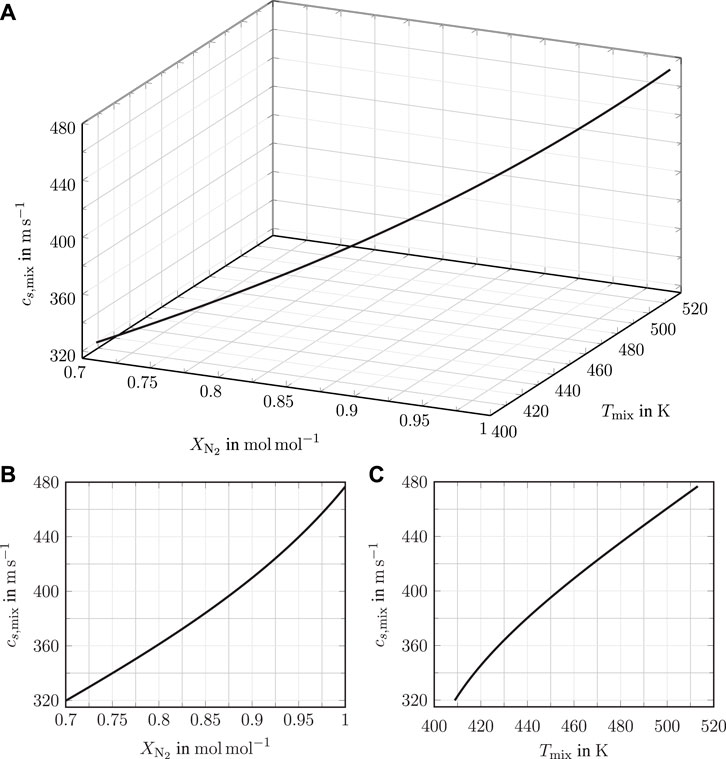
FIGURE 3. Local speed of sound dependency on mixing temperature and concentration in the wake of an acetone droplet evaporating in a nitrogen atmosphere. Speed of sound data are calculated along the extrapolated Raman scattering estimation shown in Figure 1, using the PC-SAFT equation of state. (A): a 3-dimensional curve in the cs,mix-
The nitrogen atmosphere has a pressure of pamb = 6 MPa with a temperature of Tamb = 513.15 K. Prior to the injection, the droplet fluid temperature is Td = 453.15 K. Together with the critical values of acetone (Tc = 508.1 K and pc = 4.7 MPa), that are taken from the NIST database by Lemmon et al. [1], this leads to the reduced operating conditions: Tr,d = Td/Tc = 0.89, Tr,amb = Tamb/Tc = 1.01, and pr,amb = pamb/pc = 1.28. It is to be noted that due to the advection-controlled mixing of acetone vapour with nitrogen, the speed of sound reduces for decreasing nitrogen concentration (increasing acetone concentration) and consequently decreasing mixing temperature. Hence, in the droplet wake speed of sound, data below the value of pure nitrogen at pamb = 6 MPa and Tamb = 513.15 K are expected.
3 Experimental facility and optical arrangements
Investigations on the time-resolved mixing behaviour in the wake of a free-falling droplet are performed in a temperature- and pressure-controlled chamber with a droplet-on-demand generator. The chamber has been designed for statistical investigations of evaporating droplets falling in a near-critical nitrogen atmosphere. To study the evaporation process, both qualitatively and quantitatively, two high-repetition-rate laser systems are employed. In the following section, both the experimental facility and optical arrangements are briefly described.
3.1 High-pressure high-temperature chamber
The high-pressure high-temperature chamber is designed for temperatures up to 773 K at pressures up to 8 MPa. A vertical section of the chamber with the mounted droplet generator is depicted together with a cutaway view in Figure 4. For optical access, eight ultra-violet transparent quartz windows (W) are placed at an angle of 90° to each other at two different heights. It should be noted that the present measurements are obtained in the upper part of the chamber. The exact location is shown in Figure 5. The pressure vessel is built from heat-resistant stainless steel (EN-1.4913) and encloses a cylindrical core 40 mm in diameter and 240 mm in length. The test rig is operated as a continuous flow reactor, with a constant gaseous and fluid mass flow. An annular orifice (A) with a width of 0.5 mm on the top and the bottom of the chamber is used to supply the atmospheric gas into and out of the measurement volume. These circumferential slits are designed to minimise the effect of the continuous inflow on the droplet generation and detachment process. Nitrogen with a purity of 99.999 % is used as the atmospheric gas. The nitrogen mass flow into the chamber is set by a heat capacity-based mass flow controller, while the pressure is controlled with a pneumatic valve at the system exhaust. The chamber temperature is regulated using PID controlled heating cartridges, which are vertically inserted into the chamber body. The temperature within the measurement volume is detected with resistance thermometers (T; PT100A) penetrating into the metal core at three different heights. The uncertainty of these resistance thermometer measurements is temperature-dependent and calculated for each condition according to DIN EN 60751:2009-05 [42]. The pressure is measured prior to the control valve at the chamber exhaust using a temperature-compensated pressure transducer with an uncertainty of ± 0.05 MPa. A detailed description of the test rig can be found in Steinhausen [25].
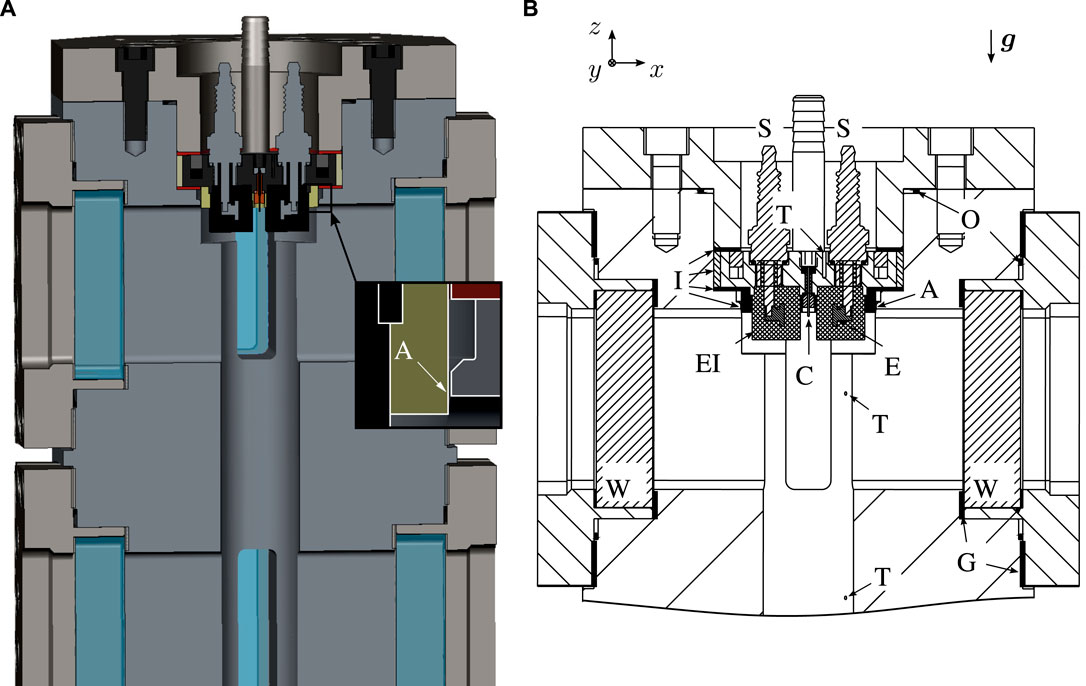
FIGURE 4. Vertical section of a mounted droplet generator. (A): Cutaway view of the chamber with a droplet generator. (B): vertical section through the chamber with a droplet generator. A: annular orifice; C: capillary; E: electrode; EI: electrical insulation; g: gravitational acceleration; G: graphite gaskets; I: thermal insulation; O: Willis Ring®; S: spark plug; T: resistance thermometer; W: UV-transparent quartz windows. Images are adapted from Steinhausen [25].
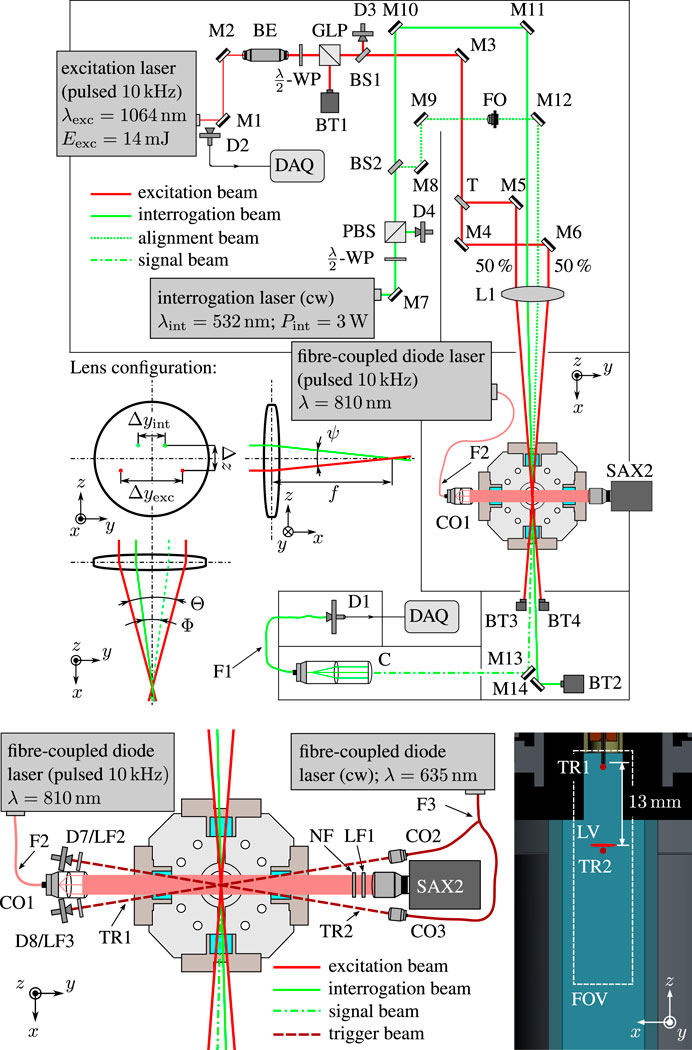
FIGURE 5. Optical setup of the high-speed LITA system with the shadowgraphy arrangement for flow visualisation and trigger configuration. BE: beam expander; BS: beam sampler; BT: beam trap; C: coupler; CO: collimator; D: detector (D1: avalanche detector; D2, D7, and D8: silicon detector; D3 and D4: thermal sensor); DAQ: data acquisition unit; F: single-mode fibre; FO: neutral density filter; FOV: field of view; LF1: laser-line filter (810 nm); LF2 and LF3: laser-line filter (635 nm); LV: LITA measurement volume; GLP: Glan–Laser polariser; L: lens; M: mirror; NF: Nd:YAG notch filter; PBS: polarised beam splitter; SAX2: high-speed camera (Photron FASTCAM SA-X2); T: beam splitter; TR: trigger beam.; WP: wave-plate. Images are adapted from Steinhausen [25].
On the top of the measurement chamber, an independently temperature-controlled droplet-on-demand generator is mounted. The latter is used for droplet generation and controlling the detachment frequency. Acetone with a purity of 99.9 % is used as the droplet fluid. Liquid acetone is stored at room temperature in a pressure vessel with edge welded bellows, which allows the pressurisation of the fluid without any physical contact between the fluid and the gas used for pressurisation. For droplet generation, the fluid is supplied through a grounded capillary into the chamber. The temperature of the supplied fluid is measured with a resistance thermometer (T; PT100A) in the metal core of the generator close to the capillary. As for the temperature measurements within the pressure chamber, the uncertainty is calculated for each condition according to DIN EN 60751:2009-05 [42]. It is important to emphasise that due to this measurement position and the dwell time of the droplet within the chamber prior to detachment, the fluid temperature of the droplet is only known in the temperature-controlled generator. The mass flow of the droplet fluid is set by a Coriolis-based mass flow controller. For droplet generation, the droplet is first anchored on the capillary, which has an outer and inner diameter of 700 μm and 200 μm, respectively. When the anchored droplet reaches the desired size, it is detached by initiating an electrical force between the fluid and a strong, pulsed electric field in direct vicinity of the droplet. This electric field is generated by two copper electrodes (E), which are screwed in the central electrode of spark plugs (S). The initial droplet size varies depending on the droplet liquid, the atmospheric gas, the operating conditions, and the position of the laser barrier. The range of diameters lies between 1 mm and 2 mm. A numerical study of the detachment principle and the underlying physics is presented by Ouedraogo et al. [43], while the reproducibility of the detachment concept at high pressure and temperature conditions has been proven by Weckenmann et al. [44] and Oldenhof et al. [45]. A detailed description of the droplet generator together with the fluid supply system can be found in Steinhausen [25].
3.2 Optical arrangements for laser-induced thermal acoustics and flow visualisation
In this work, two optical setups are employed to investigate the evaporation process of an evaporating acetone droplet in a near-critical nitrogen atmosphere. A high-speed LITA arrangement is applied to directly measure the speed of sound in the wake of the evaporating droplet, while a shadowgraphy setup in parallel light is used to visualise the evaporation process. In the latter, a fibre-coupled diode high-repetition laser, which is synchronised with the excitation laser of the LITA arrangement, is used for illumination. The optical setups are shown in Figure 5.
3.2.1 High-speed laser-induced thermal acoustics
Laser-induced thermal acoustics uses the interaction of matter with an optical interference pattern to directly measure the speed of sound of a fluid mixture. The optical interference pattern is created by two short-pulsed laser beams, called excitation beams. The latter are generated by a high-frequency pulsed Nd:YAG laser (Edgewave InnoSlab) with a wavelength of λexc = 1064 nm, an operating frequency of 10 kHz, a laser pulse length of 8.8 ns, a constant pulse energy of 14 mJ, and a linewidth of 53 GHz. The laser pulse energy is subsequently controlled by a λ/2-wave plate and a Glan–Laser polariser and set to 7 mJ for the present investigation. As stated earlier, the induced perturbation in temperature is ΔT ≪ 1 K [24]. The measurement is therefore considered non-intrusive. A third input wave from a DPSS laser (Coherent Verdi V6) with a continuous wave of λint = 532 nm, a laser power of 3 W, and a linewidth of 5 MHz is used to interrogate the resulting changes in optical properties of the investigated mixtures. As presented in the upper part of Figure 5, the excitation beam is split into two beams by a plate beam splitter (T). Afterwards, a delay line within the optical setup ensures an optical path length of the excitation beams with a difference of less than 1 mm. The two excitation beams are focused together with the interrogation beam into the measurement volume using an anti-reflective-coated lens (L). The generated spatially periodic perturbations in density scatter the interrogation beam. The beam alignment, shown in the middle part of Figure 5, is optimised to achieve Bragg’s diffraction and, hence, optimal signal intensity. The resulting signal beam is spectrally and spatially filtered by a laser-line filter, a coupler, and a single-mode fibre. For signal detection, an avalanche detector (Thorlabs APD110) is used. The resulting voltage signal is logged for 100 ms after triggering with 20 GS/s by a 2.5 GHz bandwidth digital oscilloscope (LeCroy WavePRO 254HD). This acquisition length together with the operating frequency of 10 kHz, leads to a transient detection of 1000 LITA signals for each investigated droplet, which are distinguished using the signal of the photo diode D2.
The measurement volume of the LITA setup is determined by the Gaussian half-width of the excitation beams in the focal point of the lens ωexc and by their crossing angle. In the present arrangement, the crossing angle is 2°. The dimensions of the beam in the focal point of the lens are calculated based on data sheet specifications, the alignment of the beam expander, and the focal length of the lens. The following dependency, given in Paschotta [46],
is used to estimate ωexc based on the size of the unfocused beam in front of the lens ω0, the excitation wavelength λexc, and the focal length of the lens f. For the determination of the size of the optical interference pattern, the relations presented by Schlamp et al. [24] have been applied. This leads to an ellipsoid-shaped optical interference pattern with a length in x-direction of 13.6 mm and an elliptical cross section of 80 μm in the z-direction and 246 μm in the y-direction. The elliptical cross-section of the interference pattern is a result of the elliptical beam profile of the used high-speed excitation laser source. Since only a portion of the optical grating is illuminated by the interrogation beam, it is important to emphasise that the spatial resolution in x-direction is higher than the optical interference pattern might indicate. Steinhausen [25] has performed a detailed assessment of the LITA measurement volume using tomographic beam visualisation. The results indicate a measurement volume with a length of less than 4 mm. Moreover, by measuring a gaseous jet with known width, Steinhausen [25] has circumscribed the effective length of the LITA setup to be less than 1.3 mm.
3.2.2 Shadowgraphy and trigger setup
For the visual observation of the evaporation and mixing processes, a shadowgraphy setup in parallel light, shown in the lower part of Figure 5, is used. The setup visualises changes in the density gradient or, to be more precise, the second derivative of the refractive index in the imaging plane, as described in detail by Settles [47]. The collimated light is generated using a fibre-coupled diode laser (Cavitar CAVILUX HF), with a wavelength of λ = 810 nm, an operating frequency of 10 kHz, and a pulse length of 30 ns. The resulting shadowgram is captured by a high-speed camera (SAX2; Photron FASTCAM SA-X2) equipped with a long-distance microscope (Infinity Photo-Optical K2 DistaMax). To prevent sensor damage, a spectral filtering with a laser-line filter (LF1; 810 nm) and a Nd:YAG notch filter (NF) is employed prior to image acquisition. The optical calibration with a distortion and a USAF 1951 high-resolution target yields a resolution of 36 μm/px, with a field of view (FOV) of approximately 37 mm × 9.5 mm. To achieve time synchronisation of the laser pulses of both the LITA and shadowgraphy setup, a light barrier (TR2) is positioned just below the location of the LITA measurement volume (LV). The light beam is created using a fibre-coupled diode laser, CW laser (Thorlabs S1FC635) with a wavelength of 635 nm, which is focused directly below the capillary. This light beam is then spectrally filtered and detected by a high-speed silicon detector (D7; Thorlabs DET100A/M). When the falling droplet crosses the barrier, LITA and shadowgraphy lasers are triggered. The delay time of the fibre-coupled diode laser and the high-speed camera is set to ensure synchronisation of both the LITA and shadowgraphy lasers within the exposure time of the camera.
4 Data processing
The simplest way to determine the speed of sound from a measured LITA signal is analysing the signals’ frequencies. The most common approach in engineering application to analyse frequencies in an effective manner are fast Fourier transformation algorithms. The latter allow a fast computation of the power spectral density Sxx of a discretised signal. The application of this obtained spectrum is two-fold. First, by analysing the detected frequencies, it is used for the derivation of fluid properties. Second, by analysing the shape of the spectrum, invalid signals can be found and filtered. The next section briefly describes the frequency analysis used for signal filtering and speed of sound evaluation. Moreover, the applied calibration procedure and uncertainty analysis are briefly presented. A detailed presentation of the applied frequency analysis together with a thorough uncertainty analysis can be found in the work of Steinhausen [25].
4.1 Frequency-based speed of sound estimation
As already discussed, the speed of sound of the measured fluid/mixture is related to the beat frequency Ω of the detected signal. The only parameter necessary to determine the speed of sound is the spacing of the optical grid Λ, which is a geometrical parameter calibrated in a pure species atmosphere with known pressure and temperature. Following the theoretical considerations by Hemmerling and Kozlov [30], the speed of sound cs of a probed fluid with resonant fluid behaviour is computed according to
4.2 Frequency analysis and signal filtering
The frequency analysis necessary for the speed of sound estimation of the discrete LITA signals is performed by applying the direct Fourier transformation (DFT) algorithm implemented in MATLAB R2018 [48]. To ensure a correct estimation of the frequency domain, it is necessary to apply a window function to counteract spectral leaking by weighting the data. Spectral leaking is caused by the assumption of periodicity over the number of sample points of the DFT and the necessary periodic extension of the signal, see Harris [49]. A violation of this assumption would lead to smearing of the initial single-frequency component over the neighbouring peaks, resulting in false predictions and erroneous speed of sound estimations [49]. Unfortunately, the inherent DFT assumption does not hold for an LITA signal, which is only periodic in its oscillation. Due to signal damping and the resulting discontinuities at the beginning and end of the observation interval, a truly periodic treatment without windowing is not possible.
The methodology used for the frequency analysis of a signal with resonant fluid behaviour is schematically presented in Figure 6. The time domain is shown as normalised signal intensity I/Imax over time t, while the frequency domain is presented as normalised power spectral density Sxx/Sxx,max over signal beat frequency Ω. A von Hann window, sometimes known as Hanning window, is used as a window function. The non-zero mean of the time-based signal results in a zero frequency in Sxx. The latter is, however, not relevant for the frequency analysis. A finite impulse response (FIR) filter (Oppenheim et al. [50]) in the frequency domain is used to filter out the zero-frequency component. Hence, only the two non-zero frequency components related to properties of the probed flow remain. These two frequencies stem from stimulated Brillouin and Rayleigh scattering caused by the resonant fluid response in the LITA technique with homodyne detection. The non-resonant, purely electrostrictive contribution is caused by stimulated Brillouin scattering. The signal beam is scattered by the induced acoustic waves, leading to a Stokes and an anti-Stokes shift of the scattered signal beam. The absolute value of each shift amounts to the Brillouin frequency. As both beams interfere, the resulting non-resonant beat frequency of the LITA signal
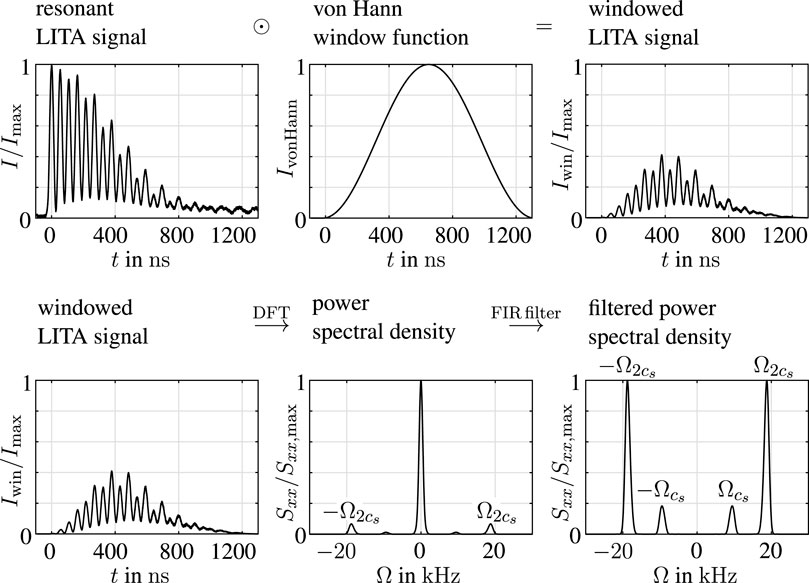
FIGURE 6. Methodology for frequency analysis of resonant laser-induced thermal acoustics signals. Image is adapted from Steinhausen [25].
Since a high signal quality is essential for a robust signal evaluation, the LITA signals are filtered in both the time and frequency domain in three steps. First, all detected signals with a signal intensity below 10% of the selected oscilloscope detection range are removed from evaluation. Second, all over-saturated signals are filtered out. Third, all remaining signals are analysed based on the valid shape of a resonant signal in the frequency domain (two distinct non-zero frequencies). It is important to emphasise that this hard filtering of the detected signals is necessary to ensure that only signals are evaluated which truly represent the investigated physical process. To be more precise, the distribution of all captured signals can be considered trimodal. The first two modes are non-physical signals, such as over-saturated signals that only contribute to the zero-frequency component and signals that only exhibit detector noise, leading to multiple high-frequency components. These invalid signals are the results of beam steering effects, which cause the signal beam to be refracted away from the sensor (sensor noise) or the interrogation beam to be refracted towards the sensor (over-saturated). The third mode includes the physically correct signals. These remaining signals are used to estimate the speed of sound data.
4.3 Calibration of the optical grid spacing and uncertainty analysis
The optical grid spacing Λ is calibrated using measurements in pure nitrogen prior to droplet injection at the operating conditions of the investigated evaporation process. Since nitrogen is non-resonant at the excitation wavelength, the LITA signal is purely electrostrictive, and Λ is characterised by Eq. 16.
Here, the excitation wavelength is denoted with λexc, whereas f is the focal length and Δyexc is the beam distance of the excitation beams in front of the lens. The beat frequency of the non-resonant LITA signal
The uncertainty analysis for the calibration, operating conditions, and results in the present work is performed according to the guide to the expression of uncertainty in measurement by the Joint Committee for Guides in Metrology [51]. Consequently, Gaussian error propagation is used for differentiable values. For non-differentiable dependencies, such as values computed with the PC-SAFT equation of state, uncertainties of input parameters are propagated using sequential perturbation, as presented by Moffat [52].
5 Transient near-critical evaporation results
The objective of the transient studies presented in this work is the quantitative investigation of an evaporation process in the vicinity of the critical point. The goal is to quantify mixture states, such as temperature, concentration, and speed of sound, in the wake of a free-falling droplet. The latter can be used for validation in numerical simulations. Time-resolved LITA measurements are performed in the wake of a free-falling acetone droplet evaporating in a nitrogen atmosphere. The latter has a pressure of 6 ± 0.05 MPa with a temperature of 513 ± 8 K. It is to be noted that the uncertainty in temperature takes the temperature distribution inside the whole measurement chamber into account. However, since the LITA measurement volume is located in close proximity to the upper temperature measurement position, the temperature distribution can be omitted, leading to a measurement uncertainty at the location of the LITA measurement volume of ± 1 K. The latter is the uncertainty of the resistant thermometer, which is calculated according to DIN EN 60751:2009-05 [42]. The droplet generator, depicted in Figure 4, and the liquid acetone flow are set to achieve a detachment frequency of 1 Hz. The acetone liquid is preheated to Td = 453 ± 1 K prior to detachment. With respect to the critical pressure and temperature of acetone (Tc = 508.1 K and pc = 4.7 MPa) taken from the NIST database by Lemmon et al. [1], the reduced operating conditions are Tr,d = 0.89, Tr,ch = 1.01, and pr,ch = 1.28. These operating conditions are selected for comparison with Raman scattering and LIFP investigations presented by Preusche et al. [28]. It is to be noted that preliminary results of these time-resolved investigations have been published as a feasibility study by Steinhausen et al. [14] and an evaluation of the evaporation process using the NIST database [1] has been presented by Steinhausen [25]. In this work, the PC-SAFT equation of state is employed for the calculation of the speed of sound. The results are then compared to the evaluation using the NIST database by Lemmon et al. [1] presented by Steinhausen [25].
Shadowgrams for the visualisation of the evaporation process are depicted in Figure 7 for eight different time steps. The position and size of the LITA measurement volume and the acquisition time synchronised with the LITA measurements are indicated. The droplet diameter is approximately 1.4 ± 0.1 mm. Unfortunately, the optical resolution of the shadowgraphy setup is not sufficient to detect any changes in droplet diameter resulting from the evaporation process. The ligaments at the side of the liquid droplet together with the different shades of grey in the wake indicate strong changes in density gradient and, hence, a strong evaporation process. It is to be noted that the droplet is considered to remain in the liquid state and the dark ligaments are a result of a dense gaseous fluid region. These statements agree with those of front-lighted shadowgraphy investigations presented by Steinhausen et al. [53] and Lamanna et al. [11]. At the position of the LITA measurement volume, strong, transient changes in density gradient are observed up to 7.5 ms. At later time steps, the shadowgrams indicate a stationary process. Transient LITA measurements are performed on 40 independent free-falling droplets, leading in theory to 40 signals for each time step and in total 40,000 LITA signals. However, due to strong beam steering effects, less than 10% of the captured signals are valid as they are falling into the third mode of the previously discussed trimodal distribution. As discussed in the previous section, the excluded signals consist of over-saturated signals and signals with solely sensor noise. Both are non-physical and do not show an LITA signal. Hence, despite the low number of evaluated signals, the evaluation process and the present results are not biased. Two of the valid signals are presented in Figure 8. Both signals experience a resonant fluid behaviour, which is most likely a result of residual moisture in the acetone supply line. Since water has an absorption cross-section at the excitation wavelength of the LITA setup, even small amounts would cause a resonant fluid response. This behaviour has previously been observed by Cummings [54] and Steinhausen et al. [26] in carbon dioxide with residual moisture. A strong thermal contribution at an earlier time step, shown in the left image of Figure 8, is indicated by the dominating Brillouin frequency, while at the later time step on the right, an oscillation of twice the Brillouin frequency is observed. This behaviour is caused by the higher acetone concentration and therefore a larger intake of moisture in the wake in close vicinity of the droplet. The higher acetone concentration is, unfortunately, also responsible for stronger beam steering effects, leading to a reduced number of valid signals at early time steps in close proximity to the droplet.
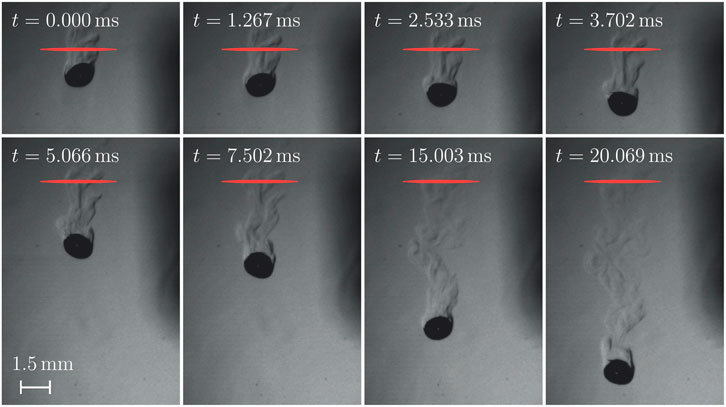
FIGURE 7. Shadowgrams of eight time steps of a free-falling acetone droplet evaporating in a nitrogen atmosphere. LITA measurement volume is indicated in red. The time stamp on the left upper corner is synchronised with the LITA measurements. Droplet radius: rd = 0.7 mm; Experimental conditions:
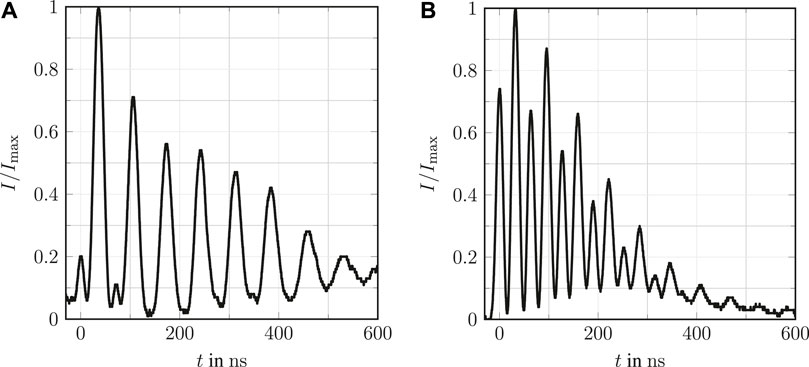
FIGURE 8. LITA signals obtained at two time steps in the wake of an acetone droplet evaporating in a nitrogen atmosphere. Reduced operating conditions: Tr,d = 0.89, Tr,ch = 1.01, and pr,ch = 1.28. (A) Single-shot LITA signal detected at t = 0.974 ms. (B) Averaged LITA signal detected at t = 9.840 ms. Data have been presented by Steinhausen [25].
5.1 Time-resolved speed of sound data
Transient speed of sound data are calculated from the detected LITA signals with Eq. 15. The beat frequency Ω is extracted by the frequency analysis shown in Figure 6. As discussed previously, the grid spacing Λ is calibrated using LITA measurements in nitrogen at operating conditions prior to the droplet investigations. As shown in Figure 3, the speed of sound of the mixture in the droplet wake cannot exceed the value of pure nitrogen. This condition is implemented as a fourth step to the filter methodology to exclude outliers with speed of sounds higher as the value of nitrogen at operating conditions.
The transient speed of sound data cs,DFT measured in the droplet wake over time t are depicted in Figure 9. The speed of sound for pure nitrogen is displayed as a dash-dotted line, while a fit using a power law of the experimental values is presented as a solid line. Measurement uncertainties are shown as error bars with a confidence interval of 68%. Measurements at early time steps show significantly lower speed of sound values as the speed of sound of pure nitrogen at operating conditions. The speed of sound data then increase asymptotically with time until approximately 7.5 ms. After this, a constant value slightly below the speed of sound of pure nitrogen is reached. The visual inspection of the shadowgrams in Figure 7, which indicate a transient behaviour until 7.5 ms, supports the speed of sound data. The observed temporal shape of the detected speed of sound data can be explained by two physical effects. As shown in Eq. 8, the speed of sound of the mixture depends on both the temperature and the concentration of the probed fluid mixture. Predictions with the PC-SAFT equation of state for the increasing acetone concentration at constant temperature show decreasing speed of sound values. Moreover, the speed of sound is proportional to the square root of the temperature. Lower temperatures in the droplet wake caused by the evaporative cooling of the droplet therefore lead to a decrease in speed of sound data. These effects are supported by the observations made under similar conditions by Bork et al. [13] and Preusche et al. [28]. An advection-controlled mixing process experiences a faster transition to a quasi-steady regime as a diffusive process. Therefore, the step increase in speed of sound, which reaches a quasi-steady regime in approximately 7.5 ms, is an additional indicator for the validity of the advection-controlled mixing assumption in the droplet wake.
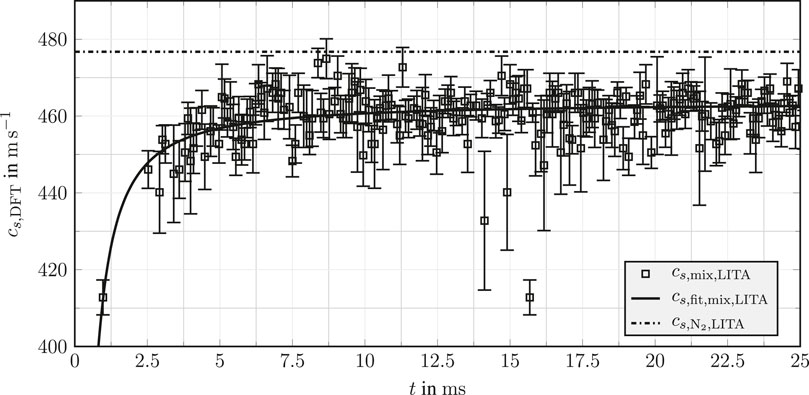
FIGURE 9. Transient speed of sound data in the wake of an evaporating acetone droplet in a nitrogen atmosphere over time t. Speed of sound data are calculated using the presented frequency analysis. Uncertainties are displayed using a 68% confidence interval. Reduced operating conditions: Tr,d = 0.89, Tr,ch = 1.01, and pr,ch = 1.28.
5.2 Local mixing parameters in the droplet wake
Non-isothermal isobaric processes, such as droplet evaporation, do not present a direct relation of mixing temperature, concentration, and speed of sound. As previously discussed and presented in Eq. 8, the speed of sound depends on both temperature and concentration. Hence, an additional relation for temperature and concentration is necessary for the calculation of mixture states based on LITA-detected speed of sound data. Since the mixing process in the droplet wake is isobaric and advection-controlled, the application of an advection-controlled mixing assumption within the small LITA measurement volume is applicable. A conservation of mass and energy within the probe volume for the duration of the laser pulse is inherently assumed. This assumption is justified due to the short laser pulse of τ = 8.8 ns and the effective LITA probe volume of 0.1 mm3. Hence, an advection-controlled mixing assumption is applied to the detected, transient speed of sound data shown in Figure 9. The used model is based on the Raman scattering investigations on an evaporating acetone droplet under similar conditions presented by Preusche et al. [28]. As discussed previously, Raman scattering provides experimental data on the number density and the acetone mole fraction in the wake of the droplet. By applying an advection-controlled mixing assumption together with the PC-SAFT equation of state, the temperature–concentration relation presented in Figure 1 is estimated. The resulting curve is subsequently used to compute the speed of sound by Eq. 8, leading to the relation presented in Figure 3.
Figure 10 depicts the resulting temporal evolution of the local mole fraction of nitrogen
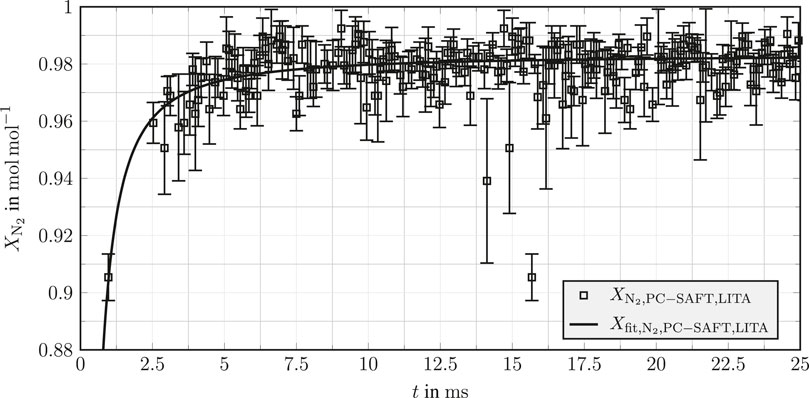
FIGURE 10. Local mole fraction of nitrogen
Last, the temporal evolution of the local temperature of the mixture Tmix over time t within the LITA measurement volume is shown in Figure 11. Again, a power law fit is used to compute a curve fit for the local temperature, which is displayed as a solid line. Moreover, the temperature of the droplet measured with LIFP Td,LIFP by Preusche [31] under the same operating conditions is shown as a dashed line, while the ambient temperature
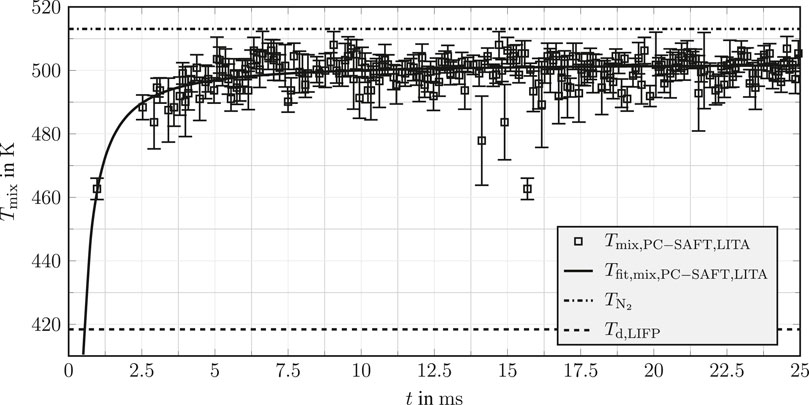
FIGURE 11. Local mixing temperature Tmix over time t estimated in the wake of an evaporating acetone droplet in a nitrogen atmosphere. Tmix is estimated using cs,DFT assuming advection-controlled mixing together with the PC-SAFT-based curve fit Raman scattering results in Figure 1. Speed of sound data are calculated using PC-SAFT equation of state, see Figure 3. Uncertainties are displayed using a 68% confidence interval. Reduced operating conditions: Tr,d = 0.89, Tr,ch = 1.01, and pr,ch = 1.28.
Figure 12 displays the comparison of the fitted local mixing temperature Tmix and the local mole fraction of nitrogen
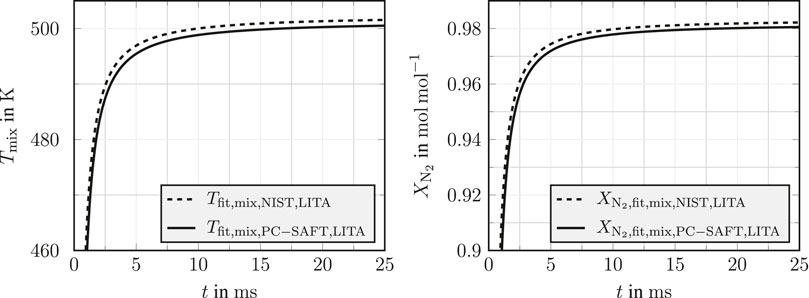
FIGURE 12. Comparison of the local mixing temperature Tmix and the local mole fraction of nitrogen
6 Conclusion and outlook
In the present work, the mixing process in the wake of a free-falling acetone droplet, evaporating in a supercritical nitrogen atmosphere, has been investigated by applying transient laser-induced thermal acoustics. The detected, time-resolved speed of sound data have been evaluated assuming advection-controlled mixing. The latter is applicable due to the advection-controlled nature of the observed mixing process. The time-resolved investigations lead to four main outcomes. First, the results prove the feasibility of quantitative transient investigations of the mixing processes by applying laser-induced thermal acoustics. Second, the evaluation using the NIST database [1] for computation of speed of sound data presented by Steinhausen [25] supports the PC-SAFT-based modelling of the speed of sound and vice versa. Third, the observed step slope in the transient speed of sound data is a strong indicator that the mixing process in the droplet wake is advection-controlled. This complementary observation is, together with the LIFP measurements, a strong validation of the assumption of an advection-controlled mixing process. Fourth, the temporal evolution of the obtained local mixing temperatures and mole fractions indicates that the mixing process of acetone vapour and nitrogen in the wake of the droplet remains subcritical in close proximity to the droplet. These findings are in agreement with the experimental observations of Crua et al. [5] for single-droplet evaporation in a supercritical atmosphere. The authors also found that for reduced ambient pressure and temperature slightly above 1, classical evaporation remains the controlling mechanism for mixture formation. Consequently, the entire process must occur at subcritical conditions in the proximity of the droplet interface since vapour partial pressures above the critical pressure would lead to condensation. A more detailed analysis on the role of evaporation with increasing reduced ambient pressure and temperature conditions is currently in progress, based on the predictions of the evaporation model by Young [32]. Moreover, further investigations at higher temperature and pressure conditions are envisaged to assess the mixing and evaporation process in a more general context.
Data availability statement
The presented transient datasets supporting the conclusion of this article will be made available by the authors, without undue reservation.
Author contributions
The manuscript has been prepared by CS and RS (2.2.2 and 2.2.3). Transient LITA and shadowgraphy measurements have been performed by CS and VG. Evaluation of LITA and shadowgraphy data has been performed by CS. The Raman scattering and LIFP measurements have been performed and evaluated by AP. Thermodynamic data computed with the PC-SAFT equation of state have been provided by RS. The overall research project has been conceived, planned, and managed by GL, AD, JG, and BW. All authors contributed to the article and approved the submitted version.
Funding
The authors gratefully acknowledge the financial support provided by the Deutsche Forschungsgemeinschaft (DFG, German Research Foundation)—Project SFB–TRR 75, project number 84292822 as well as Project EXC2075, project number 390740016 under Germany’s Excellence Strategy. Moreover, the PC-SAFT calculation in this paper is funded by dtec.bw—Digitalization and Technology Research Center of the Bundeswehr, which are gratefully acknowledged. dtec.bw is funded by the European Union—NextGenerationEU. The open-access publication is funded by the German Research Foundation (DFG) grant “Open Access Publication Funding/2023–2024/University of Stuttgart” (512689491).
Acknowledgments
The authors gratefully acknowledge the financial support provided by the Deutsche Forschungsgemeinschaft (DFG, German Research Foundation)—Project SFB-TRR 75, project number 84292822 as well as Project EXC2075, project number 390740016 under Germany’s Excellence Strategy. Moreover, the PC-SAFT calculation in this paper is funded by dtec.bw—Digitalization and Technology Research Center of the Bundeswehr, which are gratefully acknowledged. dtec.bw is funded by the European Union—NextGenerationEU. The open access publication is funded by the German Research Foundation (DFG) grant “Open Access Publication Funding/2023–2024/University of Stuttgart” (512689491). The authors also acknowledge the support by the Stuttgart Center for Simulation Science (SimTech).
Conflict of interest
The authors declare that the research was conducted in the absence of any commercial or financial relationships that could be construed as a potential conflict of interest.
Publisher’s note
All claims expressed in this article are solely those of the authors and do not necessarily represent those of their affiliated organizations, or those of the publisher, the editors, and the reviewers. Any product that may be evaluated in this article, or claim that may be made by its manufacturer, is not guaranteed or endorsed by the publisher.
References
1. Lemmon EW, Bell IH, Huber ML, McLinden MO. NIST standard reference database 23: Reference fluid thermodynamic and transport properties-REFPROP, version 10.0. National Institute of Standards and Technology (2018). [Dataset]. doi:10.18434/T4JS3C
2. Falgout Z, Rahm M, Sedarsky D, Linne M. Gas/fuel jet interfaces under high pressures and temperatures. Fuel (2016) 168:14–21. doi:10.1016/j.fuel.2015.11.061
3. Müller H, Niedermeier CA, Matheis J, Pfitzner M, Hickel S. Large-eddy simulation of nitrogen injection at trans- and supercritical conditions. Phys Fluids (2016) 28:015102. doi:10.1063/1.4937948
4. Baab S, Förster FJ, Lamanna G, Weigand B. Speed of sound measurements and mixing characterization of underexpanded fuel jets with supercritical reservoir condition using laser-induced thermal acoustics. Exp. Fluids (2016) 57:172. doi:10.1007/s00348-016-2252-3
5. Crua C, Manin J, Pickett LM. On the transcritical mixing of fuels at diesel engine conditions. Fuel (2017) 208:535–48. doi:10.1016/j.fuel.2017.06.091
6. Lamanna G, Steinhausen C, Weigand B, Preusche A, Bork B, Dreizler A, et al. On the importance of non-equilibrium models for describing the coupling of heat and mass transfer at high pressure. Int Commun Heat Mass Transfer (2018) 98:49–58. doi:10.1016/j.icheatmasstransfer.2018.07.012
7. Gerber V, Baab S, Förster FJ, Mandler H, Weigand B, Lamanna G. Fluid injection with supercritical reservoir conditions: Overview on morphology and mixing. J Supercrit Fluids (2021) 169:105097. doi:10.1016/j.supflu.2020.105097
8. Dahms RN, Oefelein JC. On the transition between two-phase and single-phase interface dynamics in multicomponent fluids at supercritical pressures. Phys Fluids (2013) 25:092103. doi:10.1063/1.4820346
9. Qiu L, Reitz RD. An investigation of thermodynamic states during high-pressure fuel injection using equilibrium thermodynamics. Int J Multiphase Flow (2015) 72:24–38. doi:10.1016/j.ijmultiphaseflow.2015.01.011
10. Banuti DT. Crossing the Widom-line – supercritical pseudo-boiling. J Supercrit Fluids (2015) 98:12–6. doi:10.1016/j.supflu.2014.12.019
11. Lamanna G, Steinhausen C, Weckenmann F, Weigand B, Bork B, Preusche A, et al. Laboratory experiments of high-pressure fluid drops: Chapter 2. In: High-pressure flows for propulsion applications. American Institute of Aeronautics and Astronautics (Hg.) (2020). p. 49–109. doi:10.2514/5.9781624105814.0049.0110
12. Qiao L, Jain S, Mo G. Molecular simulations to research supercritical fuel properties: Chapter 10. In: High-pressure flows for propulsion applications. American Institute of Aeronautics and Astronautics (Hg.) (2020). p. 409–60. doi:10.2514/5.9781624105814.0409.0460
13. Bork B, Preusche A, Weckenmann F, Lamanna G, Dreizler A. Measurement of species concentration and estimation of temperature in the wake of evaporating n-heptane droplets at trans-critical conditions. Proc Combust Inst (2017) 36:2433–40. doi:10.1016/j.proci.2016.07.037
14. Steinhausen C, Gerber V, Preusche A, Dreizler A, Weigand B, Lamanna G. Feasibility analysis on transient speed of sound investigations using laser–induced thermal acoustics in evaporating droplets. In: Proceedings of the 20th International Symposium on Application of Laser and Imaging Techniques to Fluid Mechanics; 11-14 July 2022; Lisbon, Portugal (2022).
15. Cummings EB. Laser-induced thermal acoustics: Simple accurate gas measurements. Opt Lett (1994) 19:1361–3. doi:10.1364/OL.19.001361
16. Kimura Y, Kanda D, Terazima M, Hirota N. Application of the transient grating method to the measurement of transport properties for high pressure fluids. Phys Chem Chem Phys (1995) 99:196–203. doi:10.1002/bbpc.19950990214
17. Stampanoni-Panariello A, Kozlov DN, Radi PP, Hemmerling B. Gas-phase diagnostics by laser-induced gratings II. Experiments. Appl Phys B (2005) 81:113–29. doi:10.1007/s00340-005-1853-y
18. Willman C, Le Page LM, Ewart P, Williams BAO. Pressure measurement in gas flows using laser-induced grating lifetime. Appl Opt (2021) 60:C131–C141. doi:10.1364/AO.419973
19. Förster FJ, Crua C, Davy M, Ewart P. Time-resolved gas thermometry by laser-induced grating spectroscopy with a high-repetition rate laser system. Exp. Fluids (2017) 58:87–8. doi:10.1007/s00348-017-2370-6
20. Stampanoni-Panariello A, Kozlov DN, Radi PP, Hemmerling B. Gas phase diagnostics by laser-induced gratings I. Theory. Appl Phys B (2005) 81:101–11. doi:10.1007/s00340-005-1852-z
21. Cummings EB, Leyva IA, Hornung HG. Laser-induced thermal acoustics (LITA) signals from finite beams. Appl Opt (1995) 34:3290–302. doi:10.1364/AO.34.003290
22. Baab S, Steinhausen C, Lamanna G, Weigand B, Förster FJ. A quantitative speed of sound database for multi-component jet mixing at high pressure. Fuel (2018) 233:918–25. doi:10.1016/j.fuel.2017.12.080
23. Förster FJ, Baab S, Steinhausen C, Lamanna G, Ewart P, Weigand B. Mixing characterization of highly underexpanded fluid jets with real gas expansion. Exp. Fluids (2018) 59:44. doi:10.1007/s00348-018-2488-1
24. Schlamp S, Cummings EB, Hornung HG. Beam misalignments and fluid velocities in laser-induced thermal acoustics. Appl Opt (1999) 38:5724–33. doi:10.1364/AO.38.005724
25. Steinhausen C. Investigation of macroscopic nearcritical fluid phenomena by applying laser–induced thermal acoustics. Ph.D.-Thesis. 1 edn. München: Verlag Dr. Hut (2023). Thermodynamik.
26. Steinhausen C, Gerber V, Preusche A, Weigand B, Dreizler A, Lamanna G. On the potential and challenges of laser-induced thermal acoustics for experimental investigation of macroscopic fluid phenomena. Exp Fluids (2021) 62:2. doi:10.1007/s00348-020-03088-1
27. Bork B. Tropfenverdampfung in transkritischer Umgebung: Untersuchung mit laserspektroskopischen Methoden. Ph.D.-Thesis. Darmstadt: Technical University of Darmstadt (2017).
28. Preusche A, Dreizler A, Steinhausen C, Lamanna G, Stierle R. Non-invasive, spatially averaged temperature measurements of falling acetone droplets in nitrogen atmosphere at elevated pressures and temperatures. J Supercrit Fluids (2020) 166:105025. doi:10.1016/j.supflu.2020.105025
29. Eichler HJ, Günter P, Pohl DW. Laser induced dynamic gratings. In: Springer series in optical Sciences, 50. Berlin and Heidelberg and New York: Springer-Verlag (1986).
30. Hemmerling B, Kozlov DN. Generation and temporally resolved detection of laser-induced gratings by a single, pulsed Nd:YAG laser. Appl Opt (1999) 38:1001. doi:10.1364/AO.38.001001
31. Preusche A. Non-invasive thermometry and wake mixture fraction determination of evaporating droplets at elevated pressures using laser spectroscopy. Ph.D.-Thesis. Darmstadt: Technical University of Darmstadt (2021).
32. Young JB. The condensation and evaporation of liquid droplets at arbitrary Knudsen number in the presence of an inert gas. Int J Heat Mass Transfer (1993) 36:2941–56. doi:10.1016/0017-9310(93)90112-j
33. Pinheiro AP, Vedovoto JM. Evaluation of droplet evaporation models and the incorporation of natural convection effects. Flow, Turbulence Combust (2019) 102:537–58. doi:10.1007/s10494-018-9973-8
34. Wilke CR, Lee CY. Estimation of diffusion coefficients for gases and vapors. Ind Eng Chem (1955) 47:1253–7. doi:10.1021/ie50546a056
35. Michelsen ML, Mollerup J. Thermodynamic modelling: Fundamentals and computational aspects. 2nd ed. Tie-Line Publications (2004).
36. Gross J, Sadowski G. Perturbed-chain saft: An equation of state based on a perturbation theory for chain molecules. Ind Eng Chem Res (2001) 40:1244–60. doi:10.1021/ie0003887
37. Gross J. An equation-of-state contribution for polar components: Quadrupolar molecules. AIChE J (2005) 51:2556–68. doi:10.1002/aic.10502
38. Gross J, Vrabec J. An equation-of-state contribution for polar components: Dipolar molecules. AIChE J (2006) 52:1194–204. doi:10.1002/aic.10683
39. Vrabec J, Gross J. Vapor–liquid equilibria simulation and an equation of state contribution for dipole–quadrupole interactions. The J Phys Chem B (2008) 112:51–60. doi:10.1021/jp072619u
40. Rehner P, Bauer G, Gross J. Feos - an open-source framework for equations of state and classical density functional theory. Ind Eng Chem Res (2023) 62:5347–57. (accepted for publication). doi:10.1021/acs.iecr.2c04561
41. Rehner P, Bauer G. Application of generalized (hyper-) dual numbers in equation of state modeling. Front Chem Eng (2021) 3. doi:10.3389/fceng.2021.758090
42.DIN EN 60751:2009-05. Industrial platinum resistance thermometers and platinum temperature sensors (IEC 60751:2008). German version EN 60751:2008 (2009-05). [Dataset].
43. Ouedraogo Y, Gjonaj E, Weiland T, de Gersem H, Steinhausen C, Lamanna G, et al. Electrohydrodynamic simulation of electrically controlled droplet generation. Int J Heat Fluid Flow (2017) 64:120–8. doi:10.1016/j.ijheatfluidflow.2017.02.007
44. Weckenmann F, Bork B, Oldenhof E, Lamanna G, Weigand B, Böhm B, et al. Single acetone droplets at supercritical pressure: Droplet generation and characterization of PLIFP. Z für Physikalische Chem (2011) 225:1417–31. doi:10.1524/zpch.2011.0188
45. Oldenhof E, Weckenmann F, Lamanna G, Weigand B, Bork B, Dreizler A. Experimental investigation of isolated acetone droplets at ambient and near-critical conditions, injected in a nitrogen atmosphere. In: Progress in propulsion physics, 4. St. Petersburg, Russian (2013). p. 257–70. 4-8 July 2011. doi:10.1051/eucass/201304257
47. Settles GS. Schlieren and shadowgraph techniques: Visualizing phenomena in transparent media. Berlin and Heidelberg and New York: Springer-Verlag (2001). Engineering online library.
49. Harris FJ. On the use of windows for harmonic analysis with the discrete Fourier transform. Proc IEEE (1978) 66:51–83. doi:10.1109/PROC.1978.10837
50. Oppenheim AV, Schafer RW, Buck JR. Discrete-time signal processing. 2nd. edn. Upper Saddle River: Prentice-Hall (1999).
51.Joint Committee for Guides in Metrology. Evaluation of measurement data - guide to the expression of uncertainty in measurement: GUM 1995 with minor corrections (2008). (JCGM 100:2008).
52. Moffat RJ. Describing the uncertainties in experimental results. Exp Therm Fluid Sci (1988) 1:3–17. doi:10.1016/0894-1777(88)90043-X
53. Steinhausen C, Lamanna G, Weigand B, Stierle R, Gross J, Preusche A, et al. Experimental investigation of droplet injections in the vicinity of the critical point: A comparison of different model approaches. In: Proceedings ILASS–Europe 2017. 28th Conference on Liquid Atomization and Spray Systems; 6-8 September 2017; Valencia, Spain (2017). doi:10.4995/ILASS2017.2017.4635
54. Cummings EB. Laser-induced thermal acoustics. Ph.D.-Thesis. Pasadena: California Institute of Technology (1995).
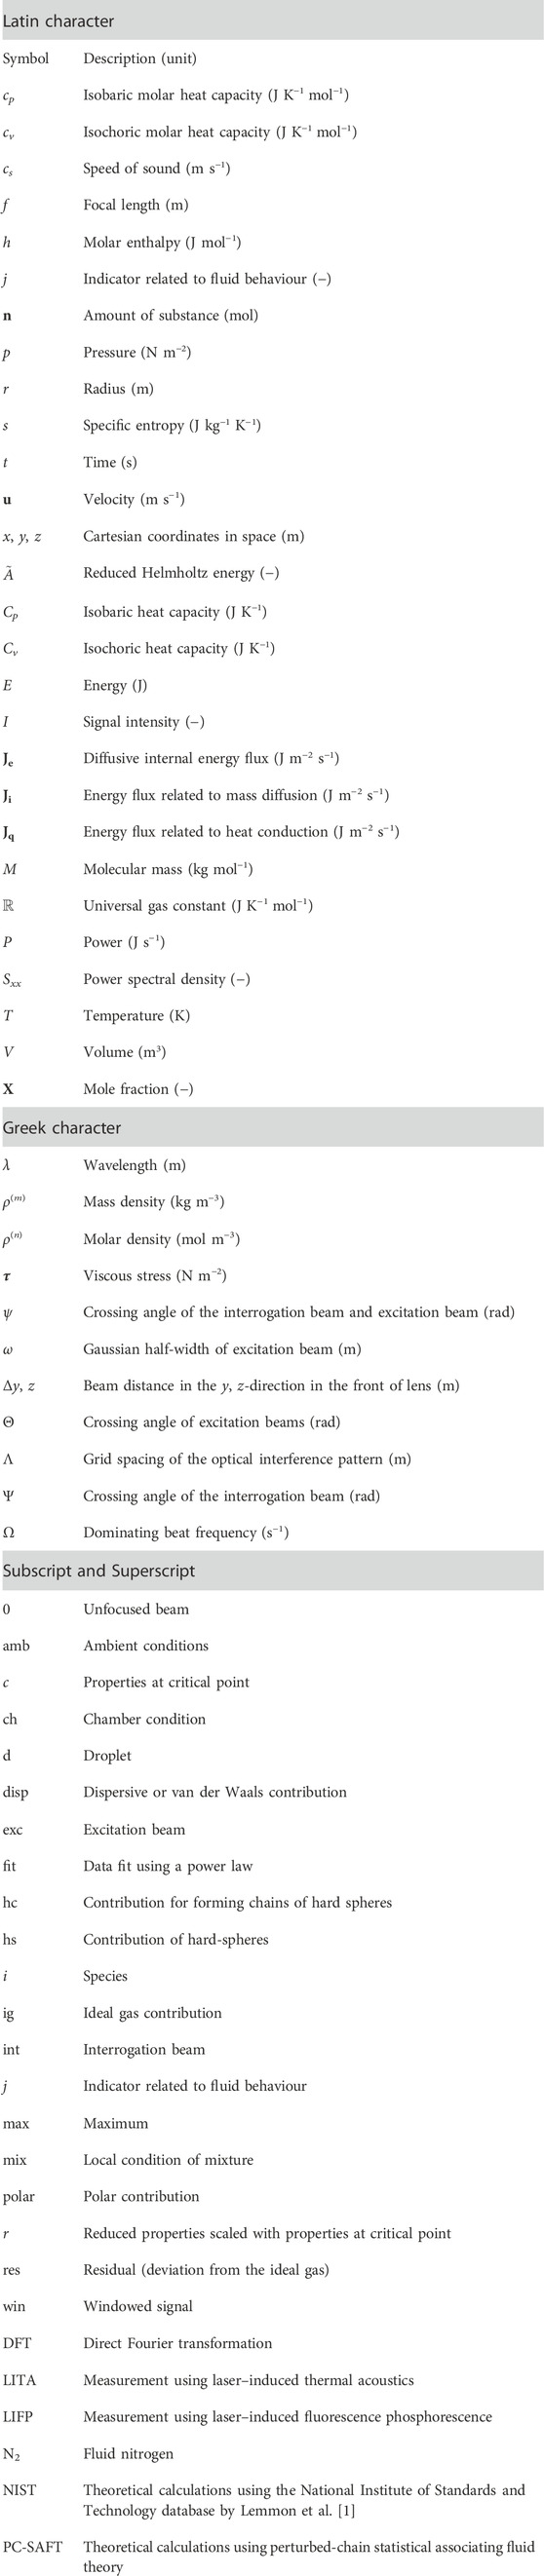
Nomenclature
Keywords: LITA, LIGS, advection-controlled mixing, evaporation, near-critical
Citation: Steinhausen C, Gerber V, Stierle R, Preusche A, Dreizler A, Gross J, Weigand B and Lamanna G (2023) Characterisation of the transient mixing behaviour of evaporating near-critical droplets. Front. Phys. 11:1192416. doi: 10.3389/fphy.2023.1192416
Received: 23 March 2023; Accepted: 07 July 2023;
Published: 28 July 2023.
Edited by:
Günter Brenn, Graz University of Technology, AustriaReviewed by:
Sean O'Byrne, University of New South Wales Canberra, AustraliaDonato Fontanarosa, KU Leuven, Belgium
Copyright © 2023 Steinhausen, Gerber, Stierle, Preusche, Dreizler, Gross, Weigand and Lamanna. This is an open-access article distributed under the terms of the Creative Commons Attribution License (CC BY). The use, distribution or reproduction in other forums is permitted, provided the original author(s) and the copyright owner(s) are credited and that the original publication in this journal is cited, in accordance with accepted academic practice. No use, distribution or reproduction is permitted which does not comply with these terms.
*Correspondence: Christoph Steinhausen, Y2hyaXN0b3BoLnN0ZWluaGF1c2VuQGl0bHIudW5pLXN0dXR0Z2FydC5kZQ==