 S.-J. Klose
 L. Krös
 J. H. van Helden
- Leibniz Institute for Plasma Science and Technology (INP), Greifswald, Germany
Although the research on cold atmospheric pressure plasma jets and their applications is steadily growing, several questions remain open regarding fundamental aspects of how reactive species, such as hydrogen peroxide (H2O2), are generated in cold atmospheric pressure plasma jets, and how the composition of reactive species can be tailored for a specific purpose. Accordingly, absolute and spatially resolved distributions of the densities of reactive species in the effluent of cold atmospheric pressure plasma jets are required. In this work, a time efficient way to determine the local distribution of gas phase H2O2 in the effluent of a cold atmospheric-pressure plasma jet using continuous-wave cavity ring-down spectroscopy at a wavelength of 8.12 μm is presented. By a combination of an axial scan and of several radial distributions, the localised density distribution of H2O2 in the effluent of the kINPen-sci plasma jet was obtained. Therefore, the effective absorption length was determined from the evolution of the radial distributions as a function of the distance from the nozzle, which was 1.6 mm close to the nozzle of the plasma jet, and increased to approximately 5 mm at a distance of 10 mm from the nozzle. The maximum density of approximately 2 ⋅ 1014 cm−3 was found in the centre of the effluent close to the nozzle. From the presented localised density distribution, it can be concluded that H2O2 is significantly generated within the plasma zone of the plasma jet. This work presents an important step towards the understanding of formation and consumption mechanisms of biomedically relevant species in the plasma zone and the effluent of a cold atmospheric pressure plasma jet.
1 Introduction
With the rising number of applications for cold atmospheric pressure plasma jets (CAPJs), the demand of sophisticated diagnostic techniques also increases. A challenge for the diagnostics of CAPJs is the small diameter over which reactive species are distributed [1-5]. Most of the standard diagnostic techniques are well established for low pressure plasmas in large chambers and have to be strongly modified to be used for CAPJs [6]. This is cumbersome, since it requires the entire adaptation of the measurements methodology and data analysis. Moreover, some of the species are often present only in trace amounts, although they are important for the application. Hence, a high sensitivity for the detection of species is required, which can be obtained, for instance, by the employment of optical cavities [7-11].
One of the key species for biomedical applications is hydrogen peroxide (H2O2), as it has been proven to be beneficial for both, cell growth and cell death [12-18]. As a signalling agent, H2O2 is involved in several reactions occurring in cells and leads at high concentration also to cell inhibition [19-22]. With the development of cold atmospheric pressure plasma jets (CAPJs), a non-thermal plasma source for several reactive hydrogen, oxygen and nitrogen species including H2O2 has been provided, which operates at atmospheric pressure with gas temperatures remaining around room temperature and which is suitable for localised treatments due to its small dimensions; commonly, the volume, in which the reactive species are distributed, is in the order of mm [1-5]. In particular, the fields of plasma medicine, materials processing of heat sensitive targets, and of plasma agriculture have been evolving strongly due to the employment of CAPJs. The number of applications for CAPJs is continuously rising, such that the adaptability of the composition of reactive species to a specific purpose gains importance. Therefore, a thorough understanding of the chemical reactions occurring in the plasma zone and the effluent is crucial, which requires spatially resolved density distributions of several reactive species envolved into the reaction network.
H2O2 is mainly generated by the reaction of two hydroxyl radicals (OH); either in the gas phase or in a liquid. Regarding CAPJs, H2O2 was mainly investigated within a liquid [22-28]. For this, often test stripes or colorimetric assays have been employed. Only a few investigations of detecting H2O2 in the gas phase with absorption spectroscopy methods have been reported [19, 29]. Basically, there are two absorption features for H2O2 that have a sufficiently high absorption cross section suitable for absorption spectroscopy: The ν6-band of the asymmetric OH-bending between 1,175 and 1,340 cm−1 (8.510–7.460 μm) with a maximum line strength of approximately 3.9 ⋅ 10–20 cm2·cm−1 [30–32], and the ν5-band of the asymmetric OH-stretching at approximately 3,600 cm−1 (2.778 μm) with a line strength of approximately 1.2 ⋅ 10–20 cm2·cm−1 [30, 33]. However, in particular with the operation of CAPJs in the open air, the measured absorption is a superposition of absorption features of H2O2 that overlap significantly with absorption features of water (H2O). Hence, the spectral region to detect H2O2 has to be chosen carefully. Winter et al. and Schmidt-Bleker et al. have reported previously the determination of H2O2 in the kINPen plasma jet by means of Fourier transform absorption spectroscopy [19, 29]. In these experiments, the gas of the effluent was collected into a large box including a multi pass cell thereby increasing the absorption length to approximately 2 m [19]. Up to now, there is no work published, where H2O2 is detected in the effluent of a CAPJ directly.
In this work, it is demonstrated that the density of gas phase H2O2 can be determined by continuous-wave cavity ring-down spectroscopy (cw-CRDS) directly in the effluent of a CAPJ at a wavelength of approximately 8 μm. For the determination of absolute densities, the effective absorption length is crucial, in particular for CAPJs, as this is often unknown. Henceforth, in this work, radial scans have been performed in order to determine the effective absorption lengths for H2O2 in the effluent. Moreover, spatially resolved information was obtained by applying an Abel inversion on the radial scans at various axial positions, and by a subsequent interpolation between the determined radial density distributions at various axial positions. All the measurements presented have been performed on the kINPen-sci plasma jet.
The remainder of this paper is structured as follows: Firstly, in Section 2, the experimental setup for the determination of H2O2 in the effluent of the kINPen-sci plasma jet by means of cw-CRDS is presented. Subsequently, in Section 3, the procedure for the data analysis is explained. After an illustration of the relevant spectroscopic parameters for H2O2, the fitting procedure for full spectra and the on/off-resonance method used for the determination of the localised distribution for H2O2 are elucidated. In Section 4, the determined line-of-sight integrated densities and pressure broadening coefficients for H2O2, which were obtained from full spectra, are discussed. By performing radial scans, the effective absorption lengths were determined, which are presented together with the axial and radial density distributions of H2O2. An Abel inversion was applied on the radial scans in order to obtain spatially resolved densities from line-of-sight integrated measurements. Based on the radial and axial distributions, the localised distribution for H2O2 in the effluent of the kINPen-sci is presented. Finally in Section 5, the conclusions of this work are drawn.
2 Experimental setup
The kINPen-sci plasma jet, a cold atmospheric pressure plasma jet with a needle-to-grounded-ring-electrode configuration in a dielectric capillary with a diameter of 1.6 mm, which was investigated in this work, was operated with 3 slm argon (Ar) at a frequency of 860 kHz [34]. By employing a gas curtain of 5 slm oxygen (O2), the surrounding atmosphere was controlled [35]. 10% of the Ar feed gas were guided through a bubbler with destilled water at room temperature in order to obtain a feed gas humidity of approximately 1,600 ppm. The feed gas humidity was measured with a dew point hygrometer and by cavity ring-down spectroscopy. For the latter, the cavity presented in Figure 1 was closed except for a small exit hole in the centre of the cavity (
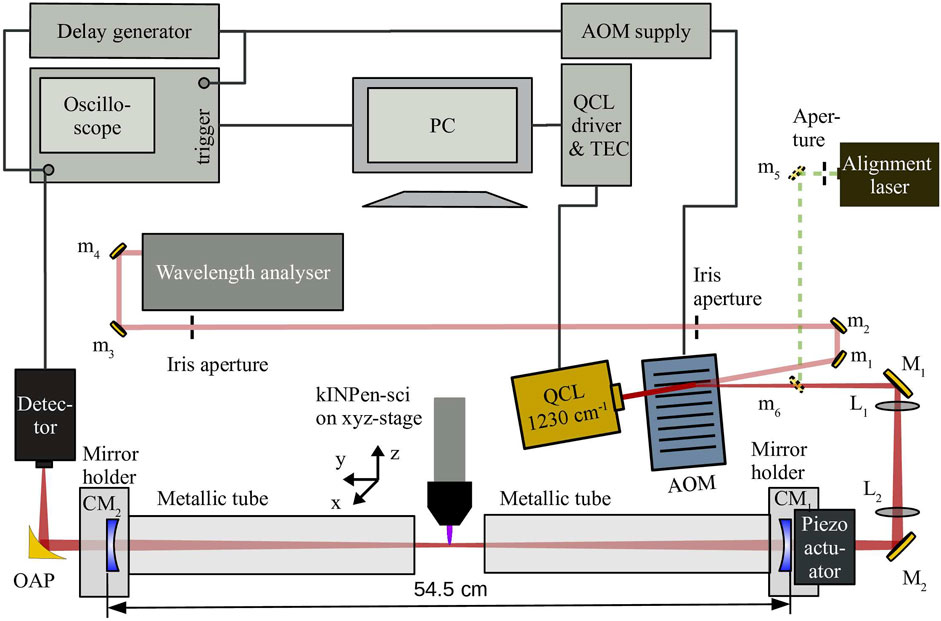
FIGURE 1. Schematic of the experimental setup to determine H2O2 densities in the effluent of the kINPen-sci plasma jet. QCL, quantum cascade laser; TEC, temperature control unit; AOM, acousto-optic modulator; OAP, off-axis parabolic mirror; mi, gold coated mirrors; Mi, gold coated coupling mirrors to the cavity; Li, beam-shaping lens with focal length of 75 mm; CMi, cavity mirrors with 99.98% reflectivity.
In Figure 1, a schematic of the continuous-wave cavity ring-down spectroscopy setup for the determination of H2O2 is depicted, which is similar to the setup described by [36]. The cavity was composed of two high reflective mirrors (Lohnstar Optics, reflectivity: 99.98%) separated by a distance of 54.5 cm, while the first cavity mirror was positioned on a piezo-electric ring actuator (RA12-24, Piezosystem Jena, total stroke: 14.8 μm). With a triangular function generated by a frequency generator (AFG 3000 C, Tektronix, frequency: 100 Hz) applied to the piezo-driver, the cavity length was constantly varied by 4 μm in order to increase the coupling efficiency of the laser to the cavity. To protect the cavity from dust particles, two metallic tubes with a diameter of 5 cm and a length of approximately 20 cm each were mounted on the holders of the cavity mirrors. The tubes were purged by 5 slm of N2 with a gas inlet close to the mirrors to reduce the amount of dust and of water in the beam path. As a laser source, a quantum cascade laser in an HHL-package [HHL-223, Alpes Lasers, tuning range: 1,224–1,234 cm−1 (8.170–8.106 μm)] was employed, which was operated with a low-noise QCL current driver (QCL1000, Wavelength Electronics) and a chassis mount temperature controller (PTC5K-CH, Wavelength Electronics). The beam of the QCL was directed through an acousto-optic modulator (AOM) (1208-G80-4, Isomet, frequency: 80 MHz), while the 0th diffraction order was guided by four gold coated mirrors and two apertures to a wavelength analyser (Laser Spectrum Analyzer 771 B, Bristol Instruments, 1–12 μm). The 1st diffraction order (85% of the input laser power) was guided by two other gold coated mirrors, the coupling mirrors, to the optical cavity. In order to match the beam shape of the laser to the cavity modes, two mode matching lenses (plano-convex lens with ZnSe substrate, Thorlabs, focal length: 75 mm) were positioned at 4 cm behind the first coupling mirror M1 in the case of L1, and at 13 cm in front of the second coupling mirror M2 in the case of L2 as illustrated in Figure 1. The transmitted laser beam after the cavity was focused by an off-axis parabolic mirror onto a fast detector (PVI-4TE-8-1x1, Vigo systems, 790 MHz high cut-off frequency). With an oscilloscope (Waverunner Xi-A, Teledyne LeCroy, band width: 400 MHz, sample rate: 5 GS/s) the detector signal was recorded. The oscilloscope was triggered, when the detector signal reached a threshold value preset at a delay generator (DG535, Stanford Research Systems, preset threshold value: 1 V) that was also connected to the detector output. When the detector signal reached the threshold value set at the delay generator, the AOM was switched off in order to initiate the observation of a ring-down event. The data from the oscilloscope were transferred to a personal computer (PC) and analysed by a custom LabView program. With the same LabView program, the laser current and temperature were set and measured at the same time by using a Bayonet Neill–Concelman connector board (BNC-board, National instruments) connected to the same PC.
In order to determine the stability of the cavity ring-down spectrometer, which defines an appropriate number of averages to be taken for the analysis of the ring-down times, a series of 3,600 ring-down times was recorded. Based on these data, an Allan-Werle deviation analysis was performed. The Allan-Werle deviation is a measure for the number of averages that improve the signal to noise ratio. Firstly introduced in 1966 by Allan to determine the stability of atomic clocks [37], the Allan-Werle deviation became a valid method to determine the type of noise [38] and to determine the theoretical detection limit for absorption coefficients obtained by optical cavities [10, 39–41]. In the case of an Allan-Werle deviation, firstly, the mean
The Allan-Werle deviation ADEV is then defined as:
In Figures 2A, B, two example plots for the Allan-Werle deviation of the cavity losses
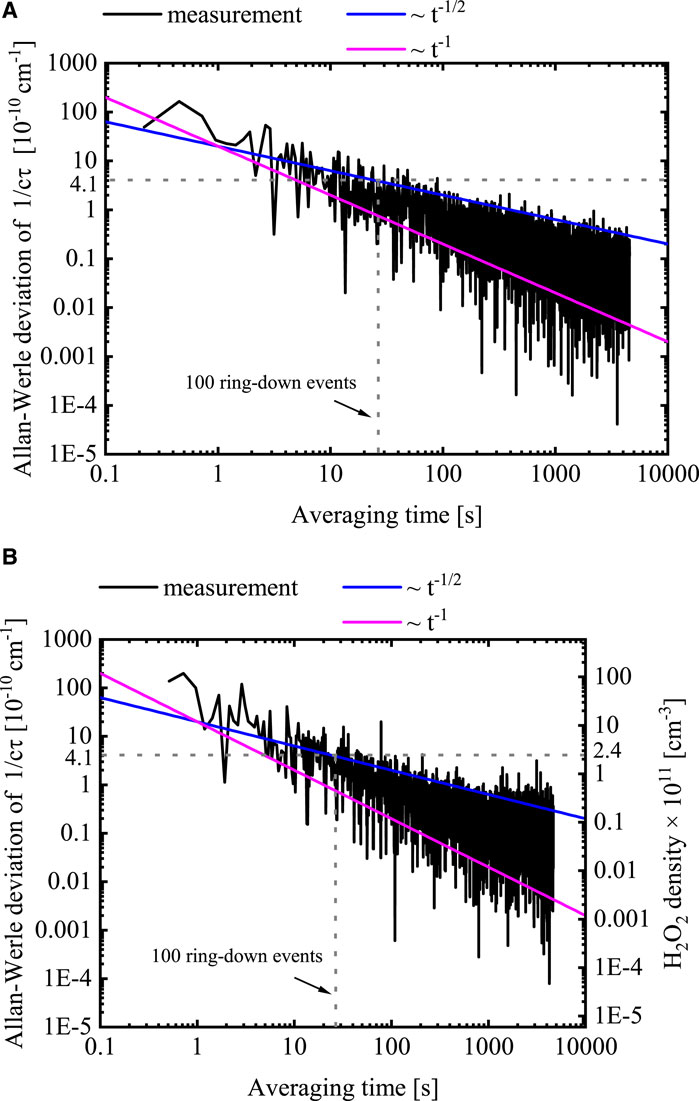
FIGURE 2. Absorption spectrum obtained from cavity ring-down spectroscopy between 1,233.04 and 1,233.41 cm−1, while the plasma jet was operated with humdid Ar gas (2.7 slm dry Ar mixed with 300 sccm dry Ar guided through a bubbler held at room temperature). (A) Plasma off (B) Plasma on.
Based on 100 ring-down events, an Allan-Werle deviation of 4.1 ⋅ 10–10 cm−1 was determined for an averaging time of 27 s in both cases, plasma off and plasma on. Compared to the Allan-Werle deviation of the cavity used for the measurements of hydroperoxyl radicals (HO2) [10], the cavity used in this work for the determination of H2O2 is more noisy by approximately a factor of 10. This could be due to the fact, that the cavity used for the determination of the H2O2 density was operated in the open air and purged with nitrogen in contrast to the jet beeing operated in a box with a lid in the case of the measurements by Gianella et al. [10]. The gas flow of the purge gas was along the direction of the laser beam, and perpendicular to the gas flow through the kINPen-sci plasma jet, which could induce additional turbulences to the turbulent gas flow through the kINPen-sci plasma jet and thus lead to fluctuations of the refractive index in the cavity. Notably, in the case when the plasma was on, the broad band of the Allan-Werle deviation as depicted in Figure 2B started to bend, resulting in a distribution parallel to the time axis. This indicates that the cavity became unstable for averaging times larger than 1,000 s, which is equivalent of averaging more than 1,500 samples. However, the values for the Allan-Werle deviation of 100 ring-down events were the same for both cases, plasma off and plasma on. This indicates that the influence of the plasma on the cavity stability is smaller than the fluctuations induced by the gas flow. A more detailed analysis of the influence of the plasma on the stability of the cavity remains for future investigations. By taking an absorption coefficient of 2.3 ⋅ 10–19 cm2 for the investigated H2O2 absorption feature into account, the detection limit due to the cavity stability is 2.4 ⋅ 1011 cm−3, when averaged over 100 ring-down events as used in the remainder of the work.
3 Determination of absolute number densities for H2O2
Line positions and line strengths for transitions corresponding to H2O2 together with calculated pressure broadening coefficients in air can be found, for example, in the HITRAN database [43]. The most prominent absorption features around a wavelength of 8 μm result from transitions in the ν6 band centred at around 1,270 cm−1, the asymmetric bending of the OH groups in H2O2 [30–32, 43]. The strongest absorption features for H2O2 can be measured at approximately 1,250 cm−1. However, also broadband absorptions of nitric acid (HNO3), nitrous acid (HONO) and of dinitrogen pentoxide (N2O5) molecules, and absorptions lines from hydroperoxyl radicals (HO2), methane (CH4), and nitrous oxide (N2O) overlap with the H2O2 lines in this region. As all of these species tend either to be generated by the kINPen-sci plasma jet or to be present in the laboratory air [29], it is difficult to distinguish between those contributions. Within the range between 1,230.5 and 1,232.0 cm−1, two prominent absorption features for H2O2 can be found, while contributions of other species, namely, HNO3, HONO, and N2O2, result in a straight line of broadband absorption. An example for the different absorption cross sections between 1,230.5 and 1,232.0 cm−1 is depicted in Figure 3, which were calculated at atmospheric pressure from line positions and pressure broadening coefficients taken from the HITRAN database [43], and taken from references [44–46]. To determine the densities of H2O2, in this work, the absorption feature of H2O2 within the spectral range between 1,230.8 and 1,231.3 cm−1 was chosen.
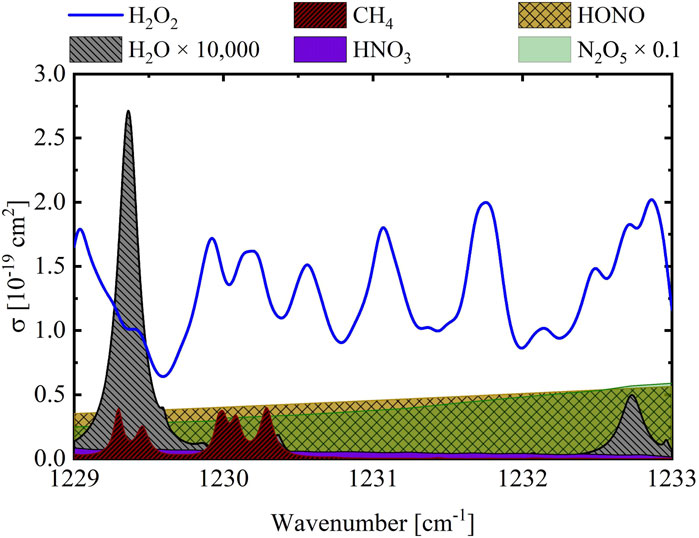
FIGURE 3. Absorption cross sections for H2O2, H2O, CH4, N2O, and HNO3 at 1,013 hPa, calculated according to Eq. 5 from line positions, line strengths and pressure broadening coefficients taken from the HITRAN database [43], and absorption cross sections for HONO, and N2O2 as reported in references [44,45], and [46], respectively.
3.1 Fitting procedure of full spectra for H2O2
To determine the density of H2O2 from a measured absorption spectrum, a fitting procedure similar to that reported in references [10, 36] has been employed. The absorption spectrum was obtained by measuring the ring-down times τ(ν) and τ0 at different spectral positions, while the plasma jet was switched on and off, respectively, according to:
Here, α(ν) is the absorption coefficient, L is the cavity length, d is the diameter of the volume, in which the absorbing species are located (i.e., the effective absorption length), and c is the speed of light in vacuum. The frequency dependence of τ0 within the applied tuning range of the QCL was small. Hence, τ0 was considered to be constant over the recorded spectral range of a spectrum.
The measured absorption
Here,
Here,
For the determination of [H2O2], and of
where Nν is the total number of the measured spectral positions, and ω comprises the experimental data and the calculated frequency dependent absorption cross sections
The values for β that yielded the lowest of squares of the residuals have been retained as the best fit parameters. The error for [H2O2] and for
3.2 On/off-resonance method for H2O2
Based on the on/off-resonance method, radial and axial scans through the effluent have been performed by recording 100 ring-down events at νon = 1,231.07 cm−1 for the on-resonance position, and at νoff = 1,230.82 cm−1 for the off-resonance position. The broadband absorptions of HNO3, HONO, and N2O5 were assumed to be the same at the positions for the on- and the off-resonance such that Δα is defined by:
Here, c is the speed of light in vacuum, τ(νon) and τ(νoff) are the measured ring-down times at the on-resonance and off-resonance position, respectively, while the plasma jet was switched on,
4 Results and discussion
4.1 Pressure broadening coefficients for H2O2 obtained from full spectra
Several full spectra at various axial distances z from the nozzle were recorded, in order to validate the on/off-resonance method, and to determine the value for the pressure broadening coefficient,
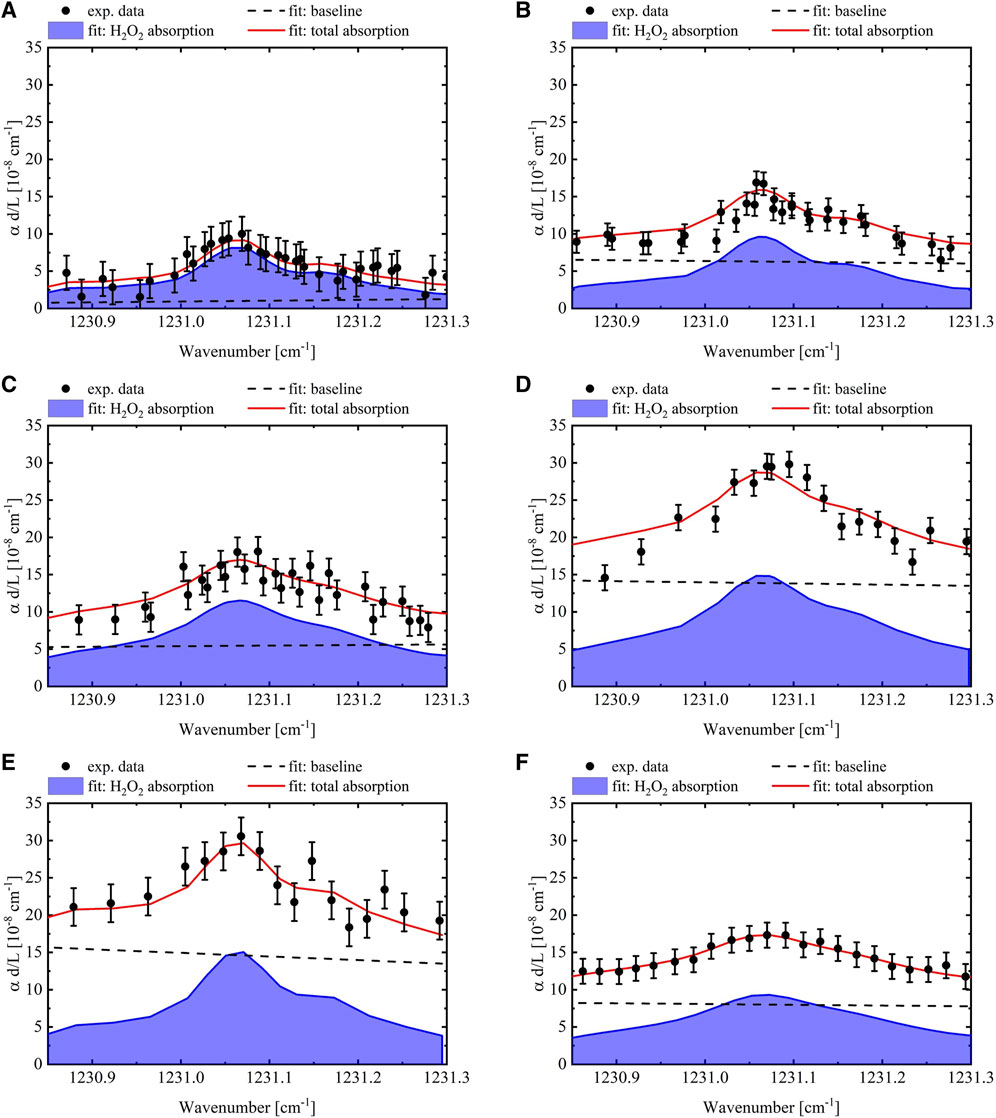
FIGURE 4. Absorption spectra at various z-positions together with a fit of the baseline and the contribution of the absorption of H2O2. (A) z = 3 mm (B) z = 4 mm (C) z = 5 mm (D) z = 6 mm (E) z = 8 mm (F) z = 10 mm.
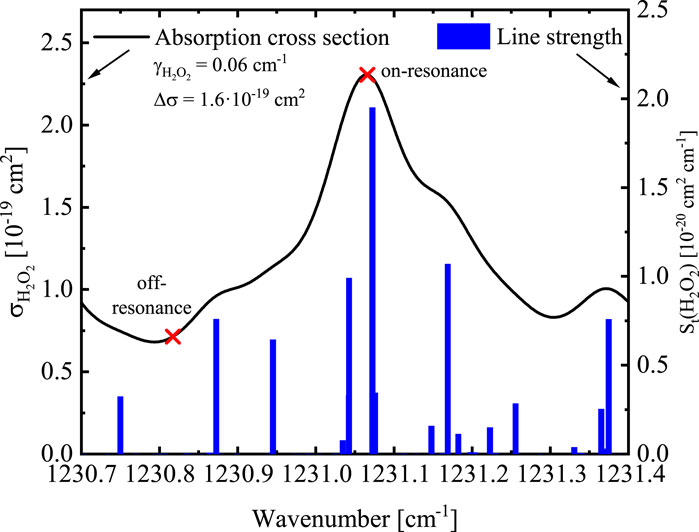
FIGURE 5. Frequency dependent absorption cross section for H2O2 at 300 K and 1,013 hPa with a pressure broadening coefficient of
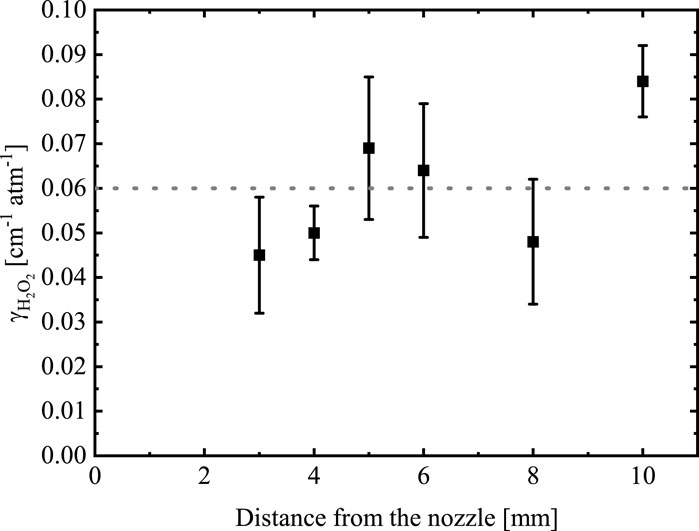
FIGURE 6. Pressure broadening coefficients for the observed H2O2 transition obtained from a fit of absorption spectra as a function of the distance from the nozzle z.
4.2 Influence of broadband absorptions
As it has been shown that broadband absorptions from other species than H2O2 play a significant role in the absorption spectra, the absorption of H2O2 has been compared qualitatively to the broadband absorptions. Therefore, the evolution of the baseline was correlated to the evolution of the absorption of H2O2, both as a function of z. For all spectra, the slope of the baseline was small compared to the error of the measured absorption. Hence, considering a single wavelength position is sufficient for the following comparison of the absorption of H2O2 and the baseline. In order to facilitate this comparison, which includes information on the shape of the absorption cross section for H2O2 as known so far, the absorption for H2O2 was evaluated by assuming a constant absorption length of d = 4 mm and a line-of-sight integrated density for H2O2 was determined. In Figure 7, the line-of-sight integrated density of H2O2 is depicted as a function of the distance from the nozzle z, together with the value of the baseline at 1,231.07 cm−1. The density of H2O2 increased between z = 3 mm and z = 8 mm linearly by approximately a factor of 2.3 to its maximum 9.7 ⋅ 1013 cm−3, and decreased to 7.1 ⋅ 1013 cm−3 between z = 6 mm and z = 10 mm. Within the error of the density, the baseline had a similar trend; the baseline increased up to z = 8 mm, and decreased between z = 8 mm and z = 10 mm. This indicates that besides H2O2, also the densities of HNO3, HONO, and N2O5 increased. However, the effective absorption length needs to be considered to compare the densities at various z-positions. Due to the on/off-resonance method employed in this work, this can only be performed for the density of H2O2.
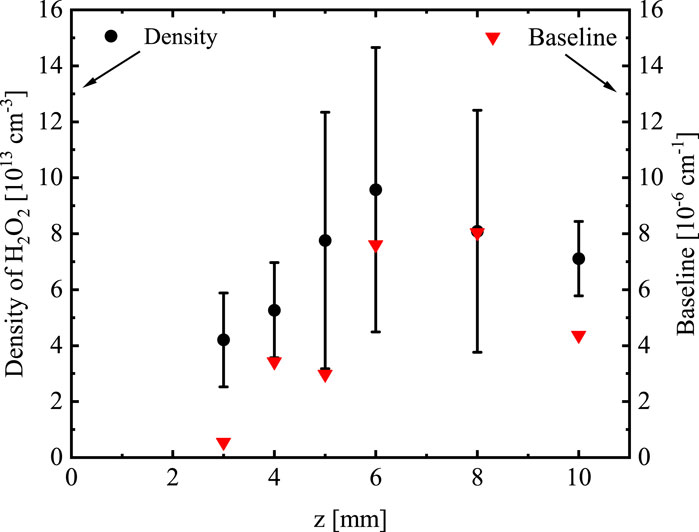
FIGURE 7. Density of H2O2 as a function of the distance to the nozzle z obtained from the fit of a full spectrum by assuming an absorption length of 4 mm, together with the value of the baseline at 1,231.07 cm−1.
4.3 Determination of the effective absorption length for H2O2
In order to obtain the effective absorption length, radial scans at various z-positions between z = 3 mm and z = 10 mm have been recorded by using the on/off-resonance method. Due to the diameter of the observed cavity mode, which was 5.5 mm in the focal point of the cavity (containing 99% of the intensity), no ring-down measurement closer than 3 mm below the nozzle could be performed. In Figure 8, radial scans for Δα as a function of the distance to the symmetry axis through the kINPen-sci plasma jet, x, are depicted for z = 3, 4, 6, 8, and 10 mm together with a Gaussian fit, and a line representing the effective absorption length. For all z-positions, a Gaussian distribution for Δα was determined.
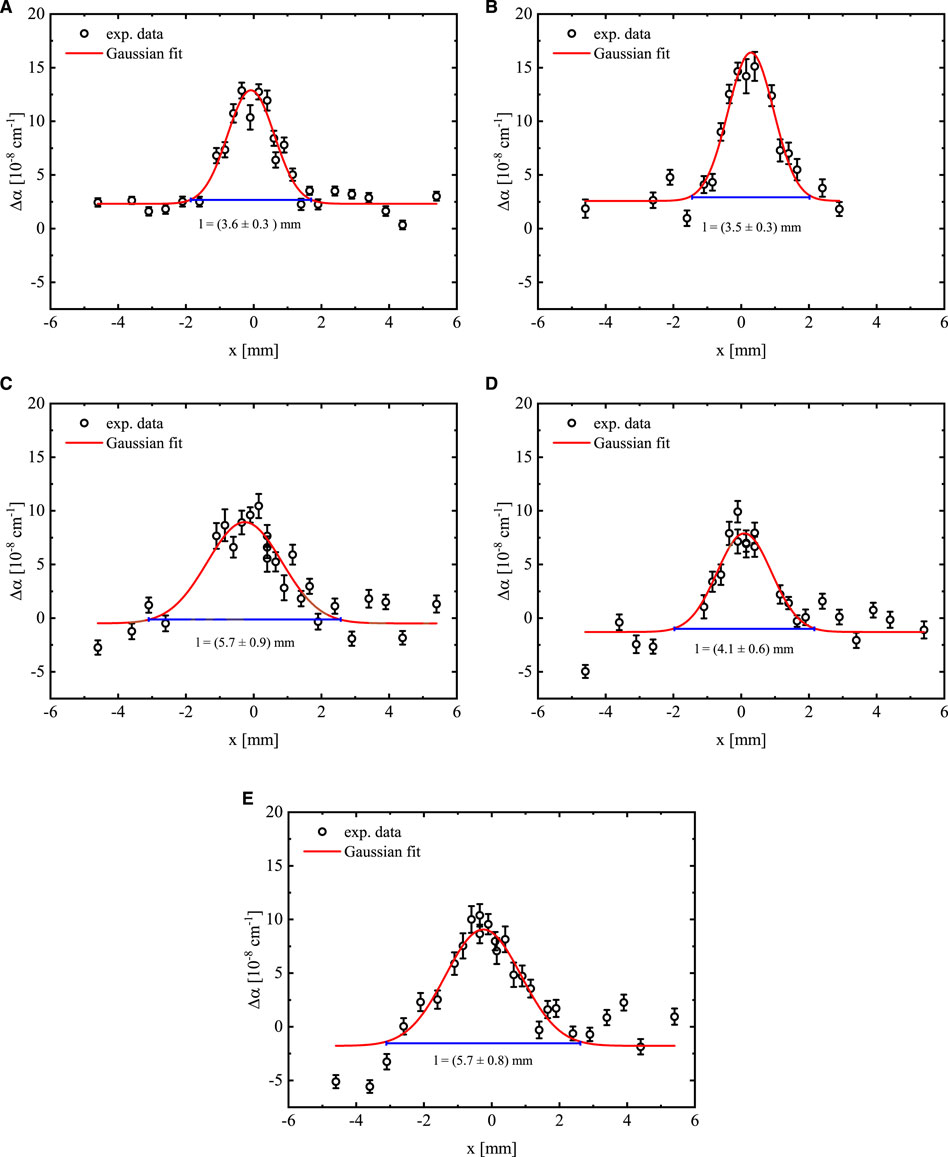
FIGURE 8. Δα as a function of x at various z-positions together with Gaussian fits. (A) z = 3 mm (B) z = 4 mm (C) z = 6 mm (D) z = 8 mm (E) z = 10 mm.
In Figure 9, the centre positions, xc, for the Gaussian fits of the radial scans are illustrated as a function of the distance from the nozzle z. Here, xc = 0 mm denotes the position of the symmetry axis of the kINPen-sci plasma jet in the centre of the nozzle. For the measured z-positions, the centre of the Gaussian fits were distributed between −0.4 and 0.4 mm relative to the centre of the nozzle. However, the weighted mean of the centre positions was at −0.12 mm, which indicates a slight asymmetry in the H2O2 distribution. A similar asymmetry has been reported previously for HO2 [36] and for O and H atoms in the same plasma jet [36]. Within the plasma zone of the plasma jet, the discharge is likely to be asymmetric because of inhomogeneities of the powered needle electrode, for instance, which results in an asymmetric production of reactive species.
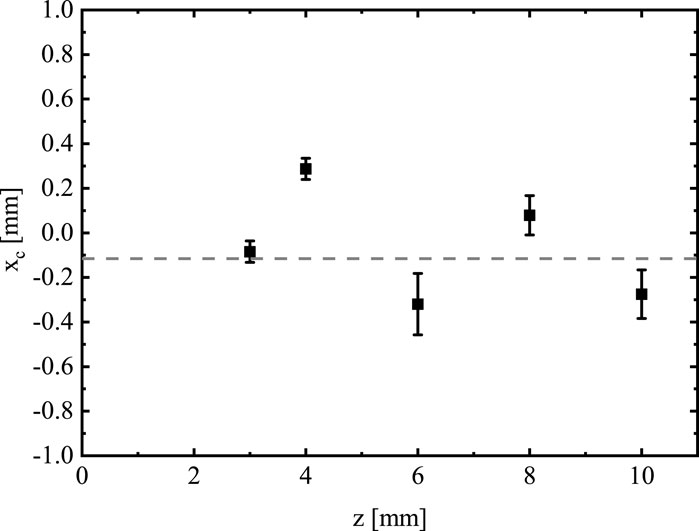
FIGURE 9. Centre position of the Gaussian fit of the radial scans as a function of the distance from the nozzle z.
The effective absorption length d was determined by the limits that contain 99% of the area A(z) of the Gaussian fit:
Here, w(z) is the width of the Gaussian function, which is defined by:
Here, xc is the centre position of the Gaussian fit, and Δαoff is an offset value.
Although the closest measurement could be taken at 3 mm from the nozzle, the localised density distribution of H2O2 close to the nozzle can be obtained by extrapolating the absorption lengths to z = 0 mm from the nozzle. Therefore, the effective absorption lengths determined for H2O2 have been compared to the absorption lengths
By using this polynomial approximation, information close to the nozzle can be extrapolated, which was not possible to obtain experimentally due to the inference of the plasma jet with the laser beam in the cavity.

FIGURE 10. Lengths d, over which the species O, H, HO2, and H2O2 were distributed as function of the distance to the nozzle z. The values for dO, dH,
4.4 Axial density distribution of H2O2 (line-of-sight integrated)
Based on the determined effective absorption length

FIGURE 11. Line-of-sight integrated density of H2O2 at x = 0 mm as a function of z, obtained by the on/off-resonance method and from a fit of full spectra considering an effective absorption length
4.5 Radial density distribution of H2O2
One drawback of the employment of absorption spectroscopy is, however, that only line-of-sight integrated densities are obtained. In order to transform the line-of-sight integrated absorption into a radial density distribution, an Abel inversion was employed, since the kINPen-sci plasma jet can be approximated by a cylindrical symmetry. By applying an Abel inversion on the radial scans Δα(x, z) presented in Figure 8 according to:
the radial density distribution was obtained. Here, ρ is the radial dimension described by
Here, A(z) and w(z) are the area and the width of the Gaussian distributions for the radial scans, respectively. The radial density distribution
Here, L is the cavity length, and
In Figure 12, the radial density distributions for H2O2 are illustrated for various z-positions. Except for the measurement at z = 4 mm, the maximum intensities decreased with further distance from the nozzle. However, for the measurement at z = 4 mm, a maximum density of twice the value for the maximum density at z = 6 mm and a factor of approximately 1.5 more than the value for the maximum density at z = 3 mm was obtained. In comparison to the measurements of full spectra and the axial scan along the symmetry axis of the plasma jet at x = 0 recorded by the on/off-resonance method, the value for Δα obtained from the radial scan at z = 4 mm is the only value that does not agree with the previous measurements within the error. Furthermore, at z = 4 mm the maximum was shifted by approximately x = 0.4 mm compared to the symmetry axis through the plasma jet, which is opposite to most of the centre positions for the radial scans at other z positions as illustrated in Figure 9. Hence, the absolute values for the radial distribution obtained from the radial scan at z = 4 mm is regarded as an outlier. Notably, the radial distribution for H2O2 depends strongly on the data quality for the radial scans. Since the measured absorption is greater by a factor of 3 than the scatter of the data points, larger errors are to be expected, especially when determining the center position.
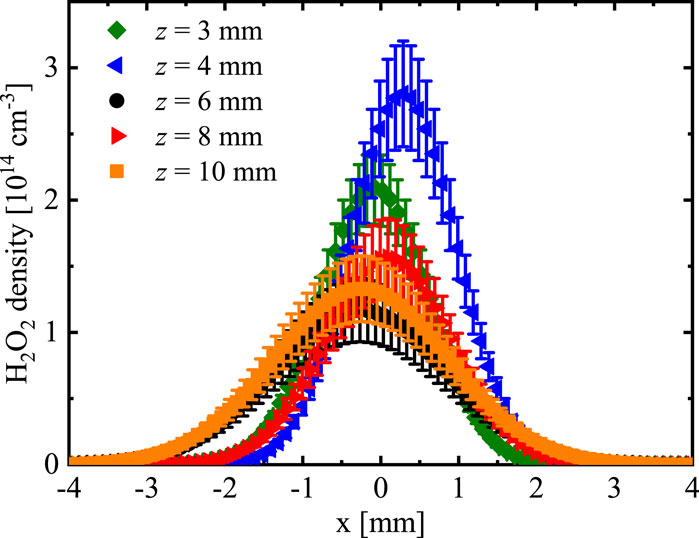
FIGURE 12. Density of H2O2 as a function of x for y = 0 mm at various z-positions, obtained by an Abel inversion of the radial scans depicted in Figure 8.
4.6 Localised density distribution of H2O2
The localised density distribution in the radial and axial dimension was determined from an axial and several radial scans measuring Δα as a function of z and x, respectively, by employing the on/off-resonance method. According to Eq. 15, the localised density distribution for H2O2 is given by:
In order to obtain a continuous density distribution, an interpolation for the evolution of the width w(z) determined from several radial scans as described by Eqs 10, 12, and for Δα(x = 0, z) was used. Therefore, Δα(x = 0, z) was described by a polynomial approximation:
Due to the lack of data points close to the nozzle for Δα for H2O2 within the first 3 mm below the nozzle, the polynomial approximation in this region was chosen in such a way that the axial density distribution for H2O2, which was determined by using the absorption length
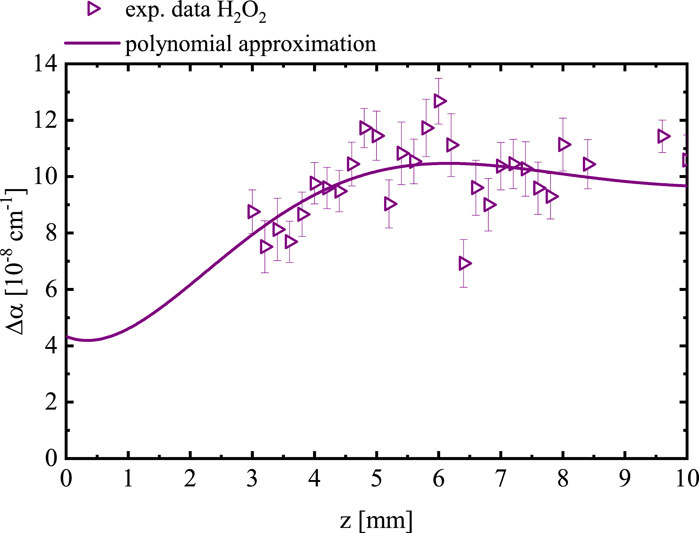
FIGURE 13. Δα(x = 0, z) as a function of z at x = 0, obtained by the on/off-resonance method, together with a polynomial approximation for Δα(x = 0, z).
The resulting localised density distribution of H2O2 is illustrated as a contour plot in a plane cut along the symmetry axis through the centre of the nozzle in Figure 14A. Lateral profiles of this contour plot at different z-positions are presented in Figure 14B, respectively. The densities of H2O2 were mainly distributed within a cone with a diameter of approximately 1.6 mm at z = 0 mm and 5 mm at z = 10 mm. The maximum density of approximately 2 ⋅ 1014 cm−3 H2O2 was obtained in the centre of the effluent between z = 0 mm and z = 4 mm. For larger z-distances, the density of H2O2 decreased to approximately 1 ⋅ 1014 cm−3 at 6 mm and remained approximately constant thereafter. From the presented localised density distribution, it can be concluded that H2O2 is significantly generated within the plasma zone of the plasma jet, as the maximum density was obtained close to the nozzle. The decrease of the density of H2O2 between z = 4 mm and z = 6 mm is most likely due to an impact of the surrounding gas composition; a larger amount of O2 from the gas curtain leads to a net consumption of H2O2. A similar impact of the surrounding gas composition has also been reported for O atoms, H atoms [47], and HO2 radicals [36]. With the strong reduction of species, that consume H2O2, such as OH or HO2 radicals, the density of H2O2 is expected to remain constant at distances further from the nozzle, which is in agreement with the measured densities at distances further than 6 mm from the nozzle.
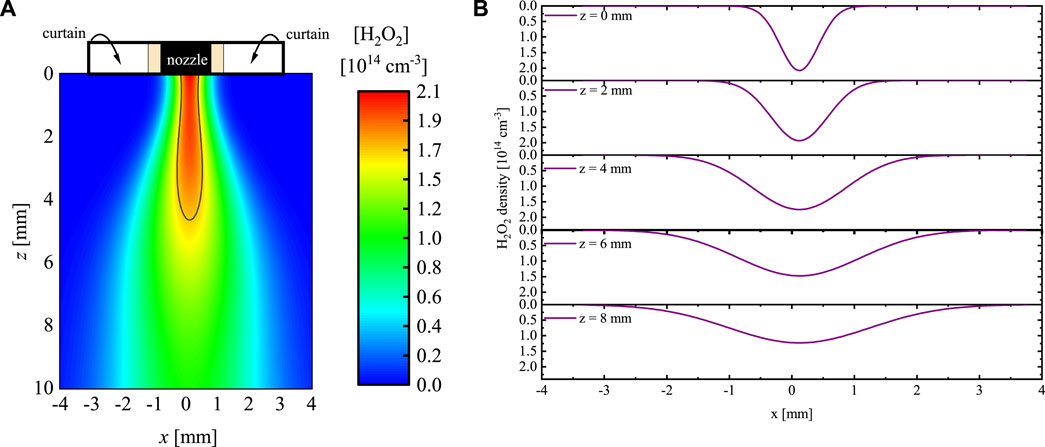
FIGURE 14. Localised densities of H2O2 illustrated as (A) a contour plot in a plane cut along the symmetry axis through the centre of the nozzle and as (B) lateral profiles at different z-positions. (A) Contouplot for H2O2 (B) Lateral profiles of the contour plot for H2O2.
5 Conclusion
In this work, it was successfully demonstrated how localised densities of H2O2 can be obtained in the effluent of a cold atmospheric pressure plasma jet by means of continuous wave cavity ring-down spectroscopy. Based on several full spectra recorded between 1,230.9 and 1,231.3 cm−1 at various distances from the nozzle of the kINPen-sci plasma jet, the pressure broadening coefficient for H2O2 in the specific gas mixture of the effluent has been determined to be 0.06 cm−1atm−1. A baseline for the fits was used to account for underlying broadband absorptions of other species, such as HONO, N2O5 and HNO3. From radial scans obtained by the on/off-resonance method, the effective absorption length was determined, which was 1.6 mm close to the nozzle of the plasma jet, and increased to approximately 5 mm at a distance of 10 mm from the nozzle. By applying an Abel inversion on the radial scans, radial density distributions were obtained, which could be represented by a Gaussian distribution. The localised density distribution for H2O2 was determined by a combination of an axial scan along the symmetry axis of the plasma jet and the evolution of the width of the radial distributions. A maximum density of approximately 2 ⋅ 1014 cm−3 was found in the centre of the effluent close to the nozzle of the plasma jet and up to z = 4 mm. With increasing z-distance further than 4 mm, the density decreased to 1 ⋅ 1014 cm−3 at 6 mm and remained approximately constant thereafter. Regarding the presented localised density distribution for H2O2, it can be concluded that H2O2 was mainly produced within the plasma zone of the plasma jet, and partially consumed by the impact of the gas curtain between 4 and 6 mm below the nozzle. All in all, the demonstration to obtain the localised density of H2O2 in the effluent of a cold atmospheric pressure plasma jet represents an important step towards the investigation of the formation and consumption mechanisms of biomedically relevant species in the effluent of cold atmospheric pressure plasma jets.
Data availability statement
The datasets presented in this study can be found in online repositories. The names of the repository/repositories and accession number(s) can be found below: Name of the repository: INPTDAT; Link to the datasets: https://doi.org/10.34711/inptdat.727.
Author contributions
JH and S-JK contributed to the conception and the design of the study. S-JK and LK performed the data acquisition and the data analysis procedure. S-JK wrote the first draft of the manuscript. All authors contributed to the article and approved the submitted version.
Funding
This work was funded by the INP internal funding.
Acknowledgments
The authors are grateful to Dr. Philipp Mattern for the fruitful discussions and to Uwe Macherius for his technical support.
Conflict of interest
The authors declare that the research was conducted in the absence of any commercial or financial relationships that could be construed as a potential conflict of interest.
Publisher’s note
All claims expressed in this article are solely those of the authors and do not necessarily represent those of their affiliated organizations, or those of the publisher, the editors and the reviewers. Any product that may be evaluated in this article, or claim that may be made by its manufacturer, is not guaranteed or endorsed by the publisher.
References
1. Schütze A, Jeong JY, Babayan SE, Park J, Selwyn GS, Hicks RF The atmospheric-pressure plasma jet: A review and comparison to other plasma sources. IEEE Trans Plasma Sci (1998) 26:1685–94. doi:10.1109/27.747887
2. Laroussi M, Akan T Arc-free atmospheric pressure cold plasma jets: A review. Plasma Process Polym (2007) 4:777–88. doi:10.1002/ppap.200700066
3. Lu X, Laroussi M, Puech V On atmospheric-pressure non-equilibrium plasma jets and plasma bullets. Plasma Sourc Sci. Technol. (2012) 21:034005. doi:10.1088/0963-0252/21/3/034005
4. Winter J, Brandenburg R, Weltmann K-D Atmospheric pressure plasma jets: An overview of devices and new directions. Plasma Sourc Sci. Technol. (2015) 24:064001. doi:10.1088/0963-0252/24/6/064001
5. Golda J, Held J, Redeker B, Konkowski M, Beijer P, Sobota G, et al. Concepts and characteristics of the ‘COST reference microplasma jet. J Phys D: Appl Phys (2016) 49:084003. doi:10.1088/0022-3727/49/8/084003
6. Adamovich I, Baalrud SD, Bogaerts A, Bruggeman PJ, Cappelli M, Colombo V, et al. The 2017 Plasma Roadmap: Low temperature plasma science and technology. J Phys D: Appl Phys (2017) 50:323001. doi:10.1088/1361-6463/aa76f5
7. Zaplotnik R, Bišćan M, Krstulović N, Popović D, Milošević S Cavity ring-down spectroscopy for atmospheric pressure plasma jet analysis. Plasma Sourc Sci. Technol. (2015) 24:054004. doi:10.1088/0963-0252/24/5/054004
8. Benedikt J, Schröder D, Schneider S, Willems G, Pajdarová A, Vlček J, et al. Absolute OH and O radical densities in effluent of a He/H2O micro-scaled atmospheric pressure plasma jet. Plasma Sourc Sci. Technol. (2016) 25:045013. doi:10.1088/0963-0252/25/4/045013
9. Gianella M, Reuter S, Aguila AL, Ritchie GAD, van Helden JH Detection of HO2 in an atmospheric pressure plasma jet using optical feedback cavity-enhanced absorption spectroscopy. New J Phys (2016) 18:113027. doi:10.1088/1367-2630/18/11/113027
10. Gianella M, Reuter S, Press SA, Schmidt-Bleker A, van Helden JH, Ritchie GAD HO2 reaction kinetics in an atmospheric pressure plasma jet determined by cavity ring-down spectroscopy. Plasma Sourc Sci. Technol. (2018) 27:095013. doi:10.1088/1361-6595/aadf01
11. Perverall R, Ritchie GAD Spectroscopy techniques and the measurement of molecular radical densities in atmospheric pressure plasmas. Plasma Sourc Sci. Technol. (2019) 28:073002. doi:10.1088/1361-6595/ab2956
12. Morabit Y, Hasan MI, Whalley RD, Robert E, Modic M, Walsh JL A review of the gas and liquid phase interactions in low-temperature plasma jets used for biomedical applications. Eur Phys J D (2021) 75:32. doi:10.1140/epjd/s10053-020-00004-4
13. Tiede R, Hirschberg J, Daeschlein G, von Woedtke T, Vioel W, Emmert S Plasma applications: A dermatological view. Contrib Plasma Phys (2014) 54:118–30. doi:10.1002/ctpp.201310061
14. Boeckmann L, Schäfer M, Bernhardt T, Semmler ML, Jung O, Ojak G, et al. Cold atmospheric pressure plasma in wound healing and cancer treatment. Appl Sci (2020) 10:6898. doi:10.3390/app10196898
15. Keidar M Plasma for cancer treatment. Plasma Sourc Sci. Technol. (2015) 24:033001. doi:10.1088/0963-0252/24/3/033001
16. Yan D, Sherman JH, Keidar M Cold atmospheric plasma, a novel promising anti-cancer treatment modality. Oncotarget (2017) 8:15977–95. doi:10.18632/oncotarget.13304
17. Xu Z, Lan Y, Ma J, Shen J, Han W, Hu S, et al. Applications of atmospheric pressure plasma in microbial inactivation and cancer therapy: A brief review. Plasma Sci Technol (2020) 22:103001. doi:10.1088/2058-6272/ab9ddd
18. Bekeschus S, Schmidt A, Weltmann K-D, von Woedtke T The plasma jet kINPen - a powerful tool for wound healing. Clin Plasma Med (2016) 4:19–28. doi:10.1016/j.cpme.2016.01.001
19. Winter J, Tresp H, Hammer MU, Iséni S, Kupsch S, Schmidt-Bleker A, et al. Tracking plasma generated H2O2 from gas into liquid phase and revealing its dominant impact on human skin cells. J Phys D: Appl Phys (2014) 47:285401. doi:10.1088/0022-3727/47/28/285401
20. Lu X, Naidis GV, Laroussi M, Reuter S, Graves DB, Ostrikov K Reactive species in non-equilibrium atmospheric-pressure plasmas: Generation, transport, and biological effects. Phys Rep (2016) 630:1–84. doi:10.1016/j.physrep.2016.03.003
21. Privat-Maldonado A, Schmidt A, Lin A, Weltmann K-D, Wende K, Bogaerts A, et al. (2019). ROS from physical plasmas: Redox chemistry for biomedical therapy. Oxid Med Cel Longev. 2019, 1–29. doi:10.1155/2019/9062098
22. Khlyustova A, Labay C, Machala Z, Ginebra M-P, Canal C Important parameters in plasma jets for the production of rons in liquids for plasma medicine: A brief review. Front Chem Sci Eng (2019) 13:238–52. doi:10.1007/s11705-019-1801-8
23. Winter J, Wende K, Masur K, Iséni S, Dünnbier M, Hammer MU, et al. Feed gas humidity: A vital parameter affecting a cold atmospheric-pressure plasma jet and plasma-treated human skin cells. J Phys D: Appl Phys (2013) 46:295401. doi:10.1088/0022-3727/46/29/295401
24. Suresh M, Kondeti VSSK, Bruggeman PJ Production and diffusion of H2O2 during the interaction of a direct current pulsed atmospheric pressure plasma jet on a hydrogel. J Phys D: Appl Phys (2022) 55:185201. doi:10.1088/1361-6463/ac4ec6
25. Hathaway HJ, Patenall BL, Thet NT, Sedgwick AC, Williams GT, Jenkins ATA, et al. Delivery and quantification of hydrogen peroxide generated via cold atmospheric pressure plasma through biological material. J Phys D: Appl Phys (2019) 52:505203. doi:10.1088/1361-6463/ab4539
26. Ghimire B, Szili EJ, Patenall BL, Lamichhane P, Gaur N, Robson AJ, et al. Enhancement of hydrogen peroxide production from an atmospheric pressure argon plasma jet and implications to the antibacterial activity of plasma activated water. Plasma Sourc Sci. Technol. (2021) 30:035009. doi:10.1088/1361-6595/abe0c9
27. Jablonowski H, von Woedtke T Research on plasma medicine-relevant plasma-liquid interaction: What happened in the past five years? Clin Plasma Med (2015) 3:42–52. doi:10.1016/j.cpme.2015.11.003
28. Gorbanev Y, O’Connell D, Chechik V Non-thermal plasma in contact with water: The origin of species. Chem Eur J (2016) 22:3496–505. doi:10.1002/chem.201503771
29. Schmidt-Bleker A, Winter J, Bösel A, Reuter S, Weltmann K-D On the plasma chemistry of a cold atmospheric argon plasma jet with shielding gas device. Plasma Sourc Sci. Technol. (2016) 25:015005. doi:10.1088/0963-0252/25/1/015005
30. Klee S, Winnewisser M, Perrin A, Flaud J-M Absolute line intensities for the ν6 band of H2O2. J Mol Spectrosc (1999) 195:154–61. doi:10.1006/jmsp.1999.7807
31. Perrin A, Flaud J-M, Camy-Peyret C, Schermaul R, Winnewisser M, Mandin J-Y, et al. Line intensities in the far-infrared spectrum of H2O2. J Mol Spectrosc (1996) 176:287–96. doi:10.1006/jmsp.1996.0089
32. Perrin A, Valentin A, Flaud J-M, Camy-Peyret C, Schriver L, Schriver A, et al. The 9.7-μm band of hydrogen peroxide: Line positions and intensities. J Mol Spectrosc (1995) 171:358–73. doi:10.1006/jmsp.1995.1125
33. Bain O, Giguère PA Hydrogen peroxide and its analogues: VI. Infrared spectra of H2O2, D2O2, and HDO2. Can J Chem (1955) 33:527–45. doi:10.1139/v55-063
34. Reuter S, von Woedtke T, Weltmann K-D The kINPen—A review on physics and chemistry of the atmospheric pressure plasma jet and its applications. J Phys D: Appl Phys (2018) 51:233001. doi:10.1088/1361-6463/aab3ad
35. Reuter S, Winter J, Schmidt-Bleker A, Tresp H, Hammer MU, Weltmann K-D Controlling the ambient air affected reactive species composition in the effluent of an argon plasma jet. IEEE Trans Plasma Sci (2012) 40:2788–94. doi:10.1109/tps.2012.2204280
36. Klose S-J, Manfred KM, Norman HC, Ritchie GAD, van Helden JH The spatial distribution of HO2 in an atmospheric pressure plasma jet investigated by cavity ring-down spectroscopy. Plasma Sourc Sci. Technol. (2020) 29:085011. doi:10.1088/1361-6595/aba206
37. Allan DW. Statistics of atomic frequency standards. Proceeding of the IEEE (1966) 54:221–30. doi:10.1109/proc.1966.4634
38. Werle P, Mücke R, Slemr F The limits of signal averaging in atmospheric trace-gas monitoring by tunable diode-laser absorption spectroscopy (TDLAS). Appl Phys B (1993) 57:131–9. doi:10.1007/bf00425997
39. Long DA, Havey DK, Okumura M, Pickett HM, Miller CE, Hodges JT Laboratory measurements and theoretical calculations ofO2 A band electric quadrupole transitions. Phys Rev A (2009) 80:042513. doi:10.1103/physreva.80.042513
40. Kassi S, Campargue A Cavity ring down spectroscopy with 5 × 10⁻¹³ cm−1 sensitivity. J Chem Phys (2012) 137:234201. doi:10.1063/1.4769974
41. Zhao G, Hausmaninger T, Ma W, Axner O Shot-noise-limited Doppler-broadened noise-immune cavity-enhanced optical heterodyne molecular spectrometry. Opt Lett (2018) 43:715. doi:10.1364/ol.43.000715
42. Barnes JA, Chi AR, Cutler LS, Healey DJ, Leeson DB, McGunial TE, et al. Characterization of frequency stability. IEEE Trans Instrumentation Meas IM (1971) 20:105–20. doi:10.1109/tim.1971.5570702
43. Gordon I, Rothman L, Hargreaves R, Hashemi R, Karlovets E, Skinner F, et al. The HITRAN2020 molecular spectroscopic database. J Quant Spectrosc Radiat Transf (2022) 277:107949. doi:10.1016/j.jqsrt.2021.107949
44. Barney WS, Wingen LM, Lakin MJ, Brauers T, Stutz J, Finlayson-Pitts BJ Infrared absorption cross-section measurements for nitrous acid (HONO) at room temperature. J Phys Chem A (2000) 104:1692–9. doi:10.1021/jp9930503
45. Barney WS, Wingen LM, Lakin MJ, Brauers T, Stutz J, Finlayson-Pitts BJ Additions and corrections to: Infrared absorption cross-section measurements for nitrous acid (HONO) at room temperature, 2000, volume 104A. J Phys Chem A (2001) 105:4166. doi:10.1021/jp010734d
46. Newnham D, Ballard J, Page M Infrared absorbance cross-sections for dinitrogen pentoxide vapour. J Quant Spectrosc Radiat Transf (1993) 50:571–7. doi:10.1016/0022-4073(93)90023-b
47. Klose S-J, Ellis J, Riedel F, Schröter S, Niemi K, Semenov IL, et al. The spatial distribution of hydrogen and oxygen atoms in a cold atmospheric pressure plasma jet. Plasma Sourc Sci. Technol. (2020) 29:125018. doi:10.1088/1361-6595/abcc4f
48. Dünnbier M, Schmidt-Bleker A, Winter J, Wolfram M, Hippler R, Weltmann K-D, et al. Ambient air particle transport into the effluent of a cold atmospheric-pressure argon plasma jet investigated by molecular beam mass spectrometry. J Phys D: Appl Phys (2013) 46:435203. doi:10.1088/0022-3727/46/43/435203
Keywords: cold atmospheric pressure plasma jet, Abel inversion, spatial distribution, cavity ring-down spectroscopy, hydrogen peroxide
Citation: Klose S-J, Krös L and van Helden JH (2023) The localised density of H2O2 in the effluent of a cold atmospheric pressure plasma jet determined by continuous-wave cavity ring-down spectroscopy. Front. Phys. 11:1221181. doi: 10.3389/fphy.2023.1221181
Received: 12 May 2023; Accepted: 29 June 2023;
Published: 12 July 2023.
Edited by:
Carrie Womack, University of Colorado Boulder, United StatesReviewed by:
Nikola Skoro, University of Belgrade, SerbiaCheng Cheng, Chinese Academy of Sciences (CAS), China
Copyright © 2023 Klose, Krös and van Helden. This is an open-access article distributed under the terms of the Creative Commons Attribution License (CC BY). The use, distribution or reproduction in other forums is permitted, provided the original author(s) and the copyright owner(s) are credited and that the original publication in this journal is cited, in accordance with accepted academic practice. No use, distribution or reproduction is permitted which does not comply with these terms.
*Correspondence: S.-J. Klose, c2FyYWgtam9oYW5uYS5rbG9zZUBpbnAtZ3JlaWZzd2FsZC5kZQ==