 Chao Wang1
 Zhaoyang Yan
- 1Yankuang Energy Group Company Limited, Zoucheng, Shandong, China
- 2Key Laboratory of Earthquake Engineering and Engineering Vibration, Institute of Engineering Mechanics, China Earthquake Administration, Harbin, Heilongjiang, China
- 3Key Laboratory of Earthquake Disaster Mitigation, Ministry of Emergency Management, Harbin, Heilongjiang, China
The accurate identification of mining tremors and earthquakes is important for establishing a comprehensive mining tremor catalog that can aid in providing regulatory oversight for mining activities. Moreover, using a catalog purely consisting of earthquakes allows for more advanced seismological studies, such as active fault delineation, strong earthquake prediction, and stress field calculations, to be conducted. We focus on the spectral characteristics of mining tremors and earthquakes. By identifying short-period surface waves in the given data and utilizing an improved complete ensemble empirical mode decomposition method with adaptive noise (CEEMDAN) in combination with long short-term memory (LSTM) networks, we conduct a discriminative analysis of seismic events in Liaoning, China, and Japan. After completing basic preprocessing steps for both mining tremors and earthquakes, CEEMDAN is used to decompose the data into different intrinsic mode functions (IMFs). The variance contribution rates of the IMFs are extracted as features, which distinctly identify the short-period surface wave components of mining tremors. These features are subsequently input into an LSTM model for classification training, resulting in an accurate classification model. The results demonstrate that CEEMDAN-LSTM effectively addresses the noise and short-period surface wave aliasing issues encountered within the modes, yielding significantly enhanced classification accuracy. The classification success rate has been significantly improved to 96.5%. Additionally, this study explores the advantages and limitations of various classification features and models, providing effective technical support and new perspectives for the automatic identification of seismic events in the future. This research provides not only an understanding of the characteristics of mining tremors and earthquakes but also a scientific basis for earthquake early warning and disaster prevention. This study suggests that future research can further optimize the model in terms of speed and apply the model to classify more nonnatural seismic events.
1 Introduction
Mining tremors refer to earthquakes caused by geological structural changes resulting from mining activities such as blasting and collapses in mines. Mining tremors typically occur in and around mining areas, especially during large-scale underground mining operations. On the one hand, using a pure earthquake catalog can facilitate in-depth seismological research, such as active fault delineation, strong earthquake prediction, and stress field calculations. On the other hand, owing to the potential threat of mining tremors to miner safety and the surrounding environment, a comprehensive catalog of mining tremors and other nonnatural seismic events also benefits regulatory activities in the mining sector. According to the current theories for identifying earthquakes and mining tremors, earthquakes are primarily tectonic earthquakes that occur when stress concentrations exceed the elastic limits of rocks, causing rock fractures and displacements, with the initial P-wave moving upward within a certain azimuth range and downward in other azimuths. In contrast, the seismic sources of most mining tremors mainly impose tension on external media, generating expansive waves, which are characterized by downward vertical initial P-waves [1]. There are many differences in geophysics between natural earthquakes and mining tremors collapses. Natural earthquakes are caused by crustal plate movements and other factors. Their seismic wave spectra are wide, with well-developed surface waves. The hypocenters are deep, and the seismic source mechanisms are related to plate interactions. The seismic activity has periodicity, and the changes in the geophysical field cover a wide range. In contrast, mine-induced seismic collapses are triggered by the failure and collapse of rock masses caused by mining activities. Their seismic wave spectra are narrow with prominent high frequencies, and the hypocenters are shallow. The seismic source mechanisms are related to the changes in stress of the goaf and rock masses. Their seismic activities are related to the mining process, and the changes in the geophysical field are concentrated in the local area of the mining area, with a relatively small range and amplitude [1].
Sha et al. [2] classified earthquakes and mining tremors based on time-domain features such as the direction of the initial P-wave, the development trends of surface waves, and the P/S wave amplitude ratio. Feng et al. [1] classified earthquakes based on the direction of the initial P-wave and amplitude attenuation. Dong et al. [3] effectively distinguished mining explosions and microseismic events by selecting the energy, seismic moment, ratio of the longitudinal and transverse wave energies, corner frequency, and static stress drop as stable discrimination indicators. Zheng et al. [4] conducted a time‒frequency analysis on mining tremor waveforms via the S-transform. These multiparameter combined analysis methods provide different research approaches and techniques for classifying earthquakes and mining tremors. However, these characteristic parameters are artificially designed through specific methods, and their definitions are relatively cumbersome, requiring various postprocessing methods, making rapid differentiation through computer programs impossible and indicating that signals cannot be automatically distinguished as earthquakes or mining tremors [5]. Therefore, more scholars have adopted short-period surface wave classification for earthquakes and mining tremors. Xuesong et al. [6] proposed that short-period surface waves are distinct features for distinguishing mining tremors from earthquakes. Bi et al. [7] used the Hilbert–Huang transform (HHT) to extract the maximum amplitude corresponding to the mode component period and the average cepstral value as effective features for distinguishing earthquakes and mining explosions, and Jinlong et al. [8] used the HHT in combination with ensemble empirical mode decomposition (EEMD) to extract surface waves and classify mining tremors and earthquakes in the Hegang region, reaching an accuracy rate of over 90%. However, the mode mixing problem encountered when EEMD is used for processing has not been effectively solved. When facing seismic and mining tremor waveforms in different regions, the frequency ranges of short-period surface waves and environmental noise partially overlap, leading to difficulty in terms of effectively separating surface waves during the decomposition process with EEMD, resulting in poorer classification effectiveness.
With the advancement of computer technology, artificial intelligence has been increasingly incorporated into earthquake event identification research. Ming et al. [9] applied convolutional neural networks (CNNs) to automatically classify and identify the aftershock waveforms of the Wenchuan earthquake in the Beijing-Tianjin-Hebei metropolitan region, achieving training and detection accuracies exceeding 95%. Mousavi et al. [10] implemented a precise method for extracting earthquake P-wave and S-wave phases via the earthquake transformer (EQ transformer). Zhu et al. [11] successively used support vector machines (SVMs) and deep CNNs (DCNNs) to accurately estimate earthquake magnitudes [12], Liu et al. [13] used a generative adversarial network (GAN) to classify microseismic events and noise, and Zhou et al. [14] used a CNN model (SW-CNN) to process waveforms from 2 s before to 5 s after the corresponding P-waves arrive to classify earthquakes, explosions, and mining tremors. Chen et al. [15] combined the K-means algorithm and a CNN to classify earthquake waveforms and demonstrated that the K-CNN model could accurately classify earthquake waveforms by analyzing synthetic microseismic data with different noise levels and microseismic field data applications. Abdalzaher et al. [16] developed a machine learning framework integrating XGBoost and other classifiers to discriminate between tectonic earthquakes and quarry blasts, achieving a classification accuracy of 97.21% based on spatio-magnitude features. In a subsequent study [17], the authors introduced the 2S1C1S model for real-time seismic intensity estimation using single-component seismogram data from the initial 2-s post-P-wave window, demonstrating 99.05% accuracy. Their most recent work [18] employed an optimized quadratic discriminant analysis (QDA) model to distinguish small-magnitude earthquakes (M ≤ 3) from quarry blasts using eight waveform-derived features, yielding 99.4% classification accuracy. These methodologies demonstrate substantial improvements over conventional discriminative approaches, with performance metrics (R2, F1-score, MCC) indicating robust generalization capabilities and practical utility for seismic hazard mitigation. Zhang et al. [19] employed EEMD and a CNN to classify earthquake signals, achieving classification results as high as 93.85%. The above studies have proven that the use of artificial intelligence methods for earthquake identification and detection can yield significantly improved efficiency.
In terms of microseismic event identification, Fan et al. [20] used wavelet scattering decomposition to identify microseismic signals in coal mines and noise. Chen et al. [21] proposed an improved method for identifying microseismic mine events through a combination of wavelet decomposition and an extreme learning machine (ELM), successfully distinguishing microseismic mine events from noise with a success rate of 91.1%. Qin et al. [22]used modal decomposition and deep learning methods to predict the evolution trends of microseismic events, demonstrating good predictive and generalization performance. Gu et al. [23] employed backpropagation (BP) networks to classify five types of microseismic signals acquired from rockburst mines, achieving a classification model accuracy rate of 88.3%. Li [24] proposed a method for extracting features and classifying microseismic mine signals on the basis of local mean decomposition (LMD) and pattern recognition, attaining a classification accuracy rate of 93.0%. These studies have validated the excellence of deep learning in terms of identifying seismic events and noise, highlighting the notion that starting the microseismic event identification process from the frequency domain can be a more efficient strategy. However, the current focus in microseismic event identification research mainly involves classifying noise and mining tremors, with fewer classification methods developed for distinguishing earthquakes from mining tremors.
Therefore, this study selects many records of mining tremors and seismic events to explore a more efficient short-period surface wave classification method and integrates it with artificial intelligence, proposing the complete ensemble empirical mode decomposition with adaptive noise-long short-term memory (CEEMDAN-LSTM) method. First, on the basis of the developmental characteristics of short-period surface waves, an improved version of the CEEMDAN method [25] is used to decompose the input data to obtain a series of intrinsic mode functions (IMFs), and the variance contribution rate of each IMF is extracted. By inputting the variance contribution rates into an LSTM network [26] for training, a corresponding classification model is obtained. Additionally, compared with directly inputting waveform data into traditional neural networks after analyzing the features extracted by CEEMDAN, this model is validated to have superior classification capabilities. Compared with traditional EEMD, the CEEMDAN-LSTM model solves the modal aliasing problem faced when utilizing low-frequency data and can accurately classify earthquakes and mining tremors, providing strong technical support for seismological research and practical applications.
2 Data
The observational data used in this study are obtained from stations in Liaoning Province, and some seismic data are obtained from Japan. The employed mining tremor data are all selected from Liaoning Province between 2013 and 2023, totaling 14,577 records with a magnitude range of 2-4, different epicentral distances, and source depths ranging from 4 to 50 km. The earthquake data were acquired from Liaoning Province between 2020 and 2023 and include 13,548 records. Additionally, data acquired from the K-NET of Japan between 2022 and 2023 are selected after performing screening, totaling 5,329 records with a magnitude range of 3-8, epicentral distances from 0 to 200 km, and source depths ranging from 4 to 120 km. The data from Liaoning are velocity records with a sampling frequency of 100 Hz, whereas the data from Japan are acceleration records with the same sampling frequency.
Before conducting data processing, the following steps are implemented for preprocessing [1]: baseline correction [2]; 0.3-Hz Butterworth high-pass filtering [3]; converting acceleration records into velocity records via integration [4]; extracting P-wave arrival times via the STA/LTA method [27] and selecting data from 1 s before to 100 s after a P-wave arrives as analysis samples; and [5] normalizing all the data to the same scale. Figure 1 illustrates the technical roadmap of this paper.

Figure 1. Figure shows the overall architecture flowchart of this paper, where blue represents mine earthquakes and green represents natural earthquakes.
After the above processing steps, this study selects a total of 262 mining tremors, comprising 7,012 records, and 508 earthquakes, forming 8,610 records, including 3,281 from Liaoning and 5,329 from Japan. The earthquake epicenter distribution is shown in Figure 2. Figure 3 shows the station map, where the ratio of the training set to the test set is 8:2. These data are selected to ensure independence, with data concerning the same earthquake event obtained from different stations not simultaneously included in the test and training sets. Initially, earthquake event classification is performed on the test and training sets, followed by reading data from each station into the dataset. Figures 4a–c illustrates the epicentral distance distribution. In theory, the main goal of this study is to identify the components of short-period surface waves in waveform data, as their degree of attenuation during propagation is smaller than that of high-frequency waves. Therefore, the impact of attenuation on the ability to distinguish earthquakes from mining tremors is relatively minor. Figures 4d,e displays the magnitude distribution of the data. In contrast, the source mechanism of earthquakes is relatively complex, consisting of several small fractures that form the source, each with a certain process, and occur at greater depths.

Figure 2. (a) Map of earthquake epicenters in Liaoning. (b) Map of mining tremor epicenters in Liaoning. (c) Map of earthquake epicenters monitored by the K-NET of Japan.

Figure 3. Schematic representation of the locations of seismic stations. Yellow indicates the training set, and blue indicates the validation set. (a) Locations of seismic stations in Liaoning. (b) Locations of mining tremor stations in Liaoning. (c) Locations of seismic stations in the K-NET of Japan.

Figure 4. (a) Distribution of the epicentral distances for mining tremors in Liaoning. (b) Distribution of the epicentral distances for earthquakes in Liaoning. (c) Distribution of the epicentral distances for earthquakes in Japan. (d) Magnitude distribution of the hypocenters for mining tremors in Liaoning. (e) Magnitude distribution of the hypocenters for earthquakes in Liaoning. (f) Magnitude distribution of the hypocenters for earthquakes in Japan.
3 Materials and methods
The research approach of this article is as follows. First, CEEMDAN is used to decompose the signals of earthquakes and mining tremors, the variance contribution rates of the decomposed IMFs are calculated, and then the features of each IMF are input into LSTM for learning and obtaining classification results.
3.1 Complete ensemble empirical mode decomposition with adaptive noise
For analyzing the spectral characteristics of a signal, the traditional fast Fourier transform (FFT) method is widely used. However, during the process of transferring a signal from the time domain to the frequency domain, temporal information is lost, making it impossible to accurately determine the appearance and disappearance moments of frequencies. To address this limitation, time‒frequency analysis techniques, which can effectively track the spectrum changes over time, have been developed. Common time‒frequency analysis methods include the short-time Fourier transform (STFT), the Gabor transform, and the Wigner‒Ville distribution, among others. Although these methods can theoretically handle nonlinear and nonstationary signals, limitations remain in practical applications. In contrast with the aforementioned traditional methods, the HHT completely eliminates the dependencies on linearity and stationarity, making it especially suitable for analyzing nonlinear and nonstationary signals such as seismic waves. EEMD is an improved version of empirical mode decomposition (EMD) and is used to decompose nonlinear and nonstationary signals. EEMD enables the decomposition of a signal based on the given data themselves rather than predefined base functions. However, it still faces challenges such as mode mixing and incomplete mode decomposition. To address this issue, EEMD introduces a strategy of adding white noise at different time scales to compensate for potential frequency band losses. Nonetheless, in practical applications, especially when addressing signals with similar frequencies, mode mixing is still common.
To further improve upon EEMD, CEEMDAN was proposed. It is an advanced signal processing technique that is aimed at decomposing complex signals into simpler components known as IMFs. CEEMDAN inherits the basic principles of EMD and its EEMD variant and has been improved to overcome the mode mixing problem, providing a more robust decomposition method. Through this method, each step in the signal decomposition process becomes more precise, effectively reducing the degree of mode mixing and enhancing the reliability of the conducted analysis. The principle of this approach is as follows.
Given an original signal
For each noisy signal
The mean envelope is subtracted from the signal to extract a detail
If
In this equation,
3.2 Construction of the LSTM model
3.2.1 Overview of the LSTM model
Long short-term memory (LSTM), a specialized architecture of artificial neural networks (ANNs), addresses the limitations of traditional recurrent neural networks (RNNs) in handling long-range temporal dependencies by incorporating a memory cell regulated by three adaptive gates (input, forgetting, output). This innovation mitigates gradient vanishing/exploding issues inherent in standard RNNs, enabling precise control over information retention and forgetting [26]. Compared to feedforward neural networks (FNNs), LSTM’s temporal memory mechanism and dynamic gating allow adaptive sequential processing critical for seismic signal analysis [29]. Recent studies demonstrate its efficacy in early earthquake warning systems, underground mining tremor classification, and real-time anomaly detection in sensor networks [30], highlighting its stability optimization and context-aware capabilities in geophysical applications. In a classic LSTM model, the update equations at step
In this equation,
In a trained network, LSTM has the ability to handle sequential data through its gating mechanism, thus achieving long-term memory functionality. Specifically, when the input sequence lacks critical information, the forgetting gate value of the LSTM model approaches 1, and the input gate value approaches 0, allowing past memories to be retained. Conversely, when important information appears in the input sequence, the input gate value increases to nearly one to store this information in the internal memory cell. Furthermore, when the important information in the input sequence indicates that the prior memory is no longer relevant, the input gate value increases to nearly 1, whereas the forgetting gate value decreases to nearly 0. This mechanism clears old memories and stores new key information. Figure 5 shows the structure of an LSTM unit.

Figure 5. Structural diagram of an LSTM unit.
3.2.2 Model architecture
In this study, we design a neural network architecture consisting of multiple layers specifically for handling binary classification problems. The input layer of the network receives sequential data with 11 time steps. This is followed by two LSTM layers, each containing 32 LSTM units, which can capture the long-term dependencies in time series. To reduce overfitting, three dropout layers are incorporated into the network, with dropout rates of 40% for the first two layers and an increased dropout rate of 40% for the final layer before the output layer. Additionally, the network includes a fully connected layer with 32 neurons, utilizing the rectified linear unit (ReLU) activation function to enhance the nonlinear expression capabilities of the model and applying L2 regularization to further mitigate the risk of overfitting. The final output layer is a fully connected layer that uses the sigmoid activation function to output probabilities for the two classes. The model was trained using the Adam optimizer and binary cross-entropy loss—specifically designed for binary classification tasks where outputs are probabilities between 0 and 1. A training-validation split of 8:2 was applied to ensure robust generalization to unseen data. The initial learning rate was set to 0.05—a value commonly adopted in deep learning practice [31]—and dynamically adjusted using a step scheduler that reduces the learning rate by a factor of 10 every 10 epochs. This strategy was implemented to balance rapid convergence during early training and parameter refinement in later stages, as supported by studies on optimization stability [32]. Using TensorFlow distributed training, LSTM model parameters are stored in fragments and multi-node parallel processing is used to reduce scaling effect when processing large-scale data This network architecture not only adapts to complex binary classification tasks but also effectively balances the learning ability and generalizability of the model.
4 Results
4.1 Decomposition results produced by CEEMDAN for earthquakes and mining tremors
In this study, both mining tremors and earthquake signals are decomposed into 11 IMFs, with these components arranged in frequency order from high to low across different time scales. Specifically, IMF1 represents the component with the highest frequency and the shortest wavelength. As the decomposition process progresses, the frequency decreases, and the wavelength increases for each subsequent IMF component until the final residual component is reached. For mining tremors, short-period surface wave components can typically be identified in the fourth or fifth IMF component, whereas these components are absent from the IMFs of earthquakes, highlighting a significant distinction between mining tremors and earthquakes. By selecting two typical records of mining tremors and earthquakes, the variance contribution rates of different IMF components are calculated after using CEEMDAN for decomposition purposes and presented as histograms. Figures 6a,b visually display the prominent IMF components and their growth trends for mining tremors and earthquakes, respectively. Additionally, Figure 6c, d show the average variance contribution rates of all mining tremor and earthquake records processed by CEEMDAN, respectively. The analysis results indicate that the energy is primarily concentrated in the initial IMFs for both mining tremors and earthquakes. However, for mining tremors, a significant variance contribution rate increase occurs around the fourth IMF component due to the presence of short-period surface waves, indicating a higher amplitude and suggesting that surface waves encompass a major portion of the signal energy. Figures 7, 8 illustrate the decomposed results obtained for mining tremor and earthquake signals, with part (a) representing the components of each IMF for which the presence and separation of surface waves can be observed, while part (b) displays the Fourier spectral analysis corresponding to each component, highlighting the dominant frequency distribution of each IMF component. The waveform characteristics of mining tremors and earthquakes exhibit noticeable differences in their time‒frequency features. The frequency values of mining tremors are typically concentrated in the low-frequency range, indicating a shallow seismic source with developed surface waves and high energy in the low-frequency band. In contrast, the frequency values of earthquakes are distributed more widely in the time‒frequency plot, with longer durations and slower decay processes. This distinction reflects the complexity of the seismic source mechanism for earthquakes, which comprises multiple small ruptures, each with a certain duration process, originating from deeper sources where seismic waves propagate through dense, hard rock formations, resulting in lower energy losses and higher-frequency components, leading to longer-lasting waveforms in the records.

Figure 6. (a) Histogram of the variance contribution rates for mining tremors. (b) Histogram of the variance contribution rates for earthquakes. (c) Histogram of the average variance contribution rates for mining tremors. (d) Histogram of the average variance contribution rates for earthquakes.

Figure 7. (a) Various IMF components of mining tremors and (b) their corresponding Fourier spectra.

Figure 8. (a) Various IMF components of earthquakes and (b) their corresponding Fourier spectra.
4.2 Comparison between the EEMD and CEEMDAN methods
Compared with the other methods, CEEMDAN has the following advantages. First, it is more effective at reducing the degree of mode mixing, providing clearer and more accurate mode decomposition results. Second, by adaptively adjusting the level of noise added, CEEMDAN not only reduces its computational complexity but also improves its decomposition efficiency. Moreover, CEEMDAN better controls the impact of noise during the decomposition process, effectively reducing the false modes introduced by noise. Finally, the adaptive noise addition strategy of CEEMDAN provides greater flexibility and adaptability for handling different types of signals. Figures 9, 10 show that EEMD performs poorly in terms of data mode separation when the white noise level is low, typically only decomposing 1-2 IMFs and struggling to accurately identify surface waves. In contrast, even at low noise levels, CEEMDAN can clearly identify surface waves in the fifth IMF. When the white noise level is too high, the EEMD method is affected by the introduction of too many false modes due to noise, which impacts its ability to effectively calculate variance contribution rates. Additionally, owing to the inconsistent surface wave frequencies contained in seismic waveforms derived from different regions, the ability of EEMD to separate modes when handling data acquired from different regions varies, resulting in ineffective surface wave identification capabilities. In comparison, CEEMDAN, through its improved noise management scheme and adaptive algorithm, exhibits superior mode separation capabilities when handling a large amount of data obtained from different regions, demonstrating greater generality and adaptability.

Figure 9. Mining tremors. (a) CEEMDAN decomposition diagram. (b) EEMD decomposition results produced with the noise level controlled at 0.01. (c) EEMD results produced with the noise level controlled at 0.5.
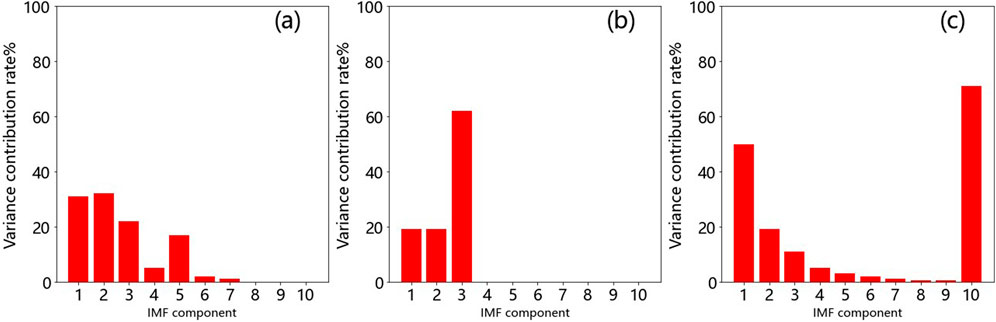
Figure 10. Earthquakes. (a) CEEMDAN decomposition diagram. (b) EEMD results produced with the noise level controlled at 0.01. (c) EEMD results produced with the noise level controlled at 0.5.
4.3 LSTM results analysis
LSTM evaluates the input data via the following metrics: accuracy, which is the proportion of correctly predicted samples out of the total number of samples; the number of true positives (TP), which is the number of positive cases correctly predicted as positive; the number of true negatives (TN), which is the number of negative cases correctly predicted as negative; the number of false positives (FP), which is the number of negative cases incorrectly predicted as positive; and the number of false negatives (FN), which is the number of positive cases incorrectly predicted as negative, as Equation 11.
Loss: This is the difference between the values predicted by a model and the true values, which is usually represented as a numerical value. For this study, the binary cross-entropy loss is used.
Precision: This is the proportion of correctly predicted positive samples out of all samples predicted as positive by the model. It is a metric that measures the accuracy of a model in terms of predicting positive cases, as Equation 13.
Recall: This is the proportion of correctly predicted positive samples out of all actual positive samples. It measures the ability of a model to capture positive cases, as Equation 14.
F1 Score: This is the harmonic mean of precision and recall, which is used to measure the balance between the precision and recall of a model. A higher F1 score indicates better model performance, as Equation 15.
After calculating the variance contribution rates of the IMFs decomposed by CEEMDAN, they are input into a three-layer LSTM model. The analysis results are shown in Table 1.

Table 1. Results obtained on the training and validation sets with LSTM.
During training, the following parameters are selected. The batch size is 12, representing the number of data instances contained in each training batch; the number of epochs is 300, indicating the number of complete passes made by the training data through the neural network; and early stopping is implemented to halt the training process when the performance attained on the validation set does not improve in consecutive epochs or begins to decline. The accuracy function and loss function results are shown in Figures 11, 12. (A) shows the ROC curve, and (B) shows the confusion matrix.

Figure 11. (a) Represents the training accuracy function; (b) Rep-resents the training loss function; (c) Represents the Matthews Correlation Coefficient.

Figure 12. (a) shows the ROC curve, and (b) shows the confusion matrix.
4.4 Comparisons conducted under different data and different models
4.4.1 Comparison among the variance contribution rate inputs of different models
To compare the efficiency of LSTM in terms of classifying earthquakes and mining tremors via variance contribution rates, this study selects a CNN,ViT 2D model and an SVM as baseline methods. The variance contribution rates obtained from the CEEMDAN decomposition process are input into the CNN and SVM for comparison purposes. The ViT-2D (Vision Transformer) model is mainly composed of three parts: patch + position + cls embedding layer, Transformer encoder layer and MLP classification layer, full connection layer [-1,16,128], discard layer and Transformer layer [-1,16,128]. 17,128], identity mapping layer [-1, 128], normalization layer [-1, 128], full connection layer [-1,2]. A CNN is a deep learning algorithm that consists of convolutional layers, pooling layers, fully connected layers, etc., effectively extracting features from data; CNNs are widely used in image recognition and video analysis tasks. An SVM is a supervised learning model used for data classification and regression analysis. It distinguishes different data points by finding an optimal hyperplane. An SVM uses kernel techniques to handle linearly inseparable data and can maintain high accuracy in situations with small samples. The CNN utilizes a two-layer network + a fully connected layer, with 16, 32, and 64 neurons, a convolution kernel size of (2.1), a rate dropout set to 0.5, and an ReLU activation function. The SVM penalty parameter C is set to 0.5, and the employed kernel function is the polynomial kernel. As shown in Table 2 (validation set), LSTM has a significant advantage in terms of handling these data.

Table 2. Comparative results of the four tested models.
After 500 experiments, the 95% confidence interval of the model is (0.9583, 0.9717). Assuming the null hypothesis
4.4.2 Comparison among LSTM and CNN models with different parameter inputs
To verify the superior identification capability of CEEMDAN, different data for identifying mining tremors are input into LSTM for identification purposes, including [1] waveform data from 1 s before and 3 s after the arrival time of a P-wave [2]; waveform data from 1 s before and 14 s after the arrival time of the P-wave [3]; the variance contribution rates of the IMFs decomposed via EEMD; and [4] the dominant frequency. The model selection process is similar to that described above, with accuracy serving as the comparison indicator. The results, as shown in Table 3, indicate that the success rate achieved via CEEMDAN with LSTM is the highest. The accuracy rate of this study was 96.5%, which was higher than the accuracy rate of 91% for classification of natural earthquake and mine earthquake based on ViT 2D model by Shen Jie [33]. Figure 13 shows the classification accuracy of different models with different inputs. From this, it can be clearly seen that ViT-2D can achieve an effect of 91.2% on the data from −1–3 s. However, this is based on the premise of more complete preprocessing of the data and the removal of noise. This step requires a large amount of manual intervention to remove the unavailable data. On the other hand, for the data screened by CEEMDAN features, since it acts on the short-period surface waves for identifying mining tremors, after actual measurement, only simple preprocessing such as baseline calibration and filtering of the original data is needed to complete the identification of mining tremors, and it can also actively remove the unavailable data. In this regard, LSTM has more advantages. The reason is that LSTM has better advantages in exploring the general temporal sequence problems (that is, there is a causal relationship in the development of the sequence), and the variance contribution rates of IMFs are sequences with distinct causal relationships between the preceding and the following. The CEEMDAN-LSTM method has a better prospect for real-time monitoring and classification.

Table 3. Comparison among the results produced with different inputs.

Figure 13. shows the classification accuracy of different models with different inputs.
5 Conclusion and discussion
5.1 Conclusion
This study selected recorded data from different mining tremors and earthquakes that occurred in the Liaoning region and applied the CEEMDAN-LSTM method to classify these events, achieving a high success rate. The following conclusions were drawn from the research.
Previous studies have provided numerous criteria for distinguishing between mining tremors and earthquakes, including the initial directions of P-waves and the dominant frequency. Utilizing only the initial direction of a P-wave as a discriminant indicator makes it difficult to eliminate noise interference in data with high noise levels; similarly, the dominant frequency overlaps with the frequencies of noise when processing data derived from various regions, making it difficult to address the noise interference issue. The method of identifying short-period surface waves through CEEMDAN not only resolves the issue of ambiguous identification criteria but also overcomes the difficulties caused by overlapping noise and surface wave frequencies, significantly improving the success rate achieved when classifying earthquakes and mining tremors.
Mining tremor records are relatively rare, and previous studies have focused mostly on analyzing single events. When addressing a large amount of general, extensive data, the frequency range of surface waves induced by mining tremors significantly fluctuates and overlaps with the frequency range of noise. When the EEMD method is used, effectively separating mining tremor surface waves from noise is difficult. In comparison, the CEEMDAN method can more effectively remove noise and accurately identify surface wave frequencies.
5.2 Discussion and future work
This study demonstrates the efficacy of the CEEMDAN-LSTM model in discriminating mining tremors from tectonic earthquakes. To advance this framework, several avenues merit further investigation. First, enhancing computational efficiency of CEEMDAN decomposition requires integrating advanced spline interpolation techniques and parallelized GPU acceleration via CUDA/OpenCL frameworks, as validated in XGBoost-based seismic classification [16]. This optimization would expedite the extraction of intrinsic mode functions (IMFs), reducing latency in real-time applications. Second, expanding the dataset scope to include multi-source seismic records would improve model generalization, aligning with recent efforts in hybrid data fusion for earthquake early warning [17].
For feature engineering, integrating machine learning algorithms—such as support vector machines (SVM) or random forest (RF)—to exploit CEEMDAN-derived frequency components can enhance discriminative power. Specifically, combining traditional variance contribution rates with time-frequency metrics (Teager energy operator, wavelet packet entropy) and domain-specific indices (P/S amplitude ratios) would enable multi-scale analysis, as demonstrated in hybrid models for microseismic event classification [23]. Additionally, applying adaptive noise reduction techniques (Wiener filtering, wavelet thresholding) during CEEMDAN decomposition could mitigate artifacts from low signal-to-noise ratio (SNR) datasets, improving the fidelity of reconstructed waveforms.
To address scalability challenges, distributed GPU computing frameworks should be adopted to parallelize LSTM training, enabling linear scaling with dataset size. This approach mirrors successful implementations in large-scale seismic intensity estimation [18]. Furthermore, exploring lightweight LSTM variants (e.g., bidirectional LSTM with attention mechanisms) could balance temporal modeling capabilities and computational efficiency, as previously shown in rockburst-prone mine monitoring [23].
Data availability statement
The Japanese waveform data can be downloaded from http://www.kyoshin.bosai.go.jp/. NIED K-NET, KiK-net, National Research Institute for Earth Science and Disaster Resilience, doi: 10.17598/NIED.0004. Requests to access the mining seismic data of Liaoning province should be directed to the corresponding author.
Author contributions
CW: Data curation, Writing – original draft. XZ: Formal analysis, Funding acquisition, Writing – review and editing. WG: Formal Analysis, Project administration, Writing – original draft. FW: Data curation, Writing – original draft. JL: Conceptualization, Data curation, Methodology, Writing – review and editing. ZY: Formal Analysis, Methodology, Software, Supervision, Visualization, Writing – review and editing.
Funding
The author(s) declare that financial support was received for the research and/or publication of this article. This research was financially supported by the Taishan Industrial Experts Program (NO.tscx202408130), Shandong Energy Group (NO. SNKJ2023A18-R02).
Conflict of interest
Authors CW, XZ, WG and FW were employed by Yankuang Energy Group Company Limited.
The remaining authors declare that the research was conducted in the absence of any commercial or financial relationships that could be construed as a potential conflict of interest.
The authors declare that this study received funding from Shandong Energy Group. The funder had the following involvement in the study: data collection and analysis, decision to publish, preparation of the manuscript.
Generative AI statement
The author(s) declare that no Generative AI was used in the creation of this manuscript.
Publisher’s note
All claims expressed in this article are solely those of the authors and do not necessarily represent those of their affiliated organizations, or those of the publisher, the editors and the reviewers. Any product that may be evaluated in this article, or claim that may be made by its manufacturer, is not guaranteed or endorsed by the publisher.
Abbreviations
(CEEMDAN), complete ensemble empirical mode decomposition with adaptive noise; (LSTM), long short-term memory.
References
1. Feng W, Zhen L, Bing L, et al. Characteristics analysis of mining tremors, blasts and (natural) seismic events in Zoucheng area. Seismol Geomagn Obs Res (2013) 34:82–6. doi:10.3969/j.issn.1003-3246.2013.01/02.016
2. Sha L, Jiansi Y, Baofeng T, et al. Study on the identification of blasts, mine collapses, and earthquakes in the Capital Region. Acta Seismol Sin (2012) 34:202–14. doi:10.3969/j.issn.0253-3782.2012.02.007
3. Dong LJ, Wesseloo J, Potvin Y, Li XB. Discriminant models of blasts and seismic events in mine seismology. Int J Rock Mech Min Sci (2016) 86:282–91. doi:10.1016/j.ijrmms.2016.04.021
4. Jianchang Z, Changpeng X, Jinhua Z, et al. Time-frequency analysis of seismic waveforms in mining areas based on S-transform. Seismol Geomagn Obs Res (2014) 35:8–14. doi:10.3969/j.issn.1003-3246.2014.05/06.002
5. Zhang J, Jiang R, Li B, Xu N. An automatic recognition method of microseismic signals based on EEMD-SVD and ELM. Comput Geosci (2019) 133:104318. doi:10.1016/j.cageo.2019.104318
6. Xuesong H, Shiyu L, Ping S, et al. Identification of earthquakes and mining tremors using wavelet packets. China Earthq (2006) 22:425–34. doi:10.3969/j.issn.1001-4683.2006.04.010
7. Bi MX, Huang HM, Bian YJ, Zhou HJ, Chen YY, Zhao J. Study on seismic signal features extraction based on EMD. Prog Geophys (2012) 27:1890–6. doi:10.6038/j.issn.1004-2903.2012.05.008
8. Jinlong C, Shujie L, Donghui G, et al. Spectral characteristics analysis of mining tremors and earthquakes recorded by Hegang Seismic Array. Seismol Geomagn Obs Res (2020) 41:15–26.
9. Ming Z, Shi C, Dave Y. Waveform classification and seismic recognition by convolution neural network. Acta Geophys Sin (2019) 62:374–82. doi:10.6038/cjg2019M0151
10. Mousavi SM, Ellsworth WL, Zhu W, Chuang LY, Beroza GC. Earthquake transformer-an attentive deep-learning model for simultaneous earthquake detection and phase picking. Nat Commun (2020) 11:3952. doi:10.1038/s41467-020-17591-w
11. Zhu J, Li S, Song J, Wang Y. Magnitude estimation for earthquake early warning using a deep convolutional neural network. Front Earth Sci (2021) 9:9. doi:10.3389/feart.2021.653226
12. Zhu J, Li S, Song J. Magnitude estimation for earthquake early warning with multiple parameter inputs and a support vector machine. Seismol Res Lett (2021) 93:126–36. doi:10.1785/0220210144
13. Liu H, Li S, Song J. Discrimination between earthquake P waves and microtremors via a generative adversarial network. Bull Seismol Soc Am (2022) 112:669–79. doi:10.1785/0120210231
14. Zhou Z, Binhua L, Xing J, et al. Study on intelligent recognition of seismic waveforms based on convolutional neural networks. World Earthq Eng (2023) 39:148–57. doi:10.19994/j.cnki.WEE.2023.0038
15. Chen Y, Zhang G, Bai M, Zu S, Guan Z, Zhang M. Automatic waveform classification and arrival picking based on convolutional neural network. Earth Space Sci (2019) 6:1244–61. doi:10.1029/2018EA000466
16. Abdalzaher MS, Krichen M, Fouda MM. Enhancing earthquakes and quarry blasts discrimination using machine learning based on three seismic parameters. Ain Shams Eng J (2024) 15:102925. doi:10.1016/j.asej.2024.102925
17. Abdalzaher MS, Soliman MS, Krichen M, Alamro MA, Fouda MM. Employing machine learning for seismic intensity estimation using a single station for earthquake early warning. Remote Sens (2024) 16(12):2159. doi:10.3390/rs16122159
18. Abdalzaher MS, Moustafa SSR, Farid W, Salim MM. Enhancing analyst decisions for seismic source discrimination with an optimized learning model. Geoenvironmental Disasters (2024) 11:23. doi:10.1186/s40677-024-00284-7
19. Zhang G, Lin C, Chen Y. Convolutional neural networks for microseismic waveform classification and arrival picking. Geophysics (2020) 85:227–40. doi:10.1190/geo2019-0267.1
20. Fan X, Cheng J, Wang Y, Li S, Duan J, Wang P. Intelligent recognition of coal mine microseismic signal based on wavelet scattering decomposition transform. J China Coal Soc (2022) 47:2722–31. doi:10.13225/j.cnki.jccs.2021.1382
21. Chen Z, Ding L, Luo H A method for identifying microseismic events in mines based on improved wavelet decomposition and ELM. J China Coal Soc (2020) 45:637–48. doi:10.13225/j.cnki.jccs.2020.0373
22. Qin C, Zhao W, Jia H, Gao W, Chen Y, Yu W, et al. Microseismic time series prediction method in coal mines based on modal decomposition and deep learning. J China Coal Soc (2024). 1–16. doi:10.13225/j.cnki.jccs.2023.1151
23. Gu X, Zhang C, Guo W, et al. Research on the characteristics and identification of typical microseismic signals in rockburst-prone mines. J China Coal Soc (2024) 1–19. doi:10.13225/j.cnki.jccs.2023.1237
24. Li W. Feature extraction and classification method of mine microseismic signals based on LMD and pattern recognition. J China Coal Soc (2017) 42:1156–64. doi:10.13225/j.cnki.jccs.2016.0888
25. Wu Z, Huang N. Ensemble empirical mode decomposition: a noise-assisted data analysis method. Adv Adapt Data Anal (2009) 01(1):1–41. doi:10.1142/S1793536909000047
26. Hochreiter S, Schmidhuber J. Long short-term memory. Neural Comput (1997) 9:1735–80. doi:10.1162/neco.1997.9.8.1735
27. Allen RV. Automatic earthquake recognition and timing from single traces. Bull Seismol Soc Am (1978) 68:1521–32. doi:10.1785/bssa0680051521
28. Shi R, Yang Z. Feature extraction of multi-rope friction hoist load information based on improved EMD, J. China Coal Soc (2014) 39:782–8. doi:10.13225/j.cnki.jccs.2013.1502
29. Bilal MA, Ji Y, Wang Y, Akhter MP, Yaqub M. An early warning system for earthquake prediction from seismic data using batch normalized graph convolutional neural network with attention mechanism (BNGCNNATT). Sensors (Basel) (2022) 22:6482. doi:10.3390/s22176482
30. Zhang X, Zhang M, Tian X. Real-time earthquake early warning with deep learning: application to the 2016 M 6.0 central Apennines, Italy earthquake. Geophys Res Lett (2021) 48:e2020GL089394. doi:10.1029/2020GL089394
31. Kingma DP, Ba JL. Adam: a method for stochastic optimization. arXiv preprint arXiv:1412.6980. (2015)
32. Loshchilov I, Hutter F. SGDW: stochastic gradient descent with warm restarts. In: International conference on learning representations (2016).
Keywords: mining tremor, complete ensemble empirical mode decomposition with adaptive noise, earthquake early warning, long short-term memory, wave identification
Citation: Wang C, Zhang X, Gao W, Wang F, Lu J and Yan Z (2025) Accurate earthquake and mining tremor identification via a CEEMDAN-LSTM framework. Front. Phys. 13:1510629. doi: 10.3389/fphy.2025.1510629
Received: 13 October 2024; Accepted: 28 April 2025;
Published: 05 June 2025.
Edited by:
Elena Atroshchenko, University of New South Wales, AustraliaReviewed by:
Ali Mehri, Babol Noshirvani University of Technology, IranMohamed S. Abdalzaher, National Research Institute of Astronomy and Geophysics, Egypt
Copyright © 2025 Wang, Zhang, Gao, Wang, Lu and Yan. This is an open-access article distributed under the terms of the Creative Commons Attribution License (CC BY). The use, distribution or reproduction in other forums is permitted, provided the original author(s) and the copyright owner(s) are credited and that the original publication in this journal is cited, in accordance with accepted academic practice. No use, distribution or reproduction is permitted which does not comply with these terms.
*Correspondence: Zhaoyang Yan, OTE2MDU2ODc1QHFxLmNvbQ==