 J. Vega
 R. Castro
- Laboratorio Nacional de Fusión, CIEMAT, Madrid, Spain
Next generation nuclear fusion devices, (for instance ITER), will generate Pbytes of data. To gain knowledge about the nature of thermonuclear plasmas, an in depth analysis of such massive databases is required. Typically, to get statistical relevance in the study of the plasma properties, particular databases around specific plasma events are created. This means their location not only in discharges but also in the corresponding times. In this respect, visualization tools are essential. Of course, manual location of any relevant phenomenology by means of visual analysis is no longer valid. Instead, automatic software based methods are necessary. These methods have to be applied in both real-time and off-line not only for visualization purposes but also for data access. Candidates for their implementation are machine learning techniques.
1 Introduction
In fusion, most of the signals collected in each discharge store the temporal evolution of plasma quantities: time series, evolution of profiles and video-movies. For this reason, a first step to judge the plasma behavior during a shot is to perform visual data analysis (VDA). The VDA can be seen as a high level diagnostic about the plasma evolution. Typically, VDA starts with the inspection of whole signals (from plasma start to extinction). This global visualization allows for recognizing special signatures in the signals: abrupt variations of amplitude, changes in noise distributions, presence or removal of regular structures, sharp peaks and so on. By making zoom in the visualization window around these special signatures, it is possible to find out morphological patterns in the signals that reveal the presence of well-known plasma behaviors, for instance, start of NBI injection, sawtooth activity, edge localized modes (ELMs), confinement transitions or MARFEs among others. However, the long-pulse characteristic of ITER discharges (let’s say 30 min) does not make easy the VDA procedure described above. Moreover, ITER is expected to collect data at 100 Gbits/s, which means to store more than 10 TBytes per discharge.
Therefore, in ITER, the long pulse conditions together with the massive databases generation make necessary the availability of software tools (machine learning based) to accomplish four main objectives to help in the data analysis process. First, to suggest signal segments of potential interest without performing manual searches through VDA. Second, to execute data retrieval based on physics aspects. Third, to carry out automatic location of particular physics events and, fourth, to detect anomalies in signals.
This article reviews and puts together a summary of smart existing software tools to carry out the above four objectives. It should be noted that all those tools were developed by the first author (J. Vega) and co-workers some years ago.
2 Intelligent software tools
For an efficient use of the ITER massive databases, automatic methods for data selection are necessary. It should be noted that the term “automatic” means “minimal human intervention”. This is the main motivation as a consequence of the long pulse characteristic of the ITER discharges. As a general idea to assist scientists in their analysis work, the main objective consists of helping them to focus the attention on possibly relevant time segments without having to look for them in a manual way (by means of VDA or whatever). This can be accomplished by developing software tools that in an automatic way identify and locate possible relevant data, physical events and off-normal behaviors. To this end, machine learning methods are essential elements to create such software tools. However, it is important to emphasize the above term “possible”. “Possible” means that false positive identifications may occur. This is not a problem if the corresponding false positive rate is low. It is better to automatically find out most of the relevant behaviors (even with some false positive) than either missing a large fraction of them or having to perform manual searches. It is important to note that the false positive identifications should be analyzed in order to include “human feedback” to the intelligent data tools.
2.1 Searching for signal segments of potential interest
Physical/engineering events are characterized by local information in the signals either in the time (or space) domain or in the frequency (or spatial frequency/wave number) domain or in both. In the case of temporal evolution signals, abrupt/slow variations are signatures of big/small alterations in the system state. Other signatures can be spikes, transients or special structures located in time. In non-temporal evolution signals, clear signs of events are edges, peaks or textures well-located inside signals. Some years ago, Vega and co-workers developed a Universal Multi-Event Locator (UMEL) technique [1]. UMEL is a universal technique for the automatic location of events in signals. UMEL is “universal”, firstly, because it does not depend on particular physical events. The technique locates those special signatures in the signals that have been mentioned above. Secondly, the “universal” character of UMEL resides in the fact that the technique is exactly the same, independently of the type of signals: waveforms, images or multivariate signals with an arbitrary number of dimensions.
UMEL is based on a specific regression estimation method: Support Vector Machines (SVM). The resulting regressions incorporate the maximum information content provided by the data independently of factors such as sampling period or assumptions about the form of noise. SVM regressions are robust estimates even using sparse data. UMEL is founded in an original interpretation of the support vectors [1]. The support vectors of a regression represent the most difficult samples to regress and their coordinates in the input domain allow determining the location of physical/engineering events.
Figure 1 shows the samples (blue points) of a step function corrupted with noise and its SVM regression (black plain line) with a Radial Basis Function (RBF) kernel. The dashed lines define an insensitive zone (or e-tube). Its width provides the required level of accuracy to approximate a function f(x) by another function f*(x) where f(x) is situated in the e-tube of f*(x). It is important to emphasize that the wider the e-tube the smoother the regression.
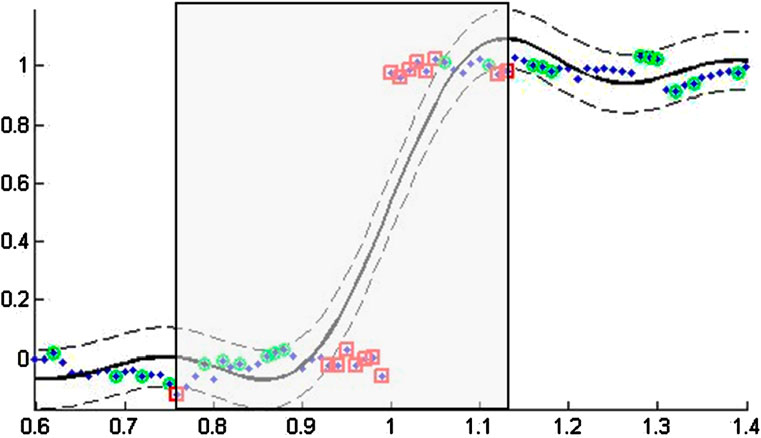
Figure 1. The samples with markers in red are ESV because they cannot be fitted inside a smooth e-tube. They show singular segments of the signal. The gray rectangle defines a relevant temporal segment (in this case an abrupt amplitude change). The segment is defined by the first external support vector and the last external support vector. The axes represent amplitude vs. time, both in arbitrary units.
According to the SVM regression theory, not all samples of the training dataset are necessary to obtain f*(x) [2]. The samples that are required are called support vectors. In the example of Figure 1, only the samples with markers in green (inside the e-tube) and in red (outside the e-tube) are support vectors. In UMEL, the support vectors inside the e-tube are called Internal Support Vectors (ISV) whereas the ones outside the e-tube are called External Support Vectors (ESV). SVM regressions tend to be smooth inside the e-insensitive zone. The ISV are necessary samples for the regression estimation but they have lesser relevance than the ESV for UMEL. The ESV can be considered as outliers because they cannot be fitted inside a smooth e-tube and, therefore, they represent singular characteristics in the signals.
UMEL has shown to be useful in fusion [1] to locate the time instants of sawteeth crashes, to determine the incremental plasma diffusivity according to the time-to-peak method, to identify disruption times and to reveal the presence of hot spots by means of infrared cameras. Moreover, Ref. [3] shows in JET, on the one hand, how to apply UMEL for the automatic location of Edge Localized Modes (ELMs). On the other hand, the previous reference describes the automatic identification of time intervals of potential interest through the analysis of video-movies from an ultra-high-speed visible camera. González et al. [4] also have applied UMEL for the automated analysis of the edge pedestal gradient degradation during ELMs. An in-depth analysis with UMEL for the location of ELMs in the JET database was presented in [5]. Reference [6] presents the use of UMEL in JET diagnostics of both infrared and visible light cameras. UMEL is used to locate generic events, to recognize regions of interest (ROI) in single frames and to study the evolution of these ROI during plasma discharges.
To finish this section, it is important to note that UMEL has been used outside fusion in environmental physics applications [7].
2.2 Searching for data based on physics/engineering aspects
Nuclear fusion diagnostics produce similar signals for reproducible plasma behavior. This means that physical phenomena are translated into signal patterns. Therefore, there is a direct correspondence between physical behaviors and the structural shapes that they generate in the signals. Due to this fact, the standard analysis method is to perform statistical analysis. The objective is to perform statistical inference from a large enough number of similar structural shapes in different discharges. So far, finding similar structural shapes within the database of a fusion device is a manual and tedious procedure in which signals need to be examined individually (typically by means of VDA). However, there are several issues related to this process: manual searches, massive databases, typical scale of the pattern and pulse length. Thus, although human behavior for data analysis is pattern oriented, present tools for data retrieval are not: location of patterns is carried out by means of data inspection. Reference [8] discusses the necessary change of model (from manual searches to automatic searches) to look for data in massive databases and it is summarized in Table 1.
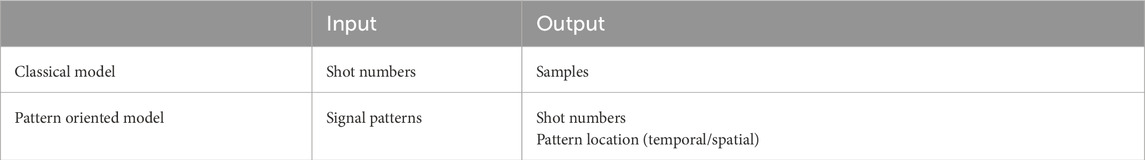
Table 1. Data input and data output according to two different models of data retrieval.
The classical model of data retrieval is to ask the database for shot numbers and signal names and, as a result, signal samples are obtained. A more advanced model in view of long pulse conditions and massive databases is to use patterns of signals as query inputs. The outputs would be the shot numbers and the pattern location (temporal/spatial) within the signals.
To implement the “pattern oriented model”, the searching process has to be efficient. Taking into account the possible high dimensionality problem involved in the search, efficiency means not to traverse the entire database when searching for similar patterns. The use of machine learning methods results essential to develop intelligent mechanisms to reduce the searching space just to the most probable signals of containing a similar pattern [8].
Examples of the pattern oriented model can be to look for similar a) entire waveforms [8], b) specific patterns inside waveforms [9], c) entire images [10] and d) particular patterns within images [10].
The software architecture to implement the “pattern oriented model” can be seen as made up of three-layers [8]. The architecture is shown in Figure 2. The first layer (Application layer) contains user applications, where these applications can be user programs or end user applications. The third layer (Databases) consists of all databases related to the device (physics and engineering ones). The middle layer (Software library layer) comprises software functions to read data from the databases and to send them to the Application layer. The Software library layer covers not only classical libraries to access data but also libraries for intelligent data access based on pattern recognition.
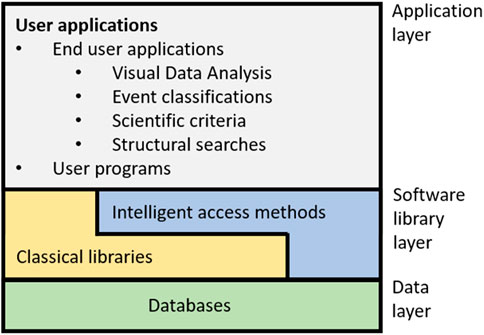
Figure 2. Software architecture to implement a pattern oriented model.
A crucial point to make useful the data retrieval based on the pattern oriented model of Figure 2 is a fast access time to satisfy the user requirement. To this end, the Software library layer has to implement a collection of different machine learning methods to find similar patterns to the one provided by the user. The several methods depend on the type of signal to process: time series or video-movies. The searching process has to be fast enough to provide a reasonable response time (the lesser the better). The term “similar” refers to discover patterns in the database within a short distance (in the mathematical sense) of the user input. Therefore, the output is not only the location of similar patterns but also how similar the patterns are in relation to the input one. A typical similarity measure is the cosine distance. The values vary between 0 (identical patterns) and 1 (completely different patterns). Usual machine learning models for fast data retrieval are unsupervised classification systems.
2.3 Automatic location of particular physics events
During the evolution of discharges, several and varied physical events can arise and can take place at different times and different shots. Some events can be triggered as part of an experimental objective (for instance L/H transitions and internal transport barriers) or they can emerge in an intermittent manner due to the plasma natural evolution (for example ELMs and magnetohydrodynamic instabilities). To analyze the physics involved in these events, ad hoc databases have to be created and one of the main needs is the exact times when the events occur. Determining these times is in general a difficult problem. These times are typically estimated by means of VDA by relating several waveforms of a discharge. Clearly, this manual process is far from being optimal for massive databases. Therefore, techniques for the automatic estimation of the times of specific physical events are essential to speed up the data analysis process and to assure unbiased results.
According to this, it is obvious the need of having big databases from a reduced number of examples. In [11], it is described a machine learning method for the unattended estimation of the L/H and H/L transitions in JET. Also, Ref. [12] describes a completely unattended methodology to generate large databases of L/H transition times in JET using time series.
2.4 Anomaly detections and off-normal behaviors
From the point of view of diagnostics, the long pulse characteristic of ITER will make necessary the continuous monitoring of plasma quantities to identify anomalies and off-normal behaviors in the temporal evolution of discharges. Moreover, the control systems of diagnostics and crucial ITER systems have to be monitored not only during the production of discharges but also at any time. It is important to note that in order to react properly, the recognition of anomalies and off-normal behaviors has to be performed as earlier as possible.
It should be noted that the observation process just described corresponds to a data streaming setting, i.e. data are observed sequentially from their respective sources. The objective of the supervision process can be related to plasma evolution monitoring, quality control, fault detection or system monitoring. From a mathematical point of view, the goal is to signal any change in the data generating process. Due to this fact, it is also known as sequential change point detection procedure.
This problem can be tackled from a machine learning point of view. Methods include the use of instance selection [13], instance weighting [14], ensemble learning [15] and exchangeability tests [16]. Both real-time and off-line methods based on the latter have been described for nuclear fusion applications. A first application [17] was devoted to the automatic recognition of anomalies during the temporal evolution of bolometry profiles in the TJ-II stellarator. The algorithm was tested in a real-time system with FPGAs. A second application [18] was the simulation of the automatic detection of changes in the plasma magnetohydrodynamic activity.
Data availability statement
The datasets presented in this article are not readily available because The data belong to EUROfusion. Requests to access the datasets should be directed to eurofusion.org.
Author contributions
JV: Conceptualization, Investigation, Writing – original draft. RC: Writing – review and editing.
Funding
The author(s) declare that financial support was received for the research and/or publication of this article. This work was partially funded by the Spanish Ministry of Science and Innovation under the Project No. PID2022-137680OB-C31.
Conflict of interest
The authors declare that the research was conducted in the absence of any commercial or financial relationships that could be construed as a potential conflict of interest.
Generative AI statement
The author(s) declare that no Generative AI was used in the creation of this manuscript.
Publisher’s note
All claims expressed in this article are solely those of the authors and do not necessarily represent those of their affiliated organizations, or those of the publisher, the editors and the reviewers. Any product that may be evaluated in this article, or claim that may be made by its manufacturer, is not guaranteed or endorsed by the publisher.
References
1. Vega J, Murari A, González S. A universal support vector machines based method for automatic event location in waveforms and video-movies: applications to massive nuclear fusion databases. Rev Sci Ins (2010) 81:023505. doi:10.1063/1.3302629
3. Vega J, Murari A, Rattá G, González S, Dormido-Canto S. Progress on statistical learning systems as data mining tools for the creation of automatic databases in Fusion environments. Fusion Eng Des (2010) 85:399–402. doi:10.1016/j.fusengdes.2009.10.011
4. González S, Vega J, Murari A, Pereira AJET-EFDA Contributors. Automated analysis of edge pedestal gradient degradation during ELMs. Fusion Sci Technology (2012) 62:403–8. doi:10.13182/FST12-A15339
5. González S, Vega J, Murari A, Pereira A, Beurskens MJET-EFDA Contributors. Fusion Sci Technology (2010) 58:755–62. doi:10.13182/FST10-A10924
6. González S, Vega J, Murari AJET-EFDA Conrtributers. Analysis of video-movies using support vector regression. Fusion Sci Technology (2010) 58:763–70. doi:10.13182/FST10-A10925
7. Gelfusa M, Gaudio P, Malizia A, Murari A, Vega J, Richetta M, et al. UMEL: a new regression tool to identify measurement peaks in LIDAR/DIAL systems for environmental physics applications. Rev Sci Ins (2014) 85:063112. doi:10.1063/1.4883184
8. Vega J. Intelligent methods for data retrieval in fusion databases. Fusion Eng Des (2008) 83:382–6. doi:10.1016/j.fusengdes.2007.09.001
9. Dormido-Canto S, Farias G, Vega J, Dormido R, Sánchez J, Duro N, et al. Search and retrieval of plasma waveforms: structural pattern recognition approach. Rev Sci Ins (2006) 77:10F514. doi:10.1063/1.2219409
10. Vega J, Murari A, Pereira A, Portas A, Rattá G, Castro R. Overview of intelligent data retrieval methods for waveforms and images in massive fusion databases. Fusion Eng Des (2009) 84:1916–9. doi:10.1016/j.fusengdes.2008.11.097
11. Vega J, Murari A, Vagliasindi G, Rattá G. Automated estimation of L/H transition times at JET by combining Bayesian statistics and support vector machines. Nucl Fusion (2009) 49:085023. doi:10.1088/0029-5515/49/8/085023
12. González S, Vega J, Murari A, Pereira A, Dormido-Canto S, Ramírez JM. Automatic location of L/H transition times for physical studies with a large statistical basis. Plasma Phys Control Fusion (2012) 54(19pp):065009. doi:10.1088/0741-3335/54/6/065009
13. Klinkenberg R, Joachims T. Detecting concept drift with support vector machines. In: P Langley, editor. Proc. 17th int’l conf. Machine learning. 494 (2000). p. 487.
14. Klinkenberg R. Learning drifting concepts: example selection vs. example weighting. Intell Data Anal Spec Issue incremental Learn Syst capable dealing concept drift (2004) 8(3):281–300. doi:10.3233/ida-2004-8305
15. Scholz M, Klinkenberg R. Boosting classifiers for drifting concepts. Intell Data Anal (2007) 11(1):3–28. doi:10.3233/ida-2007-11102
16. Ho SS, Wechsler H. A martingale framework for detecting changes in data streams by testing exchangeability. IEEE Trans Pattern Anal Machine Intelligence (2010) 32(12):2113–27. doi:10.1109/TPAMI.2010.48
17. Vega J, Dormido-Canto S, Cruz T, Ruiz M, Barrera E, Castro R, et al. Real-time change detection in data streams with FPGAs. Fus Eng Des (2014) 89:644–8. doi:10.1016/j.fusengdes.2013.12.049
Keywords: machine learning, visual data analysis, intelligent data access, pattern recognition, nuclear fusion
Citation: Vega J and Castro R (2025) Automatic location of relevant time slices and patterns in both signals and video-movies: real-time and off-line visualization. Front. Phys. 13:1538107. doi: 10.3389/fphy.2025.1538107
Received: 02 December 2024; Accepted: 02 April 2025;
Published: 24 April 2025.
Edited by:
Randy Churchill, Princeton Plasma Physics Laboratory (DOE), United StatesReviewed by:
Jaeyoung Park, Tri Alpha Energy, United StatesHugo E. Ferrari, CONICET - CNEA, S. C. de Bariloche, Argentina
David Smith, University of Wisconsin-Madison, United States
Copyright © 2025 Vega and Castro. This is an open-access article distributed under the terms of the Creative Commons Attribution License (CC BY). The use, distribution or reproduction in other forums is permitted, provided the original author(s) and the copyright owner(s) are credited and that the original publication in this journal is cited, in accordance with accepted academic practice. No use, distribution or reproduction is permitted which does not comply with these terms.
*Correspondence: J. Vega, amVzdXMudmVnYUBjaWVtYXQuZXM=