 Rodrigo Castro
 Jesús Vega
- National Fusion Energy Laboratory, Research Centre for Energy, Environment, and Technology, Madrid, Spain
Real-time signal monitoring in high-data-rate environments, such as fusion energy experiments, requires efficient data reduction techniques to ensure timely and accurate visualization. Traditional decimation methods, like the widely used “1 of N,” select points uniformly without considering the signal’s intrinsic characteristics. This approach often results in poor similarity between the decimated and original signals, particularly for high acquisition rate data. This work introduces a novel intelligent decimation method tailored for one-dimensional time-evolving signals. The proposed method dynamically analyzes the signal in real-time to identify regions of high informational content and adaptively determines the most suitable decimation points. By prioritizing signal richness and distributing points more precisely, this method achieves superior fidelity compared to classical decimation, while maintaining or surpassing decimation efficiency. Experimental validation using TJ-II data demonstrates significant improvements in signal similarity, highlighting the potential of intelligent decimation for advancing real-time monitoring in data-intensive scientific environments.
1 Introduction
The ever-growing complexity of fusion energy research experiments poses significant challenges in managing and analyzing experimental data. Modern facilities, such as the International Thermonuclear Experimental Reactor (ITER), are expected to generate unprecedented volumes of data, with over one million variables derived from control signals and diagnostic systems. During a single long-pulse experiment, lasting up to 30 min, ITER is projected to produce data streams exceeding 50 GB per second. Such massive data rates place immense strain on computational resources, storage systems, and data analysis workflows, necessitating the development of innovative methods to ensure efficient and effective access to actionable insights.
One of the most critical tasks in this context is real-time signal monitoring, which involves visualizing the evolution of key signals as an experiment unfolds. This process enables researchers to make informed decisions on-the-fly, ensuring experimental objectives are met and potential issues are addressed promptly. However, real-time monitoring faces unique challenges: the high sampling rates of experimental signals, the vast number of signals being monitored simultaneously, and the potential involvement of multiple users accessing these signals in parallel. Combined, these factors create a scenario where the sheer volume of data exceeds the capacity of traditional systems to process and visualize information efficiently.
Decimation has emerged as an essential functionality to address this challenge. By reducing the number of data points selected for visualization, decimation ensures manageable data sizes for real-time monitoring. Conventional decimation methods, such as the widely used “1 of N″ approach, uniformly select data points at fixed intervals. While computationally efficient, these methods fail to consider the varying informational content of the signals. As a result, critical features of the original signals are often lost, and the resulting visualizations provide limited insights.
To overcome these limitations, this work introduces a novel intelligent decimation method designed specifically for one-dimensional time-evolving signals in real-time applications. Unlike traditional methods, this approach dynamically adapts to the signal’s characteristics, prioritizing regions of high informational richness. By leveraging advanced signal processing techniques, the proposed method achieves higher fidelity in preserving critical signal features while maintaining real-time performance.
This paper details the architecture and implementation of the intelligent decimation system and presents experimental results using data from the TJ-II stellarator at CIEMAT. The findings demonstrate the effectiveness of the proposed approach, showcasing its potential to address the challenges of real-time signal monitoring in data-intensive fusion research environments.
2 A new approach
Signal monitoring in high-data-rate environments often relies on decimation to reduce data volume, allowing only a subset of points to be visualized. Conventional decimation techniques, such as the widely used “1 of N″ method, uniformly sample data at fixed intervals, disregarding the signal’s intrinsic characteristics. While computationally simple, this approach has significant limitations: it fails to account for the non-uniform relevance of data points, particularly in time-evolving experimental signals, where certain regions may contain richer or more critical information. Consequently, classical decimation methods often yield visualizations with poor fidelity to the original signal, impairing the ability to extract meaningful insights.
To overcome these limitations, this work proposes the application of the smart decimation method, which has previously demonstrated its effectiveness as a decimation technique for accessing fusion experimental data [1]. Unlike traditional approaches, the smart decimation method dynamically adapts to the signal’s characteristics, prioritizing regions of higher relevance while maintaining or surpassing the efficiency of conventional methods.
The proposed method receives as input a one-dimensional, time-evolving signal and the number of points required for decimation. Instead of distributing points uniformly, it allocates them proportionally based on a calculated “level of interest” for different time intervals. This level of interest reflects the signal’s complexity or variability, enabling the method to concentrate decimation points in regions of higher informational richness. For instance, intervals containing rapid changes, anomalies, or critical events are assigned more points, while less dynamic regions are downsampled to minimize redundancy.
An example application of this method to a TJ-II bolometry signal is shown in Figure 1. The figure compares the results of the smart decimation method with those of the classical “1 of N″ approach. The first plot illustrates the original signal, which includes noise. The second plot shows the uniform decimation produced by the “1 of N″ method, where points are evenly spaced across the signal, leading to a loss of detail in key regions. The third plot presents the computed “level of interest” function, highlighting two high-interest intervals around timestamps 66,510 m and 66,585 m. Finally, the fourth plot displays the decimation produced by the smart method. Unlike the uniform approach, the smart decimation method concentrates points in the high-interest regions, resulting in a visualization that closely resembles the original signal and effectively emphasizes its critical features.
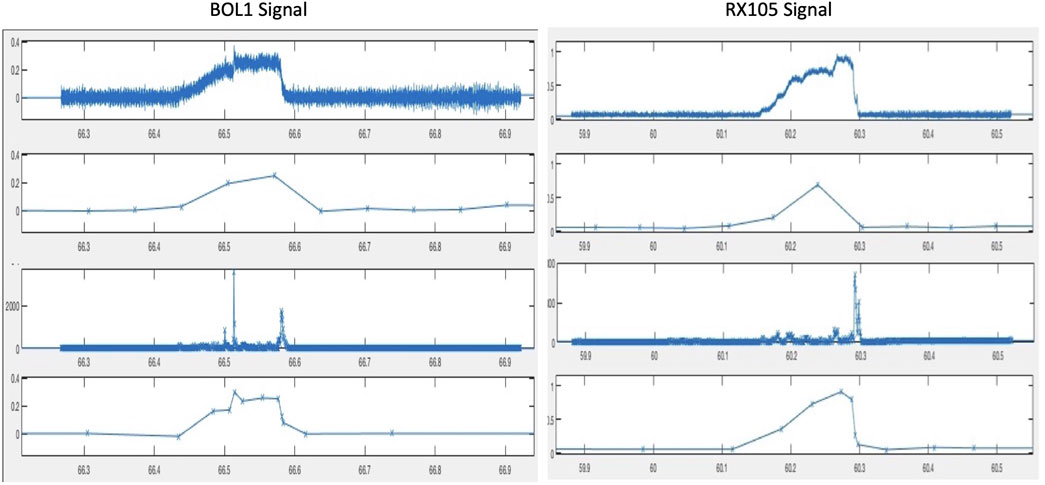
Figure 1. Visual comparative of 1-of-n and smart decimation method in a portion of BOL1 signal. The included graphs are (from top to down): original signal, 1-of-n decimated signal, levels of interest, smart decimated signal.
By dynamically adapting to the signal’s characteristics, the smart decimation method achieves a significant improvement in visualization quality.
3 Smart-decimation for real-time signals monitoring
The primary objective of this work is to demonstrate the application of the smart decimation method in the context of real-time signal monitoring. To achieve this, the implementation must address several critical requirements. The first requirement is related to the display resolution. Although display resolutions have improved significantly with 4K resolutions becoming more common, there is a real limitation on the number of pixels the display window can be wide, so it is a waste of resources to plot many more samples than this limit, as the graph traces end up overlapping. Therefore, the decimation method must optimize data representation within this constraint, ensuring that critical signal details are preserved.
The second requirement is real-time operability. The method must be capable of processing incoming signals at the rate they are acquired, enabling immediate visualization. This requires efficient algorithms that operate with minimal latency, even for high-frequency signals commonly found in fusion experiments.
The smart decimation system processes signals continuously, dividing them into manageable segments or “monitoring steps.” For each segment, the system employs a two-module architecture to optimize decimation. The first module, the Interest Level Analyzer, divides the signal segment in regular intervals and evaluates the complexity and relevance of the signal within each interval, producing two outputs: the number of decimation points to allocate and a quantitative measure of the “level of interest” for the intervals of the analyzed segment. The second module, the Sample Selection Module, utilizes this information to perform the actual decimation. By selecting points that maximize informational content, this module ensures that the resulting visualization is both accurate and efficient.
The two-module design is depicted in Figure 2, which highlights the sequential flow of operations. The Interest Level Analyzer is responsible for detecting high-interest regions in the signal through techniques such as the Standard Deviation of Fourier Spectrum (SDFS) method. This approach identifies regions of complexity or variability, which are prioritized during decimation. The Sample Selection Module then uses this prioritization to allocate decimation points dynamically, ensuring that high-interest regions are densely sampled while less critical regions are sparsely represented. This adaptive approach ensures fidelity to the original signal while adhering to computational and display constraints.

Figure 2. Implementation design diagram of the smart decimation method applied to real-time signal monitoring.
By integrating these modules into a real-time processing framework, the smart decimation system ensures low-latency performance (as it is presented in Table 1), enabling accurate and timely visualization of complex experimental signals. By addressing the challenges posed by limited resolution and high acquisition speeds, it provides a robust solution for visualizing complex data with high fidelity.
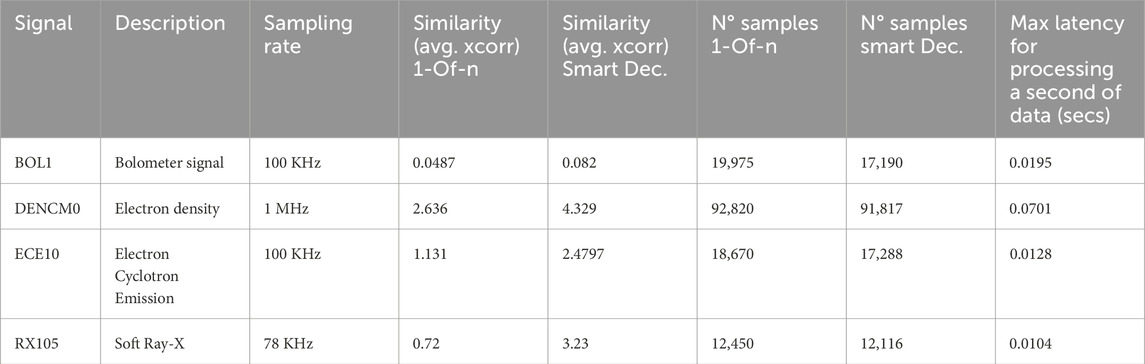
Table 1. Results of decimation comparation between 1-of-n and smart decimation method.
3.1 Interest Level Analyzer
The Interest Level Analyzer is a key component of the smart decimation system, responsible for quantifying the relevance of different intervals of a time-evolving signal. By leveraging advanced signal processing techniques, this module identifies regions of high informational content or complexity, which are subsequently prioritized during the decimation process. The foundation of this analysis lies in calculating the “level of interest” for each interval of the signal, ensuring that the decimation preserves the most critical portions of the data while discarding less relevant information.
3.1.1 Standard Deviation of Fourier Spectrum
The basis of Interest Level Analyzer implementation is the measurement of the level of interest by intervals of the time evolution signal to monitor. For this purpose, it uses the core function of an anomaly detention algorithm that has been successfully applied in the JET disruption detector named APODIS [2, 3] which is based on the “Standard Deviation of Fourier Spectrum” function [4]. Its formula is illustrated in Figure 3. This technique processes a signal or segment of a signal, by dividing it into regular intervals and calculating the anomaly level for each interval. By analyzing the spectral characteristics of the signal, the method identifies regions of high interest, which are then prioritized during decimation. The process consists of the following sequential steps:
1. Fourier Spectrum Calculation: each interval of the signal undergoes Fourier transformation to obtain its spectral components. This step decomposes the signal into its constituent frequencies, providing a detailed frequency-domain representation essential for identifying variations in signal behavior.
2. Removal of the Continuous Component: the continuous (DC) component of the Fourier spectrum, which corresponds to the zero-frequency term, is eliminated. This step ensures that only the dynamic aspects of the signal, which reflect meaningful changes and anomalies, are considered during the analysis.
3. Exclusion of Negative Components: negative frequency components, which are typically redundant in real-valued signals due to symmetry in the Fourier transform, are removed. This further refines the spectrum and reduces computational overhead.
4. Standard Deviation Calculation: the standard deviation of the remaining spectral components is computed. This metric quantifies the variability or “richness” of the frequency content in each interval. High standard deviation values indicate complex or anomalous regions of the signal, making them more relevant for visualization.
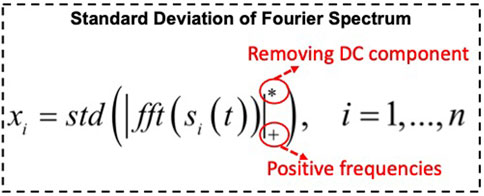
Figure 3. Description of the “Level of Interest” function that is used by the Smart-Decimation method.
The output of this process is a list of interest levels, one for each interval of the signal. These levels serve as a quantitative measure of the signal’s importance over time, enabling the adaptive decimation process. The interval size is a configurable parameter and it must be power of 2. In the work presented, we have used intervals of 16,384 samples in size.
3.1.2 Number of decimation values
The Interest Level Analyzer determines the informational relevance of signal segments (monitoing steps) and dynamically calculates the number of decimation points to allocate for each segment. Segment size is a configurable parameter and depends on desired monitor step size. This adaptive allocation is critical to ensuring that regions with higher complexity or variability are represented with greater fidelity, while less dynamic segments are sampled more sparsely to reduce data redundancy. The calculation of decimation values is governed by a formula designed to balance computational efficiency with the need for accurate visualization:
Where:
• “decNvalues”: The number of decimation points to be used for the current signal segment. This value is calculated by the formula.
• “decNvalues pri”: The a priori number of points allocated to a segment based on general expectations. This parameter is set by configuration and it defines the decimation factor to be applied by the algorithm.
• “decNvalues max”: The maximum number of points permitted for a single segment, maintaining computational and visualization constraints. This parameter is set by configuration. By increasing this value it is possible to regulate the behaviour of the algorithm for very complex segments. For this work the parameter was set = (
• “decNvalues min”: The minimum number of points allowed for any segment to ensure baseline representation. This parameter is set by configuration. For this work the parameter was set = 3
• “intLevels max”: The maximum “level of interest” value calculated for the current signal segment. This value is obtained from the “list of levels of interest” discussed in Section 3.1.1 above.
This formula dynamically adjusts the number of decimation points based on the segment’s complexity, as reflected in its “level of interest.” If a segment exhibits high variability or significant anomalies (i.e., a high intLevels_max), more points are allocated to preserve its details. Conversely, segments with low complexity are assigned fewer points, maintaining efficiency while avoiding unnecessary data overload.
This adaptive approach provides two critical benefits. First, it ensures that the decimation process maintains a high level of fidelity for complex and information-rich regions of the signal. Second, it optimizes resource allocation, ensuring computational and storage requirements remain manageable, even for high-frequency signals in real-time monitoring scenarios.
By dynamically adjusting the number of decimation points, the smart decimation system addresses the limitations of traditional uniform decimation methods. This capability enables the system to prioritize meaningful data while adhering to the practical constraints of real-time visualization and signal monitoring.
3.2 Sample selection module
The Sample Selection Module is a crucial component of the smart decimation system, responsible for translating the prioritized “levels of interest” from the Interest Level Analyzer into an optimized set of decimation points. By intelligently selecting which data points to retain, this module ensures that high-information regions of the signal are preserved with greater fidelity, while less relevant areas are sparsely sampled. This approach not only improves visualization accuracy but also significantly reduces data redundancy.
The module operates in a two-step process. First, it dynamically allocates the number of decimation points based on the previously calculated number. This adaptive allocation is guided by the formula described in the “Number of Decimation Values” section, which ensures a balance between computational constraints and fidelity requirements.
Once the number of points in a segment has been determined, the second step is to select specific points within each interval of the segment. The points are distributed proportionally among the intervals [1]. For intervals of high interest, the algorithm concentrates the points around key features, such as peaks, transitions, or anomalies. For segments of low interest, it samples the data sparsely, while maintaining enough points to preserve the overall signal structure. This dual strategy effectively captures both details and general trends.
3.3 Real time implementation
The successful application of the smart decimation system in real-time scenarios depends on its ability to process high-frequency signals efficiently and produce decimated outputs with minimal latency. Real-time implementation requires not only a robust algorithmic foundation but also optimized computational techniques to handle the stringent demands of data-intensive environments, such as fusion experiments.
Experimental validation of the system’s real-time capabilities was performed using data from the TJ-II stellarator. Table 1 presents latency measurements for processing 1-s segments of signals with different sampling rates, including high-frequency signals up to 1 MHz. The results demonstrate that the system achieves latencies significantly below 1 s, even in the most demanding scenarios. These latencies are well within the typical control loop period, confirming the system’s suitability for real-time monitoring applications.
The ability to maintain low latency without compromising signal fidelity is a cornerstone of the smart decimation system. This capability enables researchers to visualize critical features of high-data-rate signals in real-time, supporting informed decision-making during experiments. By addressing the dual challenges of computational efficiency and data accuracy, the system represents a significant advancement in real-time signal processing for fusion energy research and other data-intensive fields.
4 Results
The effectiveness of the smart decimation method was evaluated using experimental data from the TJ-II stellarator, a flexible Heliac device located at CIEMAT. The performance of the smart decimation method was compared to the conventional “1-of-N″ decimation. The comparison has been performed on a set of commonly used signals (included in Table 1) from different diagnostics and with different sampling frequency and noise characteristics. Due to the ordered length of the TJ-II pulses (0.5 s), long signals have been constructed by concatenating data from a set of pulses. Specifically, experimental data from pulse 46,000 to pulse 47,000 have been considered.
Table 1 summarizes the results of the comparative analysis. The smart decimation method demonstrated significant improvements in cross-correlation values for all tested signals compared to the “1-of-N″ approach. These improvements reflect the superior fidelity of the smart decimation method in preserving the informational richness of the original signals. For instance, in high-frequency signals such as electron density diagnostics, the cross-correlation value more than doubled, highlighting the method’s effectiveness in capturing complex signal dynamics. The table also shows that these improvements in similarity were achieved without increasing, and in some cases even reducing, the total number of decimation points. This underscores the efficiency of the smart decimation method, which selectively allocates points to regions of higher interest while minimizing redundancy in less relevant areas.
Apart from the test result numbers, the differences between the two compared decimation methods are more evident from a visual point of view. Figure 4 presents visual comparatives of the two decimation methods for monitoring the signal BOL1. On the left side of the figure, one can appreciate the significant improvement in the similarity of the resulting signal with respect to the original signal in the case of smart decimation. Likewise, the right side of the figure shows a clear improvement in the total level of similarity for the smart decimation case, without prejudice to the improvement in the number of total values used.
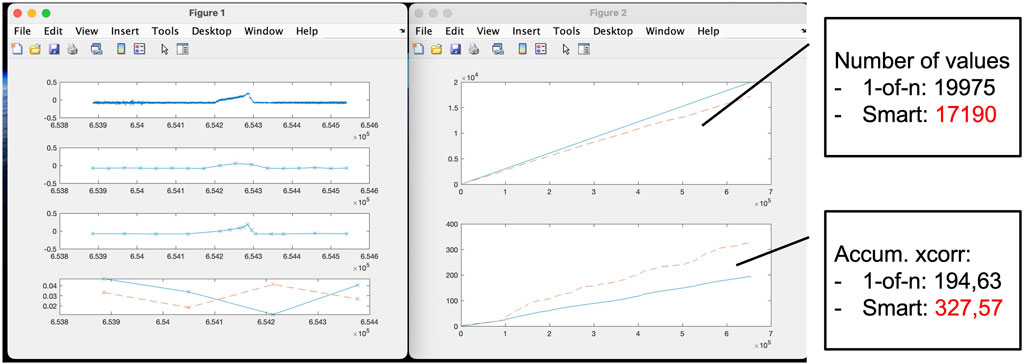
Figure 4. Application used for monitoring decimation methods comparative. Sowed plots from top to down and from left to right: original signal, 1-of-n decimated signal, smart decimation signal, maximum level of interest, accumulative number of values (solid is 1-of-n, dashed is smart decimation), accumulative cross-correlation (solid is 1-of-n, dased is smart decimation).
The visual comparison highlights the practical benefits of the smart decimation method. By focusing on regions of greater informational content, it provides a clearer and more accurate representation of the signal, enabling researchers to extract meaningful insights at a glance.
The real-time capability of the system was also validated during the TJ-II experiments. Latency measurements, included in Table 1, confirm that the smart decimation method processes 1-s segments of signal data well within the control loop period, even for high-frequency signals. These results demonstrate that the system is capable of maintaining low latency without compromising on fidelity, a critical requirement for real-time monitoring applications.
5 Conclusion
The results demonstrate that the intelligent decimation method outperforms traditional decimation approaches in both fidelity and efficiency. By adaptively assigning decimation points based on signal complexity, the method ensures that the most critical signal features are preserved. This capability not only improves the interpretability of the displays, but can also serve to reduce the amount of data that needs to be transmitted for proper monitoring.
The success of the intelligent decimation method in preserving signal fidelity and maintaining real-time performance highlights its potential as a transformative tool for signal monitoring in data-intensive environments such as fusion energy research. These promising results pave the way for future work demonstrating its utility for signal monitoring in new fusion devices, such as ITER.
Data availability statement
The raw data supporting the conclusions of this article will be made available by the authors, without undue reservation.
Author contributions
RC: Conceptualization, Data curation, Formal Analysis, Funding acquisition, Investigation, Methodology, Resources, Software, Supervision, Validation, Visualization, Writing–original draft, Writing–review and editing. JV: Conceptualization, Data curation, Formal Analysis, Funding acquisition, Investigation, Methodology, Resources, Software, Supervision, Validation, Visualization, Writing–original draft, Writing–review and editing.
Funding
The author(s) declare that financial support was received for the research and/or publication of this article. This work was partially funded by the Spanish Ministry of Science and Innovation under the Project No. PID2022-137680OB-C31.
Conflict of interest
The authors declare that the research was conducted in the absence of any commercial or financial relationships that could be construed as a potential conflict of interest.
Generative AI statement
The author(s) declare that no Generative AI was used in the creation of this manuscript.
Publisher’s note
All claims expressed in this article are solely those of the authors and do not necessarily represent those of their affiliated organizations, or those of the publisher, the editors and the reviewers. Any product that may be evaluated in this article, or claim that may be made by its manufacturer, is not guaranteed or endorsed by the publisher.
References
1. Castro R, Vega J. Smart decimation method for fusion research data. Fusion Eng Des (2020) 159:111814. doi:10.1016/j.fusengdes.2020.111814
2. López JM, Vega J, Alves D, Dormido-Canto S, Murari A, Ramírez JM, et al. Implementation of the disruption predictor APODIS in JET’s real-time network using the MARTe framework. IEEE Trans Nucl Sci (2014) 61(2):741–4. doi:10.1109/RTC.2012.6418168
3. Vega J, Dormido-Canto S, López JM, Murari A, Ramírez JM, Moreno R, et al. Results of the JET real-time disruption predictor in the ITER-like wall campaigns. Fusion Eng Des (2013) 88(6–8):1228–31. doi:10.1016/j.fusengdes.2013.03.003
Keywords: data monitoring, decimation, ITER, data visualization, data acquisition, control system, big data
Citation: Castro R and Vega J (2025) Smart decimation method applied to real-time monitoring. Front. Phys. 13:1541060. doi: 10.3389/fphy.2025.1541060
Received: 06 December 2024; Accepted: 21 March 2025;
Published: 07 April 2025.
Edited by:
Randy Churchill, Princeton Plasma Physics Laboratory (DOE), United StatesReviewed by:
Teddy Craciunescu, National Institute for Laser Plasma and Radiation Physics, RomaniaTorrin Bechtel Amara, General Atomics, United States
Copyright © 2025 Castro and Vega. This is an open-access article distributed under the terms of the Creative Commons Attribution License (CC BY). The use, distribution or reproduction in other forums is permitted, provided the original author(s) and the copyright owner(s) are credited and that the original publication in this journal is cited, in accordance with accepted academic practice. No use, distribution or reproduction is permitted which does not comply with these terms.
*Correspondence: Rodrigo Castro, cm9kcmlnby5jYXN0cm9AY2llbWF0LmVz