 Lynda Boukela
 Julien Branlard
 Annika Eichler
- 1Deutsches Elektronen-Synchrotron DESY, Hamburg, Germany
- 2Hamburg University of Technology, Institute of Control Systems, Hamburg, Germany
The European X-Ray Free Electron Laser is the largest particle accelerator for X-ray laser generation worldwide. To ensure a safe and efficient operation, the plant uses various monitoring systems, especially in the linear accelerator. The low-level radio frequency system has shown reliability in diagnostics, particularly in quench detection. A quench refers to a superconducting radio frequency cavity losing its superconductivity and possibly causing a downtime. The diagnostics solution, however, can be enhanced in terms of robustness and functionality. Currently, the focus is on integrating artificial intelligence to improve quench identification. Thus, a lightweight machine learning-assisted approach targeting FPGA deployment is developed. It relies on the augmentation of a physical model-based anomaly detection approach with neural network models to distinguish the quenches from the other anomalies. This paper presents the solution in which neural architecture search is applied, and elaborates on how visualizing and analyzing the anomaly detection results can provide critical insights for both short-term diagnostics and long-term pattern identification.
1 Introduction
The European X-Ray Free Electron Laser (EuXFEL) is the largest particle accelerator for X-ray laser generation worldwide. It spans over 3.4 km in Hamburg, Germany, and serves several hundred users each year. The interdisciplinary researchers benefit from an extremely intense laser light generated at a rate of
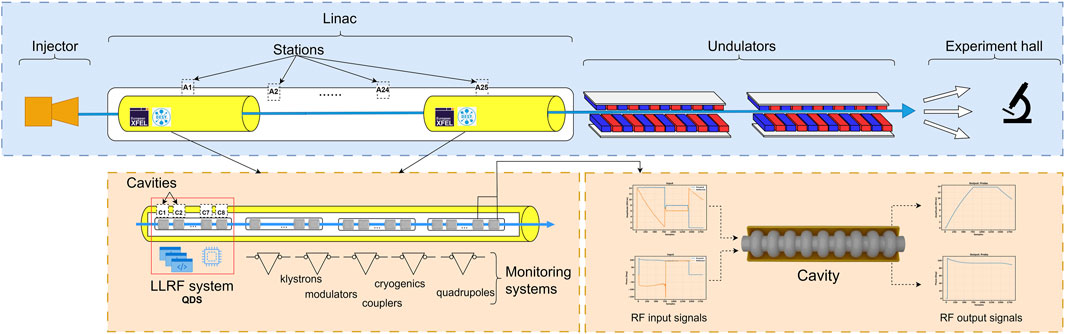
Figure 1. Overview of the EuXFEL with a focus on the SRFCs location within the stations and the linac.
The safe and efficient operation of large and complex facilities, such as the EuXFEL, is crucial for successful experiments by the users. Anomalous behaviors are encountered daily in different areas of the plant. Thus, various monitoring systems were deployed during commissioning. At the linac, the low-level radio frequency (LLRF) system controls and monitors the SRFCs. It ensures a stable accelerating field, averaging 23.6 MV/m, additionally, it diagnoses the radio frequency (RF) signals and other measurements to report any anomaly and to trigger countermeasures accordingly. However, under certain conditions, these systems can be inflexible and suffer from robustness issues. Therefore, upgrades and improvements have been continuously conducted, with a recent growing focus on artificial intelligence (AI) techniques. These techniques have also been explored in other facilities for anomaly classification and prediction. For example, quenches are classified through decision trees and neural networks at the relativistic heavy ion collider (RHIC) [1]. At the continuous electron beam accelerator facility (CEBAF), a long short-term memory-convolutional neural network is developed to predict faults in the accelerating cavities [2].
Downtime can occur when an SRFC loses its superconductivity due to a quench. When an SRFC exceeds its maximum sustainable gradient, it quenches and transitions to a normal conducting state. This translates to a loss of the gradient and a drop in the quality factor
2 Preliminaries
The electromagnetic and mechanical dynamics of the SRFCs are modeled with the input forward signal, which corresponds to the RF signal driving the cavity and the output probe signal, which corresponds to the RF signal coupled out from the field inside of the cavity. The influencing parameters are the detuning, which is the delta between the driving and the resonance frequencies, and the half bandwidth, which is an indicator of an SRFC sensitivity towards the detuning [8]. This model has been used to develop a parity space-based method for anomaly detection. The method captures inconsistencies relative to the expected outputs in the form of residuals, which are subsequently evaluated with the GLR. When the latter exceeds a predefined threshold, it indicates a fault occurrence with high probability [4],
where
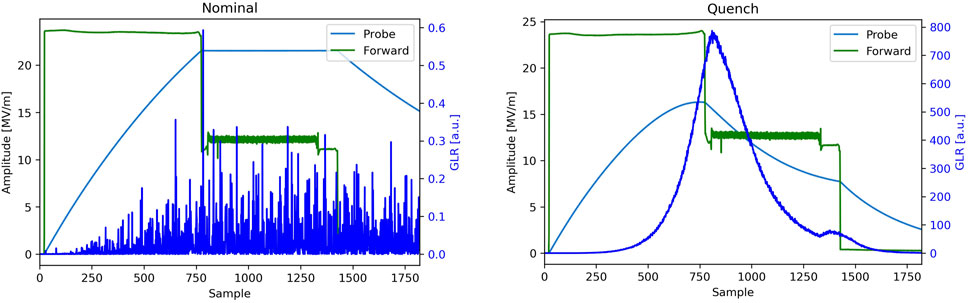
Figure 2. Illustrative examples of the SRFC behavior under different conditions. The input forward signal, which corresponds to the RF signal driving the cavity and the output probe signal, corresponding to the RF signal coupled out from the field inside of the cavity. (Left) RF waveforms and GLR obtained under a nominal condition of the SRFC, the GLR is a noisy signal not exceeding the threshold. (Right) RF waveforms and GLR obtained under a quenching condition of an SRFC. This is characterized by a loss in the accelerating gradient (drop of the probe) from approximately 23 MV/m to 17 MV/m. It has been noticed that a bell-shaped GLR corresponds to a quench, with different peak values (approximately equal to 800 in this example), and therefore different center points within the pulse.
The GLR can be augmented with different lightweight ML models in order to distinguish quenches from other anomalies. Preliminary results with a clustering solution based on k-medoids have been obtained [6]. Given
and
where
3 Methodology
We use an MLP, which is a type of artificial neural network consisting of multiple fully-connected layers of neurons, an input layer, one or more hidden layers, and an output layer. Each neuron in a layer is connected to every neuron in the previous and next layer, making the network fully connected. When provided with a new anomalous GLR trace
To build the two MLPs, data from 2021 to 2022 have been exploited. A total of
The second approach searches for the model hyper-parameters by leveraging NAS with the evolutionary optimization as tuner (see Figure 3). The architecture evaluation is designed as a hardware-agnostic multi-objective optimization. It rewards higher area under the curve of the receiver operating characteristic (AUROC), given the binary classification problem, and it penalizes higher floating point operations per second (FLOPs) in order to enhance the model efficiency. We therefore define an objective function as a weighted sum of AUROC and normalized FLOPs,
where,

Figure 3. Flow of the neural architecture search to learn the MLPs.
4 Results
With the manually crafted experiment,
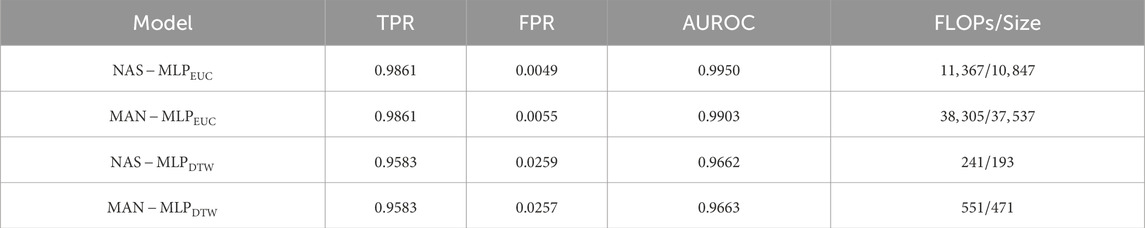
Table 1. Evaluation results of the different MLPs.
Visualizing and exploiting results of the anomaly detection helps to gain and communicate insights. Postmortem data, consisting of hundreds of RF pulses, are collected daily and saved to HDF5 files corresponding to station events. The ML-assisted analysis provides a comprehensive view of the stations and SRFCs affected within a rolling 24-h period, as illustrated in Figure 4 (Left). This is useful for continuously diagnosing short-term issues and addressing them promptly by the LLRF experts. On the Figure, we can read for example, that one cavity is affected from station A4 on the 25th of March 2024 at 13:33. This has generated two faulty pulses and these are identified as quenches. We are also tracking the fault labeled as “missing signal”, which is triggered when one of the RF signals used in the GLR computation is not available, leading to erroneous GLR waveforms. These daily results are saved and rendered through the web and emails where more details are given, especially plots of the RF signals, to help the LLRF experts to gain a clearer understating of the anomalies. Long-term insights help capture patterns over time and space. For instance, identifying which SRFCs quench more frequently and determining when we experience more quenches. For the latter, as depicted in Figure 4 (Right), which has been obtained based on expert-corrected AI findings, a positive correlation is noticed between the operational energy and the number of quenches, as higher energies scheduled at the end of each half-year usually induce more quenches, in 2022, it is clearer in the second half of the year, where in November a total of 18 quenches has been recorded. Exceptions happen, for instance in April where the number of quenches is 21.
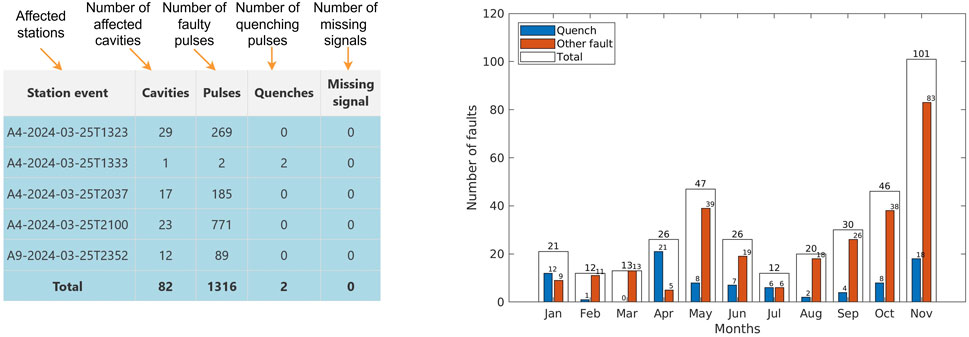
Figure 4. Leveraging AI output to gain insights across different time scales. (Left) Summary of SRFC anomalies from daily reports on 25 March 2024 where the affected stations, the number of faulty cavities and pulses, in addition to the type of anomalies are shown. (Right) Distribution of quenches and other SRFC anomalies from the yearly reports for 2022.
5 Discussion
The handcrafted experiment led to a directed but limited search over architectures that satisfy the provided structural constraints. In contrast, the ability of NAS to explore and evaluate a wide range of architectures explains its better performance. The current implementation is based on software running on offline data, a firmware implementation for an online deployment on FPGA has also been initiated. To meet the constraints for edge deployment while maintaining high detection performance, the NAS has shown to be an effective approach for lightweight model learning. The overall AUROC has also been maintained acceptable, and slightly improved with EUC, mainly as an impact of the number of false positives. A deeper analysis of a tolerable rate of false alarms is however needed to finalize the model selection. Additionally, the specifications of the targeted firmware need to be explored and eventually incorporated into the learning loop. More algorithms can also be explored to detect additional SRFC anomalies, with an emphasis on human-AI collaborative approaches to achieve adaptive and continual learning. Incorporating these new anomalies to the daily reports in Figure 4 would help the experts to quickly identify the eventual root cause or the affected subsystems. Moreover, this will help understand the other faults of the long-term analysis and find correlations.
Data availability statement
The original contributions presented in the study are included in the article/supplementary material, further inquiries can be directed to the corresponding authors.
Author contributions
LB: Writing – original draft, Writing – review and editing. JB: Writing – review and editing. AE: Writing – review and editing.
Funding
The author(s) declare that financial support was received for the research and/or publication of this article. This work was funded in the context of the R&D program of the European XFEL.
Acknowledgments
The authors acknowledge support from DESY (Hamburg, Germany), a member of the Helmholtz Association HGF. The authors thank Jan Horst Karl Timm, Christian Schmidt and Nicholas Walker for their input.
Conflict of interest
The authors declare that the research was conducted in the absence of any commercial or financial relationships that could be construed as a potential conflict of interest.
Generative AI statement
The author(s) declare that no Generative AI was used in the creation of this manuscript.
Publisher’s note
All claims expressed in this article are solely those of the authors and do not necessarily represent those of their affiliated organizations, or those of the publisher, the editors and the reviewers. Any product that may be evaluated in this article, or claim that may be made by its manufacturer, is not guaranteed or endorsed by the publisher.
References
1. Einstein-Curtis J, Drees K, Edelen J, Kilpatrick M, Laster J, O’Rourke R, et al. Classification and prediction of superconducting magnet quenches. In: 19th international conference on accelerator and large experimental Physics control systems (2024). p. 856–9.
2. Rahman MM, Carpenter A, Iftekharuddin K, Tennant C. Accelerating cavity fault prediction using deep learning at jefferson laboratory. Machine Learn Sci Technology (2024) 5:035078. doi:10.1088/2632-2153/ad7ad6
3. Branlard J, Ayvazyan V, Hensler O, Schmidt C, Schlarb H. Superconducting cavity quench detection and prevention for the European XFEL. In: 14th international conference on accelerator and large experimental Physics control systems (2013). p. 1239–41.
4. Eichler A, Branlard J, Timm J. Anomaly detection at the european X-ray Free Electron Laser using a parity-space-based method. Phys Rev Acc Beams (2023) 26:012801. doi:10.1103/PhysRevAccelBeams.26.012801
5. Nawaz A, Pfeiffer S, Lichtenberg G, Rostalski P. Anomaly detection for the European XFEL using a nonlinear parity space method. In: 10th IFAC symposium on fault detection, supervision and safety for technical processes (2018). p. 1379–86.
6. Boukela L, Eichler A, Branlard J, Jomhari NZ. A two-stage machine learning-aided approach for quench identification at the European XFEL. In: 12th IFAC symposium on fault detection, supervision and safety for technical processes (2024). p. 402–7.
7. Rumelhart DE, Hinton GE, Williams RJ. Learning representations by back-propagating errors. nature (1986) 323:533–6. doi:10.1038/323533a0
8. Schilcher T. Vector sum control of pulsed accelerating fields in Lorentz force detuned superconducting cavities. Hamburg, Germany: University of Hamburg (1998).
9. Kaufman L, Rousseeuw PJ. Finding groups in data: an introduction to cluster analysis. New York, USA: John Wiley and Sons, Inc (1990).
10. Elsken T, Metzen JH, Hutter F. Neural architecture search: a survey. J Machine Learn Res (2019) 20:1–21. doi:10.5555/3322706.3361996
11. Microsoft. Neural network intelligence (NNI) (2024). Available online at: https://github.com/microsoft/nni (Accessed January, 2024).
Keywords: anomaly detection, particle accelerators, neural architecture search, data visualization, superconductivity
Citation: Boukela L, Branlard J and Eichler A (2025) Exploring NAS for anomaly detection in superconducting cavities of particle accelerators. Front. Phys. 13:1553993. doi: 10.3389/fphy.2025.1553993
Received: 31 December 2024; Accepted: 05 May 2025;
Published: 30 May 2025.
Edited by:
Didier Mazon, CEA Cadarache, FranceReviewed by:
Simone Spampinati, National Laboratory of Frascati (INFN), ItalyÁ. Sánchez-Villar, Princeton Plasma Physics Laboratory (DOE), United States
Copyright © 2025 Boukela, Branlard and Eichler. This is an open-access article distributed under the terms of the Creative Commons Attribution License (CC BY). The use, distribution or reproduction in other forums is permitted, provided the original author(s) and the copyright owner(s) are credited and that the original publication in this journal is cited, in accordance with accepted academic practice. No use, distribution or reproduction is permitted which does not comply with these terms.
*Correspondence: Lynda Boukela, bHluZGEuYm91a2VsYUBkZXN5LmRl; Annika Eichler, YW5uaWthLmVpY2hsZXJAZGVzeS5kZQ==