 Yaowen Zhang
 Wei Cui*
- School of Economics and Management, China University of Geosciences, Beijing, China
Introduction: The scale of default on credit bonds in China has been expanding. Credit bond defaults not only increase the financing costs of enterprises but also affect the efficiency of debt issuance and even lead to the spread of risks in the financial market. Accurately identifying bond default risks, clarifying the characteristics of bond defaults, and understanding the default risk mechanism are of crucial importance.
Methods: This paper takes corporate credit bonds as the research object and analyzes bond defaults from both macro and micro perspectives. From a macro perspective, it confirms the logical transmission between macro factors and bond defaults through causal relationships and grasps the overall characteristics of bond defaults by combining association rule mining and descriptive statistical research methods. Bonds are divided into a risk-free bond group and a risky bond group, and association rules are mined in four dimensions: the bond issuance region of the enterprise, whether the issuer is listed, the attributes of the issuing enterprise, and whether the enterprise bond is guaranteed. Based on these rules, a cross-analysis of bond risk factors is conducted. From a micro perspective, taking each bond as the research object, a bond default identification system is established, and default predictions are made based on the ensemble learning algorithm. The important characteristics of default bonds are analyzed from the perspective of whether the issuer is a state-owned enterprise, and further cause difference analysis is conducted.
Results: The results show that M1 and M2 have an impact on bond defaults, and the ensemble machine learning algorithm can accurately predict bond default risks and obtain key factors for bond risk identification. It is reasonable to choose macro indicators to predict bond defaults.
Discussion: Based on the experimental conclusions, this paper discusses and analyzes the bond risk evolution process and the reasons for risk concentration in certain industries, which is helpful for a comprehensive understanding of bond default risks. Our research can provide tool references and guidance for risk management in the actual bond market.
1 Introduction
The bond market is an important component of the capital market. The effective operation of the bond market not only provides financing convenience for market participants but also promptly reflects the operational status of the real economy.
Chinese corporate bond issuance, which began in 1984, started late but has grown rapidly to become the world’s second largest bond market. Investors know little about the bond market compared to other forms of financing. The bond market is very sound and low risk for most investors. For a long time, Chinese credit bonds have been regarded as risk-free investment tools by investors, but with the improvement of the marketization degree of Chinese bonds, bond defaults began to appear, and the first case of corporate bond defaults occurred in 2014. Chinese corporate bonds have had a 10-year default history since November 2014, when the first case of “Chaori bonds” actually defaulted. At present, defaults are gradually becoming normal, credit risks are spreading across industries, and market players have stopped unreasonable “risk-free” expectations for Chinese corporate bonds.
By the end of 2023, the total value of outstanding bonds in China’s bond market had grown to 155.75 trillion yuan. Starting from 2018, the market witnessed a significant rise in bond defaults. The year 2019 marked the highest number of defaults, with 207 bonds failing to meet their obligations, totaling 166.187 billion yuan. Although the number of defaults dropped slightly in 2020, the total value of defaulted bonds hit its peak at 188.462 billion yuan that year. Following this period, while the overall scale of defaults has shown some reduction, even high-credit-rated companies and centrally-administered state-owned enterprises—typically considered lower-risk entities—have also faced default incidents. This development is likely to have a more profound impact on the credit bond market environment. Bond default will lead to capital loss, market risk intensification, credit risk spread, deterioration of credit environment, reduce investors’ investment participation in the bond market, and even lead to systemic financial risk. Therefore, it is very important to analyze and forecast the credit risk factors of bonds. China’s corporate bond defaults deserve attention.
As for the prediction methods of bond default, the earliest statistical and quantitative methods are Z-score model [1] and KMV model [2], etc. The statistical and quantitative methods of bond default are developed on the improvement of these models. In recent years, with the development of big data, machine learning algorithms have been applied in the field of credit prediction. Bao et al. [3] found that compared with the majority of existing studies that mainly aim to explain sample fraud and emphasize causal reasoning, the predictive model constructed by ensemble learning can predict accounting fraud more accurately. In the establishment of the bond default system, the current research generally selects the macro environment of the enterprise directly as the predictive index of the machine learning algorithm, while ignoring the causal relationship between the selection of macro indicators and bond default. Therefore, this study integrates causal inference with machine learning techniques to systematically analyze the causal relationships between macroeconomic indicators and bond defaults. It employs machine learning algorithms for predicting bond default risks and validates the effectiveness of the selected macroeconomic indicators through feature importance analysis.
The bond market is a crucial link in the transmission of monetary policy. China is in the process of interest rate liberalization. Grasping the risks in China’s bond market and clarifying the causal relationship between monetary and financial variables, macroeconomic variables and bond defaults is of great significance.
This study focuses on credit bonds issued by Chinese companies from 2014 to 2022 as the research sample, encompassing corporate bonds, enterprise bonds, medium-term notes, and short-term financing bonds. Bonds that are in default or have been extended are regarded as risky bonds, while bonds that mature normally are considered risk-free bonds. By using causal inference to analyze the causal relationship between macroeconomic indicators and bond defaults, and at the same time providing a reference for the selection of the timing of predictive indicators, machine learning techniques are utilized to predict bond default risks, and the effectiveness of the selected macroeconomic indicators is verified through feature importance analysis. The main experiments are as follows [1]: Conduct an empirical analysis on the impact of macroeconomic factors such as macro monetary policies and the economy on bond defaults through causal inference to explore whether there is a causal relationship between macroeconomic factors and bond defaults [2]. On the basis of descriptive statistics and association rule mining of the attributes of bonds themselves, find the associated features of bond defaults [3]. Process and construct the risk indicator system, and build a bond default risk early warning model through machine learning algorithms. The main innovations and contributions of this paper are as follows [1]: In the selection of indicators, it empirically proves the causal relationship between macroeconomic indicators and bond default [2]; Association rule mining is applied to analyze the relevant characteristics of risk bonds, and the distribution characteristics and rules of risk bonds are obtained [3]; Based on the results of association rules, the combination learning model is used to make group prediction and factor analysis of bond credit status, so as to grasp the differences, and prove that the prediction accuracy of combination learning on bond default is improved compared with the single classification model.
2 Literature reviews
Bond risk identification is the prediction and assessment of the credit status of bond issuance. The following reviews the existing research results from three aspects: the selection of indicators for bond default prediction, including financial and non-financial indicators; the risk transmission between monetary policy and financial markets and causal analysis and machine learning.
In terms of the selection of financial indicators, in 1968, the American economist Beaver [4] was the first to use financial analysis indicators to predict the default of corporate bonds and credit, and to create a univariate financial early warning model with the idea of regression analysis. Altman [5] established a default probability prediction model to predict the default probability of enterprises according to the ratio of retained earnings to total assets and other financial indicators. Douglas A et al. [6] found that net cash flows from operating activities, investing activities and financing activities are important sources for enterprises to repay debts. Sun [7] selected eight parts such as financial structure, growth level and profitability when identifying the financial distress of enterprises.
Beaver [8] argued that relying solely on financial factors to study bond default risk is inadequate due to challenges in obtaining accurate and reliable financial information. The research by Sadiq et al. [9] further suggests that the macroeconomic environment significantly influences corporate credit risk. In terms of the selection of non-financial indicators, Chava and Jarrow [10] found industry factors can affect the operation, profitability and development of enterprises in the same industry and industry cycle, and thus lead to bond default. Wu [11] selected three levels of non-financial indicators: macro, industry and enterprise. Eugene [12] and Wilson [13] discovered that when the macroeconomic environment is favorable, per capita disposable income grows more rapidly, which in turn leads to an increase in investment expenditure. The demand for bond investment rises, and enterprises have a stronger ability to repay principal and interest on bonds, with a lower risk of default. Lu Jun et al. [14] found that macroeconomic indicators such as GDP, CPI and M1 growth rate of narrow money supply had a significant impact on companies falling into financial crisis. Chen [15] studies the relationship between macroeconomic environment and credit risk; At the macro level, LIU [16] selected CPI, social financing scale, market interest rate and so on.
Bonds belong to corporates’ debt; debt repayment ability is closely related to the liquidity of enterprises. Money supply is a measure of market liquidity, it has an important impact on the price of various assets in the financial market, and its change will directly affect the economic environment. China’s infrastructure projects account for a large share of the economy, money supply tends to outpace economic data. Fan et al. [17] studied the relationship between the excess rate of return of bonds and macroeconomic variables, and believed bond prices and market interest rates were mutually determined, and market interest rates were affected by factors such as money supply M1 and actual consumption. Through empirical evidence, they proved that changes in market interest rates might affect the expected excess rate of return of bonds. Based on the Merton structured model and the data of China from 2000 to 2010. Dai and Sun [18] studied the factors affecting the credit spread of corporate bonds in China’s Shanghai and Shenzhen bond markets, and came to the conclusion that the issuance of M1 had a positive impact on the credit spread of corporate bonds. The fluctuation of stock index can indicate the current macroeconomic situation of economy and society to a certain extent, and the major changes of economic data will be reflected in the stock index. The stock market index is the vane of the stock price market, so the stock market index can also indicate the macro-economic situation.
In the selection of machine learning metrics, the causal relationship between metrics is a problem that should be given due attention. Some scholars have attempted to verify the relationship between the indicators and the predicted targets through causal relationship tests. In the field of transportation, Zhang et al. [19] studied the traffic speed of taxi in Changsha, China’s urban road network, and tested the spatiotemporal causality between various links through nonlinear Granger causality, providing reliable guidance for MTL model to select information features from the whole network link. Luo [20] applied nonlinear Granger causality test to explore the causal relationship between traffic areas, built a multi-task deep learning model framework with long short-term memory (LSTM) as the core neural unit, and verified it with New York City taxi trip data. In the field of economics and finance, Wei et al. [21] selected the three variables with the highest correlation with the exchange rate among 16 macroeconomic variables including import, export and foreign exchange reserves through Granger causality test analysis, and used KELM to make a medium-term forecast of RMB against US dollar. The results show that the set learning method based on KELM outperforms all other benchmark models in different prediction periods. Xu et al. [22] combined Granger causality test with support vector machine and found that among the 15 stocks studied, the after-hours collective sentiment of nine stocks had a strong predictive effect on stock price changes the next day. In the field of medicine, Almalaq et al. [23] use Granger causality test to determine the activation region related to the verbal fluency task in human EEG, and train the classifier between subjects with Parkinson’s disease and healthy control group in combination with support vector machine (SVM). In the field of physics, H et al. [24] introduced Granger causality to analyze the relationship between sensor variables, and selected variables with greater Granger causality relationship with sensor loss data as the input vector of the extreme learning machine. In the field of ecological environment, Vazquez-Patino et al. [25] explored the improvements in interpretability and robustness of models using causal selection predictors, comparing three cause-based methods with ML’s four standard predictor selection methods using rainfall data from the Andean basin in Ecuador. Li et al. [26] screened the key environmental factors affecting sea ice concentration based on causal relationship (KGC), and used a variety of machine learning (ML) algorithms to make short-term sea ice prediction.
The literature reviewed highlights the related factors of bond risks and the application of causal analysis in machine learning. It is evident that scholars across various fields emphasize the importance of the correlation between selected indicators and the target when applying machine learning and deep learning algorithms. Through an analysis of the factors influencing corporate bond defaults, it has been found that key factors related to identifying corporate bond credit status include the financial metrics of the enterprise itself, which are the most representative indicators of its operational conditions. Non-financial indicators, such as macroeconomic factors, have also garnered attention from relevant scholars. Based on these findings, this paper employs causal analysis to select critical predictive indicators in the field of bond risk identification to validate the effectiveness of the chosen macroeconomic factors. Additionally, association mining is incorporated to describe the characteristics of risk aggregation. On this foundation, financial data and associated macroeconomic factors are selected, and ensemble learning algorithms are utilized to predict the credit status of specific bonds issued by enterprises, thereby enhancing the accuracy of identification. The main contributions of this paper lie in the following aspects: In terms of algorithm selection, traditional methods (such as logistic regression and probit models) perform poorly in handling nonlinear relationships and complex data structures. They have limited capacity to process high-dimensional data and are unable to capture the interactions among variables. We employed multiple ensemble machine learning algorithms and selected the optimal model through comparative analysis, significantly improving the prediction accuracy. In the construction of the indicator system, previous studies typically used only a single data source, lacking the integration of multi-source data. We developed a multi-dimensional bond default identification system that integrates macroeconomic indicators and market data, providing more comprehensive data support. Regarding the selection of macro indicators, previous studies often directly incorporated macro indicators into the prediction model without clarifying their relationship with bond defaults. This paper aims to demonstrate the causal relationship between macroeconomic indicators and bond defaults.
3 Research design and methodology
This article conducts bond risk identification. From a macro perspective, We use Granger causality test to analyze the causal relationship between macroeconomic indicators and the amount of bond default, and association rule mining is used to grasp the risk characteristics of bonds. From a micro perspective, individual bond samples are taken as the research objects. Combined with combinational learning classification algorithm, credit default problems of corporate bonds issued by companies in China are predicted. We select the data of corporate credit bonds issued by Chinese companies from 2014 to 2022. Including short-term financing bills, corporate bonds, enterprise bonds, medium-term notes, and asset-backed securities The main research objectives are divided into three parts: First, for the selected macroeconomic factors, we apply co-integration test and Granger test to verify the causal relationship between macroeconomic and bond default; Secondly, since most machine learning algorithms have limited interpretation of text type indicators, we use association rule mining algorithm to carry out visual cross-analysis of the characteristics of defaulted bonds, and grasp the distribution of default risk from a macro perspective. Finally, based on the verified results, we use the combinatorial learning model to forecast corporate bond default, compare the forecast results before and after adding macro factors, and conduct in-depth analysis of default factors. (Figure 1).
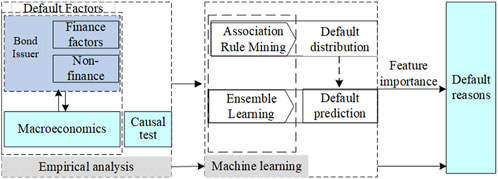
Figure 1. Experimental flow chart.
3.1 Causal analysis
VAR constructs the econometric analysis model by taking each endogenous variable in the economic system as a function of the other endogenous variables and their lagging values. It can deal with the estimation problems caused by endogenous variables as explained variables, identify and estimate the interdependence of endogenous variables or interactive spillover relationships. In Formula 1, yt is a k-dimensional endogenous variable, xt is an exogenous variable, p is the number of lag periods, A and B respectively represent matrices composed of estimated coefficients, and
3.2 Algorithm and evaluation index
APRIOR is used for association rule mining, APRIOR is a frequently used algorithm for mining frequent itemset, which was formally proposed by Agrawal et al [27]. In 1994. It features multiple scans of the database, a large scale of candidate items, and high computational cost for support calculation. By adopting an iterative approach, the algorithm steps are divided into two parts: “connection” and “pruning”.
The reasons for choosing decision trees as the base learners are as follows: Compared with linear regression and other methods, decision trees have no strict requirements for data distribution, are robust to missing and noisy data, and can automatically handle and reduce the impact of outliers. Compared with neural network algorithms, decision tree models have an intuitive structure, are easy to interpret and visualize, provide a clear decision path for research problems, and have strong interpretability. Compared with algorithms such as KNN, they can efficiently handle high-dimensional data and reduce the influence of redundant features. Ensemble learning improves model performance by combining multiple base learners. Compared with a single machine learning model, ensemble learning integrates the prediction results of multiple models to reduce the bias and variance of a single model, thereby improving overall prediction accuracy. By majority voting or weighted averaging, it reduces the influence of data noise, thus having stronger robustness to noisy data and outliers. A single model may overfit the training data, while ensemble learning achieves a balance between model complexity and generalization ability by integrating the prediction results of multiple models. The research purpose of this paper is to identify the key factors of bond default and find an algorithm that can accurately predict bond default in practice. Given the robustness, interpretability, efficiency, and flexibility of decision tree ensemble algorithms, we choose the decision tree-based ensemble learning algorithm to predict bond risk.
Bagging and Boosting combined learning algorithms are used. Bagging is a homogeneous estimator composed of many decision trees. Boosting base learner construction has a sequence [28]. Bond risk prediction employs decision trees, the bagging algorithm based on decision trees - random forest, and boosting algorithms based on decision trees, including Xgboost, Catboost, GBDT and Hist-GBDT. GBDT (Gradient Boosting Decision Tree), also known as MART (Multiple Additive Regression Tree), The concept consists of Regression Decision Tree (DT), Gradient Boosting (GB) and Shrinkage. GBDT constructs a set of weak learners that add up the results of multiple decision trees as the final predictive output. GBDT iterates the model through gradient descent to reduce the impact of the cost function. By calculating the negative gradient of the loss function to construct residuals, it gradually reduces the value of the loss function, thereby obtaining increasingly accurate learners. GBDT can be expressed in the Equation 2. Xgboost consists of two parts: empirical risk and structural risk (regularization term), and it uses the forward stagewise algorithm to gradually optimize the classifier. Xgboost can be expressed as Equation 3. By effectively processing categorical features and introducing ranking boosting strategies, CatBoost addresses gradient bias and prediction shift issues [29]. CatBoost can efficiently handle class quantities, prevent overfitting, and train models with high accuracy. Its built-in algorithm can automatically transform categorical features into numerical features, and combine features according to the intrinsic relationship of features to enrich the feature dimension. Its biggest characteristic lies in its ranking idea. HistGradientBoostingClassifier uses histogram data structure to arrange data samples implicitly, and only the largest split nodes are considered in the tree building process, so the number of split nodes is small, and only the initial input data needs to be sorted. Most parts of the HistGradientBoostingClassifier algorithm are implemented in parallel, which can effectively improve the construction efficiency of base classifier.
Common evaluation metrics in machine learning include confusion matrices and AUC curves. Bond risk assessment is a binary classification problem, so a confusion matrix can be used to represent the four possible outcomes of model operation, namely, FP, TP, FN, and TN, as shown in Table 1. Through the confusion matrix, accuracy, precision, recall, and F-score can be calculated.
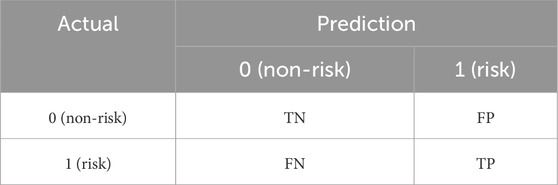
Table 1. Confusion matrix.
Accuracy is the ratio of the number of correctly predicted samples to the total number of samples (Formula 4). Precision is the ratio of the number of samples predicted as positive and actually positive to the total number of samples predicted as positive (Formula 5). Recall is the ratio of the number of samples that are truly positive and correctly predicted as positive to the total number of samples that are actually positive (Formula 6). False positive rate is the ratio of the number of samples predicted as positive but actually negative to the total number of samples that are actually negative (Formula 7). The F1 score is the harmonic mean of precision and recall (Formula 8). The horizontal axis of the ROC curve is the false positive rate, and the vertical axis is the recall rate. The area under the ROC curve is denoted as AUC. Generally, when AUC >0.5, the model results are considered meaningful. Recall and AUC are used to evaluate the accuracy of classification models. Before conducting machine learning experiments, parameter optimization is required. The goal of parameter optimization is to improve the prediction accuracy by optimizing the model’s hyperparameters, prevent overfitting, and enhance the model’s generalization ability. We use grid search and cross-validation in Python’s scikit-learn, with AUC as the evaluation metric, to determine the reasonable values of hyperparameters. By traversing the predefined parameters, the parameters with the best performance are selected. The detailed parameter adjustment results are shown in Table 2.
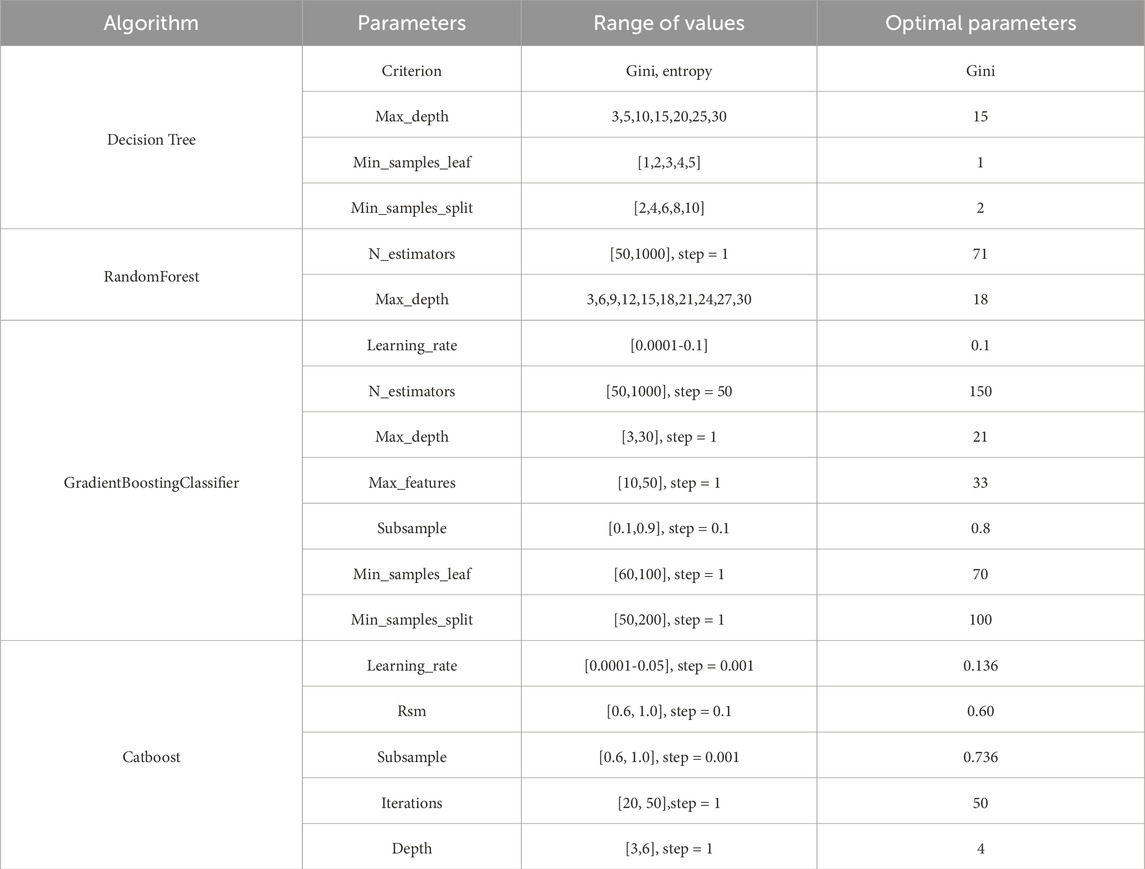
Table 2. Optimal parameters.
4 Data and analysis
The research data of this article is sourced from Wind database and the National Bureau of Statistics of China. Table 3 is the descriptive statistics of the data. Through the analysis of literature review and the sorting out of the evolution process of bond risks, the factors selected in this article include macroeconomics, bond characteristics, local economy, industry characteristics, and the financial status of bond issuers. When analyzing the financial bond market, macroeconomic indicators and market indices are important influencing factors. M1 and M2 are key indicators for measuring the money supply. The changes in M1 and M2 directly affect market liquidity and interest rates, thereby having a significant impact on the bond market. CPI is an important indicator for measuring the level of inflation. Inflation expectations directly affect bond yields and prices. Based on the previous studies by Lu et al., Fan et al., and Dai and Sun, monetary indicators and CPI can affect bond defaults, so we incorporate them into the macroeconomic dimension. The economic environment of the region where the bond issuer is located is also an important influencing factor, so we include local GDP in the local economic dimension. At the same time, the characteristics of the bond itself cannot be ignored. The financial status of the bond issuer includes six aspects: capital structure, profitability, cash flow, debt-paying ability, operational ability, and development ability. There is an inherent correlation and synchronous change among financial indicators, and the contribution of financial indicators will affect the stability, explanatory power, and predictive performance of the model. Therefore, we conducted a correlation test and deleted the correlated indicators with a correlation coefficient greater than 0.6. We used the indicators that passed the correlation test to construct a bond risk identification index system (Table 4). Based on the principles of systematisms, scientific, and feasibility of the indicators, after data processing, a total of 10,516 bond data were obtained, including 657 default samples. The training set and test set were divided in a 7:3 ratio.

Table 3. Results of descriptive statistics.

Table 4. Bond risk indicator system.
4.1 Granger causality test
The purpose of the stability test is to assess whether these time series data are stationary. Stationarity tests were conducted on the default rate, M1, M2, and CPI for each quarter from 2014 to 2022. After first-order differencing, the time series of all variables became stable (Table 5). We select the reciprocal distribution of feature roots to verify the stationarity of VAR. When the reciprocal of feature roots is distributed in the unit circle, the model is stable. The results show that all the reciprocal of the characteristic roots are within the unit circle (Figure 2), indicating that the model is stable. Additionally, we conducted the ADF test (Table 6), and the ADF statistics of all variables are significant, suggesting that the data series is stable. Therefore, the stability of the VAR has been fully verified. The VAR system meets the conditions for impulse response analysis.
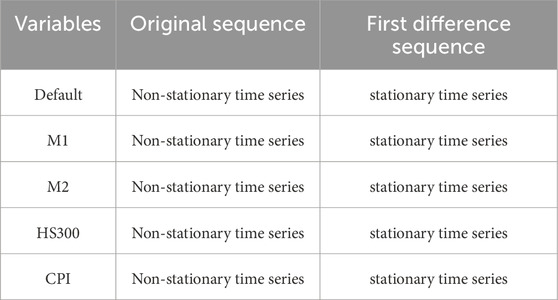
Table 5. Stability test.
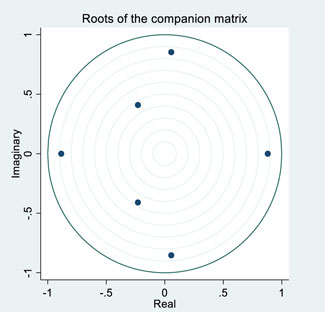
Figure 2. VAR stability test.

Table 6. ADF test results.
The cointegration test of Default, M1 and M2 is carried out. The trace test results and the maximum eigen Root results show that the cointegration relationship between variables is significant (Table 7; Table 8). Table 9 shows the selection results of the optimal lag order. LR = 4, FPE, AIC, HQIC, SBIC = 2. According to the characteristics of each index, the lag order is determined as 2. The data is quarterly, which takes into account the causal relationship between factors with a lag of 6 months and defaults. According to the results of cointegration test, Granger causality test is used to explore the causal relationship between the above variables. The results are shown in Table 10. M1, M2 have an impact on bond default respectively, while M1 and M2 have an impact on the overall system respectively. Default only has an impact on M1. Therefore, there is a two-way causal relationship between M1 and the default amount of bonds, and a one-way causal relationship between M2 and the default amount. M2 has an effect on M1, while M1 has no effect on M2.
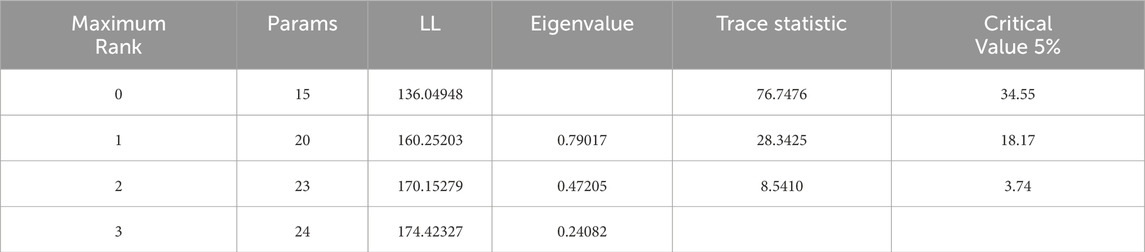
Table 7. Trace test of Default, M1 and M2.
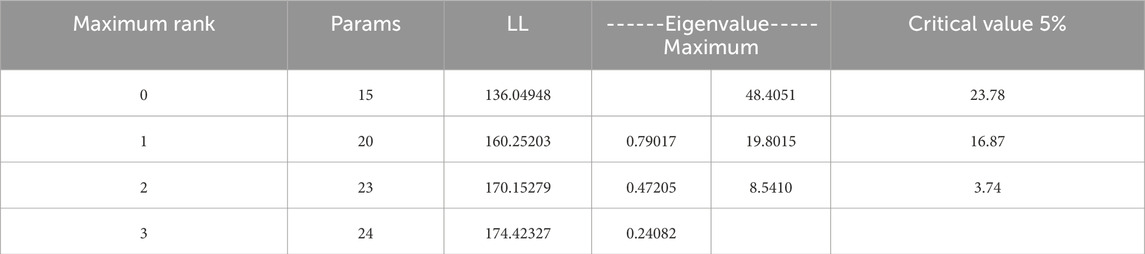
Table 8. Default, M1, M2 maximum characteristic root test.
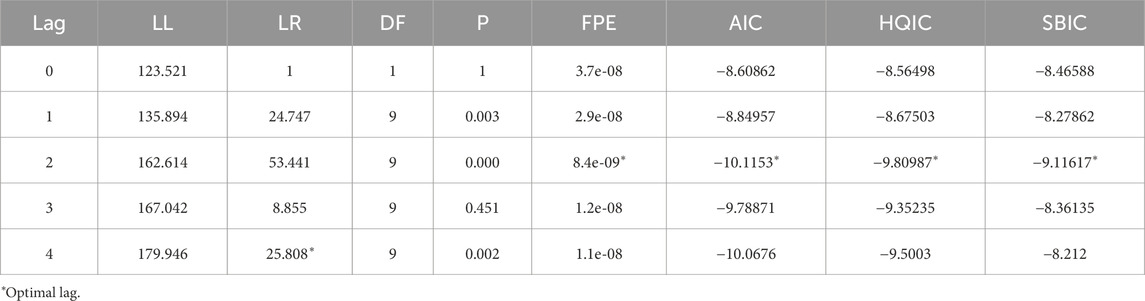
Table 9. D.lnDefault D.lnM1 D.lnM2 Optimal lag order.
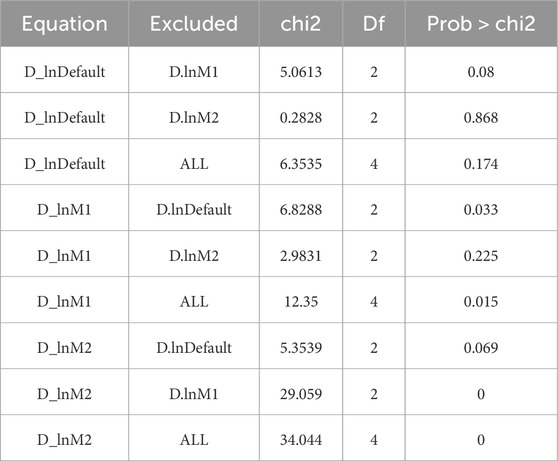
Table 10. M1, M2 and Default Granger causality test.
The impulse response graph is shown in Figure 3. The horizontal axis of the impulse response function represents the lag period, and the vertical axis reflects the response fluctuation level of the target variable to the unit shock. The solid line and the shaded area represent the impulse response function. Based on the corresponding impulse images, we analyzed the response process of M1 and M2 to default. The impact of M1 on default generally shows periodic fluctuations, with positive and negative effects being symmetrical. When M1 changes, default first responds positively and then moves in the opposite direction, with a period of approximately 2, that is, 1 year. After moderate symmetrical fluctuations, it tends to converge. Compared with M1, the response path of M2 to the default amount has smaller fluctuations. When the impact of M2 on default does not exceed 1 year, default first rises slowly in a positive direction and then drops in a negative direction. After that, the fluctuation period of the impact gradually shortens. Based on the above findings, we demonstrated the connection between macroeconomic monetary indicators and bond risk and sorted out the risk evolution process (Figure 4). Loose monetary policy leads to an increase in the money supply, thereby enhancing market liquidity, reducing financing costs, easing credit conditions, and gradually affecting the short-term and long-term debt repayment capabilities of enterprises; the strengthening of economic activities, the rise in asset prices, and the improvement in consumer demand will further enhance the debt repayment capabilities of enterprises. We also verified the monetary supply and credit transmission mechanism through impulse response analysis.
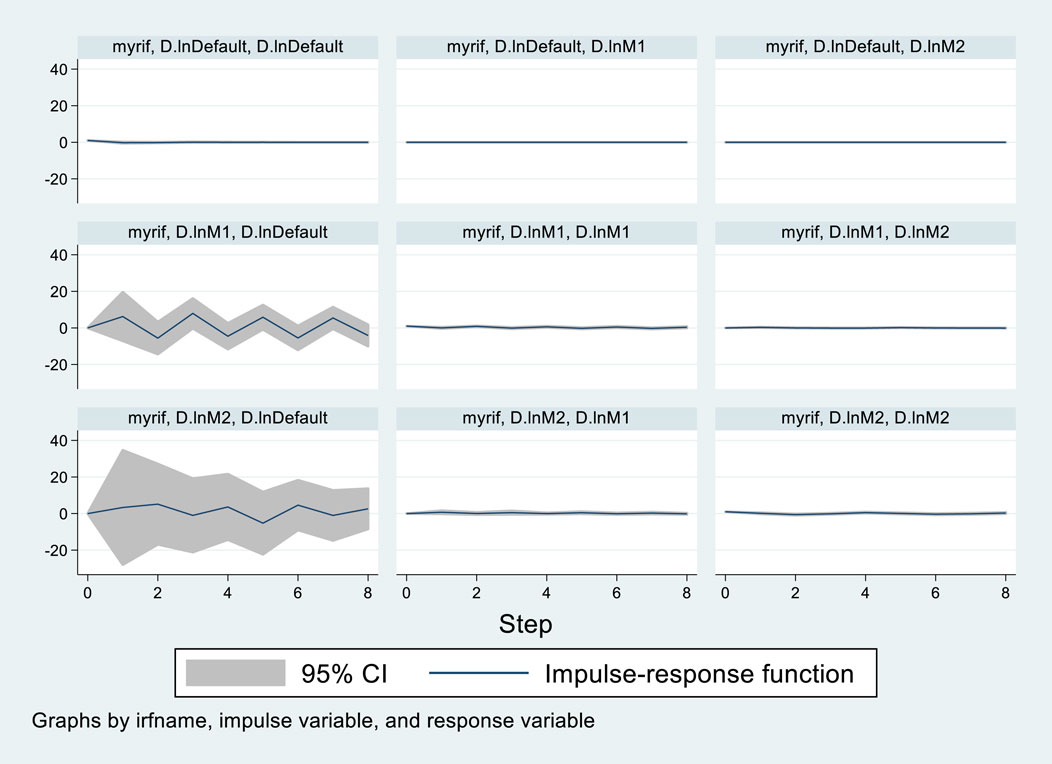
Figure 3. Default and M1 and M2 pulse response.
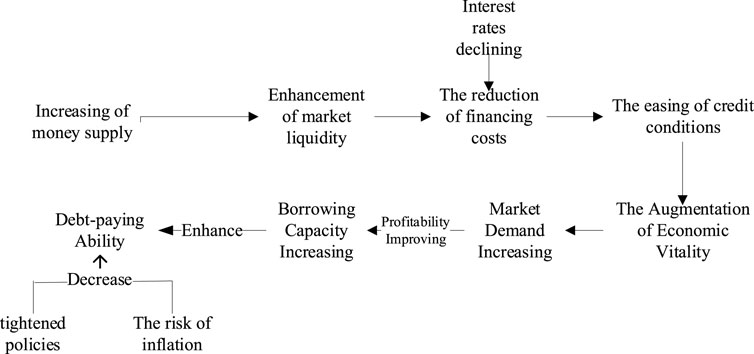
Figure 4. Macro risk transmission map.
Following the above steps, we explore the impact of stock market factors on bond market and the impact of CPI on bond default. The pulse response plots and results are shown in Figure 5. The impact of CPI on bond default lasts for a long time. From the overall trend, the pulse effect given by CPI firstly have a negative impact on default, and then tend to be positive. HS300 index is selected as the characteristic index of stock market. There is Granger causality between HS300 and default. Under the influence of HS300, default first shows a relatively rapid negative change and then changes into a positive change, with a cycle of about 3 quarters. After a positive and negative influence appears alternately, the influence on the default amount tends to be stable.
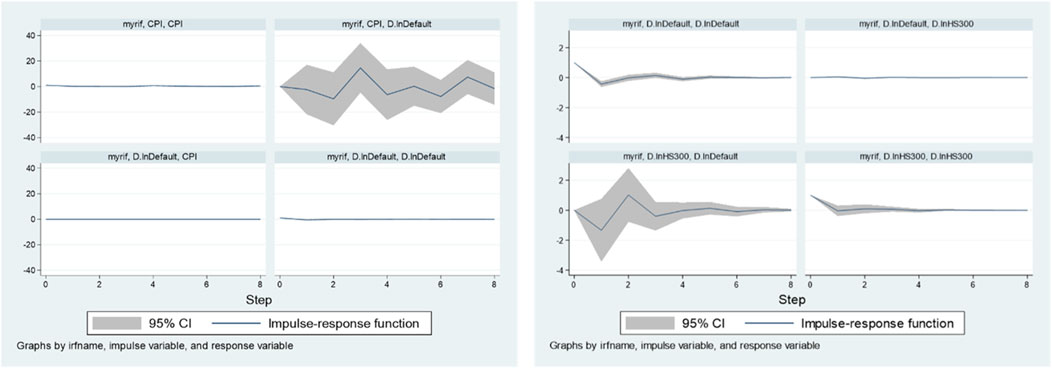
Figure 5. Default and CPI, Default and HS300 pulse response.
4.2 Characteristic analysis of defaulted bonds
Based on credit status, corporate bonds can be classified into matured bonds and defaulted bonds. By comparing the five attributes of the issuer’s location, company characteristics, primary industry, whether there is a guarantor, and whether the issuer is a listed company, we analyzed the characteristics of defaulted bonds and obtained the association rules with the highest support, confidence, and lift values, as well as the attribute frequency ranking, between matured bonds and defaulted bonds. The association rules for risky bonds are shown in Table 11, and those for risk-free bonds are presented in Table 12. Based on the risk bond association rule, we observe that the credit risk of corporate bonds is more concentrated in four key industries: real estate, materials, discretionary consumption, and industrial sectors (Table 13). Utilizing association rules, we conduct a cross-statistical analysis of company attributes and issuer locations across these four industries. Overall, non-listed issuers exhibit higher risk levels compared to their listed counterparts in each industry.
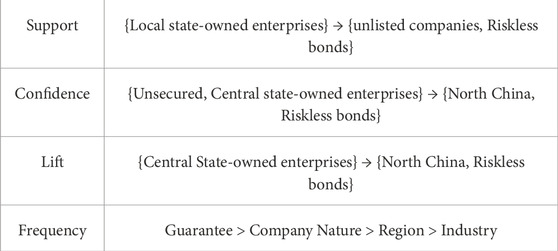
Table 11. Riskless bond association rules.
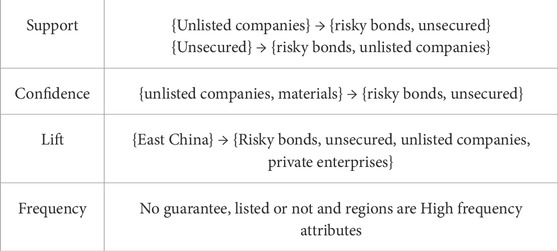
Table 12. Risk bond association rules.
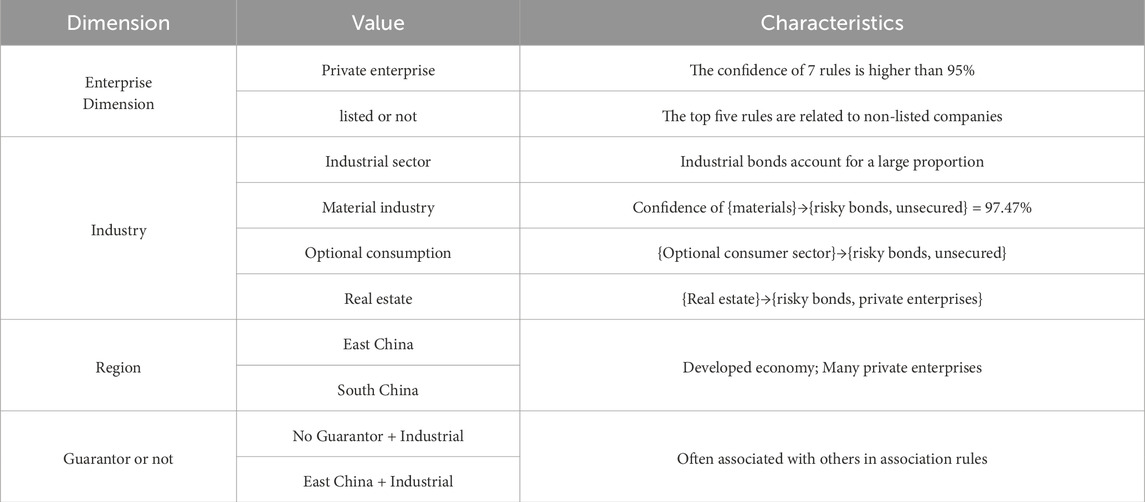
Table 13. Risk bonds strongly associated attributes.
The results of the cross-tabulation analysis of risk bonds with listing status and geographic distribution attributes for the industrial, real estate, consumer discretionary and materials sectors are shown in Figure 6. The risk of listed companies in the optional consumption sector is lower than that of unlisted enterprises, and unlisted private enterprises in South China and central state-owned enterprises in North China are particularly worthy of attention. The risks of corporate bonds in the real estate industry are primarily concentrated within private enterprises. Whether the issuing entity is listed or not has a negligible impact on risk discrimination. The bonds issued by non-listed private enterprises in North China, East China, and South China, as well as those issued by listed private enterprises in North China, South China, and Southwest China, entail relatively significant risks. Nevertheless, the bonds issued by non-listed Sino-foreign joint venture real estate enterprises have lower risks than those issued by wholly foreign-owned enterprises in the real estate sector. The bonds issued by non-listed Sino-foreign joint venture real estate enterprises in Northeast China encounter the least risk exposure.
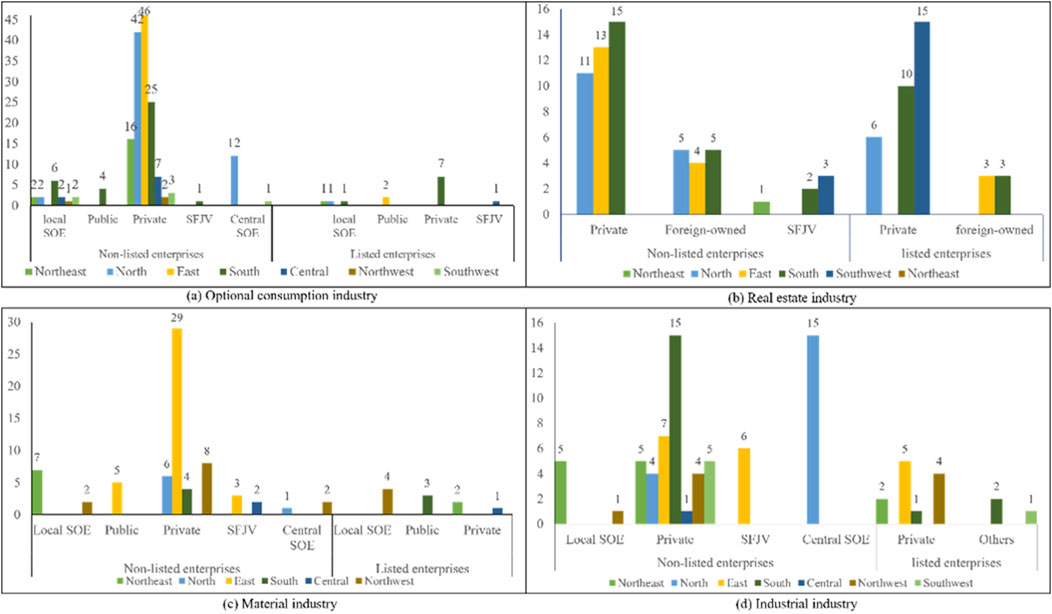
Figure 6. Risk distribution of default industry. (a) Distribution of characteristics of defaulted bonds in optional consumption industry; (b) Distribution of characteristics of defaulted bonds in real estate industry; (c) Distribution of characteristics of defaulted bonds in Material industry; (d) Distribution of characteristics of defaulted bonds in Industrial industry. SFJV, Sino-foreign joint venture.
The risk associated with bonds issued by the industrial and materials sectors is predominantly concentrated in unlisted enterprises. Within the industrial sector, unlisted private enterprises in East China, North China, and South China exhibit higher risk levels, bond defaults among centrally-owned state enterprises in North China warrant attention. In contrast, bonds issued by locally-owned state enterprises and foreign joint ventures tend to be less risky. The risk profile of bonds issued by industrial enterprises demonstrates a strong regional clustering effect. In the material industry, the number of bond defaults of private enterprises in East China is the highest, because the material industry is greatly affected by the energy policy, which leads to the cash flow turnover problem of bond issuers in the material industry, especially private material enterprises. The corporate bond risk shows no substantial variation based on regional or other characteristics.
The above analysis has examined the distribution characteristics of defaulted bonds from an industry perspective. It can be concluded that industries with a higher correlation to bond defaults mainly have strong cyclical nature, high leverage, policy sensitivity, and external environmental uncertainty. During economic downturns or deteriorating market conditions, the profitability, cash flow, and financing capabilities of these industries are more vulnerable to shocks, thereby increasing the risk of default. From the perspective of whether they are listed or not, the average risk of bond issuance by listed companies is lower than that of unlisted companies. In terms of regional distribution, the characteristics of default regions are mostly concentrated in the eastern, northern, and southern parts of China, mainly due to the greater economic vitality and a larger number of enterprises in these regions.
The results of the above descriptive statistics are basically consistent with the analysis and association rule mining results, it confirms the effectiveness of association rule mining. The cross-analysis of the four industries can grasp the distribution and concentration of bond credit risk from a macro perspective, and assist investors to make relatively safe decisions when investing in public offering corporate bonds.
4.3 Bond default forecast
The attribute of enterprise frequently appears in the mining of association rules, and the results of association rules show that the bond risks of different industries vary in this dimension. Using machine learning models, we segmented the dataset into two groups based on the nature of the bond issuers: state-owned enterprises (SOEs) and non-state-owned enterprises (NSOEs). Bond risk prediction was then conducted on these two datasets, yielding distinct prediction outcomes. The results are shown in Table 14.
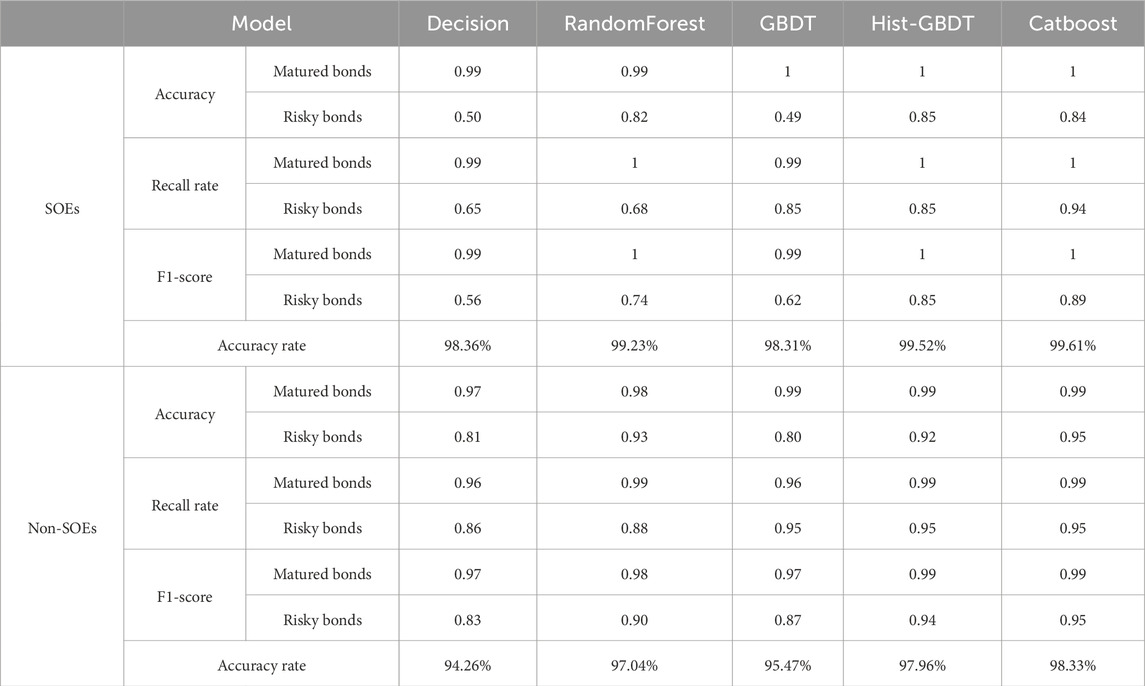
Table 14. Classification prediction results of bond risk models.
By comparing the experimental outcomes of the two groups of data, it is observed that the accuracies of decision trees and GBDT in the two groups of experiments are not high. From the perspectives of precision, recall rate, and F1-score metrics, the prediction accuracies of random forests, HistGradientBoostingClassifier, and Catboost for non-state-owned bonds are higher than those for state-owned bonds. CatBoost performs best on the state bond dataset, while HistGradientBoostingClassifier and CatBoost are the top models for another group. According to the ROC curve analysis (Figure 7), the AUC values predicted by the decision tree and GBDT algorithm models for state-owned bonds are higher than those for non-state-owned enterprise bonds. Conversely, other models predict higher AUC values for non-state-owned bonds compared to state-owned enterprise bonds. Among the models, Random Forest and CatBoost exhibit similar performance across both datasets. The HistGradientBoostingClassifier achieves an AUC score that is 0.0916 higher on the non-state bond dataset compared to the state bond dataset. CatBoost performs best on the state bond dataset, while HistGradientBoostingClassifier outperforms other models on the non-state bond dataset.
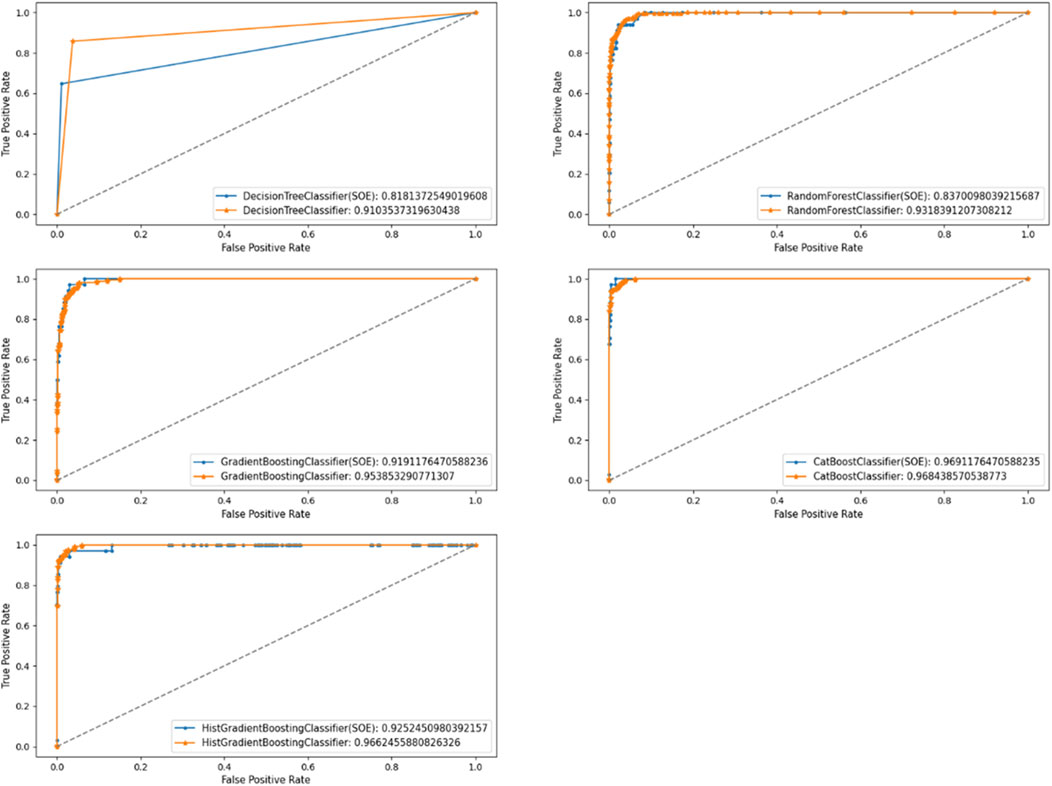
Figure 7. Comparison of ROC curves.
In addition, to verify the conclusion of the var experiment, we selected the Catboost model and conducted ablation experiments on the indicators M1 and M2. The experimental results are shown in Figures 8, 9. The addition of the monetary indicator increases the AUC area of Catboost and reduces the number of bond misclassifications. This proves that m1, m2 has an enhancing effect on recognizing bond risk.
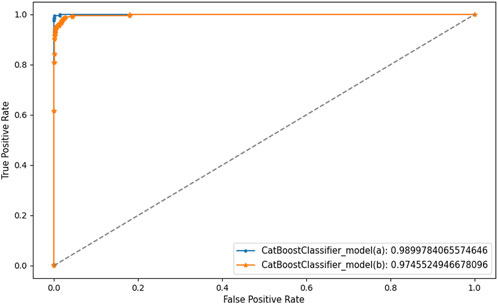
Figure 8. ROC curve for the ablation experiment.
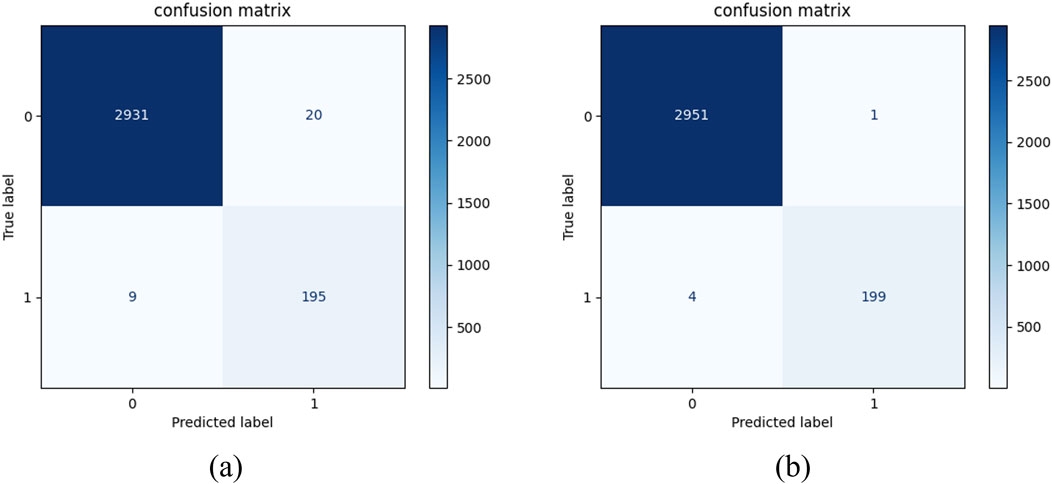
Figure 9. Comparison chart of confusion matrices for the ablation experiment. (a) Confusion matrix of Catboost before adding macro features; (b) Confusion matrix of Catboost after adding macro features.
5 Results and discussion
The three experiments, VAR analysis, association rule mining, and descriptive cross-statistical analysis, analyzed the risks of credit bonds from the overall perspective of the bond market. Granger causality tests were conducted on the monetary indicators M1 and M2 and bond defaults, and the results confirmed the existence of a causal relationship between macroeconomic indicators and bond defaults. M1 and M2 have an impact on bond defaults: In light of the actual situation of China’s bond market, China’s interest rate liberalization is nearly complete, and the bond market has become an important platform for monetary policy operations. The interest rate transmission from the money market to the bond market is an important channel for monetary policy. M1 and M2 influence the bond market through liquidity effects and economic expectations, and their changes have an impact on the trend of the bond market. Bond defaults have an impact on M1: Against the backdrop of a high incidence of credit default events, defaulted bonds will lose liquidity due to trading suspension. Investors’ risk aversion will lead them to choose to sell liquid bonds in their asset portfolios, thereby weakening the liquidity of high-quality bonds. Bond market risks will also lead to a decline in systemic risk preferences in the financial market, further affecting monetary policy.
Association rule mining and cross-analysis identified the current existence and concentration points of risks. Based on the results of association rule mining, we have identified four industries with concentrated bond risks: real estate, materials, consumer discretionary, and industrial. These four industries with high-risk correlation are highly consistent with the risk concentration points in China’s bond market. The industrial and materials sectors have been affected by policies such as China’s industrial structure upgrade and environmental protection production restrictions. As a result, some enterprises with overcapacity and high energy consumption and pollution have faced increased operational pressure, rising financing difficulties, greater capital turnover pressure, and continuous decline in profit levels, leading to accelerated bond risk release. The consumer discretionary sector is highly sensitive to economic cycles and is mainly affected by the sluggish macroeconomy and weak consumer demand. For the real estate sector, it is because China’s real estate policy regulation has become stricter in recent years. Regulations such as “houses are for living in, not for speculation” have suppressed housing price increases while also restricting the financing of real estate enterprises, leading to accelerated exposure of bond credit risks. According to cross-analysis, the risks of corporate bonds in the real estate industry are mainly concentrated in private enterprises, which confirms the current situation of two-tiered differentiation in the operation of Chinese real estate enterprises. Currently, the net bond financing of state-owned real estate enterprises in China has significantly increased, but the financing situation of some private real estate enterprises is not optimistic. At the same time, we have found that in each industry, the risk level of non-listed issuers is higher than that of listed companies. This is because listed companies have diverse financing channels, are subject to more supervision, and can disclose more information. Therefore, the credit bond risks of listed enterprises are usually smaller than those of non-listed enterprises. From a regional perspective, the economic development levels in South China and East China are relatively high, with a large number of private enterprises and concentrated bond issuers. Most enterprises are mainly engaged in trade, manufacturing, and export processing, and are more vulnerable to economic environment changes, thus leading to relatively concentrated default risks. These discussions provide valuable insights for subsequent focused attention and targeted adjustments in industries and regions experiencing frequent defaults.
With individual credit bonds as the research object and based on the aforementioned results of machine learning, we explore the influencing factors of state-owned and non-state-owned bonds, and further compare them for difference analysis. Since the AUC of Catboost is greater than 90% on both sets, we give the ranking of the top 20 feature importance of Catboost after removing the principal component index on the two data sets (Table 15). Through the feature importance weights, a comparison chart of risk factor weights for the two groups of experiments was obtained (Figure 10). Debt-paying ability can directly reflect the risk of credit bonds, and its proportion in private enterprises exceeds 50%. This indicates that financial indicators related to debt-paying ability most directly reflect bond risk. Capital structure also holds certain significance for the risk identification of credit bonds. This indicates that enterprises should pay attention to the investment and financing structure as well as the proportion of enterprise expenditures during the investment and financing process. A reasonable investment and financing ratio can maintain the stability of cash flow to diversify risks. For listed companies, the risk of bonds is smaller than that of issuing stocks, and it also provides them with a tool to diversify risks. Profitability reflects short-term solvency, while development capacity is demonstrated through indicators such as revenue growth rate, asset growth rate, and ROE, which also reflect long-term solvency. The combination of the two comprehensively reflects the solvency of an enterprise and represents its development potential, making them relatively important risk identification indicators. The proportion of macroeconomics in the two sets of data varies greatly. Non-private enterprises are greatly affected by macroeconomics and macro factors on their own operations. Private enterprises are more susceptible to policy adjustments. When the credit environment is relatively tight and the overall financing environment tightens, the liquidity pressure on private enterprises’ funds will increase, which will significantly increase the risk of bond default. Therefore, issuers should make accurate predictions of the macro environment and the development positioning of their enterprises before issuing credit bonds.
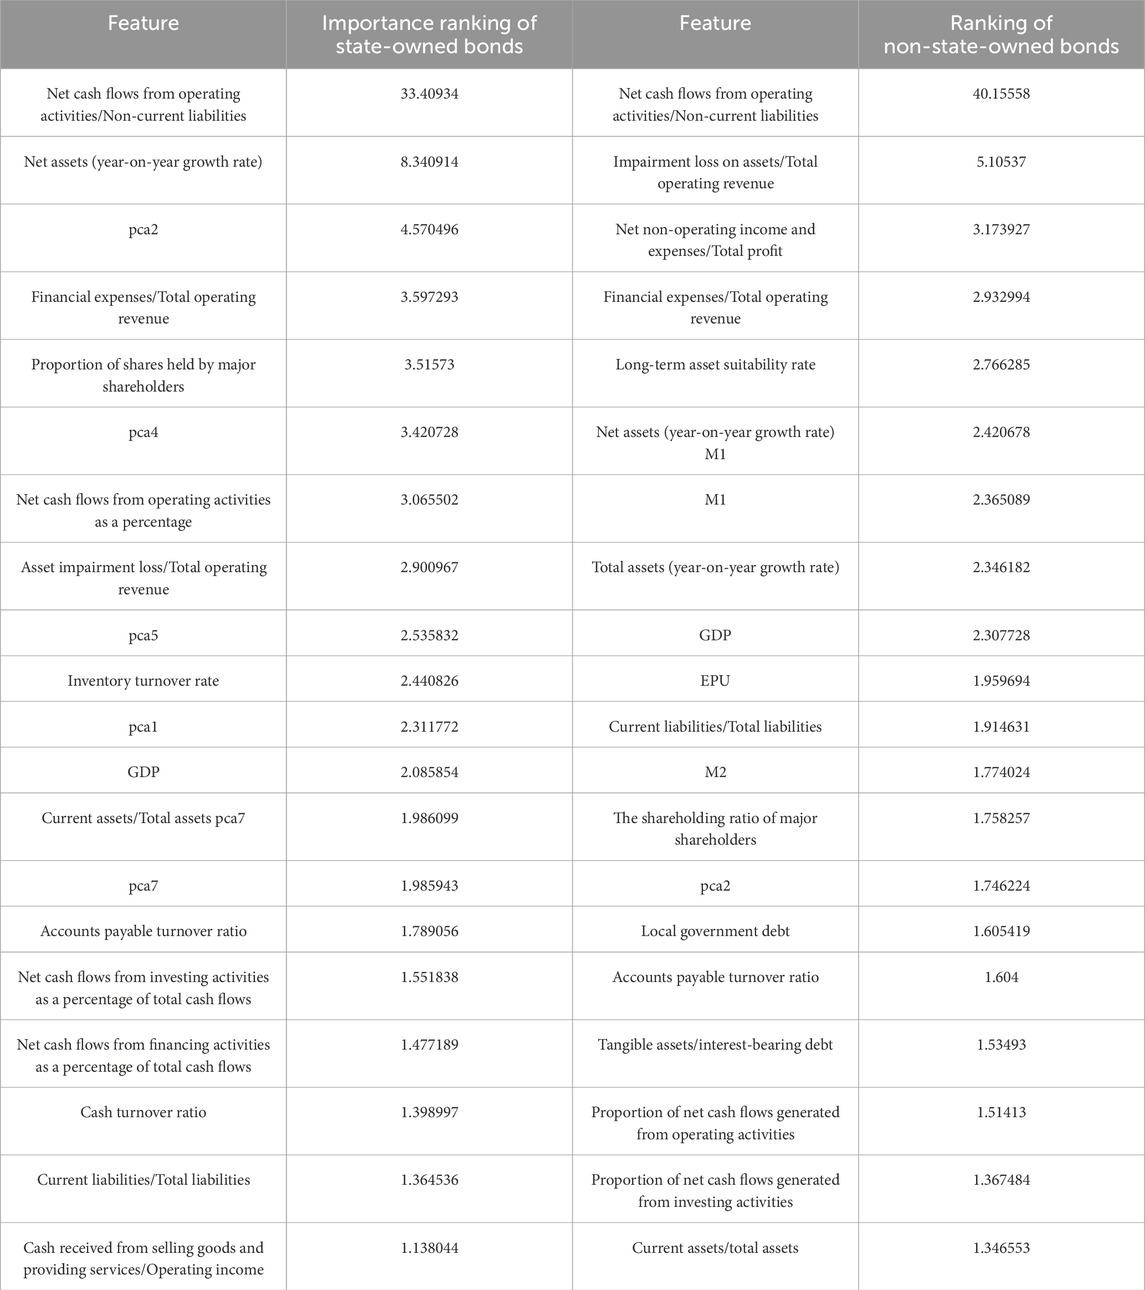
Table 15. Feature importance ranking of catboost.
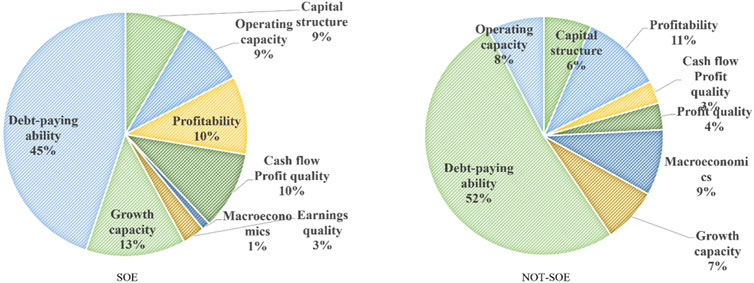
Figure 10. Comparison of risk factors.
6 Conclusion
This paper analyses bond default from the perspective of macro and micro combination. Based on the macro perspective, the logical transmission between macro factors and bond default is confirmed by causation, and the overall characteristics of bond default are grasped by the statistical research method combining association rule mining and descriptive statistics. Bonds are divided into no-risk bond group and risk bond group, and association rules are mined in four dimensions, corporate bond region, whether the issuing entity is listed, the issuing enterprise attribute, and whether there is a guarantee for corporate bonds, and rules with high correlation degree are obtained, the cross-analysis of risk factors was carried out in these four different dimensions. Microscopically, the bonds issued by enterprises were taken as the research object. The characteristics of defaulted bonds were analysed from the perspective of whether the issuer is a state-owned enterprise or not, and the key factors for bond risk identification and the integrated algorithm with the highest AUC were obtained. The conclusions are as follows:
(1) Through VAR and Granger causality test, we prove that bond default is correlated with M1 and M2;
(2) In view of the text attributes of bonds and bond issuers, correlation mining is conducted to find out the risk attributes strongly related to bond, and further conducted descriptive statistics on risk attributes to further grasp the risk characteristics and trends on a macro level.
(3) Bonds are grouped based on the risk correlation features obtained from association rules mining, and the credit status of bonds is predicted by combinational learning algorithm. The importance of risk attributes is ranked from the micro level according to the prediction results, and the validity of Granger causality test is further confirmed. At the same time,the combination learning model used in this paper has a high accuracy for bond default prediction, the accuracy rate of all algorithms exceeds 90%. In terms of recall rate, the ensemble learning algorithm is better than the decision tree. The AUC of Catboost on both sample sets is greater than 90%. Therefore, we chose CatBoost to conduct a comparative experiment on the risk identification of bonds issued by state-owned and non-state-owned enterprises. By analysing the importance features of two groups of machine learning, the ranking of feature importance was obtained. The top-ranked feature was the solvency of enterprises, including important indicators such as “net cash flow from operating activities/non-current liabilities”, indicating that the cash flow status of enterprises is extremely crucial for assessing the risk of corporate bonds. Macro factors are also key factors in bond risk identification. Non-state-owned enterprises are more affected by macro and their own operating conditions. In addition, in the ranking of the importance of default factors for non-state-owned bonds, both M1 and M2 are relatively important features. This results and the ablation experiments in machine learning indicate the correlation between bond default and M1 and M2, verifying the correctness of the aforementioned causal test from a micro perspective. Our research can provide a tool reference and guidance for risk management in the actual bond market.
Data availability statement
The original contributions presented in the study are included in the article/supplementary material, further inquiries can be directed to the corresponding author.
Author contributions
YWZ: Data curation, Formal Analysis, Investigation, Project administration, Resources, Software, Supervision, Validation, Visualization, Writing–original draft, Writing–review and editing. WC: Conceptualization, Data curation, Formal Analysis, Investigation, Methodology, Writing–original draft, Writing–review and editing.
Funding
The author(s) declare that no financial support was received for the research and/or publication of this article.
Conflict of interest
The authors declare that the research was conducted in the absence of any commercial or financial relationships that could be construed as a potential conflict of interest.
Generative AI statement
The author(s) declare that no Generative AI was used in the creation of this manuscript.
Publisher’s note
All claims expressed in this article are solely those of the authors and do not necessarily represent those of their affiliated organizations, or those of the publisher, the editors and the reviewers. Any product that may be evaluated in this article, or claim that may be made by its manufacturer, is not guaranteed or endorsed by the publisher.
References
1. Merton RC. On the pricing of corporate debt: the risk structure of interest rates. The J Finance (1974) 29(2):449–70. doi:10.1111/j.1540-6261.1974.tb03058.x
2. Kedia S, Rajgopal S, Zhou X. Did going public impair Moody' s credit ratings? J Financial Econ (2014) 114(2):293–315. doi:10.1016/j.jfineco.2014.07.005
3. Yang B, Bin K, Li B, Julia Yu Y, Zhang J. Detecting accounting fraud in publicly traded US firms using a machine learning approach. J Account Res (2020) 58(1):199–235. doi:10.1111/1475-679X.12292
4. Beaver WH. Financial ratios as predictors of failure. J Account Res (1966) 4(12):71–111. doi:10.2307/2490171
5. Altman E, Fargher N, Kalotay E. A simple empirical model of equity- implied probabilities of default. J Fixed Income (2011) 20(3):71–85. doi:10.3905/jfi.2011.20.3.071
6. Douglas A, Huang AG, Vetzal KR. Cash flow volatility and corporate bond yield spreads. Social Sci Electron Publishing (2016) 46(2):417–58. doi:10.1007/s11156-014-0474-0
7. Sun J, Hui L, Fujita H, Fu B, Ai W. Class-imbalanced dynamic financial distress prediction based on Adaboost-SVM ensemble combined with SMOTE and time weighting. Inf Fusion (2020)(54) 128–44. doi:10.1016/j.inffus.2019.07.006
8. Beaver WH, Mcnichols MF, Rhie JW. Have financial statements become less informative? Evidence from the ability of financial ratios to predict bankruptcy. Rev Account Stud (2005) 10(1):93–122. doi:10.1007/s11142-004-6341-9
9. Sadiq M, Alajlani S, Hussain MS, Ahmad R, Bashir F, Chupradit S. Impact of credit, liquidity, and systematic risk on financial structure: comparative investigation from sustainable production. Environ Sci Pollut Res (2022) 29(14):20963–75. doi:10.1007/s11356-021-17276-x
10. Chava S, Jarrow RA. Bankruptcy prediction with industry effects. Eur Finance Rev (2004) 8(4):537–69. doi:10.1007/s10679-004-6279-6
11. Yuhui WU, Xinxin LIU, Chen Y. Optimization and improvement of bond default early warning model - based on SMOTE-tomek-GWO-XGBoost method. Friends Account (2024)(06) 73–81. doi:10.3969/j.issn.1004-5937.2024.06.011
12. Fama EF, Jensen MC. Separation of ownership and control. J L Econ (1983) 26(2):301–25. doi:10.1086/467037
13. Wilson BA. Movements of wages over the business cycle: an intra-firm view. Finance and Econ Discussion (1997) 1997.0:1–38. doi:10.17016/feds.1997.01
14. Jun LU, Zifang LI. Empirical analysis of the effect of macro economic factors to corporate financial crisis. J Shanxi Univ Finance Econ (2008)(11) 94–100. doi:10.3969/j.issn.1007-9556.2008.11.017
15. Chen H. Macroeconomic conditions and the puzzles of credit spreads and capital structures. The Natl Bur Econ Res (2010) 65(6):2171–212. doi:10.1111/j.1540-6261.2010.01613.x
16. Xiao LIU, Rongxi ZHOU, Yuru LI. Default prediction of credit bond in China based on stacking algorithm integrated model. Operations Res And Management Sci (2023) 32(03):163–70. doi:10.12005/orms.2023.0096
17. Fan LZ, Zhang C. Explanation of Macro economic variables on bond risk premia in China. J Management Sci China (2009) 12(06):116–24. doi:10.3321/j.issn:1007-9807.2009.06.013
18. Dai guoqiang, Sun xinbao. On the macro determinants of credit spreads of corporate bonds in China. J Finance Econ (2011) 37(12):61–71.
19. Zhang K, Liang Z, Liu Z, Jia N. A deep learning based multitask model for network-wide traffic speed prediction. Neurocomputing (2020) 396:438–50. doi:10.1016/j.neucom.2018.10.097
20. Luo H, Cai J, Zhang K, Xie R, Liang Z. A multi-task deep learning model for short-term taxi demand forecasting considering spatiotemporal dependences. J Traffic Transportation Eng (English Edition) (2021) 8(1):83–94. doi:10.1016/j.jtte.2019.07.002
21. Yunjie W, Shaolong S, Kin Keung L, Ghulam A. A KELM-Based 587 ensemble learning approach for exchange rate forecasting. J Syst Sci Infor (2018) 6(4): 289–301. doi:10.21078/JSSI-2018-289-13
22. Xu F, Keselj V. Collective sentiment mining of microblogs in 24-hour stock price movement prediction. In: 16th IEEE conference on business informatics (CBI) (2014). p. 60–7. doi:10.1109/CBI.2014.37
23. Almalaq B, Dai X, Zhang J, Hanrahan S, Nedrud J, Hebb A. Causality graph learning on cortical information flow in Parkinson's disease patients during behaviour tests. 49th Asilomar Conf Signals, Syst Comput (2015) 925–9. doi:10.1109/ACSSC.2015.7421273
24. Yanwei H, Dengguo WU, Jun LI. Structural healthy monitoring data recovery based on extreme learning machine. Computer Eng (2011) 37(16):241–3. doi:10.3969/j.issn.1000-3428.2011.16.082
25. Vazquez-Patino A, Samaniego E, Campozano L, Avilés A. Effectiveness of causality-based predictor selection for statistical downscaling: a case study of rainfall in an Ecuadorian Andes basin. Theor Appl Climatology (2022) 150(3-4):987–1013. doi:10.1007/s00704-022-04205-2
26. Li M, Zhang R, Liu K. Machine learning incorporated with causal analysis for short-term prediction of sea ice. Front Mar Sci (2021) 8:8. doi:10.3389/fmars.2021.649378
27. Agrawal R, Imielinski T, Swami A. Mining association rules between sets of items in large databases. ACM SIGMOD Rec (1993) 22(2):207–16. doi:10.1145/170036.170072
28. Schapire RE. The strength of weak learnability. Machine Learn (1990) 5(2):197–227. doi:10.1007/bf00116037
Keywords: Chinese bond market, bond credit default prediction, macro factors and default causality, combinatorial machine learning, granger causality test, association rule mining
Citation: Zhang Y and Cui W (2025) Research on characterization and prediction of bond risk factors based on machine learning: evidence from the China. Front. Phys. 13:1559283. doi: 10.3389/fphy.2025.1559283
Received: 12 January 2025; Accepted: 13 March 2025;
Published: 27 March 2025.
Edited by:
Ze Wang, Capital Normal University, ChinaReviewed by:
Chan Liu, China University of Mining and Technology, Beijing, ChinaXiaowen Shi, Beijing Normal University, China
Copyright © 2025 Zhang and Cui. This is an open-access article distributed under the terms of the Creative Commons Attribution License (CC BY). The use, distribution or reproduction in other forums is permitted, provided the original author(s) and the copyright owner(s) are credited and that the original publication in this journal is cited, in accordance with accepted academic practice. No use, distribution or reproduction is permitted which does not comply with these terms.
*Correspondence: Wei Cui, Y3Vpd0BjdWdiLmVkdS5jbg==