 Weiwei Qiu
 Zhehui Zhang
- China Waterborne Transport Research Institute, Beijing, China
The predominant method of transporting crude oil is by sea, with numerous countries prioritizing energy transportation and ensuring the unimpeded passage of vessels through designated maritime channels. However, the efficacy of international shipping routes is subject to numerous threats and challenges, which have the potential to severely impact or even halt shipping operations. This paper proposes a directed weighted topology model, utilizing ship AIS data and capacity scales, integrating complex network models with social network analysis techniques, to evaluate the operation of the crude oil shipping network under uncertain conditions. The assessment of network topology involves the application of various attack strategies to calculate characteristic indicators of the network and a systematic review of the results. The results indicate that the crude oil shipping network is particularly vulnerable to deliberate attacks, with degree and betweenness attacks demonstrating a higher potential for disrupting the network. It is notable that, upon the occurrence of a certain level of attack intensity, specific nodes (or channels) may become inoperable, necessitating the selection of alternative routes or reassessment of supply sources. Furthermore, this research establishes a competitiveness and security index to quantitatively identify the crucial nodes within the crude oil shipping network. The findings of this study are of considerable practical and strategic significance, insofar as they facilitate a more profound comprehension of the resilience of the maritime energy transportation framework, and of the improvement of its role in supporting national economic and social development.
1 Introduction
Shipping, as one of the most cost-effective modes of international cargo transportation, plays a vital role in global trade and economic development, particularly in ensuring the stability of energy supply [1]. Crude oil, recognized as one of the most important strategic resources, experiences significant demand and serves as a foundation for the economic development of numerous countries. Exports are predominantly concentrated in the Middle East, Russia, West Africa, North America, and Central and South America, etc., while imports are primarily focused on the United States, China, Europe, India, and Japan, etc. For example, China, ranking as the world’s second-largest consumer of oil [2], relies on foreign sources for over 70% of its supply. The global reserves, production, and consumption of oil are unevenly distributed, with approximately 60%–70% of crude oil transported by sea, making it susceptible to various uncertain factors, including weather and political conditions. Consequently, ensuring the security of marine energy transport and energy routes poses a significant challenge to safeguarding national economic stability.
Currently, the instability and uncertainty of the international environment have significantly increased. International shipping channels are confronting various threats and challenges, including maritime hegemony, disputes over maritime rights, and geopolitical tensions. For instance, the grounding of the “Ever Given” led to the suspension of the Suez Canal, resulting in a blockage of the maritime channel network and a substantial reduction or even interruption of shipping efficiency. Additionally, the conflict between Russia and Ukraine has altered the supply and demand dynamics of the global crude oil market. Consequently, the security of the crude oil shipping network (COSN) is vital for both crude oil trade and national stability. It is imperative to quantitatively characterize the COSN, analyze its variations under uncertain disturbances, and identify crucial nodes, as this represents an urgent issue that needs to be addressed.
This paper utilizes extensive data on massive ship dynamic operations to develop a directed weighted topology model of global crude oil shipping, by employing complex network models and social network analysis methods. This research selected indicators to quantitatively evaluate the COSN from the perspectives of vulnerability and recovery, analyzing its variations under different disruption simulation. Additionally, a competitiveness and security index (CSI) is established to quantitatively identify crucial nodes within the COSN. Understanding these crucial nodes functional characteristics holds significant practical and strategic importance for assessing the resilience of the maritime energy transportation network and enhancing support for the nation’s economic and social development.
This paper will follow a research framework based on data modeling, evaluation analysis, key node identification, and application support. It will provide three innovative contributions to the industry: 1) A directed weighted topological model of global crude oil shipping is constructed using actual shipping data and theoretical methods. 2) This study quantitatively evaluates the dynamic changes of COSN under multi-dimensions interference simulations by selecting indicators from random attacks, strategic node assaults and critical channel blockades, aiming to expand the theoretical assessment framework. 3) Establishing a quantitative identification network for crucial nodes provide a practical basis for assessing the resilience of maritime energy transportation networks and strategic support.
2 Literature review
Many scholars have carried out research on maritime shipping network, but relatively little research has been done in the field of COSN evaluation based on the shipping data.
2.1 Research on the complex network theory of maritime
Research on shipping complex networks often employs complex networks to analyze the characteristics of shipping networks. Tian [3] conducted a study of the global shipping network using data from Maersk Company, concluding that the network exhibits a small average shortest distance among local nodes and a high aggregation coefficient, thereby classifying it as both a small-world network and a scale-free network. Li and Yan [4] demonstrated that the shipping system evolves over time, indicating that the structural characteristics of the global shipping network are dynamically changing. Scholars such as Zong [5] analyzed the degree centrality, closeness centrality, and betweenness centrality of each port based on complex system theory, finding that the stability of hub ports within the shipping network determines the overall connectivity of the network. Wu [6] established the Maritime Silk Road shipping network through complex network theory, analyzing its topological characteristics and revealing the basic structure and macro attributes of the shipping network. Xiao et al. [7] proposed potential methods for identifying alternative ports and evaluating the invulnerability of important ports within the container shipping network. At the methodological level, Sahimi [8] monograph systematically elucidates the application of percolation theory in complex networks, encompassing dynamic network evolution, multiphase flow simulation, and biological system modeling. The proposed “vector percolation” model quantifies the cascading effects of node removal on network topology, providing methodological complementarity to the network resilience analysis based on AIS data in the user’s study.
2.2 Research on the maritime network from vulnerability and resilience perspective
The assessment of system resilience is categorized into two distinct classifications: static and dynamic. Static resilience is defined as the system’s ability to maintain specific functions in the face of external disturbances. In contrast, dynamic resilience signifies the system’s capacity for expeditious transition from a state of disturbance to a state of stability [9]. Currently, research on shipping network assessment predominantly emphasizes the dynamic aspect, particularly the effects of disturbances on the overall network system and the exploration of potential improvement pathways. Maimun et al. [10] developed a resilience measurement model applicable to any emergency event and system. Omer et al. [11] established indicators such as throughput elasticity, sailing time elasticity (including waiting time), and shipping cost elasticity. They conducted case analyses through simulation research and proposed suggestions for enhancing resilience, including collaboration, resource allocation, and diversity substitution. Wang et al. [12] discovered that when the scale of deliberate attacks remains within 10%, the vulnerability of the global container shipping network is altered by approximately 6.1%. Ducruet [13] examined the vulnerability of the global container shipping network by analyzing the reduction of traffic flows reliant on the Panama and Suez Canal main channels. The findings underscored the significant impact of these main channels on global shipping. Utilizing route and port of call data, Wu et al. [14] investigated the repercussions of attacks on the global container shipping network, specifically when critical waterways such as the Strait of Malacca, Suez Canal, and Panama Canal were targeted. This analysis involved calculating the average degree, proportion of isolated nodes, clustering coefficient, and other indicators of the shipping network, ultimately proposing alternative route options. Liu et al. [15] quantitatively simulated the vulnerability of container transportation networks to both random and deliberate attacks. Yuan et al. [16] analyzed the factors influencing the resilience of container line operations, which include route networks, navigation costs, voyage composition and scale, navigation accidents, and capacity utilization. They quantitatively assessed the impact of incorporating alternative routes on the resilience of container line operations. Huangfu and Li [17] utilized data mining technology in conjunction with complex network theory to examine the invulnerability of China’s crude oil import and export network. Wan et al. [18] developed a resilience-cost index based on risk theory grounded in resilience triangle theory and quantitatively analyzed the effects of four network recovery strategies on the container shipping network. Their findings indicated that optimizing the port recovery sequence can significantly enhance the overall network recovery rate. Wang et al. [19] established a resilience evaluation system for port cluster shipping networks based on indicators such as the number of independent network paths, efficiency, and connectivity. They conducted a quantitative comparison of the performance of the Yangtze River Delta and Guangdong, Hong Kong, and Macao port clusters under various attack and recovery scenarios, revealing that the connectivity of the Guangdong, Hong Kong, and Macao cluster surpasses that of the Yangtze River Delta. Poo and Yang [20] developed an integrated framework for assessing climate vulnerability and optimizing network performance. Through multi-centrality analysis, they identified global shipping hubs and simulated the effects of port disruptions caused by extreme weather on route efficiency. The study revealed that disruptions at critical nodes, such as the Strait of Malacca, could increase the average path length of the network by more than 40%. Xu et al. [21] further validated through their analysis of the global liner shipping network that targeted attacks, such as the removal of high-betweenness ports, are significantly more destructive to network connectivity than random failures. They also proposed a redundant path planning strategy to enhance system robustness.
2.3 Research on the COSN
In recent years, oil transportation has garnered attention due to global situation shifts in global energy supply and demand, with a primary focus on trade networks, resilience optimization, and evolutionary development. Scholars such as Chlomoudis et al. [22] have emphasized the critical role of ports in crude oil transportation, particularly in analyzing the quality and safety systems of these facilities. Sun et al. [23] reexamined the risks associated with oil imports from the perspective of the global oil supply chain. Yuan et al. [24] employed the improved grey correlation coefficient evaluation method to analyze the impact degree of crude oil import disruption on the downstream crude oil supply security from the perspective of the supply chain. Zhong and Tai [25] incorporated resilience levels as constraints in their research, establishing a two-extreme stochastic programming model aimed at minimizing total network costs. Their model includes the signing of long-term supply contracts, enhancement of unloading port facilities, and strategic reserves of crude oil storage. Additionally, they proposed four resilience strategies for optimizing the crude oil supply ratio and employed the sample mean approximation method from Monte Carlo sampling theory to address the problem. Zhao et al. [26] examined the evolution characteristics of the “One Belt, One Road” COSN in the context of the Russia-Ukraine conflict. Their findings indicated that the density, strength, and accessibility of connections between ports exhibited a trend of initially increasing and subsequently decreasing. Notably, the COSN between China and the Middle East has supplanted some of the shipping routes previously utilized for transporting crude oil from China to Russia. Similarly, Yu et al. [1] developed a model of a typical global strategic material shipping network that encompasses the Red Sea. Their study of strategic material transportation volumes and the evolution of the energy shipping network revealed that, following the Red Sea incident, there was a decline in the transportation of crude oil and other materials, in addition to LNG. Furthermore, the heading process has led to shorter routes compared to previous ones, capitalizing on the instability of long-distance transportation routes. Su et al. [27] constructed a model of China’s crude oil import shipping network, introducing the concept of a resilience curve. They utilized the cargo arrival rate as an indicator of network efficiency and proposed a resilience assessment method for the recovery phase of the COSN.
Besides, some scholars have explored the complexity of the relationship between crude oil and financial markets by constructing crude oil price networks. Their primary focus has been on systematic investigations into the time-frequency correlation between oil and stock markets, price transmission mechanisms, and regional differences. Chen et al. [28] employed the asymmetric BEKK-Copula-GARCH model combined with wavelet coherence analysis, discovering that extreme events (such as pandemics) enhance the asymmetry of market linkages and the dominance of medium- and long-term frequencies. Chen et al. [29] integrated market state and time scale analyses, indicating that African stock returns exhibit heterogeneity in response to different oil price shocks, with higher connectivity observed in long-term bear markets. Furthermore, export countries are more sensitive than import countries, while the net transmission effect is only significant in the long term. Zhang et al. [30] constructed a global crude oil price connectivity network based on the VAR model, revealing that Brent and Bonny crude oils play a dominant role in return transmission with Dubai crude oil leading in volatility spillovers. Additionally, Asian oil prices mostly act as net receivers, reflecting regional imbalances in the international pricing system. Zhang and Ji [31] utilized a long-memory model to find that the U.S. oil and gas market has consistently decoupled due to the shale gas revolution, while Europe and Japan have only experienced periodic decoupling. Overall, these markets still conform to the oil indexation hypothesis, with differences in pricing mechanisms being key.
2.4 Summary
It can be observed that, firstly, most research focuses on container or LNG maritime transportation networks. Secondly, crude oil trade data is utilized to construct shipping networks, rather than transportation data. Thirdly, the transportation intensity between nodes is often overlooked in the construction of shipping networks. Fourthly, there is limited existing research on the development of simulation attack scenarios that specifically target the characteristics of COSNs. Besides, a systematic research framework for multi-dimensional analysis and evaluation suitable for such complex networks has yet to be established. Fifthly, at the methodological level concerning the quantitative identification of crucial nodes within the network, the current literature reveals opportunities for improvement in constructing models that adequately consider the evaluation of node importance. These gaps in the literature regarding COSN have prompted the formulation of three research questions.
Q1: This study explores the utilization of shipping transportation data to develop a network grounded in complex network theory and to analyze its characteristics.
Q2: Following incidents such as the Suez Canal blockage and the Red Sea Crisis, there has been heightened global awareness regarding the risk resistance and resilience of shipping networks. This study aims to evaluate the robustness of the global COSN under various attack strategies.
Q3: This study seeks to quantitatively identify the crucial nodes within this network.
To address these issues, this research will adopt a practical application perspective by constructing a weighted topology model of global crude oil shipping, utilizing ship Automatic Identification System (AIS) data and capacity scales. It will also select indicators to quantitatively assess the COSN from the perspectives of vulnerability and recovery, analyze its variations under different attack strategies, establish competitiveness and security index, and identify crucial nodes along with their functional characteristics. This research holds significant practical and strategic importance for enhancing our understanding of the resilience of the maritime energy transportation network and for better supporting the economic and social development of the country.
3 Research method and model development
3.1 Research methodology and framework
To achieve this goal, a new methodology has been developed, consisting of the following steps as shown in Figure 1:
• Step 1 involves the construction of a COSN based on actual transportation data rather than trade data.
•Step 2 entails the performance evaluation of the network.
•Step 3 focuses on assessing the COSN under simulated disruption strategies.
•Step 4 includes the development and analysis of a competitiveness and security index to identify crucial nodes and their functions.
•Step 5 encompasses a discussion and suggestions for future improvements.

Figure 1. Flowchart of the research framework
Most previous literature focuses on constructing crude oil transportation network models based on trade networks, with insufficient research on the quantitative identification of crucial nodes. In this study, COSN is established based on actual vessel transportation data. Through the above steps, a multi-dimensional network evaluation and analysis framework is constructed, and an index-based approach is employed to quantitatively and accurately identify crucial nodes in the COSN.
3.2 Mathematical modeling of COSN
Complex networks are characterized by properties such as self-organization, self-similarity, attractors, small-world phenomena, and scale-freeness. These networks consist of multiple independent entities interconnected through specific relationships. They can be effectively abstracted and represented as a structure composed of nodes and edges [32]. In the field of logistics, various logistical elements are typically abstracted into nodes and edges based on the network under investigation [33]. For instance, in a railway network, nodes correspond to stations, while edges represent the railway lines connecting these stations [34]. To elucidate the characteristics of complex networks, researchers have proposed utilizing indicators such as degree, degree distribution, average path length, and clustering coefficient to analyze the topological properties of these networks.
The complex network model.
3.3 Evaluation indicators system of COSN under normal and disruption simulation
According to the literature, shipping networks are susceptible to deliberate attacks, and the inability of ports or waterways to resume operations for a certain period can result in a widespread collapse of the shipping network [9–12]. To quantitatively assess changes in attacks on the COSN, this study established an evaluation index system for the COSN, grounded in complex network theory and social network analysis methods. This system encompasses indicators such as network structure, functionality, spatial advantages, agglomeration, density, and transportability. These indicators are quantified using MATLAB to characterize the operation of the COSN.
1) Network structure is measured by average degree. The degree of a node indicates the number of directly connected nodes within the network. The average degree reflects the average value of the degrees of all nodes and is utilized to describe the capacity of each route in the crude oil network to operate synchronously. In Equation 2, N represents the total number of network nodes, e and i represent the number of route connections between i and j.
2) Network functionality is assessed by the average path length, which characterizes the connectivity challenges between nodes, particularly the average number of cargo transit nodes within the network. In the context of the shipping network, the distance between nodes is quantified by the number of edges traversed along the shortest path connecting two ports. In Equation 3, N represents the total number of network nodes.
3) Spatial advantage (or Cyberspace advantage) is assessed through the metric of closeness centrality. Closeness centrality is defined as the reciprocal of the sum of the shortest distances from all nodes—such as crude oil import and export locations or channel nodes—to the target node. This metric evaluates the accessibility and spatial advantages of a specific node within the shipping network. Nodes with higher closeness centrality values can engage in trade and transportation with other nodes more efficiently.
4) Network aggregation degree is quantified by the clustering coefficient, which evaluates the presence of a robust aggregation structure among adjacent nodes within the crude oil network. This coefficient ranges from 0 to 1. If a degree is node
5) Network transportability is assessed through global efficiency, which indicates the extent of connectivity between nodes in the network and the capacity for element circulation among these nodes. A higher index value corresponds to greater additional benefits for the network [35], thereby enhancing its operational stability. Furthermore, it facilitates quicker response times and resource allocation in managing network processing risks, while also reducing costs. This capability effectively mitigates potential disruptions. The calculation methods are shown in Equations 7, 8 [18].
In this context,
Assessing the resilience of the global COSN is crucial for ensuring the smooth transportation of maritime energy. Following the Suez Canal blockage incident, there has been increased global attention on the risk resistance and resilience of shipping networks. Consequently, this article will employ seven attack methods and select indicators such as the average degree, average clustering coefficient, global efficiency, and the proportion of nodes in the largest connected sub-graph to quantitatively analyze network resilience. This analysis aims to provide data support for the further optimization of the COSN.
3.4 Measuring COSN competitiveness and security importance index
To accurately assess the competitiveness of each node and its significance within the network for security purposes, this paper proposes an index model that encompasses network structure, cyberspace advantage, network agglomeration, network transportability and PageRank. PageRank is a method of assessing the relative importance of each node based on the connections between nodes within the network. The TOPSIS method is employed to quantitatively construct the CSI index. The TOPSIS method [36] is shown as follow:
1) It is essential to organize the values corresponding to five specific indicators, each associated with
2) Adjusting the data is the essential step to remove the vector magnitude. In this context, each element is represented within the normalized matrix. The value range for each node falls between [0, 1]. Then do the ratio calculation by Equations 10, 11.
3) The calculation of the entropy value for each indicator is performed using a specific formula. Equation 12 is designed to yield results that fall within a defined range, specifically between 0 and 1. By applying this method, researchers can quantify the level of uncertainty or disorder associated with each indicator, allowing for a clearer understanding of the data distribution and significance.
4) The weight of each indicator can be calculated by using Equation 13.
5) The optimal
6) Calculate the distance from each node to the optimal
4 COSN analysis and discussion
4.1 Data source and processing
The information included in this research leverages vessel Automatic Identification System (AIS) data. The dataset comprises real-time tracking information of global crude oil tankers (DWT >3000) collected through low Earth orbit (LEO) satellites in 2023, incorporating dynamic parameters (e.g., speed, course, location), static attributes (e.g., MMSI, vessel name), and voyage metadata (e.g., destination port, draft). Raw AIS messages underwent rigorous preprocessing: 1) Decoding and integrity checks to eliminate incomplete records (e.g., missing timestamps); 2) Validity validation according to ITU-R M.1371 standards; 3) Logical filtering to exclude anomalies (e.g., speeds >50 knots). Vessel types and tonnage verification were cross-validated with Lloyd’s Maritime Database to ensure the inclusion of target tankers, resulting in a temporally continuous and spatially consistent dataset suitable for network analysis.
4.2 COSN development
From a production and sales standpoint, there is a disparity between the allocation of global oil resources and the consumption areas as shown in Figure 2. The largest oil-producing area in the world is the Middle East, where most of its crude oil is shipped to consumption locales using tankers. Other notable regions that produce significant amounts of oil include North America, South America, West Africa, Southeast Asia, and Russia. Moreover, China, along with several European countries, Japan, South Korea, and additional nations, constitutes a major segment of crude oil consumers. According to data from BP, approximately 60% of the worldwide seaborne trade volume of crude oil takes place in the Asia-Pacific region.
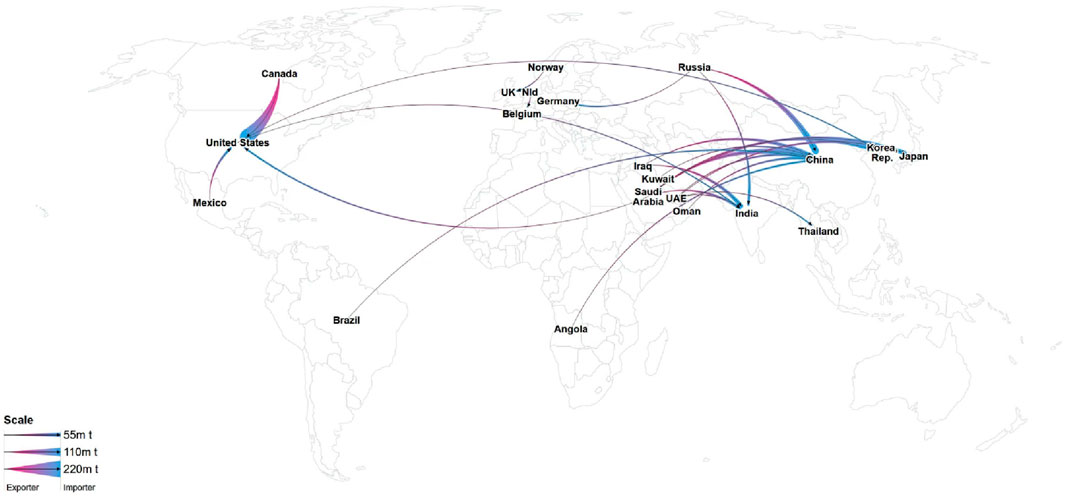
Figure 2. Crude oil trade map.
From the perspective of primary routes, there are seven major sea lanes for crude oil globally as shown in Figure 3. These include: the Middle East Persian Gulf region to the Strait of Hormuz, then to the Strait of Malacca, and finally to the Far East; the Middle East Mediterranean region through the Suez Canal and the Mandab Strait, leading to the Malacca Strait and the Far East; the route from West Africa around the Cape of Good Hope to the Malacca Strait (Sunda Strait) and onward to the Far East; the route from South America (and North America) around the Cape of Good Hope to the Strait of Malacca (Sunda Strait) and to the Far East; the route from the Middle East Persian Gulf through the Suez Canal to the Mediterranean and then to Europe; and finally, the route from North America through the Panama Canal to South America, as well as the route from North America to the Pacific and Southeast Asia, along with other channels.
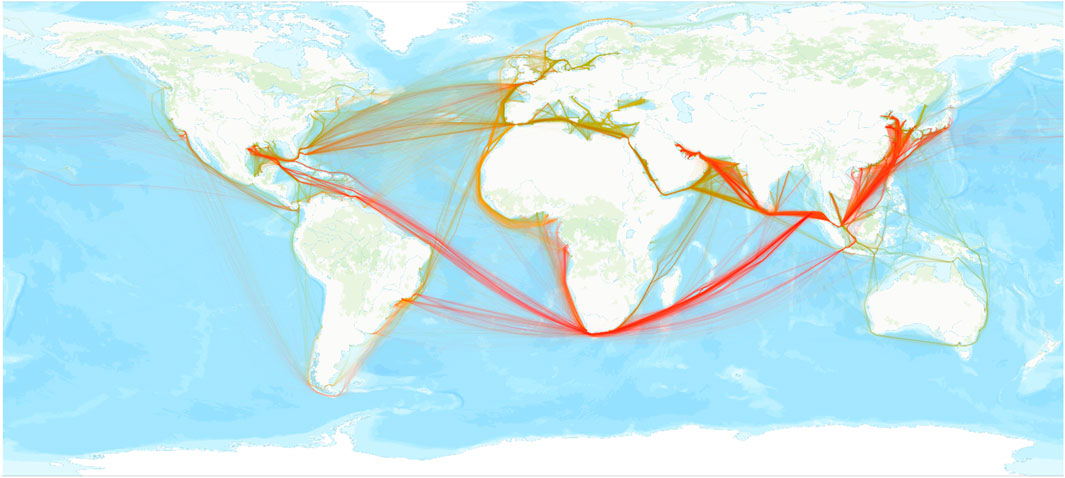
Figure 3. Crude oil shipping route heat map.
Crude oil is usually transported from countries with rich production capacity to those with deficient capacity. Since the transportation volumes vary among different routes, the transportation capacity intensities also differ. As a result, a global crude oil transportation network without a fixed flow direction is formed and evolves dynamically over time. Based on this analysis, a complex network model can be developed to examine the COSN. Academic literature generally identifies ports as nodes within the maritime network [11–17]. However, it is important to recognize that waterways also serve as significant nodes in the transportation process; their congestion or closure can substantially affect the global shipping network [13]. Therefore, in this study, nodes are defined as regions and the primary channels for crude oil transportation, while edges represent the transportation that occurs between these nodes. The strength of the edges is defined as the capacity for crude oil transportation along each route.
This paper examines crude oil trade as the basis for constructing a network model. It conceptualizes import and export locations and primary channels as nodes, while the actual shipping routes between the two parties are represented as edges. The transportation capacity for crude oil along these routes is utilized as the weight of the edges. As a result, a directed weighted network topology model for global crude oil shipping is developed, comprising 25 nodes and 360 edges as shown in Figure 4.
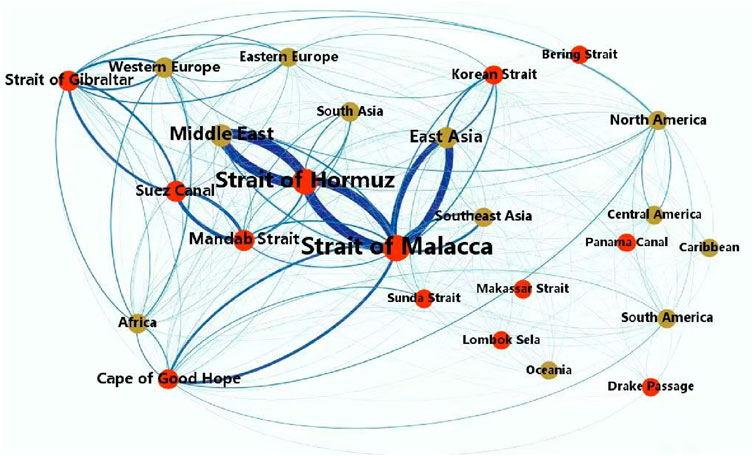
Figure 4. Spatial structure sketch map of COSN.
4.3 Attack strategies
To comprehensively and accurately assess the resilience and competitiveness of the COSN, this research selects seven distinct attack strategies to evaluate the network thoroughly.
1) Random attack: randomly removing nodes from the network without considering their characteristics.
2) Closeness Attack: it refers to the strategy of targeting nodes with high closeness centrality within a network.
3) Degree attack: it involves targeting nodes with higher degree values in the network to evaluate the network’s performance when hub nodes are compromised.
4) Betweenness Attack: once executed, it severs a significant number of the shortest paths, thereby severely disrupting the network’s connectivity and efficiency.
5) Page Rank Attack: targeting nodes that possess significant influence and importance within the network.
6) Clustering Attack: it targets nodes with high clustering coefficients within the network to evaluate the impact on the entire transportation network when local sub-networks are disrupted.
7) Edge Removal Attack: it is primarily employed to evaluate the significance and redundancy of transportation routes.
4.4 COSN evaluation
The characteristics of COSN are detailed in Table 1.
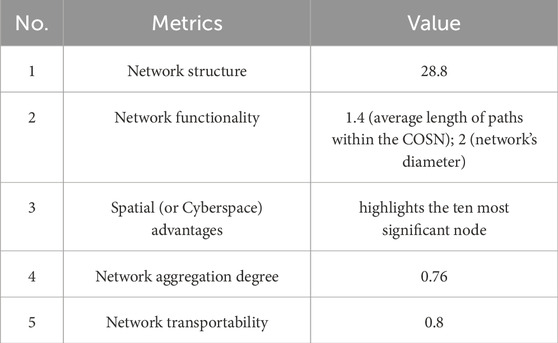
Table 1. Metrics value of COSN.
1) Network structure: In the global COSN, the mean degree is 28.8, which reflects a relatively dense interconnection among the nodes.
2) Network functionality: The average length of paths within the COSN measures 1.4, implying that to link any two nodes, only two nodes are required. The network’s diameter is 2, which means any two nodes in the COSN can connect through a maximum of two intermediary nodes.
3) Cyberspace advantages: A study performed using MATLAB highlights the ten most significant nodes, including the Strait of Malacca, Cape of Good Hope, East Asia, the Strait of Hormuz, the Strait of Gibraltar, Korean Strait, Africa, and Mandab Strait. These nodes demonstrate substantial spatial advantages and accessibility within the global shipping network, promoting quicker trade and transportation of crude oil with other nodes.
4) Network aggregation degree: The average clustering coefficient within the global COSN is 0.762. This high clustering level suggests that the network shows increased fault tolerance and enhanced stability when facing potential attacks.
5) Network transportability: The global efficiency ratio of the COSN stands at 0.8, indicating that the present global crude oil transportation system can achieve effective movement via shorter maritime routes, leading to high overall transport efficiency in stable conditions.
4.5 COSN performance under disruption strategies simulation
1) Research indicates that the structural changes in the COSN vary significantly under different attack strategies. Analysis of Figure 5 reveals that when the network experiences intentional attacks—such as degree attacks, closeness attacks, betweenness attacks, and PageRank attacks—a failure node ratio of 0.5 can result in a decline in network resilience of over 80%. Among these strategies, the betweenness attack exerts a particularly pronounced impact on the network structure; specifically, the removal of nodes with high betweenness centrality (such as the Strait of Malacca, the Strait of Hormuz, and crucial nodes in Eastern Europe) significantly accelerates the decline in the network’s average degree. In contrast, the clustering attack exhibits minor fluctuations in the early stages, but its impact on the tightness of network node connections becomes significantly more pronounced in the later stages. Comparatively, a random attack requires a failure node ratio of 0.9 to induce network failure, indicating that random node removal has a relatively mild impact on the network. Overall, the COSN is more susceptible to deliberate attack strategies, particularly targeted attacks on high-centrality nodes, which significantly weaken the network’s resilience, while the effects of random disturbances are relatively limited.
2) Changes in network aggregation are illustrated in Figure 6. As the proportion of failed nodes in the network increases, the aggregation coefficient exhibits fluctuations and a downward trend, suggesting a gradual loosening of the network and a decline in the degree of aggregation. Notably, when the network is subjected to targeted attack strategies such as degree attack, closeness attack, betweenness attack, and PageRank, network resilience is completely compromised when the proportion of failed nodes reaches approximately 0.6. Conversely, when the proportion of failed nodes is below this threshold, the COSN demonstrates high stability, which can be attributed to its significant degree of network agglomeration. In contrast, under edge attack (i.e., capacity attack) strategies, a strong negative linear correlation is observed between the proportion of failed nodes and the clustering coefficient, indicating that the network exhibits considerable resilience to reductions in capacity supply.
3) Changes in Network Transportability. Figure 7 illustrates that under various attack strategies—namely, betweenness attack, closeness attack, PageRank attack, and degree attack—the efficiency of network transportation decreases in a stepwise manner as the number of attacked nodes increases. When the proportion of failed nodes is below 30%, the network efficiency remains relatively stable, indicating a high level of resilience. However, once the proportion of failed nodes reaches between 40% and 60%, there is a dramatic decline in network efficiency, with a reduction of nearly 50%. This indicates a growing sensitivity of the COSN and an increasing difficulty in ship operations.
4) The results depicted in the Figure 8 indicate that the proportion of the maximum connected subgraph in the COSN exhibits a stepwise decline under different attack strategies, with significant differences in sensitivity. Notably, the network demonstrates a high sensitivity to betweenness attacks; when the proportion of failed nodes reaches 40%–60%, the decline in the maximum connected subgraph proportion exceeds 70%. This suggests that the removal of nodes with high betweenness centrality (such as critical route nodes) can cause catastrophic damage to network connectivity. In contrast, deliberate strategies such as degree attacks, closeness attacks, and PageRank attacks require the proportion of failed nodes to approach 70% to induce a significant decline, displaying a gradual decrease in the early stage followed by an acceleration in the later stage. This reflects the delayed and cumulative effects of these types of attacks on network connectivity. Under random attack strategies, the decline in the maximum connected subgraph proportion is more moderate, indicating that the destructive impact of randomly removing nodes or targeting clustering characteristics on overall network connectivity is significantly lower than that of directed attack strategies.
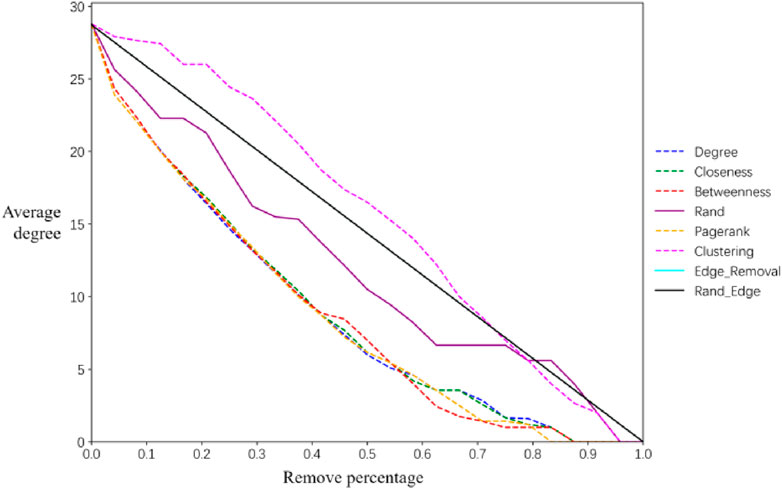
Figure 5. The change on the network average degree of COSN under destruction mode.
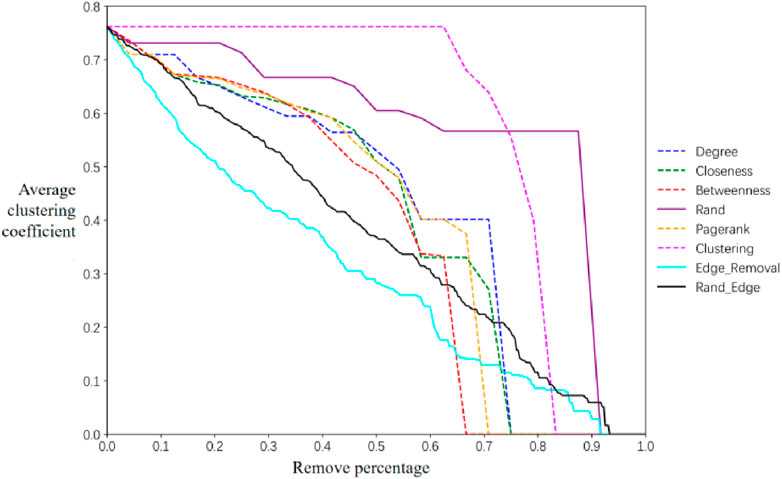
Figure 6. The change on the network average clustering coefficient of COSN under destruction mode.
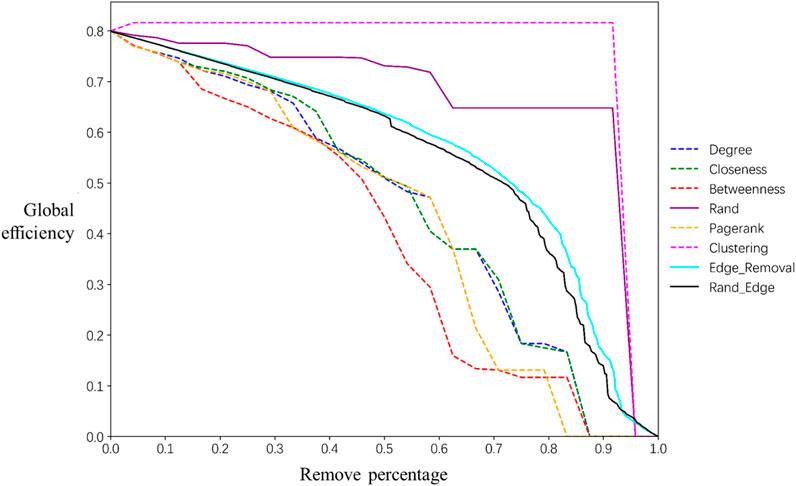
Figure 7. The change on the network global efficiency of COSN under destruction mode.
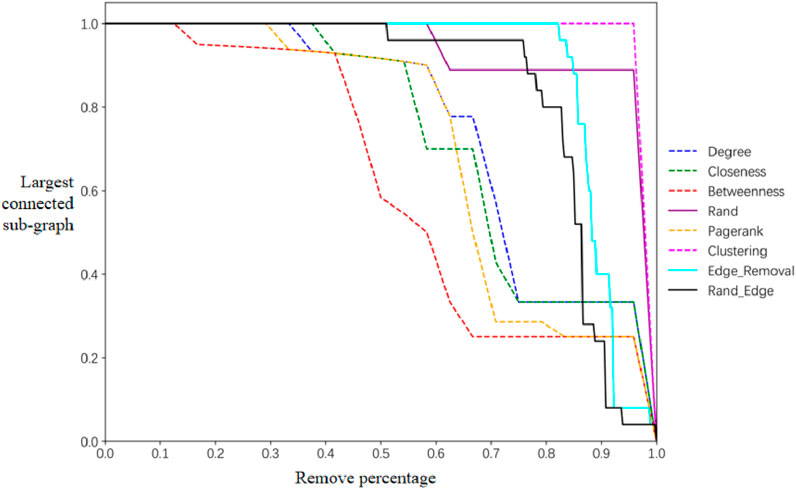
Figure 8. The change on the network scale of the largest connected sub-graph of COSN under destruction mode.
This study considers the current situation and examines the impact of blockages in key waterways, such as the Strait of Hormuz and the Strait of Malacca, on the global COSN.
1) The Strait of Hormuz is currently blocked. This strait, situated between Oman and Iran, serves as a critical passage for crude oil shipments originating from the Persian Gulf region in the Middle East. The attack on the Strait of Hormuz, which effectively severed this key node, resulted in a 6% decrease in the average degree of the COSN, a 1.8% reduction in graph density, a 2% decline in the average clustering coefficient, and a 1% increase in average path length. These changes underscore the significant impact that the Strait of Hormuz has on the efficiency of local transportation networks.
2) The Strait of Malacca serves as a vital choke point in the global oil trade, facilitating around 25% of the world’s crude oil transport. When this strait is attacked, the average rate of change in the COSN decreases by 9.1%, which exceeds by 3% points the decline seen in the Strait of Hormuz. Furthermore, the density of the graph diminishes by 5.2%, indicating that the linkage between the Strait of Malacca and other points is stronger compared to Hormuz. Additionally, the average clustering coefficient experiences a reduction of 3.6%, whereas the average path length rises by 3.1%. These indicators demonstrate that the influence of the Strait of Malacca on the COSN is more significant than that of the Strait of Hormuz. Therefore, an attack on this location would notably disrupt the global transportation of crude oil.
Therefore, the adoption of various attack strategies on the network reveals that when more than 40% of the nodes fail, the resilience of the COSN begins to decline. This decline is characterized by a decrease in network aggregation, an increase in average path length, a reduction in global efficiency, and a hindrance to transportation efficiency. Notably, a targeted attack on specific nodes, such as the Strait of Hormuz and the Strait of Malacca, results in minimal overall change to the COSN, demonstrating good resilience. Furthermore, comparative data indicates that an attack on the Strait of Malacca has a more significant impact on the COSN than an attack on the Strait of Hormuz.
4.6 CSI index analysis
Figure 9 illustrates that significant maritime connectivity nodes, including the Straits of Malacca, Suez Canal, Strait of Hormuz, Mandab Strait, Strait of Gibraltar, and Cape of Good Hope, serve as vital bridge- or link-type transportation hubs. Major energy-importing regions are East Asia and South Asia. In contrast, Southeast Asia primarily functions as a transit zone. Energy-exporting nodes are Africa, Middle East, North America, and South America. The three categories of regional nodes exhibit a notable degree of interconnectivity with surrounding nodes, characterized by numerous routes and substantial freight movement. Furthermore, the proposed calculation method closely corresponds with the identified urban nodes, as well as those demonstrating high freight volumes and connectivity in real-world transportation scenarios. This highlights the logical and scientific foundation of the index to some extent. Therefore, it is crucial to prioritize the enhancement of safety and security features at these nodes to strengthen the resilience of maritime corridors for global crude oil transportation.
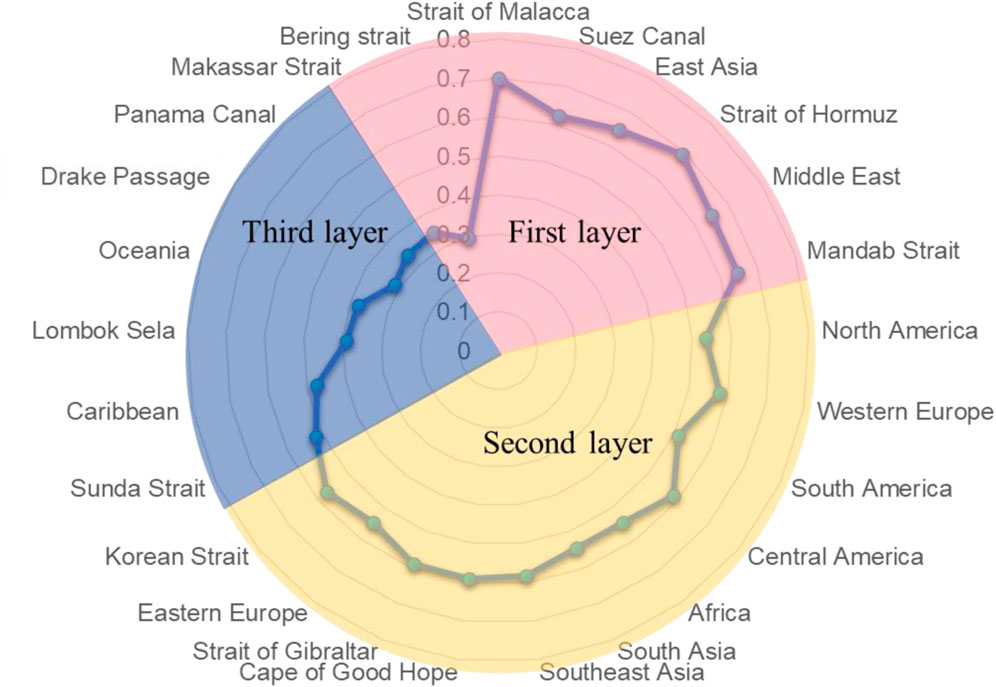
Figure 9. CSI index result analysis.
5 Conclusion and policy implications
5.1 Conclusion
1) Overall, the COSN demonstrates greater resilience against random attacks; however, it is significantly more susceptible to deliberate attacks, resulting in a higher degree of damage.
2) From the perspective of network characteristics, following random attacks, the average path length, global efficiency, average clustering coefficient, and proportion of the maximum connected sub-graph decline gradually. Even after the failure of a majority of nodes, the network continues to operate effectively, indicating high resilience levels. In contrast, when nodes are deliberately attacked and 40%–60% of them are removed, the network’s functionality is severely compromised, leading to increasingly difficult transportation.
3) Focusing on critical nodes, the Strait of Hormuz and the Strait of Malacca serve as vital maritime conduits for crude oil transportation, facilitating the movement of crude oil in most import and export regions. Analysis reveals that an attack on the Malacca Strait exerts a more significant impact on the network than an attack on the Hormuz Strait.
4) The CSI index quantitatively reflects the importance and reliability of nodes within the COSN. Furthermore, the index aligns with the actual transportation network conditions, thereby validating the reliability of the model. This model can also be utilized for the quantification of other transportation network nodes in the future.
This study constructs COSN based on AIS data and innovatively proposes multi-dimensional attack strategy. By leveraging complex network theory and systematic methodologies, a multi-dimensional evaluation and analytical framework for COSN is established. The developed CSI index enables the quantitative hierarchical identification of critical nodes. The theoretical framework and methodological system constructed in this research not only provide scientific criteria for categorizing the significance levels of crucial nodes but also establish a universally applicable analytical approach for the competitive assessment of crude oil transportation networks. Through in-depth case studies, including well-known instantaneous disruption events such as the 2021 Suez Canal blockage, the rationality and universality of the static instantaneous terminal assumption model are further validated, thereby strengthening the practical significance of the proposed framework.
Notably, while the proposed framework offers practical solutions for enhancing network resilience during emergent events and systemic shipping crises, it has certain limitations. The current study focuses on the immediate impacts of extreme events and the identification of critical nodes within the COSN, without considering the transceiver capabilities of ports. Furthermore, it assumes that attacks are instantaneous, thereby overlooking the influence of temporal factors such as nodes recovery processes, real-time route adjustments, and changes in capacity utilization. For future research, it is essential to integrate port transceiver capabilities and time variables into the analytical model. By analyzing changes in the resilience of the COSN within a specified time window, researchers can capture the dynamic evolution of the network under disruptions. Additionally, developing optimization strategies to enhance network resilience post-attack should be a key research direction. These efforts will contribute to constructing a more comprehensive and dynamic analytical framework for COSN, ultimately providing more accurate and effective support for maritime energy security operations.
5.2 Suggestion
To systematically enhance the resilience of global maritime routes, it is suggested to adopt multi-dimensional and progressive intervention measures.
Firstly, to effectively mitigate the operational risks posed by sudden channel closures, shipping companies should strengthen their risk hedging mechanisms by ensuring adequate commercial insurance products, thereby establishing a multi-layered risk transfer system. Constructing specialized crude oil storage facilities at high CSI nodes can form a regional strategic buffer inventory, effectively alleviating the impact of sudden disruptions on the supply chain.
Secondly, for maritime channels with high CSI values in COSN, such as the Strait of Hormuz and the Strait of Malacca, it is essential to continuously enhance navigational capacity and accelerate the upgrading of navigation aids while closely monitoring abnormal vessel conditions to reduce the risk of navigational congestion. Besides, a phased construction of an integrated transportation network combining maritime, railway, and pipeline systems will also be implemented. Additionally, the commercialization of the Northeast Passage in the Arctic will be promoted to create an alternative transportation matrix to traditional choke points, thereby reducing systemic risks associated with reliance on single routes such as the Strait of Malacca.
Thirdly, establishing a global shipping real-time monitoring platform based on IoT and blockchain technology. This platform should integrate AIS data with satellite remote sensing data and develop a multi-dimensional risk assessment model that encompasses piracy activities, waterway congestion, and extreme weather events.
Fourth, within the framework of the International Maritime Organization (IMO), it is to improve the multilateral cooperation mechanism by focusing on standardizing polar navigation rules, unifying carbon emission accounting systems, and establishing a transnational emergency resource dispatch fund to address regional supply chain disruption risks.
Finally, guide enterprises in implementing a distributed layout strategy for global supply chain nodes to mitigate the risks of supply chain disruptions caused by geopolitical and natural disasters.
Data availability statement
The raw data supporting the conclusions of this article will be made available by the authors, without undue reservation.
Author contributions
WQ: Writing – original draft. ZZ: Writing – review and editing. MC: Conceptualization, Data curation, Writing – review and editing. JZ: Data curation, Writing – review and editing.
Funding
The author(s) declare that no financial support was received for the research and/or publication of this article.
Conflict of interest
The authors declare that the research was conducted in the absence of any commercial or financial relationships that could be construed as a potential conflict of interest.
Generative AI statement
The author(s) declare that no Generative AI was used in the creation of this manuscript.
Publisher’s note
All claims expressed in this article are solely those of the authors and do not necessarily represent those of their affiliated organizations, or those of the publisher, the editors and the reviewers. Any product that may be evaluated in this article, or claim that may be made by its manufacturer, is not guaranteed or endorsed by the publisher.
References
1. Yu J, Fang Z, Hu X, Yu H, Wang Z. Analysis of changes in maritime transport networks for strategic materials affected by attacks in the Red Sea. Geomatics Inf Sci Wuhan Univ (2024).
2. Jiang H, Hu L, Chen H, Yuan H. Simulation and regulation study on crude oil supply chain risk under disruptive events: based on system dynamics approach. Syst Eng - Theor and Pract (2024).
3. Tian W, Deng G, Wu P Complexity analysis of the world shipping network. J Dalian Univ Technology (2007) 4:605–9.
4. Li ZF, Yan ZL. A risk assessment of strategic sea lanes based on blind number theory. J Wuhan Univ Technology Sci Eng (2014) 38(01):16–20.
5. Zong K, Hu ZH. Connectivity analysis of ports along the MSR. J Guangxi Univ (Natural Sci Edition) (2016) 41(05):1423–31.
6. Wu J. Evaluation of the resilience of the shipping network of the maritime Silk Road. Wuhan University of Technology (2020).
7. Xiao F. Resilience study of the 21st century Maritime Silk Road container shipping network based on port backup mechanism. Dalian Maritime University (2023).
9. Rose A. Economic resilience to natural and man-made disasters: multi-disciplinary origins and contextual dimensions. Environ Hazards (2007) 7(4):383–98. doi:10.1016/j.envhaz.2007.10.001
10. Maimun A, Nusyirwan IF, Priyanto A, Sian AY, Rahimuddin , Jalal MR (2012).Navigational risk assessment in restricted waters by using AIS data. Proceeding of 2012 International conference on maritime technology: 2012 International conference on maritime technology (ICMT2012), 25-28 June, 2012, Harbin, China.390–4.
11. Omer M, Ali M, Nilchiani R, Mansouri M. A framework for assessing resiliency of maritime transportation systems. Maritime Policy and Manag The flagship J Int shipping port Res (2012) 39(7):685–703.
12. Wang N, Dong LL, Wu N, Yan HK. Changes in the vulnerability of the global container shipping network under intentional attacks. Acta Geographica Sinica (2016) 71(02):293–303.
13. Ducruet C. The polarization of global container flows by interoceanic canals: geographic coverage and network vulnerability. Maritime Policy and Management (2016) 43(2):242–60. doi:10.1080/03088839.2015.1022612
14. Wu D, Wang N, Wu N, Lin WN. The impact of main channel interruption on vulnerability of container shipping network and China container shipping. Geographical Res (2017) 36(4):12.
15. Liu HL, Tian ZH, Huang AQ, Yang Z. Analysis of vulnerabilities in maritime supply chains. Reliability Eng Syst Saf (2018) 169:475–84. doi:10.1016/j.ress.2017.09.018
16. Yuan CY, Hsieh CH, Su DT. Effects of new shipping routes on the operational resilience of container lines: potential impacts of the Arctic Sea Route and the Kra Canal on the Europe—Far East seaborne trades. Maritime Econ and Logistics (2020) 22:308–25. doi:10.1057/s41278-019-00128-4
17. Huang FY, Li S. Analysis of the survivability of China's crude oil network based on complex network theory. China Water Transport (2019) 19(9):74–6.
18. Wan CP, Tao JL, Yang Z, Zhang D. Evaluating recovery strategies for the disruptions in liner shipping networks: a resilience approach. The Int J Logistics Management (2022) 33(2):389–409. doi:10.1108/ijlm-05-2021-0263
19. Wang ZH, Hu WQ, Wang YW. Resilience evaluation of the Yangtze River Delta and Guangdong-Hong Kong-Macao greater bay area shipping networks based on complex networks. J Transportation Syst Eng Inf Technology (2023) 23(5):184–93.
20. Poo MCP, Yang Z. Optimising the resilience of shipping networks to climate vulnerability. Maritime Policy and Management (2022) 51(1):15–34. doi:10.1080/03088839.2022.2094488
21. Xu MQ, Zhu Y, Deng W, Li T. Assessing the efficiency and vulnerability of global liner shipping network. Glob Networks (2023) 23(2):335–55. doi:10.1111/glob.12445
22. Chlomoudis CI, Kostagiolas PA, Lampridis CD. Quality and safety systems for the port industry: empirical evidence for the main Greek Ports. Eur Transport Res Rev (2011) 3(2):85–93. doi:10.1007/s12544-010-0043-0
23. Sun X, Liu C, Chen X, Li J. Modeling systemic risk of crude oil imports: case of China’s global oil supply chain. Energy (2017) 121:449–65. doi:10.1016/j.energy.2017.01.018
24. Yuan M, Zhang HR, Wang BH, Huang L, Fang K, Liang Y. Downstream oil supply security in China: policy implications from quantifying the impact of oil import disruption. Energy Policy (2020) 136:111077. doi:10.1016/j.enpol.2019.111077
25. Zhong M, Tai M. Enhancement strategies of crude oil maritime supply chain network resilience under uncertain disturbances. J Shanghai Maritime Univ (2024) 45(3):40–9.
26. Zhao PJ, Zhao T, Zhang MZ, Xiao T. Structural characteristics and changes of COSN along the Belt and Road in the context of the Russia-Ukraine conflict. Trop Geogr (2024) 44(5):820–37.
27. Su W, Lv J, Zhang LH. Optimization of recovery strategy for China's crude oil import maritime network from a resilience perspective. Transportation Syst Eng Inf (2024) 1–9.
28. Chen Y, Msofe ZA, Wang C. Asymmetric dynamic spillover and time-frequency connectedness in the oil-stock nexus under COVID-19 shock: evidence from African oil importers and exporters. Resour Policy(2024) 90:104849. doi:10.1016/j.resourpol.2024.104849
29. Chen Y, Msofe ZA, Wang C, Chen M. Time–frequency connectedness between oil price shocks and stock returns under bullish and bearish market states: evidence from african oil importers and exporters. Comput Econ(2024). doi:10.1007/s10614-024-10712-3
30. Zhang D, Ji Q, Kutan AM. Dynamic transmission mechanisms in global crude oil prices: estimation and implications. Energy(2019) 175:1181–93. doi:10.1016/j.energy.2019.03.162
31. Zhang D, Ji Q. Further evidence on the debate of oil-gas price decoupling: a long memory approach. Energy Policy(2018) 113:68–75. doi:10.1016/j.enpol.2017.10.046
32. Tian SG. Research on the robustness of product development process based on weighted directed graph. Xinjiang University (2013).
33. Wang GJ. Research on the structural resilience optimization of the logistics network in Central China under the blocking scenario. Chang'an University (2022).
34. Liu ML. Research on the survivability of China's high-speed railway network based on complex network theory. Beijing Jiaotong University (2019).
35. Wu J, Zhang D, Wan C. Resilience assessment of maritime container shipping networks– a case of the Maritime Silk Road. In: International Conference on Transportation Information and Safety; Liverpool, UK (2019). p. 252–9. doi:10.1109/ictis.2019.8883849
Keywords: maritime shipping, crude oil shipping network, complex network, channels, attack strategies
Citation: Qiu W, Zhang Z, Cui M and Zhu J (2025) Resilience and competitiveness analysis of the crude oil shipping network: identification of crucial nodes and impact of disruptions. Front. Phys. 13:1566892. doi: 10.3389/fphy.2025.1566892
Received: 26 January 2025; Accepted: 02 June 2025;
Published: 04 July 2025.
Edited by:
Hui-Jia Li, Nankai University, ChinaReviewed by:
Saulo Davi Soares E. Reis, Federal University of Ceara, BrazilYufeng Chen, Zhejiang Normal University, China
Manman Yuan, Inner Mongolia University, China
Lin Zhang, Shandong Normal University, China
Copyright © 2025 Qiu, Zhang, Cui and Zhu. This is an open-access article distributed under the terms of the Creative Commons Attribution License (CC BY). The use, distribution or reproduction in other forums is permitted, provided the original author(s) and the copyright owner(s) are credited and that the original publication in this journal is cited, in accordance with accepted academic practice. No use, distribution or reproduction is permitted which does not comply with these terms.
*Correspondence: Jishuang Zhu, empzQHd0aS5hYy5jbg==