 Nitesh Bhatia*
 Rui Costa
 Samuel Jackson
 Nathan Cummings
 Stanislas J. P. Pamela
 Shaun de Witt
 Alejandra N. Gonzalez BeltranRobert Akers
- Computing Division, United Kingdom Atomic Energy Authority, Abingdon, United Kingdom
The research and development of fusion energy technology is becoming increasingly complex and involving large amounts of diverse data like engineering CAD models, multi-physics simulations, and AI-based diagnostics. Such diversity and multi-modality of data necessitate the creation of advanced visualisation systems for improved data integration, accessibility, and usability. This study explores the adaptation of advanced visualisation techniques to fusion data through three core domains: (1) efficient analysis and instinctive exploration of heterogeneous datasets; (2) construction of visualisation pipelines enabling iterative refinement and retrospective analysis; and (3) deployment of new tools and technologies tailored to fusion-specific applications such as 3D visualisation, real-time dashboards, and immersive environments. As a result, this paper presents an integrative approach to combining diverse fusion data sources using advanced tools such as NVIDIA Omniverse, ParaView, Blender, Grafana, and WebXR. We further discuss a framework integrating simulation data, diagnostics, and design models into an interactive ecosystem. We demonstrate its effectiveness through key use cases, including camera-like MHD simulations, interactive diagnostic dashboards, and immersive AR/VR visualisation of tokamak data. These advances enhance scientific understanding, facilitate cross-disciplinary collaboration, and pave the way for future AI-driven adaptive visualisation in fusion research.
1 Introduction
Fusion is the process that powers the stars, including our Sun McCracken and Stott [1]; Harms et al. [2]; Baird [3]; Stix [4]. The process involves the combination of hydrogen isotopes, mainly deuterium and tritium, to form heavier nuclei, releasing enormous amounts of energy Taylor [5]; Harms et al. [2]. Unlike fission, fusion produces only low-level radioactive waste that decays much more rapidly, and generates minimal carbon dioxide emissions. This is because fusion energy does not burn fossil fuels. It has significantly lower life cycle emissions than conventional energy sources and is, therefore, essential to reducing global carbon emissions Cabal et al. [6]; Best [7]; Sánchez [8]. The successful development of fusion energy has the potential to revolutionise the energy landscape, by providing a reliable, sustainable and low-carbon alternative energy source. It can play a crucial role in combating climate change, and pave the way to a more sustainable energy future Tynan and Abdulla [9]; Suppes and Storvick [10]; Ghoniem [11].
Designing a fusion power plant and achieving the conditions required for sustained fusion reactions present significant challenges, including plasma stability and achieving the overarching goal of net energy gain Patterson et al. [12]; Linke et al. [13]. As a result, fusion research and development can be highly complex, often requiring a deep understanding of plasma physics, advanced materials, design engineering, and high-performance computing Chapman and Walkden [14]; Mills [15]; Morris et al. [16]; Duffy [17]. It is considered one of the greatest scientific and engineering challenges of our time Chapman and Morris [18]. Ongoing tokamak projects such as the International Thermonuclear Experimental Reactor (ITER) in France, the Spherical Tokamak for Energy Production (STEP) in the UK, the Experimental Advanced Superconducting Tokamak (EAST) in China, and the DIII-D National Fusion Facility in the USA, along with historical projects like the Joint European Torus (JET) in the UK, represent critical milestones toward achieving practical fusion energy production and addressing our future energy demands Holtkamp and Team [19]; Stambaugh et al. [20]; Sartori et al. [21]; Wan [22]. These projects push the boundaries of fusion research and development together with other large-scale tokamak fusion power plants around the world Zohm [23]; Fasoli [24].
Fusion power plants generate vast amounts of diagnostic data through onboard high-resolution cameras, sensors, spectrometers, and other diagnostic equipment Aymar et al. [25]. The data volumes can range from terabytes to petabytes during a single operational session Abla et al. [26]. Analysing such data demands significant computational resources, often leveraging high-performance computing (HPC) to perform complex simulations and train advanced machine learning models for deeper insights Churchill et al. [27]; Strand et al. [28]. The raw data post-processing can produce multiple additional petabytes of information. Understanding the data is particularly challenging due to the complexity and interconnectedness among the various components, arising from the fact that the data represents phenomena in multidimensional spaces Verdoolaege et al. [29]. However, the human mind primarily perceives in three spatial dimensions, which makes it harder to comprehend the intricate relationships and dynamics present in high-dimensional datasets. Roads and Love [30]; Malle [31]; Naini and Naini [32]. Visualisation serves as a crucial tool to overcome this limitation, by enabling researchers to project complex multidimensional data into formats that are more accessible and intuitive Dzemyda et al. [33]; Telea [34]; Liu et al. [35]. Advanced visualisation technologies, such as interactive 3D displays for visualising 3D models, interactive data explorations, and immersive virtual and augmented reality environments, empower researchers to study plasma behaviour, identify hidden patterns, and gain actionable insights that would be remain obscure from raw data alone Smolentsev et al. [36]; Favalora [37]; Blanche [38]; Balogh et al. [39]; Wood et al. [40]; Yang et al. [41]; Ohtani et al. [42].
This paper focuses on the visualisation tools, techniques, and applications specific to selected use cases within fusion research at the UK Atomic Energy Authority (UKAEA). The emphasis is on how advanced visualisation methods are crucial for understanding and interpreting the complex data associated with these particular use cases. It includes unique challenges and opportunities in fusion data visualisation, including specific data types, visualisation tools, techniques, and applications. The following research questions form guidelines for our study in the advanced visualisation techniques within the domain of fusion power plant design and research, paying particular attention to the interaction between data types, tools, tasks, and emerging technologies.
1. How can visualisation tools be tailored to handle effectively the diverse fusion data types while ensuring seamless integration and intuitive exploration?
2. Which advanced visualisation technologies, including 3D visualisation and interactive AR/VR, are best suited for real-time experiment control, anomaly detection, plasma dynamics analysis, and power plant engineering design?
3. What are the most effective visualisation methods to present the complex fusion research outcomes to interdisciplinary teams and stakeholders, including non-experts, in a clear and accessible manner?
2 Background
2.1 Advancements in fusion data visualisation
Significant advancements in the visualisation of fusion data have been made over the last decade. These improvements are primarily driven by the increasing complexity of the data generated by next-generation fusion power plants and facilities, including DIII-D, EAST, CFETR, KSTAR, and WEST. Table 1 provides a structured summary of the literature presented in sub-sections below, categorising key studies based on their visualisation workflows, tools, and applications in fusion data research.
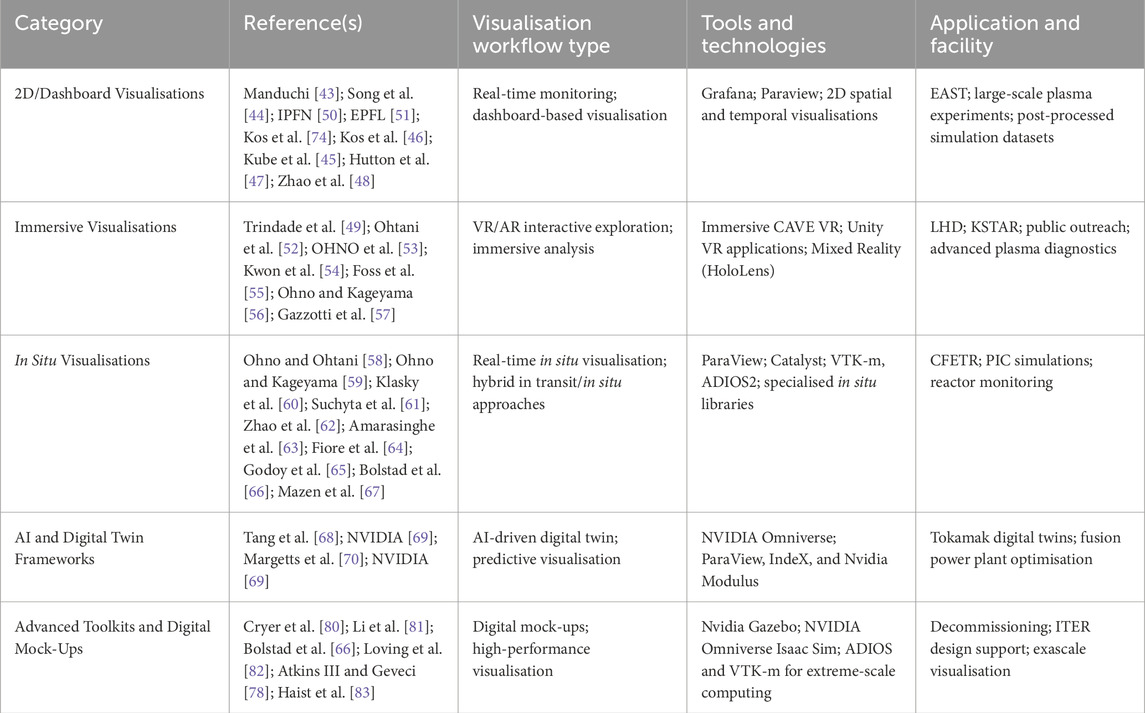
Table 1. Summary of Section 2, categorising according to visualisation workflows, tools, and applications in fusion data research.
2.1.1 2D and dashboard visualisations
Manduchi [43] has demonstrated how integrating industrial informatics with control systems in large-scale experiments enables dynamic, real-time dashboards using platforms such as Grafana. This approach has proven invaluable for monitoring complex datasets and managing plasma experiments. Similarly, Song et al. [44] showcased the effective use of real-time dashboard visualisation to capture plasma confinement dynamics during extended pulse discharges on the EAST facility. According to Kube et al. [45], the Delta framework enables near real-time, high-dimensional fusion plasma data analysis for immediate turbulence analysis and live machine-learning-aided visualisations, with the aid of HPC resources. In the context of simulation visualisation, the SOLPS-ITER Dashboard developed by Kos et al. [46] offers a customisable Graphical User Interface (GUI) for exploring SOLPS outputs. Additionally, complementary studies by Hutton et al. [47]; Zhao et al. [48] have highlighted the importance of 2D spatial mapping techniques for extracting key features from fusion data, further emphasising the significance of dashboard-based visualisation.
2.1.2 Immersive visualisation for fusion research
Immersive visualisation techniques have significantly transformed the field by enabling interactive exploration of multidimensional plasma data. Trindade et al. [49] introduced PlasmaVR, a virtual reality framework that enhances spatial awareness and depth perception, allowing for intuitive exploration of 3D plasma structures. Similarly, initiatives from the GoLP VR Lab IPFN [50] and the Laboratory for Experimental Museology at EPFL [51] have converted large-scale simulation datasets into immersive 3D visualisations, advancing scientific analysis and improving public outreach. Ohtani et al. [52] demonstrated a VR system using CAVE where users could interactively visualise magnetic field lines and iso-surfaces of plasma pressure for analysing fusion experiments in real time. Furthermore, OHNO et al. [53] extended this concept with a VR application using Unity, incorporating interactive panels for selecting visualisation types and simultaneously displaying experimental and simulation data. similarly, Kwon et al. [54] developed a virtual tokamak platform for K-STAR using Unity engine, integrating CAD visualisation and plasma simulations such as 3D magnetic perturbations for interactive monitoring and analysis of fusion experiments. Using mixed reality, Foss et al. [55] has discussed a Hololens-based visualisation workflow that integrates ParaView and Unity to enable immersive exploration of plasma simulation data. The VOIR project by Ohno and Kageyama [56] employs Unity with the OpenXR to enable interactive, VR-based analysis of fusion simulation data. Gazzotti et al. [57] provided a comprehensive analysis of the challenges and opportunities involved in using immersive technologies for fusion research, highlighting the potential of these technologies to transform the visualisation of complex plasma phenomena.
2.1.3 In situ and high-performance visualisation
In situ visualisation techniques have been further advanced by Ohno and Ohtani [58], who developed a visualisation tool for particle-in-cell simulations. Ohno and Kageyama [59] introduced a visualisation library for Yin-Yang grid simulations. Klasky et al. [60] and Suchyta et al. [61] have demonstrated interactive in situ frameworks for accelerating accelerated data exploration in large-scale fusion simulations. Zhao et al. [62], Amarasinghe et al. [63] and Fiore et al. [64] have addressed the challenges of integrating visualisation into exascale computing workflows, highlighting the need for robust, high-performance solutions. A particularly notable advancement in high-performance visualisation is the development of ADIOS2 by Godoy et al. [65] and VTK-m toolkit by Bolstad et al. [66]. While ADIOS2 distributed data streaming toolkit, VTK-m enables the efficient processing and visualisation of exascale datasets, ensuring that computational workflows remain scalable and effective in extreme-scale environments. Recent advances reported by Mazen et al. [67], in in-situ visualisation use Catalyst-ADIOS2 to address bandwidth limitations during data transfer. This method, called in-situ in-transit hybrid analysis, leverages Paraview Catalyst, allowing seamless switching between in situ, in transit, and hybrid analysis without altering the numerical simulation code. Data reduction typically happens in situ, with visualisation created in transit on the reduced dataset. Experiments have shown significant cost savings for certain visualisation pipelines, making this approach adaptable to varying data sizes, computing resources, and analysis needs.
2.1.4 AI-driven digital twin frameworks
Integrating AI and machine learning into visualisation workflows is increasingly being explored to streamline the development of digital twin frameworks in fusion research. The “AI-Machine Learning-Enabled Tokamak Digital Twin” framework proposed by Tang et al. [68] utilises the NVIDIA Omniverse platform to create interactive digital twins of fusion systems, allowing for near-real-time simulations and predictive analysis that are essential for optimising fusion power plant design and operation. As reported by NVIDIA [69], there is an ongoing collaboration between UKAEA and the University of Manchester on Fusion Digital Twin modelling using Omniverse Margetts et al. [70]. Furthermore, recent developments presented in NVIDIA [69, 146] have further integrated this platform with established tools such as ParaView, NVIDIA IndeX and NVIDIA Modulus, enhancing collaborative workflows and data interoperability.
2.1.5 Visualisation for cross-disciplinary collaboration
Looking at the collaborative aspects, fusion energy research brings together many different experts, including engineers, scientists, policymakers, and the general public. Each group has its way of understanding complex ideas, so clear and effective visualisation is essential. By turning large amounts of data into clear images and interactive models, visualisation helps people from different backgrounds work together to improve fusion technology. Ever since JET began operations, engineers and scientists have worked closely to design and enhance fusion power plants Wesson [71]. With the advent of CAD modelling and HPC, visualisation has emerged as the key enabler in bridging theory with practical applications, allowing for better understanding, optimisation, and control of fusion processes Iglesias et al. [72]; Sanders and Carman [73]. ITER’s SMITER toolkit Kos et al. [74] is one such example, which helps engineers to visualise how plasma heat interacts with materials inside a tokamak and modify cooling systems and component designs based on the inferences.
At the same time, physicists studying plasma behaviour use simulations like JOREK to model energy bursts and instabilities, which uses the VTK toolkit for visualisation Penko et al. [75]. MOOSE, a finite element framework Permann et al. [76], on the other hand, is widely used for simulating plasma-facing components, structural integrity, and thermal performance of reactor materials under extreme conditions. It features Peacock GUI Kitware [77] using VTK and Trame for interactive exploration of simulation results. XGC and GTC are complex gyrokinetic toolkits for simulating plasma turbulence and transport. XGC focuses on edge physics and diverter regions, while GTC primarily models core plasma dynamics. According to Atkins III and Geveci [78], both support advanced visualisation through VTK, VTK-m, Adios, and Python-based dashboards, enabling interactive in-situ analysis.
Instead of only looking at numbers and graphs, engineers can now rely on visual insights from these tools to build better control mechanisms for protecting reactor walls and ensuring safe and efficient operation. For instance, Someya et al. [79] utilised 3D neutronics simulations for enhancement of the design of DEMO fusion facility. The study demonstrates how a simulation based guidance may influence blanket module position, coolant system configurations, and remote handling practices to minimise radiation exposure and improve reactor safety. By including these visual analyses within the engineering process, groups can anticipate thermal distortion issues, residual heat management, and material activation in advance and design more robust and maintainable fusion reactor concepts. This ongoing interaction between simulation, design and cross collaboration is essential for the success of fusion technology.
2.1.6 Visualisation in digital mock-ups for commissioning, decommissioning, and remote handling
Advanced visualisation toolkits for large scale digital mock-up environments have significantly contributed to the field. These are aimed at enhancing the design, maintainence, and decommissioning of fusion facilities. Cryer et al. [80] provide a survey of digital mock-up tools for nuclear decommissioning, evaluating platforms such as CoppeliaSim, Gazebo, NVIDIA Omniverse Isaac Sim and Choreonoid. Li et al. [81] has discussed the use of VR-based digital mock-ups for designing ITER to support design collaboration, research, and training. The visualisation is aimed at improving understanding and analysis ITER development process. By integrating advanced visualisation, visual and haptic feedback, and graphical interfacesLoving et al. [82] and Haist et al. [83] have developed extensive remote handling systems that rely on visual feedback for operation, decommisioning of JET and support the installation of an ITER-like wall.
2.1.7 Summary
Collectively, these studies illustrate a diverse and evolving landscape in fusion data visualisation, from real-time 2D dashboards and in situ monitoring to immersive VR/AR exploration and AI-driven digital twins. Each contribution employs a range of data and specialised tools, such as Grafana, ParaView, NVIDIA Omniverse, Unity and various digital mock-up platforms that significantly enhance our ability to analyse and interpret complex plasma phenomena and optimise fusion power plant design and operation.
2.2 Visualisation for public engagement and policy communication
Visualisations are also crucial for policymakers and the general public because they make progress easier to communicate and gain support for fusion energy. Here, VR/AR technologies allow non-technical individuals to engage with designs and learn about the fundamentals of fusion without necessarily needing to have a technical background Laboratory [84]; Society [85]. Organisations such as EUROfusion Eurofusion [86], UKAEA UKAEA [87], PPPL PPPL [88], and Plasma Science and Fusion Center at MIT Science and Center [89] have been producing animated videos, interactive presentations, and virtual tours, which allow decision-makers and the public to gain an understanding of the potential of fusion energy.
2.3 UK’s role in advancing fusion technologies
The UK government has been actively promoting collaboration between researchers, industry, and policymakers to advance fusion energy through dedicated programmes and computing infrastructure. The Fusion Computing Lab (FCL) UKAEA [90] is a collaboration between the UKAEA and the STFC Hartree Centre that leverages advanced HPC, AI, and data visualisation to develop a digital twin of a fusion power plant. The work enables parallel testing and rapid optimisation to overcome technical and financial barriers in fusion energy research. The Fusion Futures programme UKAEA [91] and FOSTER (Fusion Open Science Training and Education for Researchers) UKAEA [92] support interdisciplinary training and collaboration, ensuring that experts in physics, engineering, and computational modelling work together effectively. Furthermore, the Fusion Industry Programme (FIP) UKAEA [93] is aimed at promoting the development of commercial fusion technology by strengthening partnerships between the UK government, private fusion companies, and the supply chain.
3 Materials and methods: building blocks for fusion data visualisation
3.1 Fusion data
Established industries and scientific research domains, including aerospace, defence, automotive, and advanced manufacturing, extensively utilise computational tools for design, analysis, and visualisation. Similarly, fusion engineering and research rely on diverse data that can be categorised into three key areas viz. computer-aided design (CAD) and engineering models, simulation-generated datasets, and data from diagnostics and experimental measurements Li [94]. Further summarised in Table 2, these categories correspond to the data generated from the design and operation of fusion components, power plants, and supporting facilities, spanning through design, operation, maintenance, and decommissioning stages. Each category plays a distinct role in the development of fusion as a viable energy source Aymar et al. [25]; Morris et al. [16]; Patterson et al. [12].
1. CAD and Engineering Data: Designed and developed using extensive CAD modelling and schematics, engineering CAD Data visualises structural and mechanical tokamak designs and allows checking for tolerances, assembly, and interactions between parts. For example, ITER’s CAD models help visualise complex systems like the vacuum vessel and divertors, ensuring efficient integration. The ITER CAD model file size is estimated to be around 20 terabytes of data spread across over 100,000 files, with weekly updates extracting data from various CAD tools to maintain a comprehensive model at a high level of detail Song et al. [95]; Aymar et al. [25]; Song et al. [96].
2. Simulation-generated Data: Aimed at modelling and predicting plasma behaviour and material dynamics, simulation data, often generated with the help of high-performance simulations, such as Magnetohydrodynamics (MHD), and Gyrokinetics turbulence models, provide a visual output of the plasma stability with magnetic confinement, enabling predictive performances for power plants Dimits et al. [97]; Van Dijk et al. [98]; Brieda [99]. These simulations can produce petabytes of data, requiring advanced storage, processing, and visualisation techniques to extract meaningful insights and ensure accurate predictive modelling Klasky et al. [100]; Kress et al. [101].
3. Diagnostics and Experimental Data: It captures real-time plasma observations through diagnostics, displaying them as 0D time traces (e.g., magnetic probes), 1D profiles (e.g., temperature or density), or higher-dimensional measurements (e.g., imaging systems). These diagnostics generate large volumes of high-frequency data, requiring efficient data processing and visualisation to extract meaningful insights Abla et al. [26]. Diagnostics, such as Thomson scattering, not only provide active visual feedback for comparing experimental results with predictions from design and simulation, but they are also essential for active control Young et al. [102]; Burrell [103]; Mukhin et al. [104].
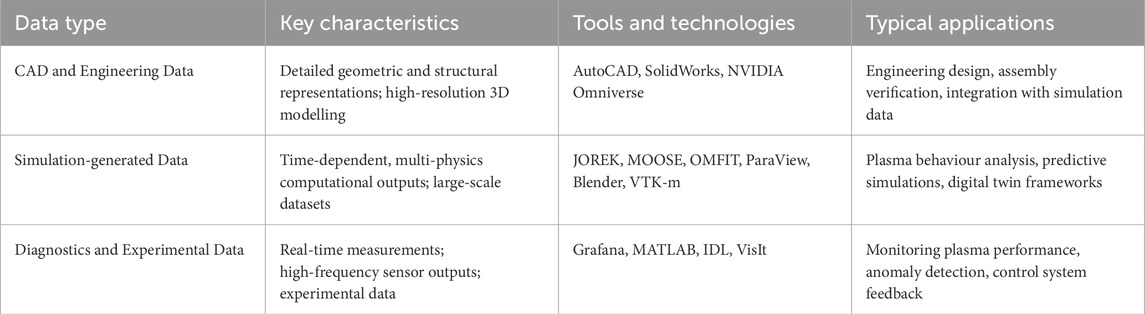
Table 2. Comparative summary of fusion data categories from Section 3.1: Functionality, key characteristics, tools, and applications.
3.2 Tools and technologies
Advanced visualisation plays an essential role at UKAEA in analysing complex data and gaining deeper insight from fusion research. This paper highlights a set of key technologies primarily composed of NVIDIA Omniverse, Paraview, Blender, Grafana, Unity, Unreal Engine and WebXR. Each contributes unique capabilities, relevant to the scope of this study and the use cases detailed in the next section. Further summarised in Table 3, these are tools that have been commonly used to visualise intricate details of fusion devices, plasma behaviour, and material interactions in an interactive and immersive manner. These tools allow researchers to explore vast datasets from multiple sources, such as 3D CAD models, simulation outputs, and diagnostic data, in a coherent, intuitive environment. Leveraging a “single source of truth” visualisation framework, streamlines collaboration, enhances decision-making, and ultimately provides insights into the behaviour of fusion systems. While this section emphasises key tools, it is not exhaustive, and other technologies beyond the scope of this paper are not covered.
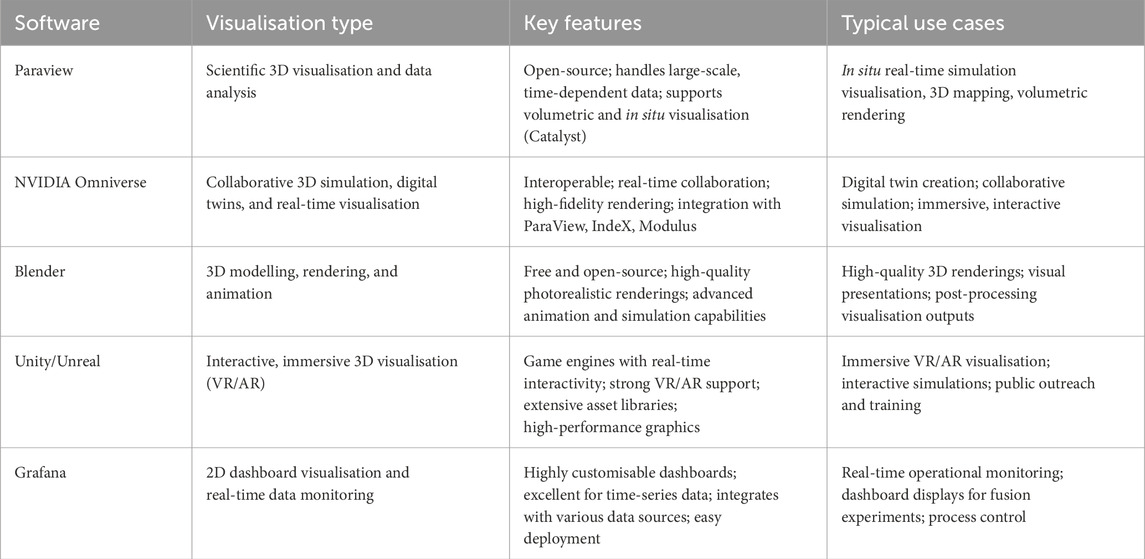
Table 3. Comparative summary of Visualisation tools from Section 3.2: Functionality, key features, and applications.
3.2.1 NVIDIA omniverse
NVIDIA Omniverse is a scalable, real-time collaboration and simulation platform to simplify visualisation, simulation, and design workflows Nvidia [105]; Ahmed et al. [106]. At its core, the Universal Scene Description (USD) open-source file format, enabled by Pixar, provides a shared and interoperable framework for complex datasets PixarAnimationStudios [107]. In the fusion research domain, Omniverse acts as the integration site for various types of data visualisation. 3D CAD models, simulation outputs, material properties, and diagnostics. By integrating these diverse data sources into a single USD-based environment, it facilitates visualisations and analyses workflows by providing a unified reference. Specifically, for visualisation workflows, USD serves as a state mirror for the independent data sources, ensuring consistency across tools and processes. While simulation or CAD data maintain their respective roles as Single Sources of Truth (SSOT) within their domains, USD effectively becomes the SSOT for visualisation workflows, streamlining and standardizing data representation Tang et al. [68]. It allows for the photorealistic rendering of fusion systems, such as merging CAD models of tokamak components with plasma dynamics from MHD simulations and material properties for surface interactions. Omniverse enables real-time collaboration on these diverse data sets, building insights through intuitive, interactive visualisation while maintaining consistency and alignment across disciplines. This approach accelerates research and also communicates to the stakeholders in a simplified and integrated manner, the complexity of fusion phenomena.
3.2.2 Paraview
Paraview is a multi-platform, open-source high performance data analysis and visualisation application widely used within the scientific research community to handle large-volume datasets Kitware [108]. The application is critical for visualising simulation data in fusion research, particularly those involving complex plasma dynamics such as MHD and Gyrokinetics models. Paraview adds the strength of handling high-dimensional data generated by fusion experiments, large-scale simulations, and sensor outputs, providing a robust environment for interactive exploratory analysis Penko et al. [75]. The capabilities of Paraview are further enhanced when combined with NVIDIA Omniverse, enabling seamless integration of scientific data visualisation within a unified framework Nvidia [109]. The Omniverse-Paraview Connector allows simulation outputs such as plasma behaviour, turbulence, and magnetic fields, visualised in Paraview to integrate with 3D CAD models that include material properties using Omniverse. The workflow reinforces the cohesive and interactive visual representation of fusion systems, reinforcing the concept of a single source of truth by ensuring that design models and simulation results are consistently represented and accessible in real-time. Omniverse further enhances Paraview’s visualisation capabilities by complementing its existing features, such as volume rendering, contour plots, and 3D spatial mapping, with real-time collaborative workflows and improved rendering fidelity. Researchers can leverage these capabilities to explore complex fusion phenomena with greater clarity and accuracy Moreland et al. [110]; Moreland [111].
3.2.3 Blender
Blender is a free, open-source 3D creation suite widely used in modelling, animation, rendering, and visualisation BlenderFoundation [112]. In the context of fusion research, Blender plays a crucial role in visualising complex fusion systems and simulations by providing highly detailed and physically accurate representations of fusion devices, such as tokamaks. Beyond generating visually compelling images, Blender’s physically based rendering (PBR) system is essential for interpreting complex datasets that would be difficult to grasp using more basic rendering techniques Kent [113]. By leveraging realistic light interactions, PBR enhances depth perception and spatial separation of intricate 3D features within the data, which is particularly beneficial for understanding multi-variable simulations and the behaviour of fusion plasmas within complex geometries Stacey [114]. Separating 3D features this way is critical for reducing cognitive load, improving understanding, and allowing for more intuitive data exploration. Blender’s rendering system, which includes the Cycles ray-tracing engine for high accuracy, photo-realistic rendering and the real-time Eevee engine for interactive visualisations, ensures that users can select the most suitable approach depending on the level of detail and interactivity required Astuti et al. [115]. Blender enables researchers to combine a wide range of data types, including 3D CAD models, simulation outputs, and material properties-when integrated with tools like NVIDIA Omniverse and Paraview in a unified, interactive environment. These advanced rendering abilities and other capabilities, such as real-time global illumination, allow accurate visualisations connecting simulation data with actionable insights. Furthermore, the integration of USD files enables Blender to function within Omniverse’s single-source-of-truth mechanism, embedding design models, simulation results, and material properties coherently for efficient joint exploration, as described in Section 4.2. Such a workflow allows high-fidelity data visualisation, enhancing research efficiency and decision-making in fusion technology development.
3.2.4 Grafana
Grafana is used to monitor and analyse data in real time GrafanaLabs [116]. With its open-source foundation, Grafana allows users to design and create customisable interactive dashboards that visualise data bound to time series for real-time monitoring of experimental conditions and diagnostics during fusion experiments Manduchi [43]. With Grafana, researchers are be able to combine live data streams from fusion devices, sensors, and simulations into dynamic visual displays Geng et al. [117]. These dashboards allow critical parameters such as plasma temperature, magnetic field strength, and diagnostic readings to be tracked, providing real-time insights that support decision-making and anomaly detection Hutton et al. [47]. With an intuitive interface to represent complicated datasets graphically in a straightforward way, Grafana is flexible in its integration; it therefore remains an indispensable tool for continuous monitoring, analysis, and performance evaluation in fusion research at UKAEA.
3.2.5 Unreal, unity, and WebXR
In addition to such tools as NVIDIA Omniverse, Paraview, and Blender, UKAEA applies the latest Unity and Unreal Engine technologies, along with WebXR, to further enhance this work of visualisation and interaction done with fusion data UnityTechnologies [118]; EpicGames [119]; MozillaFoundation [120]. Such platforms are useful in creating immersive, interactive experiences for researchers and stakeholders to delve into complex fusion systems in both real-time and virtual environments.
Both Unity and Unreal Engine are mature game engines that support rich development of interactive 3D visualisations and simulations out of the box. Within UKAEA, such tools are applied to the creation of virtual environments, which merge fusion data, such as 3D models of tokamaks, plasma simulations, and diagnostic results, with real-time interaction and analysis capabilities. Unity and Unreal are especially powerful for realising good-quality, photo-realistic visualisations and simulations that help understand how fusion systems would behave under different circumstances. Their flexibility allows for tuning to specific research needs, which range from detailed visual representations of plasma dynamics, to interactive walkthroughs of fusion power plant components Belotti and Juárez [121]; Keep et al. [122].
WebXR is a web-based platform for immersive experience development that is accessible directly from the browser MozillaFoundation [120]. It, therefore, enables the UKAEA to create, in WebXR, VR and AR applications that have allowed users to interact directly with fusion data without relying on any special hardware or complicated installation procedures. WebXR visualises tokamak and simulation results in AR/VR for intuitive, interactive insights, providing better understanding and communication to the users. These technologies can provide real-time collaboration and remote visualisation, which is also useful for stakeholders and teams not located at the place where the research facility is situated. Together, Unity, Unreal Engine, and WebXR form a powerful suite of tools to enhance the visualisations of fusion research by offering immersive and interactive platforms to explore, analyse, and communicate complex scientific data Kwon et al. [123].
3.3 Visualisation workflows
In the context of fusion research, the visualisation process ranges from real-time monitoring to in-depth post-analysis. Advanced tools such as Omniverse, Blender, Paraview, and Grafana, discussed in Section 3.2 enable these workflows, ensuring seamless data integration from design, simulation, and experimentation. These tools, all put together using visualisation workflows, enhance the ability of researchers to analyse, interpret, and optimise fusion systems Atkinson et al. [124].
3.3.1 Ad-hoc visualisations
Ad-hoc (or Post-hoc) visualisation workflows commonly focus on post-processing data to analyse and interpret the results Eppler and Burkhard [125]. They play an essential role in retrospective studies and refinement. We have been utilising tools like Paraview, Blender, and Omniverse to support such workflows effectively. Paraview is used for scientific visualisation and communication Ayachit et al. [126]. In contrast, Blender is utilised to create high-quality renderings and animations of fusion power plant designs and plasma simulations, mainly for engaging with non-experts and the general public Abramov [127]; Leppänen [128]. Omniverse, in turn, allows teams to collaboratively explore digital twins, refining 3D models and simulation data iteratively in an interactive environment Ahmed et al. [106]. Ad-hoc visualisation is important in validating theoretical models, preparing presentations, and publishing research findings.
3.3.2 In-situ visualisations
In-situ visualisation helps analyse the data in real-time, or sometimes near real-time, during a simulation, especially at an exascale level Klasky et al. [129]; Ma [130]. In this visualisation, no intermediate data storage is required. Hence, these can be quite effective when dealing with exascale data evolving from plasma simulations Harward et al. [131]. Paraview, using the Catalyst plugin, directly couples HPC workflows to process on-the-fly visualisations of plasma dynamics, such as instabilities or turbulence, while simulations run Bauer et al. [132]. It can help visualise the data in real time, reducing the data storage overhead and accelerating decision-making in complex computations Kress [133]. Omniverse Nucleus enables collaboration on in-situ workflows through simulation streams that are aligned with 3D environments Hummel and van Kooten [134]. Thus, researchers can observe plasma behaviour in a digital twin while simulations are executed on the HPC systems and immediately change parameters and conditions Davis et al. [135].
3.3.3 Diagnostic visualisations
Diagnostic visualisation workflows provide live data from experiments and operational data in real time, enabling insight into monitoring and decision-making. This would ideally be suited for tools like Grafana, Unity, and Unreal Engine. Grafana allows for real-time dynamic dashboards displaying experimental parameters such as plasma temperature, density, and magnetic fields; this enables the detection and troubleshooting of instabilities during tokamak experiments Geng et al. [117]; Chen et al. [136]. Unity provides immersive interfaces where researchers can interact with real-time experimental data in virtual environments, making it valuable for training and operational diagnostics Kwon et al. [54]; Li et al. [137]. Meanwhile, Unreal Engine merges diagnostic data and photorealistic rendering to simulate the effects of parameter changes on plasma behaviour for a deeper understanding of live experiments Lennholm and Anderson [138]; Belotti and Juárez [121]; Kwon et al. [123].
3.4 Summary
The methods and techniques in this section provide the groundwork for the subsequent results and use cases presented in Section 4. Building a visualisation pipeline with various fusion data sources presented in Section 3.1 establishes a framework (Section 4.1) for near real-time analysis, post hoc interpretation, and immersive data exploration. The coalition of ad hoc and in-situ visualisation workflows, enabled by tools discussed in Section 3.2 leads to the integration of simulation, design, and diagnostic information. This facilitates more intuitive and interactive analysis of the data but opens the door to new applications in fusion digital twins, photorealistic rendering, and immersive VR/AR-based insights, as presented in the subsequent outcomes. Specific use cases showcasing these capabilities are explored in Sections 4.2–4.4.
4 Results
4.1 Towards an integrative fusion data visualisation framework
This section combines the key elements discussed in Section 3 into an integrative block diagram, as shown in Figure 1. The diagram begins with “Fusion Data” sources, which include CAD models, simulation outputs, and diagnostic measurements generated by fusion power plants and facilities. These raw data undergo a preprocessing stage, where filtering, cleaning, and format conversion are generally performed to ensure compatibility with subsequent processing. The core of the diagram details multiple visualisation workflows, categorised into ad hoc visualisation for post-processing static analysis, in situ visualisation for real-time integration with simulation, immersive visualisation for interactive VR/AR exploration, and AI-driven digital twin frameworks for predictive analytics. Following these workflows, specialised processing and analysis tools such as VTK, ParaView, NVIDIA Omniverse, Grafana, and Unity/Unreal are employed to render and analyse the data. Finally, the visualised outputs are delivered to end-users through 2D/3D visualisations, dashboards, photorealistic renderings, immersive experiences, and interactive digital twins, with feedback loops incorporated to refine and optimise the entire visualisation pipeline. The framework aims to streamline fusion data processing and visualisation by creating a unified environment where all data components are consolidated into a single source of truth. This integrated approach simplifies the overall process, ensuring that every team member works with the same up-to-date and comprehensive dataset. The next three sections discuss use cases, each detailing visualisation workflows in fusion research.
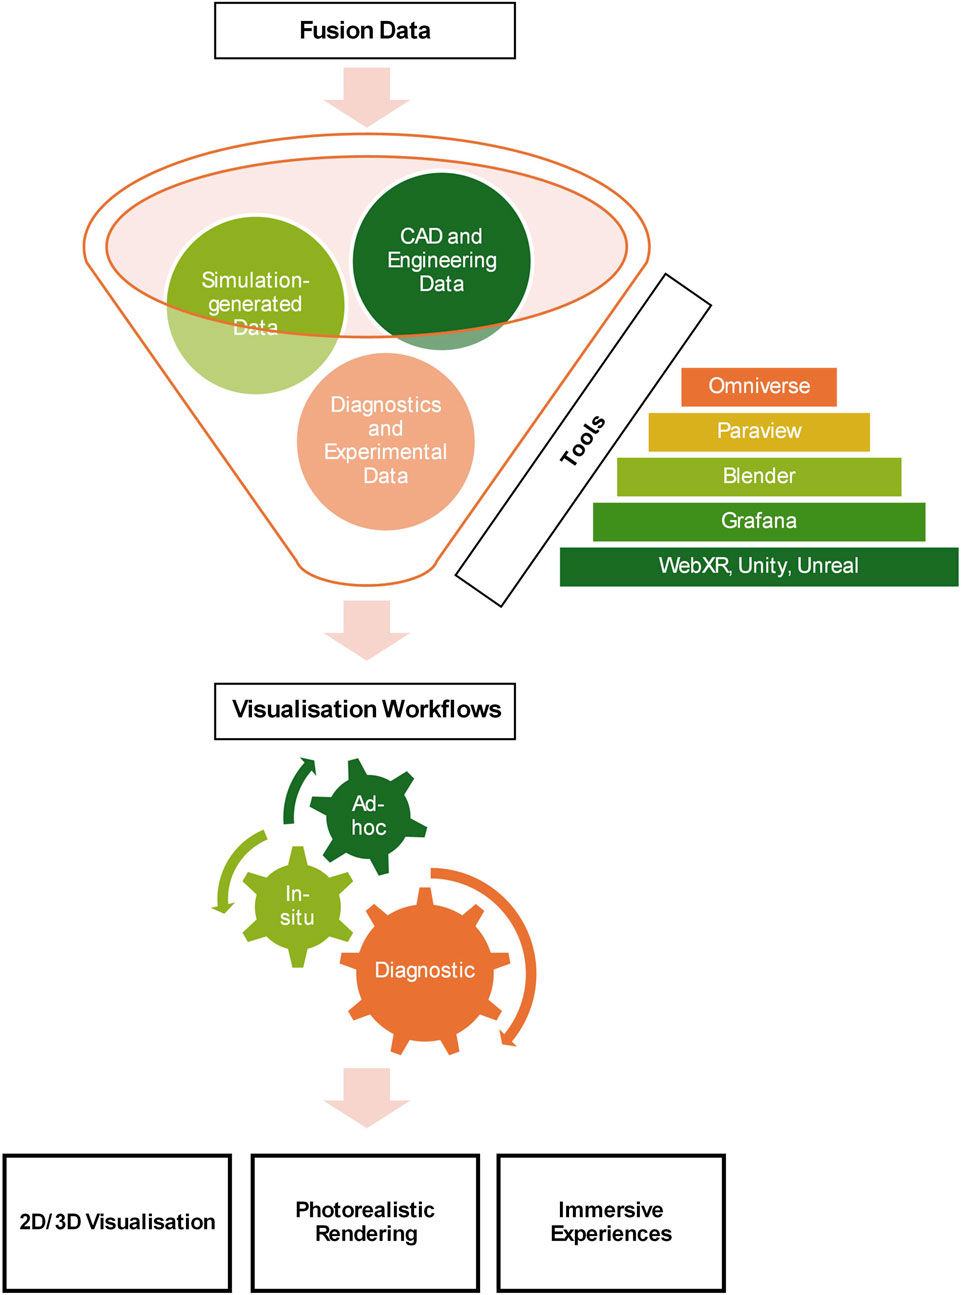
Figure 1. Block diagram illustrating the integration of fusion data sources (CAD, simulation-generated, and diagnostics) using key tools (Omniverse, ParaView, Blender, Grafana, Unity/Unreal) and visualisation workflows (ad hoc, in situ, diagnostic), resulting in final results such as 2D/3D visualisations, photorealistic renderings, and immersive experiences.
4.2 Photorealistic and camera-like visualisations of MHD simulations in fusion experiments
This use case outlines a method for producing photorealistic visualisations of MAST-U simulation data using the simulated camera to mimic the output of a realistic MAST-U camera. As shown in Figure 2, by combining simulation results with the CAD model of the MAST-U tokamak, this workflow produces realistic images that reflect real-life camera perspectives through photorealistic rendering techniques Hoelzl et al. [139]; Smith et al. [140]. The workflow benefits fusion engineers, simulation scientists, and stakeholders interested in understanding and optimising tokamak operations.
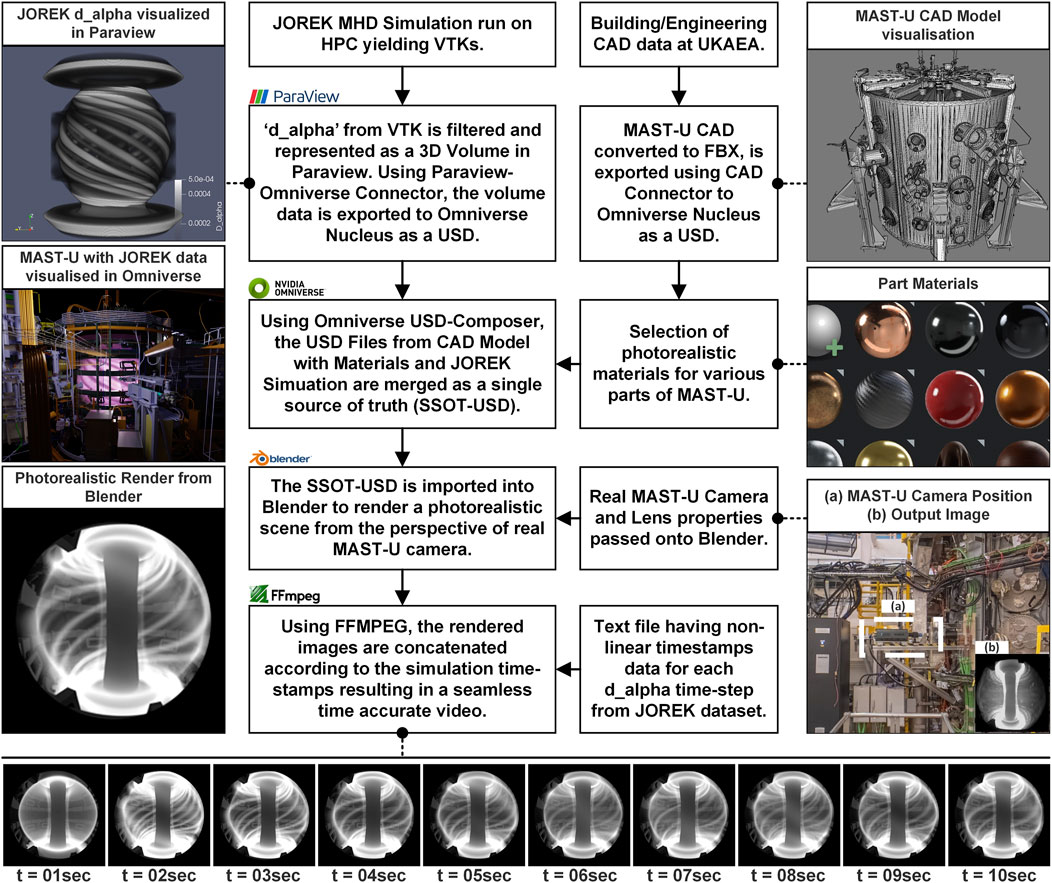
Figure 2. Workflow for Generating Camera-Like Visualisations of JOREK MHD Simulation Data in the Context of MAST-U Tokamak. This figure shows the workflow of producing photorealistic renderings that imitate real camera outputs. This workflow combines JOREK simulation data with the MAST-U CAD model using Paraview, NVIDIA Omniverse, and Blender. The resulting images are rendered with camera properties aligned to the MAST-U experimental setup, producing realistic and time-accurate visualisations.
To start, JOREK simulations are run on an HPC system, generating approximately 4TB of data as VTK files. In these files, variables such as electron density, electron temperature and neutrals density are used and to represent d
Simultaneously, the CAD model of the MAST-U tokamak, which is approximately 200 GB in FBX format, is converted and exported to Omniverse Nucleus as a USD file. The simulation data and CAD model are merged into a Single Source of Truth USD (SSOT-USD) file in NVIDIA Omniverse USD Composer. Photorealistic materials are assigned to different parts of the tokamak as shown in Figure 3, enhancing realism and creating a unified dataset that accurately represents the fusion device NVIDIA [141]. Using the SSOT-USD, Figure 4 shows the MAST-U tokamak rendered in Omniverse with the vessel hidden to expose plasma filaments from JOREK simulation data, providing an unobstructed view of plasma filaments and tokamak geometry.
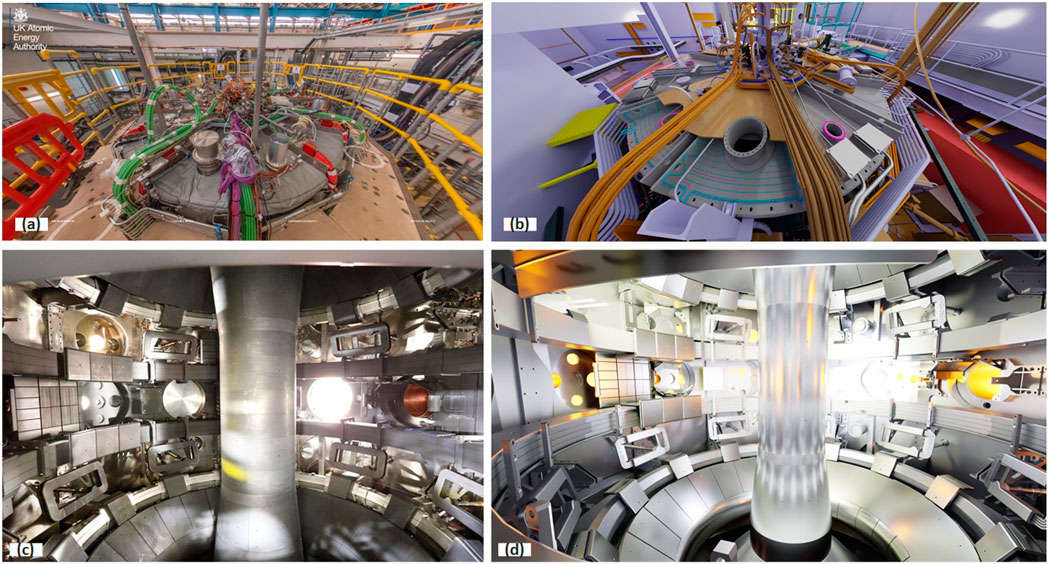
Figure 3. A comparison of real and rendered views of the MAST-U tokamak. (a) Top view of the real MAST-U tokamak located at UKAEA. (b) Top view of the MAST-U tokamak rendered in Omniverse. (c) Internal vessel view of the real MAST-U tokamak. (d) Internal vessel view of the MAST-U tokamak rendered in Omniverse, showcasing photorealistic materials, highlighting accurate rendering of internal components.
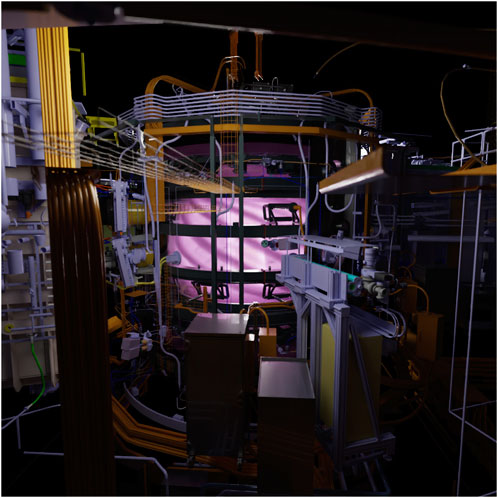
Figure 4. MAST-U tokamak rendered in Omniverse with the vessel hidden, revealing plasma filaments from JOREK simulation data.
The SSOT-USD file is then imported into Blender using the Omniverse-Blender connector. For matching the experimental setup, camera properties of the real camera, such as lens characteristics and positions, are used for creating a synthetic camera in BlenderFoundation [142]. At this stage, an emissive shader is applied to the volumetric data corresponding to d
As JOREK is a non-linear code, the simulation accounts for the nonlinearity of the MHD equations. To capture the plasma’s dynamic behaviour, the time-step size is adjusted during the simulation to correctly resolve periods of high activity and faster time scales, which is integral to JOREK. As a result, the generated image sequence from the previous step consists of non-linear time steps. A text file with timestamp data from simulation data is then generated, mapping these time steps to the corresponding rendered images. Using this mapping and combining the frames, FFMPEG creates a seamless video that accurately reflects the temporal evolution of plasma dynamics (d
This workflow delivers several benefits. First, the visualisations generated by this workflow allow researchers to analyse plasma behaviour in a highly realistic context. Additionally, non-experts can benefit from the visualisations’ ability to illustrate intricate phenomena. Furthermore, accurate representation of non-linear time ensures that simulated results are consistent with physical conditions, providing reliable evidence for tokamak design and operating conditions.
4.3 Interactive 2D/3D visualisation of diagnostic data
Figure 5 illustrates the Fusion Diagnostic Data Visualisation Dashboard, developed to analyse data from one of the experimental campaigns of the MAST tokamak. This dashboard is implemented using Grafana and further enhanced using WebXR. The dashboard provides an intuitive interface consisting of several panels, each representing a specific diagnostic or operational parameter recorded during the experiment. Examples include camera images of the MAST centre column and various time series profiles including,
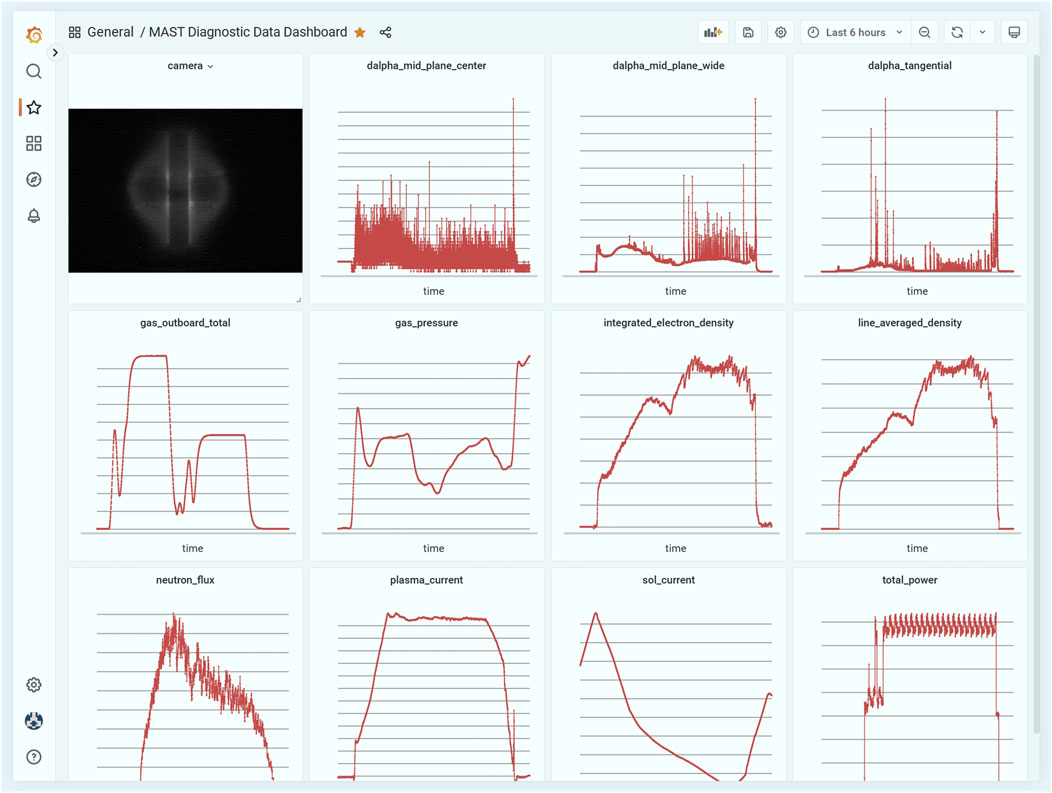
Figure 5. Grafana-based diagnostic data visualisation dashboard for MAST-U. The dashboard displays data from various diagnostics, including camera images of the centre column,
A prototype 3D interactive application visualising the tokamak is under development to enhance the understanding of diagnostic data. This prototype merges panels from its Grafana dashboard with a simplified CAD model, as shown in Figure 6. It is important to note that Figure 6 is a mock-up and may not accurately reflect the final version of the application. Each panel is spatially mapped to the nearest location of its diagnostic sensors around the tokamak. Using this application, researchers can explore and analyse diagnostic signals in the context of their origin through an interactive 3D visualisation that incorporates real-time data representation. Using a mouse, users can interact with the 3D model, select their preferred areas, and view associated diagnostic data, such as the mid-plane or divertor. This integration helps identify spatial relationships between signals and underlying plasma behaviour and interpret complex data.
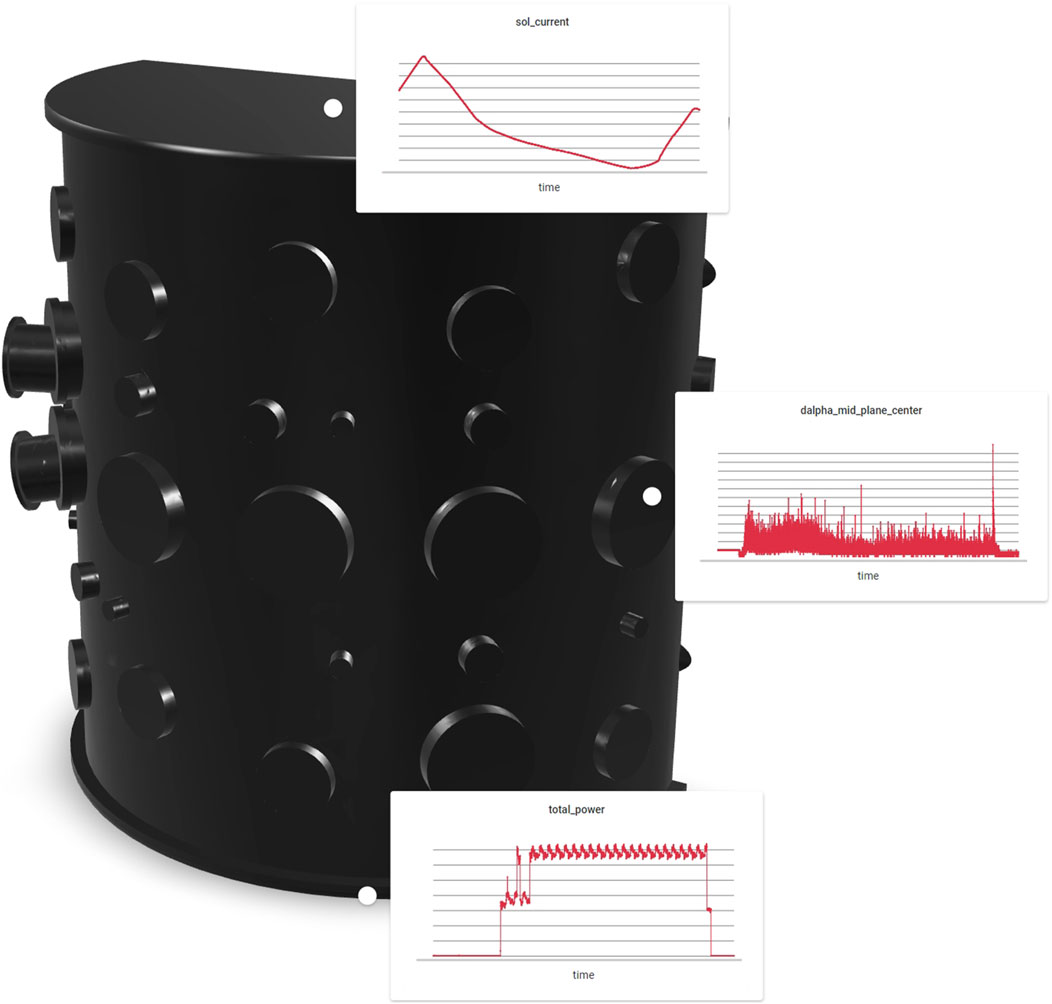
Figure 6. Prototype application showing an interactive 3D visualisation of a tokamak with embedded Grafana panels. Diagnostic data panels are mapped to the nearby locations of their corresponding sensors within the tokamak.
4.4 Immersive visualisations
We developed a WebXR-based AR/VR application integrating JOREK MHD simulation data with MAST-Upgrade (MAST-U) CAD models, creating an interactive and immersive mobile-powered visualisation platform. The process involved integrating high-fidelity simulation data from JOREK MHD simulations with detailed CAD models of the MAST-Upgrade tokamak. The simulation outputs were converted into visualisable 3D formats such as USDZ and GLTF, ensuring compatibility with AR platforms. Further, a rendering app using WebXR and Model Viewer was built to provide smooth visualisation of complex plasma filaments alongside the tokamak structure. Similar to the AR applications in the paper, this required optimising the model, such as the file size and triangle count, for real-time interactivity while maintaining scientific accuracy. User interaction capabilities, such as walking around the model and zooming in on specific features, were implemented using WebXR’s spatial tracking capabilities. The AR experience stitches together the physical geometry with dynamic plasma simulations in a full AR experience. This workflow assures scientific fidelity while providing a practical and interactive tool for the investigation of tokamak structures and plasma behaviour.
The screenshot of the WebXR application shown in Figure 7 visualises the static geometry of the tokamak with dynamic plasma filaments simulated by JOREK. In the AR mode, the 3D model can be displayed at a scale of 1:1, or it can be placed in front of or around the user, scaled-down, enabling intuitive virtual walk-through of spatial relationships and scale. The application offers an interactive user experience, where users can move around the tokamak model and observe it from different angles in real space. Plasma filaments, represented as dynamic, flowing structures within the tokamak, demonstrate key physical processes, such as edge-localised modes. This visualisation helps in understanding the plasma behaviour and its interaction with the components of the device. This AR application was also presented during the visualisation workshop, and it was met with a favourable response from the participants.
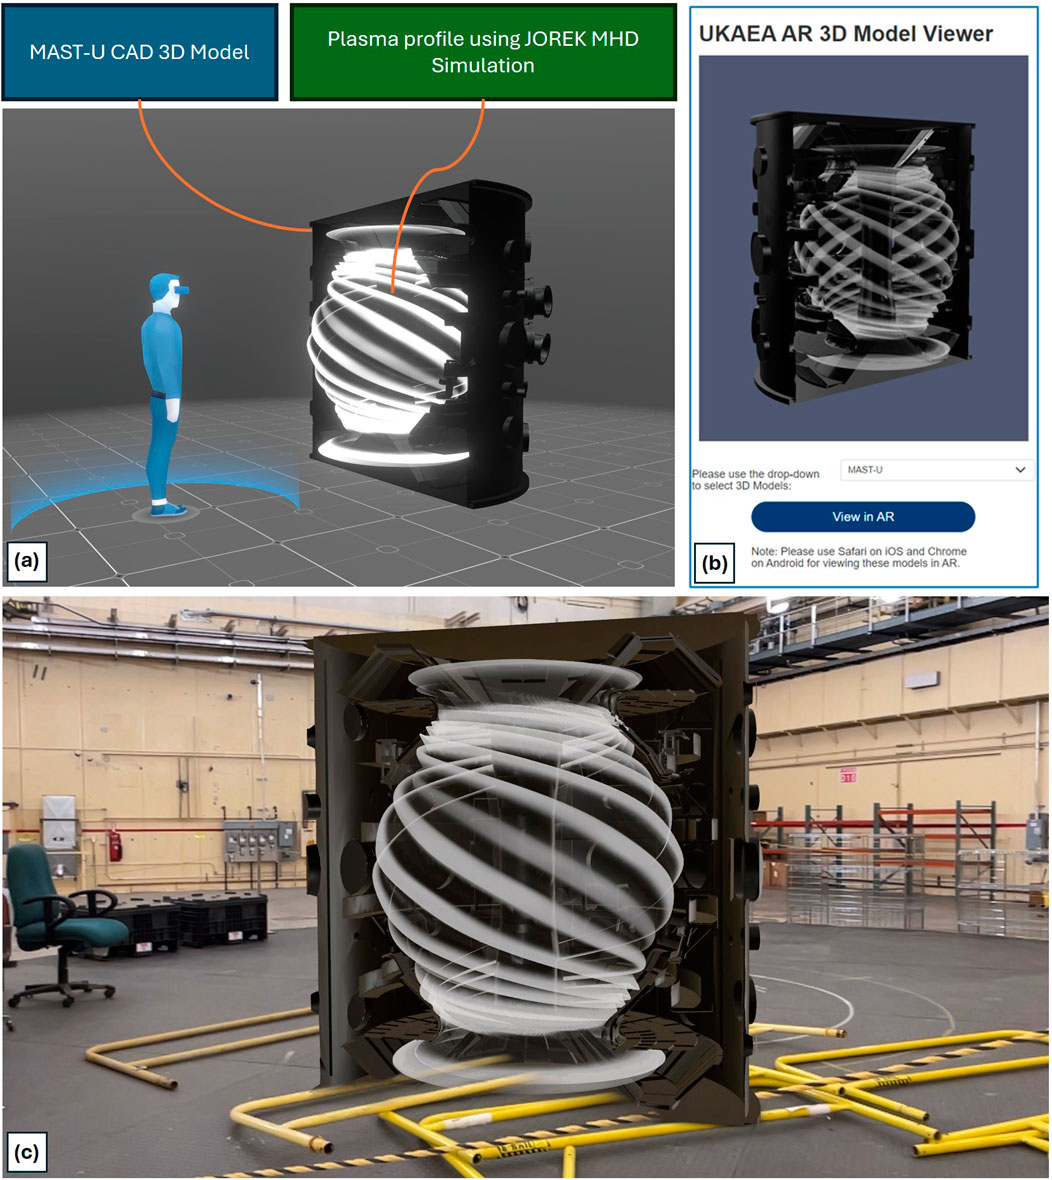
Figure 7. Visualising a Digital Twin of MAST-U Tokamak in AR/VR. (a) 3D Model created by combining MAST-U CAD and JOREK MHD Simulation Data. The MAST-U CAD model is overlaid with a plasma profile using JOREK MHD simulation in a virtual environment where a user interacts with the 3D model using AR/VR. (b) UKAEA AR 3D Model Viewer, a WebXR application hosted at https://niteshbhatia008.github.io/ukaea, allows users to view the 3D MAST-U Tokamak model in augmented reality on browsers. (c) AR visualisation of the 3D MAST-U Tokamak at Fusion Research and Technology Hub (FuRTH) test cell at the Princeton Plasma Physics Laboratory (PPPL) where the model is demonstrated in a real-world setting during the VoLDA workshop.
5 Discussions and conclusion
In this paper, we describe how advanced visualisation frameworks and workflows can contribute to fusion research by enabling more integrated and intuitive analysis of complex, multidimensional data. By combining photorealistic rendering, in situ visualisation, and immersive AR/VR interfaces, these techniques can potentially unify disparate datasets, e.g., engineering CAD models, simulation outcomes, and diagnostic measurements, into a more integrated and comprehensible form. In turn, this can improve data representation accuracy and clarity while promoting collaboration among interdisciplinary teams. As these visualisation workflows continue to mature, their role in fusion research may extend from augmenting data analysis to enabling real-time analysis, interactive exploration, and tighter coupling with AI-driven tools. Interactive manipulation of fusion data in immersive environments also opens up new possibilities for training, iterative design, and communication with stakeholders. Further studies and iterative refinements, however, will be necessary to establish their actual effectiveness in practice. Future and current work will tackle how such techniques can be even more optimised to better cater to the requirements of fusion experts and non-experts in, e.g., adaptive visual analytics, real-time simulation integration, and digital engineering workflows. Usability and effect can be enlightened through collaborative user studies and inform framework development as it is applied to real-world issues and technical innovations. As visualisation methods continue to develop, their influence in determining the way fusion research is planned, analysed, and communicated will likely become increasingly pronounced.
As discussed in this paper, fusion experiments generate vast amounts of data, often reaching terabytes or even petabytes per operational run, posing significant challenges to the computational infrastructure. The integrative framework discussed in Section 4.1 leverages tools tailored for modern HPC and cloud computing environments. As a result, the use cases presented in Sections 4.2–4.4 employ hybrid visualisation techniques to manage this vast data effectively. While more universal computational and data management challenges fall outside the visualisation method’s scope, the tools and techniques ensure that even the most computationally demanding simulation data with high dimensionality and high temporal evolution can be visualised interactively. We are further developing the framework and workflows in leading UK-based HPC facilities, such as CSD3, Isambard-AI, and Dawn. In future work, we intend to explore strategies for optimising computational performance to support large-scale fusion data visualisation. In addition, we plan to expand our use cases by leveraging platforms such as Omniverse to incorporate data from UKAEA’s fusion facilities, such as MAST-U, Chimera, LIBRTI, and more as discussed in Davis et al. [135]. This approach will not only enhance our visualisation capabilities but also promote broader adoption within the fusion research community.
Looking into the future, the presence of emerging technologies such as AI, ML, and high-performance data analysis has tremendous potential for advancing fusion data visualisation. Algorithms based on AI and ML can be effectively designed and deployed to offer automation support for data reduction and anomaly detection. The algorithms can be designed to personalise visual outputs, uncovering significant patterns and inconsistencies that otherwise would go unnoticed. Human-centered Gen-AI and copilots agents integrated into the dashboard would adjust visualisation parameters in an adaptive manner according to the manner in which experimental conditions are changing, thereby making the data interpretative and user-friendly. Further, building fusion digital twins that fuse live diagnostic data with simulation outputs would also facilitate predictive analytics and optimisation of experiment configuration sequentially. In the long term, these advancements simplify decision-making, lower operating costs, and step up the progress towards practical fusion energy. The dual emphasis on addressing the near-term challenges of managing large heterogeneous datasets and potential integration with next-generation technology such as Omniverse underscores the central role of advanced visualisation in the evolution of fusion research.
In addition to the advancements presented in this study, several key avenues for future research have been identified to further enhance fusion data visualisation.
In summary, the role of advanced visualisation is underlined in facing the ever-increasing complexity of fusion research, from engineering CAD models to multi-physics simulations and AI-driven diagnostics. A wide variety of datasets requires the development of visualisation systems that enable seamless exploration and analysis. The workflows described in this paper demonstrate advanced workflows in photorealistic rendering, AI-powered adaptive dashboards, and immersive AR/VR experiences for interpreting and making sense of the complex data created through fusion. The heterogeneous data are integrated into one place, and intuitive, interactive analysis tools support iterative refinement and retrospective analysis, enhancing decision-making and insight in fusion experiments. Moving forward, this is where more development in these visualisation technologies will continue to make fusion data more usable and available for researchers to extend the boundaries of development in fusion energy. These future developments align toward more effective study of fusion and democratising access to complex scientific data, making it increasingly possible for a wide range of researchers to contribute to the advancement of fusion energy. The push for extreme data visualisation and interactivity continues to change how fusion research is done and communicated.
Data availability statement
Publicly available datasets were analyzed in this study. This data can be found here: Jorek Dataset is currently accessible via Cambridge Service for Data Driven Discovery (CSD3) and https://www.jorek.eu/. FAIRMAST: https://github.com/ukaea/fair-mastMAST Data: https://opendata.ukaea.uk/mast-data/.
Author contributions
NB: Writing – original draft, Writing – review and editing. RC: Writing – review and editing. SJ: Writing–review and editing. NC: Writing – review and editing. SP: Writing – review and editing. SW: Writing – review and editing. AG: Writing – review and editing. RA: Writing – review and editing.
Funding
The author(s) declare that no financial support was received for the research and/or publication of this article.
Conflict of interest
The authors declare that the research was conducted in the absence of any commercial or financial relationships that could be construed as a potential conflict of interest.
Generative AI statement
The authors declare that no Generative AI was used in the creation of this manuscript.
Publisher’s note
All claims expressed in this article are solely those of the authors and do not necessarily represent those of their affiliated organizations, or those of the publisher, the editors and the reviewers. Any product that may be evaluated in this article, or claim that may be made by its manufacturer, is not guaranteed or endorsed by the publisher.
Supplementary material
The Supplementary Material for this article can be found online at: https://www.frontiersin.org/articles/10.3389/fphy.2025.1569248/full#supplementary-material
References
2. Harms AA, Kingdon DR, Miley GH, Schoepf KF. Principles of fusion energy: an introduction to fusion energy for students of science and engineering. World Scientific Publishing Company (2000).
5. Taylor CN. Hydrogen and its detection in fusion and fission nuclear materials–a review. J Nucl Mater (2022) 558:153396. doi:10.1016/j.jnucmat.2021.153396
6. Cabal H, Lechón Y, Bustreo C, Gracceva F, Biberacher M, Ward D, et al. Fusion power in a future low carbon global electricity system. Energy Strategy Rev (2017) 15:1–8. doi:10.1016/j.esr.2016.11.002
7. Best RW. Clean fusion concepts and efforts—a survey. Nucl Instr Methods (1977) 144:1–7. doi:10.1016/0029-554x(77)90041-6
8. Sánchez J. Nuclear fusion as a massive, clean, and inexhaustible energy source for the second half of the century: brief history, status, and perspective. Energy Sci and Eng (2014) 2:165–76. doi:10.1002/ese3.43
9. Tynan G, Abdulla A. How might controlled fusion fit into the emerging low-carbon energy system of the mid-twenty-first century? Philosophical Trans R Soc A (2020) 378:20200009. doi:10.1098/rsta.2020.0009
10. Suppes GJ, Storvick TS. Sustainable power technologies and infrastructure: energy sustainability and prosperity in a time of climate change. Academic Press (2015).
11. Ghoniem AF. Needs, resources and climate change: clean and efficient conversion technologies. Prog Energ combustion Sci (2011) 37:15–51. doi:10.1016/j.pecs.2010.02.006
12. Patterson EA, Purdie S, Taylor RJ, Waldon C. An integrated digital framework for the design, build and operation of fusion power plants. R Soc Open Sci (2019) 6:181847. doi:10.1098/rsos.181847
13. Linke J, Du J, Loewenhoff T, Pintsuk G, Spilker B, Steudel I, et al. Challenges for plasma-facing components in nuclear fusion. Matter Radiat Extremes (2019) 4. doi:10.1063/1.5090100
14. Chapman I, Walkden N. An overview of shared technical challenges for magnetic and inertial fusion power plant development. Philosophical Trans R Soc A (2021) 379:20200019. doi:10.1098/rsta.2020.0019
15. Mills R. Fusion power plant. Tech Rep (1974) PPPL. Princeton Plasma Physics Laboratory (PPPL), Princeton, NJ (United States)). doi:10.2172/4266652
16. Morris A, Akers R, Cox M, Militello F, Surrey E, Waldon C, et al. Towards a fusion power plant: integration of physics and technology. Plasma Phys Controlled Fusion (2022) 64:064002. doi:10.1088/1361-6587/ac6694
17. Duffy D. Fusion power: a challenge for materials science. Philosophical Trans R Soc A: Math Phys Eng Sci (2010) 368:3315–28. doi:10.1098/rsta.2010.0060
18. Chapman I, Morris A. Ukaea capabilities to address the challenges on the path to delivering fusion power. Philosophical Trans R Soc A (2019) 377:20170436. doi:10.1098/rsta.2017.0436
19. Holtkamp N, Team IP An overview of the iter project. Fusion Eng Des (2007) 82:427–34. doi:10.1016/j.fusengdes.2007.03.029
20. Stambaugh RD, Chan VS, Miller RL, Schaffer MJ. The spherical tokamak path to fusion power. Fusion Technology (1998) 33:1–21. doi:10.13182/fst33-1
21. Sartori F, de Tommasi G, Piccolo F. The joint european torus. IEEE Control Syst Mag (2006) 26:64–78. doi:10.1109/MCS.2006.1615273
22. Wan B. Experimental advanced superconducting tokamak. In: Magnetic fusion energy. Elsevier (2016). p. 409–37.
23. Zohm H. On the size of tokamak fusion power plants. Philosophical Trans R Soc A (2019) 377:20170437. doi:10.1098/rsta.2017.0437
24. Fasoli A. Essay: overcoming the obstacles to a magnetic fusion power plant. Phys Rev Lett (2023) 130:220001. doi:10.1103/physrevlett.130.220001
25. Aymar R, Barabaschi P, Shimomura Y. The iter design. Plasma Phys controlled fusion (2002) 44:519–65. doi:10.1088/0741-3335/44/5/304
26. Abla G, Heber G, Schissel DP, Robinson D, Abadie L, Wallander A, et al. Iterdb—the data archiving system for iter. Fusion Eng Des (2014) 89:536–41. doi:10.1016/j.fusengdes.2014.02.025
27. Churchill RM, Choi J, Kube R, Chang C-S, Klasky S. Machine learning for the complex, multi-scale datasets in fusion energy. In: Driving scientific and engineering discoveries through the convergence of HPC, big data and AI: 17th smoky mountains computational sciences and engineering conference, SMC 2020, oak ridge, TN, USA, august 26-28, 2020, revised selected papers 17. Springer (2020). p. 269–84.
28. Strand P, Coelho R, Coster D, Eriksson L-G, Imbeaux F, Guillerminet B, et al. Simulation and high performance computing—building a predictive capability for fusion. Fusion Eng Des (2010) 85:383–7. doi:10.1016/j.fusengdes.2010.05.019
29. Verdoolaege G, Karagounis G, Murari A, Vega J, Van Oost G, Contributors J-E. Modeling fusion data in probabilistic metric spaces: applications to the identification of confinement regimes and plasma disruptions. Fusion Sci Technology (2012) 62:356–65. doi:10.13182/fst12-a14627
30. Roads BD, Love BC. The dimensions of dimensionality. Trends Cogn Sci (2024) 28:1118–31. doi:10.1016/j.tics.2024.07.005
32. Naini MM, Naini JF. N-dimensions, parallel realities, and their relations to human perception and development. J Integrated Des Process Sci (2009) 13:49–61. doi:10.3233/jid-2009-13104
33. Dzemyda G, Kurasova O, Zilinskas J. Multidimensional data visualization. Methods Appl Ser Springer optimization its Appl (2013) 75:10–5555. doi:10.1007/978-1-4419-0236-8
34. Telea AC. Data visualization: principles and practice. New York: CRC Press (2014). doi:10.1201/b17217
35. Liu S, Maljovec D, Wang B, Bremer P-T, Pascucci V. Visualizing high-dimensional data: advances in the past decade. IEEE Trans visualization Comput graphics (2016) 23:1249–68. doi:10.1109/tvcg.2016.2640960
36. Smolentsev S, Spagnuolo GA, Serikov A, Rasmussen JJ, Nielsen AH, Naulin V, et al. On the role of integrated computer modelling in fusion technology. Fusion Eng Des (2020) 157:111671. doi:10.1016/j.fusengdes.2020.111671
37. Favalora GE. Volumetric 3d displays and application infrastructure. Computer (2005) 38:37–44. doi:10.1109/mc.2005.276
38. Blanche P-A. Holography, and the future of 3d display. Light: Adv Manufacturing (2021) 2:1–459. doi:10.37188/lam.2021.028
39. Balogh T, Kovács PT, Barsi A. Holovizio 3d display system. In: 2007 3DTV conference. IEEE (2007). p. 1–4.
40. Wood J, Kirschenbauer S, Döllner J, Lopes A, Bodum L. Using 3d in visualization. In: Exploring geovisualization. Elsevier (2005). p. 293–312.
41. Yang L, Dong H, Alelaiwi A, Saddik AE. See in 3d: state of the art of 3d display technologies. Multimedia Tools Appl (2016) 75:17121–55. doi:10.1007/s11042-015-2981-y
42. Ohtani H, Ohno N, Mizuguchi N, Shoji M, Ishiguro S. Simulation data analysis by virtual reality system. Plasma Fusion Res (2010) 5:S2109. doi:10.1585/pfr.5.s2109
43. Manduchi G. Overlaps between industrial informatics and control, data acquisition and management in big science. Front Ind Eng (2024) 2:1342734. doi:10.3389/fieng.2024.1342734
44. Song Y, Zou X, Gong X, Becoulet A, Buttery R, Bonoli P, et al. Realization of thousand-second improved confinement plasma with super i-mode in tokamak east. Sci Adv (2023) 9:eabq5273. doi:10.1126/sciadv.abq5273
45. Kube R, Churchill RM, Chang C, Choi J, Wang R, Klasky S, et al. Near real-time streaming analysis of big fusion data. Plasma Phys Controlled Fusion (2022) 64:035015. doi:10.1088/1361-6587/ac3f42
46. Kos L, Lupelli I, Bonnin X, Team EE-I. Solps-iter dashboard. In: 25th international conference nuclear energy for new europe (2016).
47. Hutton MS, Azevedo S, Beeler R, Bettenhausen R, Bond E, Casey A, et al. Experiment archive, analysis, and visualization at the national ignition facility. Fusion Eng Des (2012) 87:2087–91. doi:10.1016/j.fusengdes.2012.07.009
48. Zhao J, Wang Y, Cao Y, Guo M, Huang X, Zhang R, et al. The fusion strategy of 2d and 3d information based on deep learning: a review. Remote Sensing (2021) 13:4029. doi:10.3390/rs13204029
49. Trindade NV, Amaro O, Brás D, Gonçalves D, Pereira JM, Ferreira A. Visualizing plasma physics simulations in immersive environments (2023). arXiv preprint arXiv:2311.14593
50. IPFN. Golp virtual reality lab - let’s dive into the plasma realm (2019). Available online at: https://www.ipfn.tecnico.ulisboa.pt/news-and-events/news/563138931982557 (Accessed February 28, 2025).
51. EPFL. 3d visualization brings nuclear fusion to life (2024). Available online at: https://actu.epfl.ch/news/3d-visualization-brings-nuclear-fusion-to-life/ (Accessed February 28, 2025).
52. Ohtani H, Shoji M, Ohno N, Suzuki Y, Ishiguro S, Kageyama A, et al. Visualization of dust particle data with plasma simulation results using virtual-reality system. Contrib Plasma Phys (2016) 56:692–7. doi:10.1002/ctpp.201610054
53. Ohno N, Takano F, Yamanaka A, Ohtani H, Kageyama A. Digital-lhd: lhd visualizer for head-mounted display systems. Plasma Fusion Res (2024) 19:1401029. doi:10.1585/pfr.1401029
54. Kwon J-M, Choi H, Ki J, Park SY, Park SH, Kim YJ, et al. Development of a virtual tokamak platform. Fusion Eng Des (2022) 184:113281. doi:10.1016/j.fusengdes.2022.113281
55. Foss G, Solis A, Bhadsavle S, Horton W, Leonard L. Plasma simulation data through the hololens. In: Proceedings of the practice and experience on advanced research computing: seamless creativity (2018). p. 1–2.
56. Ohno N, Kageyama A. Voir: virtual reality visualization software for large-scale simulations. Plasma Fusion Res (2024) 19:1401024. doi:10.1585/pfr.19.1401024
57. Gazzotti S, Ferlay F, Meunier L, Viudes P, Huc K, Derkazarian A, et al. Virtual and augmented reality use cases for fusion design engineering. Fusion Eng Des (2021) 172:112780. doi:10.1016/j.fusengdes.2021.112780
58. Ohno N, Ohtani H. Development of in-situ visualization tool for pic simulation. Plasma Fusion Res (2015) 9:3401071. doi:10.1585/pfr.9.3401071
59. Ohno N, Kageyama A. In-situ visualization library for Yin-Yang grid simulations. Tech Rep (2021) 73:158. doi:10.1186/s40623-021-01485-2
60. Klasky S, Abbasi H, Logan J, Parashar M, Schwan K, Shoshani A, et al. In situ data processing for extreme-scale computing. Proc SciDAC (2011) 1–16.
61. Suchyta E, Klasky S, Podhorszki N, Wolf M, Adesoji A, Chang C-S, et al. The exascale framework for high fidelity coupled simulations (effis): enabling whole device modeling in fusion science. The Int J High Perform Comput Appl (2022) 36:106–28. doi:10.1177/10943420211019119
62. Zhao D, Liu N, Kimpe D, Ross R, Sun X-H, Raicu I. Towards exploring data-intensive scientific applications at extreme scales through systems and simulations. IEEE Trans Parallel Distributed Syst (2015) 27:1824–37. doi:10.1109/tpds.2015.2456896
63. Amarasinghe S, Campbell D, Carlson W, Chien A, Dally W, Elnohazy E, et al. Exascale software study: software challenges in extreme scale systems. DARPA IPTO (2009).
64. Fiore S, Bakhouya M, Smari WW. On the road to exascale: advances in high performance computing and simulations—an overview and editorial. Future Generation Computer Systems (2018) 82, 450–8. doi:10.1016/j.future.2018.01.034
65. Godoy WF, Podhorszki N, Wang R, Atkins C, Eisenhauer G, Gu J, et al. Adios 2: the adaptable input output system. a framework for high-performance data management. SoftwareX (2020) 12:100561. doi:10.1016/j.softx.2020.100561
66. Bolstad M, Moreland K, Pugmire D, Rogers D, Lo L-T, Geveci B, et al. Vtk-m: visualization for the exascale era and beyond. In: ACM SIGGRAPH 2023 talks (2023). p. 1–2.
67. Mazen F, Gombert L, Givord L, Gueunet C. In situ in transit hybrid analysis with catalyst-adios2. In: International conference on high performance computing. Springer (2025). p. 482–9.
68. Tang W, Feibush E, Dong G, Borthwick N, Lee A, Gomez J-F, et al. Ai-machine learning-enabled tokamak digital twin (2024). arXiv preprint arXiv:2409.03112
69. NVIDIA. Scientists building digital twins in nvidia omniverse to accelerate clean energy research (2022). Available online at: https://nvidianews.nvidia.com/news/nvidia-omniverse-scientific-computing (Accessed February 28, 2025).
70. Margetts L, Akers R, Ghosh A, Gopakumar V, Hadorn P, Hummel M, et al. Towards real-time fusion reactor design using the omniverse. In: Nvidia GPU technology conference (2022).
72. Iglesias D, Bunting P, Esquembri S, Hollocombe J, Silburn S, Vitton-Mea L, et al. Digital twin applications for the jet divertor. Fusion Eng Des (2017) 125:71–6. doi:10.1016/j.fusengdes.2017.10.012
73. Sanders S, Carman P. Colour, design and virtual reality at jet. Opt and Laser Technology (2006) 38:335–42. doi:10.1016/j.optlastec.2005.06.024
74. Kos L, Pitts R, Simič G, Brank M, Anand H, Arter W. Smiter: a field-line tracing environment for iter. Fusion Eng Des (2019) 146:1796–800. doi:10.1016/j.fusengdes.2019.03.037
75. Penko D, Kos L, Huijsmans G, Pinches SD The initial step towards jorek integration in imas (2020). arXiv preprint arXiv:2006.09198
76. Permann CJ, Gaston DR, Andrš D, Carlsen RW, Kong F, Lindsay AD, et al. Moose: enabling massively parallel multiphysics simulation. SoftwareX (2020) 11:100430. doi:10.1016/j.softx.2020.100430
77. Kitware. The evolution of peacock: a powerful interface for moose simulations (2023). Available online at: https://www.kitware.com/the-evolution-of-peacock-a-powerful-interface-for-moose-simulations (Accessed February 28, 2025).
78. Atkins III C, Geveci B. Integrated, interoperable software environment for fusion simulation and data analysis tools SBIR phase II. Tech Rep (2021).
79. Someya Y, Tobita K, Hiwatari R, Sakamoto Y, for Fusion JSDT, et al. Fusion demo reactor design based on nuclear analysis. Fusion Eng Des (2018) 136:1306–12. doi:10.1016/j.fusengdes.2018.04.129
80. Cryer A, Sargent A, Abe F, Baniqued PD, Caliskanelli I, Goodliffe M, et al. Digital mock-ups for nuclear decommissioning: a survey on existing simulation tools for industry applications. Robotics Automation Eng J (2023) 5:1–16. doi:10.19080/raej.2023.05.555669
81. Li J-Y, Gu L, Xu H-S, Zhang Y-P, Yao C-F, Fan D-J, et al. The development and testing of a digital iter-type mock-up based on virtual reality technology. Fusion Sci Technology (2021) 77:350–8. doi:10.1080/15361055.2021.1904598
82. Loving A, Allan P, Sykes N, Collins S, Murcutt P. Development and application of high volume remote handling systems in support of jet and iter. Fusion Eng Des (2012) 87:880–4. doi:10.1016/j.fusengdes.2012.02.039
83. Haist B, Mills S, Loving A. Remote handling preparations for jet ep2 shutdown. Fusion Eng Des (2009) 84:875–9. doi:10.1016/j.fusengdes.2009.01.050
84. Laboratory ORN. Virtual reality gives new vision to nuclear reactor security (2024). Available online at: https://www.ornl.gov/news/virtual-reality-gives-new-vision-nuclear-reactor-security (Accessed February 28, 2025).
85. Society AP. Plasma in augmented reality (2024). Available online at: https://www.aps.org/learning-resources/merge-cube (Accessed February 28, 2025).
86. Eurofusion. Eurofusion youtube channel (2025). Available online at: https://www.youtube.com/Euro-fusionOrg (Accessed February 28, 2025).
87. UKAEA. Ukaea youtube channel (2025). Available online at: https://www.youtube.com/@UKAEAofficial (Accessed February 28, 2025).
88. PPPL. Pppl youtube channel (2025). Available online at: https://www.youtube.com/@PPPLab (Accessed February 28, 2025).
89. Science MP, Center F. Mit plasma science and fusion center youtube channel (2025). Available online at: https://www.youtube.com/@mitplasmasciencefusioncenter (Accessed February 28, 2025).
90. UKAEA. Fusion computing lab. Engaging Supercomputers Test ”Untestable (2024). Available online at: https://ccfe.ukaea.uk/case-studies/fusion-computing-lab (Accessed February 28, 2025).
91. UKAEA. Fusion futures (2024). Available online at: https://ccfe.ukaea.uk/programmes/fusion-futures (Accessed February 28, 2025).
92. UKAEA. Foster - fusion opportunities in skills, training, education and research (2025). Available online at: https://ccfe.ukaea.uk/programmes/fusion-futures/foster (Accessed February 28, 2025).
93. UKAEA. The fusion industry programme (fip) is stimulating growth of the UK fusion ecosystem and preparing it for future global fusion power plant market (2024). Available online at: https://ccfe.ukaea.uk/programmes/fusion-industry-programme (Accessed February 28, 2025).
96. Song YT, Wu ST, Li JG, Wan BN, Wan YX, Fu P, et al. Concept design of cfetr tokamak machine. IEEE Trans Plasma Sci (2014) 42:503–9. doi:10.1109/tps.2014.2299277
97. Dimits AM, Bateman G, Beer M, Cohen B, Dorland W, Hammett G, et al. Comparisons and physics basis of tokamak transport models and turbulence simulations. Phys Plasmas (2000) 7:969–83. doi:10.1063/1.873896
98. Van Dijk J, Kroesen G, Bogaerts A. Plasma modelling and numerical simulation. J Phys D: Appl Phys (2009) 42:190301. doi:10.1088/0022-3727/42/19/190301
100. Klasky S, Beck M, Bhat V, Feibush E, Ludäscher B, Parashar M, et al. Data management on the fusion computational pipeline. J Phys Conf Ser (2005) 16:510–20. doi:10.1088/1742-6596/16/1/070
101. Kress J, Pugmire D, Klasky S, Childs H. Visualization and analysis requirements for in situ processing for a large-scale fusion simulation code. In: 2016 second workshop on in situ infrastructures for enabling extreme-scale analysis and visualization (ISAV). IEEE (2016). p. 45–50.
102. Young KM, Costley A, Iter-Jct IHTthe ITER Diagnostics Expert Group. An overview of iter diagnostics. Rev scientific Instr (1997) 68:862–7.
103. Burrell K. Diagnostics for advanced tokamak research. Rev Scientific Instr (2001) 72:906–14. doi:10.1063/1.1321006
104. Mukhin E, Semenov V, Razdobarin A, Tolstyakov SY, Kochergin M, Kurskiev G, et al. The iter divertor thomson scattering system: engineering and advanced hardware solutions. J Instrumentation (2012) 7:C02063. doi:10.1088/1748-0221/7/02/c02063
105. Nvidia Omniverse platform for openusd (2023). Available online at: https://www.nvidia.com/en-gb/omniverse/ (Accessed February 28, 2025).
106. Ahmed N, Afyouni I, Dabool H, Al Aghbari Z. A systemic survey of the omniverse platform and its applications in data generation, simulation and metaverse. Front Computer Sci (2024) 6:1423129. doi:10.3389/fcomp.2024.1423129
107. PixarAnimation Studios Usd: universal scene description (2023). Available online at: https://openusd.org/release/index.html (Accessed February 28, 2025).
108. Kitware Paraview (2023). Available online at: https://www.paraview.org (Accessed February 28, 2025).
109. Nvidia Paraview - omniverse connector (2023). Available online at: https://docs.omniverse.nvidia.com/connect/latest/paraview.html.
110. Moreland K, Avila L, Fisk LA. Parallel unstructured volume rendering in paraview. Visualization Data Anal 2007 (Spie) (2007) 6495:144–55.
112. BlenderFoundation Blender (2023). Available online at: https://www.blender.org (Accessed February 28, 2025).
113. Kent BR. Visualizing astronomical data with blender. Publications Astronomical Soc Pac (2013) 125:731–48. doi:10.1086/671412
115. Astuti IA, Purwanto IH, Hidayat T, Satria DA, Purnama R, et al. Comparison of time, size and quality of 3d object rendering using render engine eevee and cycles in blender. In: 2022 5th international conference of computer and informatics engineering (IC2IE). IEEE (2022). p. 54–9.
116. GrafanaLabs. Grafana dashboards. In: Grafana documentation (2023). Available online at: https://grafana.com/ (Accessed February 28, 2025).
117. Geng Y, Jiang L, Gao G, Li W. Design of the iter ccr experiment platform. In: 2024 4th international conference on electronics, circuits and information engineering (ECIE). IEEE (2024). p. 543–8.
118. UnityTechnologies. Unity. In: Unity documentation (2023). Available online at: https://unity.com/ (Accessed February 28, 2025).
119. EpicGames. Unreal engine. In: Unreal engine documentation (2023). Available online at: https://www.unrealengine.com/ (Accessed February 28, 2025).
120. MozillaFoundation Webxr documentation (2023). Available online at: https://immersive-web.github.io/webxr (Accessed February 28, 2025).
121. Belotti M, Juárez R. Ivr-uned: interactive virtual environments to understand radiation fields. Nucl Eng Technology (2024):103199.
122. Keep J, Wood S, Gupta N, Coleman M, Loving A. Remote handling of demo breeder blanket segments: blanket transporter conceptual studies. Fusion Eng Des (2017) 124:420–5. doi:10.1016/j.fusengdes.2017.02.016
123. Kwon J-M, Lee C, Rhee T, Woo M, Park J, Lee C, et al. Progress in digital twin development of virtual tokamak platform. IEEE Trans Plasma Sci (2024) 52:3910–6. doi:10.1109/tps.2024.3390159
124. Atkinson M, Gesing S, Montagnat J, Taylor I. Scientific workflows: past, present and future. Future Generation Computer Syst (2017) 75:216–27. doi:10.1016/j.future.2017.05.041
125. Eppler MJ, Burkhard RA. Knowledge visualization. In: Knowledge management: concepts, methodologies, tools, and applications (IGI Global) (2008). p. 781–93.
126. Ayachit U, Geveci B, Moreland K, Patchett J, Ahrens J. The paraview visualization application (2012). 421, 38. doi:10.1201/b12985-31
127. Abramov D. Interactive analysis tools for visualizing the universe. Santa Cruz: University of California (2023).
128. Leppänen J. Methodology, applications and performance of the cad-based geometry type in the serpent 2 Monte Carlo code. Ann Nucl Energy (2022) 176:109259. doi:10.1016/j.anucene.2022.109259
129. Klasky S, Wolf M, Mehta K, Huck K, Geveci B, Phillip S, et al. In situ analysis and visualization of fusion simulations: lessons learned. In: High performance computing: ISC high performance 2018 international workshops, frankfurt/main, Germany, june 28, 2018, revised selected papers, 11203. Springer (2019). p. 230–42. doi:10.1007/978-3-030-02465-9_16
130. Ma K-L. In situ visualization at extreme scale: challenges and opportunities. IEEE Computer Graphics Appl (2009) 29:14–9. doi:10.1109/MCG.2009.120
131. Harward M, Irwin W, Churcher N. In situ software visualisation. In: 2010 21st Australian software engineering conference (IEEE) (2010). p. 171–80.
132. Bauer AC, Abbasi H, Ahrens J, Childs H, Geveci B, Klasky S, et al. In situ methods, infrastructures, and applications on high performance computing platforms. Computer Graphics Forum (2016) 35:577–97. doi:10.1111/cgf.12930
134. Hummel M, van Kooten K. Leveraging nvidia omniverse for in situ visualization. In: High performance computing: ISC high performance 2019 international workshops, frankfurt, Germany, june 16-20, 2019, revised selected papers 34. Springer (2019). p. 634–42.
135. Davis A, Waldon C, Muldrew SI, Patel BS, Verrier P, Barrett TR, et al. Digital: accelerating the pathway. Philosophical Trans A (2024) 382:20230411. doi:10.1098/rsta.2023.0411
136. Chen Z, Xi W, Xie J, He K. Design and implementation of real-time security monitoring platform for east based on microservice architecture. Sixth Int Conf Adv Electron Mater Comput Softw Eng (AEMCSE 2023) (Spie) (2023) 12787:576–85.
137. Li I, Liu Y, Zang X. Human-machine interaction control system of a remote maintenance manipulator for tokamak. In: 2018 Chinese automation congress (CAC). IEEE (2018). p. 336–40. doi:10.1109/CAC.2018.8623475
138. Lennholm H, Anderson EF. Playing with the sun: a virtual physics experience for nuclear fusion experimentation and learning. In: 2021 IEEE conference on games (CoG). IEEE (2021). p. 01–4.
139. Hoelzl M, Huijsmans GT, Pamela S, Becoulet M, Nardon E, Artola FJ, et al. The jorek non-linear extended mhd code and applications to large-scale instabilities and their control in magnetically confined fusion plasmas. Nucl Fusion (2021) 61:065001. doi:10.1088/1741-4326/abf99f
140. Smith S, Pamela S, Fil A, Hölzl M, Huijsmans G, Kirk A, et al. Simulations of edge localised mode instabilities in mast-u super-x tokamak plasmas. Nucl Fusion (2020) 60:066021. doi:10.1088/1741-4326/ab826a
141. NVIDIA. Material design and applications in omniverse usd composer (2023). Available online at: https://developer.nvidia.com/omniverse-materials (Accessed February 28, 2025).
142. BlenderFoundation Fink EJ, Beskid P, Cardenas JA, Gordon R, Lohrey JB. Cameras (2024). 123, 45. doi:10.4324/9781003401117-6
143. FFmpeg. Ffmpeg: a complete, cross-platform solution to record, convert and stream audio and video (2023). Available online at: https://ffmpeg.org/ (Accessed February 28, 2025).
144. Jackson S, Khan S, Cummings N, Hodson J, de Witt S, Pamela S, et al. Fair-mast: a fusion device data management system. SoftwareX (2024) 27:101869. doi:10.1016/j.softx.2024.101869
145. Baker A. The spherical tokamak for energy production (step) in context: UK public sector approach to fusion energy. Philosophical Trans A (2024) 382:20230401. doi:10.1098/rsta.2023.0401
Keywords: fusion power plants, data integration, visualisation workflows, photorealistic rendering, digital twin frameworks, immersive AR/VR, high-performance computing (HPC), multimodal data
Citation: Bhatia N, Costa R, Jackson S, Cummings N, Pamela SJP, de Witt S, Gonzalez Beltran AN and Akers R (2025) Advanced techniques for fusion data visualisation. Front. Phys. 13:1569248. doi: 10.3389/fphy.2025.1569248
Received: 31 January 2025; Accepted: 19 March 2025;
Published: 17 April 2025.
Edited by:
Didier Mazon, CEA Cadarache, FranceReviewed by:
Hiroaki Ohtani, National Institute for Fusion Science, JapanRuiyu Liang, University of New South Wales, Australia
Copyright © 2025 Bhatia, Costa, Jackson, Cummings, Pamela, de Witt, Gonzalez Beltran and Akers. This is an open-access article distributed under the terms of the Creative Commons Attribution License (CC BY). The use, distribution or reproduction in other forums is permitted, provided the original author(s) and the copyright owner(s) are credited and that the original publication in this journal is cited, in accordance with accepted academic practice. No use, distribution or reproduction is permitted which does not comply with these terms.
*Correspondence: Nitesh Bhatia, bml0ZXNoLmJoYXRpYUB1a2FlYS51aw==