 Yebo Liu1
 Xiaofeng Li
 Chen Chen
- 1State Key Laboratory of Black Soils Conservation and Utilization, Northeast Institute of Geography and Agroecology, Chinese Academy of Sciences, Changchun, China
- 2Jilin Vocational and Technical College of Transportation, Changchun, China
- 3Jilin Yumai Aviation Co., Ltd., Changchun, China
- 4Henghui Optoelectronic Measurement Technology (Jilin) Co., Ltd., Changchun, China
- 5College of Instrumentation and Electrical Engineering, Jilin University, Changchun, China
To enable to achieve high performance measurement of CH4 and CO2 gases in the field environment, a measuring system using infrared tunable diode laser absorption spectroscopy (TDLAS) technology was proposed in this paper. The measuring system adopted an infrared compact-linear optical structure, including two infrared distributed feedback (DFB) lasers (central wavelength at 2,325 nm and 2004 nm, respectively), long optical path multi-pass cell (effective optical path is 41.5 m) and photoelectric detectors (response wavelength is from 900 nm to 2,600 nm). Combining system state parameter equivalence correction (SSPEC) method to eliminate of measuring system error. The experimental results show that the minimum detection limit (MDL) of CH4 and CO2 are 0.29 ppmv@29s and 6.5 ppmv@17s, the measurement uncertainty is 2.4‰ and 2.5‰ with 98% confidence interval, the maximum measurement errors are 2.3‰ and 2.5‰. Finally, the environmental adaptability test was carried out in the seismic station of Jilin Province, P.R. China. Compared with the international measuring system, the measurement performance of the proposed system is better.
1 Introduction
Gas geochemical exploration (GGE) is an effective method for the analysis and monitoring of earthquake early warning, which is crucial for mitigating earthquake-related disasters. CH4 and CO2 are two key trace gases that play a significant role in GGE1 [1–3]. The concentrations of CH4 and CO2 exhibit notable changes before and after seismic events. Accurate monitoring of these gas concentrations is of paramount importance for enhancing earthquake early warning systems.
Tunable diode laser absorption spectroscopy (TDLAS) has been successfully applied in many areas due to the advantages of high sensitivity and fast response [4–10]. Compared with other spectroscopic technologies with complex structures, TDLAS is more suitable for in-situ gas detection in the wild [11–17]. To ensure measurement accuracy in the wild, the current studies include two methods: error compensation technology and calibration-free technology. In 2021, Li Ma employed the particle swarm optimization algorithm to refine the BP neural network and developed a temperature compensation method for CH4 gas measurement [18]. This approach achieved a relative error of 0.3% when measuring standard CH4 gas and has been successfully applied in mine gas measurement. In 2021, Ningwu Liu proposed a second-harmonic calibration-free method that utilizes the average value of the first-harmonic signal to normalize the concentration information contained in the second-harmonic signal, thereby mitigating the errors caused by laser intensity fluctuation [19]. The uncertainty in CO2 concentration measurements is approximately ±4.6%. While both error compensation and calibration-free technology can enhance the accuracy of measuring system, these methods typically address only single-parameter error, such as gas temperature or initial light intensity. However, in-situ geochemical gas measurements in field environment involve multiple system parameter errors beyond just gas temperature or initial light intensity. Consequently, research on multi-parameter error correction techniques is essential for enhancing the reliability and accuracy of in-situ geochemical gas measurment.
To solve the above-mentioned problems, based on infrared TDLAS technology, this paper using SSPEC method, including light intensity equivalent correction, sample gas temperature equivalent correction, sample gas pressure equivalent correction and molecular number equivalent correction, to eliminate of measuring system error and to achieve high accuracy measurement.
2 Measurement system configuration
2.1 Absorption line selection
In the near infrared band, the strongest CH4 and CO2 absorption lines are located in the 2.3 μm and 2.0 μm absorption bands, respectively [20, 21]. Considering the complex composition of geochemical gases, the selection of non-overlapping absorption lines is a prerequisite to achieve high accuracy measurement. In fault gas monitoring application, the main interfering components are H2O and NH3. Under the conditions of gas temperature is 30°C, gas pressure is 40 Torr and effective optical path is 41.5 m, the absorption lines of 100 ppmv CH4, 100 ppmv CO2, 2% H2O and 100 ppmv NH3 are simulated by HITRAN database [22]. The selected CH4 and CO2 absorption lines are shown in Figure 1.
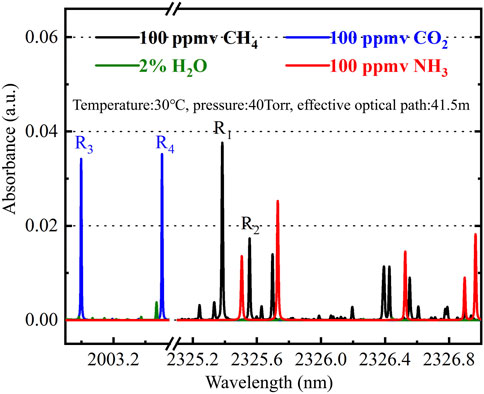
Figure 1. The selection of CH4 and CO2 absorption lines.
Two non-overlapping absorption lines are selected for each gas to measure the gas concentration and calibrate the gas state. UjFAMjMyNS4zOA== nm and UjNAMjAwMy4wMQ== nm are used to measure the concentration of CH4 and CO2, respectively, and UjJAMjMyNS41NQ== nm and UjRAMjAwMy41MA== nm are used to calibrate the status of CH4 and CO2, respectively. When the sample gas pressure exceeds 40 Torr, the CH4 absorption lines overlap, and the measurement pressure of the measuring system is set to 40 Torr. Absorption lines do not overlap with H2O, NH3 and other chemical components.
2.2 Hardware system description
The overall structure block diagram of the CH4 and CO2 measuring system is shown in Figure 2, including the optical system, electrical system, intake system and temperature control system.
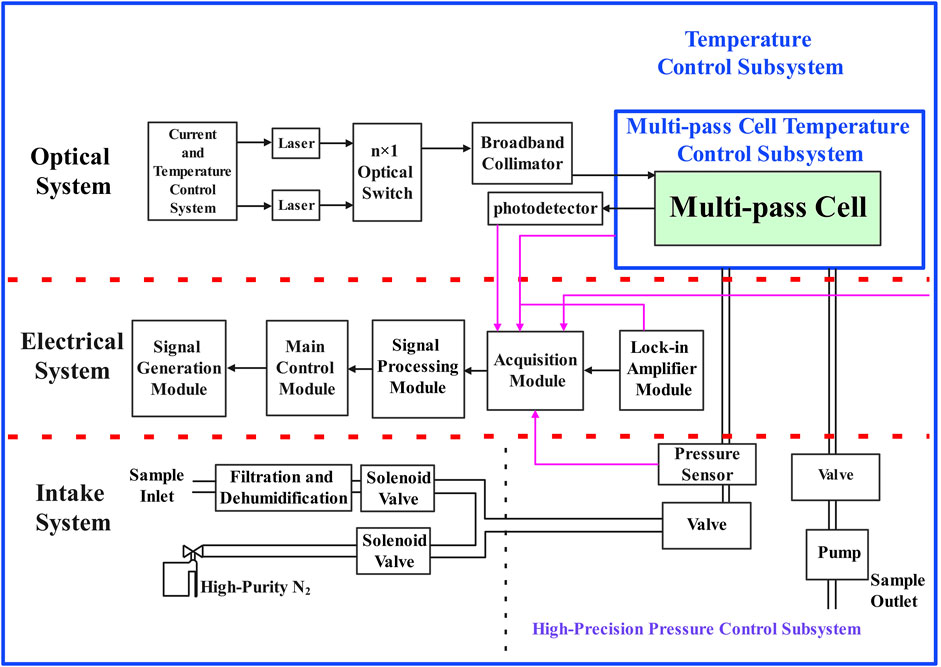
Figure 2. The overall structure block diagram of the CH4 and CO2 measuring system.
The optical system consists of two distributed feedback (DFB) lasers (Norcada 2,325 nm for CH4, Norcada 2004 nm for CO2), a 2 × 1 optical fiber coupler (Thorlabs, TW2000R5A1B), a wide spectrum collimator (Thorlabs, F028APC-2000), a multi-pass cell with effective optical path of 41.5m, and a photodetector (Thorlabs, PDA10D2). Two DFB lasers are used to emit a specific wavelength of measurement light; 2 × 1 fiber coupler is used to implement the detection optical multiplexing; The wide spectrum collimator is used to adjust the beam quality in a wide spectrum range and provide small beam waist and parallel detection light. The function of multi-pass cell is to realize long-distance transmission of measurement light, increase the interaction distance between sample gas and measurement light, and improve the signal-to-noise ratio of spectral signal. Photodetector is used to convert spectral signals containing concentration information into electrical signals that are easy to transmit and process. The advantage of the optical system is that it can achieve high performance measurement of CH4 and CO2 and freely expand the light source within the allowed spectral range to increase the measurement component.
The electrical system includes main control module, communication module, signal generation module, acquisition module, phase-locked amplifier module and signal processing module. They are used to control the operation of the measurement system, transmit control signals and data with the upper and lower systems, provide signals for the measurement system hardware, collect spectral signals and system status signals (including the second harmonic signal, detector output signal, multi-pass cell temperature sensor signal, shell temperature sensor signal, pressure sensor signal), extract the second harmonic signal amplitude and correct the measurement error.
The intake system includes a high precision pressure control subsystem and an adaptive dilution subsystem. The high precision pressure control subsystem is used to fill the sample gas and accurately control the sample gas pressure. The adaptive dilution subsystem is used to dilute the sample gas concentration and expand the measurement range of the measurement system. The intake system adaptively dilutes the sample gas to measure a wide concentration range of CH4 and CO2. The temperature control system includes the shell temperature control subsystem and the multi-pass cell temperature control subsystem. The shell temperature control subsystem is used to reduce the environmental disturbance and provide a stable measurement environment for the measurement system. The multi-pass cell temperature control subsystem is used to lock the state of the multi-pass cell and precisely regulate the sample gas temperature to improve the measurement accuracy of the measurement system.
3 SSPEC method
3.1 Method description
SSPEC method is based on the Beer-Lambert law [23] and the theory of harmonic detection, using the temperature and pressure differences of multiple absorption lines to correct the error method, which can eliminate the system state error and improve the measurement accuracy of the measuring system.
The SSPEC method consists of four parts, light intensity equivalent correction, sample gas temperature equivalent correction, sample gas pressure equivalent correction and molecular number equivalent correction. Its schematic diagram is shown in Figure 3.
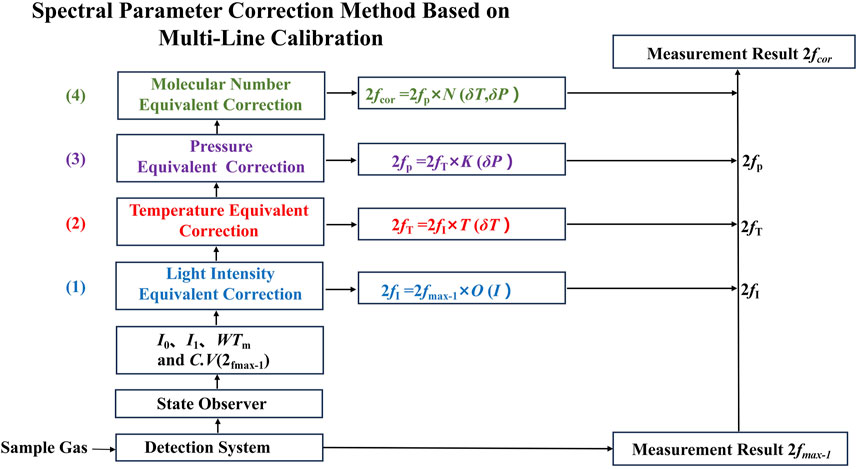
Figure 3. The schematic diagram of SSPEC method.
The equivalent correction of light intensity is used to eliminate the initial light intensity error caused by the deformation of the multi-pass cell due to inaccurate temperature control of the detection system, and the light intensity error caused by the output fluctuation of the laser. The equivalent correction of sample gas temperature is based on the temperature characteristics difference between the measured absorption line and the reference absorption line, and to eliminates the measurement error caused by inaccurate temperature control of the sample gas. The equivalent correction of sample gas pressure eliminates the measurement error caused by inaccurate pressure control of the sample gas by correcting the output of the sample gas at the current pressure to the output at the calibration pressure. The equivalent correction of molecular number eliminates the molecular number error caused by inaccurate temperature and pressure control of the sample gas.
The correction process of SSPEC method can be expressed as Equation 1,
where, 2fcor is the amplitude of the second harmonic signal output by the measuring system after parameter correction, O(I) is the light intensity equivalent correction coefficient when the output light intensity is I, T (δT) is the temperature correction coefficient when the temperature error of the sample gas is δT, K (δP) is the pressure correction coefficient when the pressure error of the sample gas is δP, and N (δt, δP) is the molecular number equivalent correction coefficient when the temperature error of the sample gas is δT and the pressure error is δP.
The following will elaborate in detail on the theories of light intensity equivalent correction, temperature equivalent correction of the sample gas, pressure equivalent correction of the sample gas, and molecular number equivalent correction.
3.2 Light intensity equivalent correction theory
The light intensity equivalent correction is to eliminate the light intensity error by using the difference between the measured initial light intensity and the calibrated initial light intensity, and the light intensity equivalent correction coefficient is expressed as Equation 2:
Where, I0 represents the initial light intensity and I denotes the output light intensity. I0 is a calibration-dependent constant, while I can be directly obtained by the state observer once the system reaches steady state. The amplitude of the second harmonic signal of the measuring system, after equivalent correction of light intensity, can be expressed as Equation 3:
3.3 Temperature equivalent correction theory
Temperature equivalent correction is a method that measures the temperature error of the sample gas by utilizing the temperature characteristic differences between the measured absorption spectral line and the reference absorption spectral line. Then, the measurement results are corrected based on the temperature error of the sample gas. The greater the difference between the temperature characteristics of the measured absorption line and the reference absorption line, the more accurate the sample gas temperature measurement results.
The temperature error of the sample gas can be expressed as Equation 4:
Here, T1 is the reference temperature of the sample gas,
Based on the calculated temperature error of the sample gas, the temperature correction coefficient of the sample gas can be expressed as Equation 5:
Here,
3.4 Pressure equivalent correction theory
The pressure equivalent correction involves adjusting the measurement results based on the discrepancy between the pressure response of the detection system and that of the sample gas. The pressure equivalent correction coefficient can be expressed as Equation 7:
Here, P(X) is the response function of the measuring system under different pressures, X is the pressure of the sample gas, δP is the pressure error of the sample gas,
3.5 Molecular number equivalent correction theory
According to the basic laws of ideal gases, the molecular number density is affected by the temperature and pressure of the sample gas. Molecular number equivalent correction utilizes the errors in the temperature and pressure of the sample gas to correct the molecular number error. The molecular number equivalent correction coefficient can be expressed as Equation 9:
Here, V represents the volume of the multi-pass cell. The amplitude of the second harmonic signal of the measuring system after equivalent correction of the number of molecules can be expressed as Equation 10:
In summary, the SSPEC method based on multi-line calibration can be expressed as Equation 11:
The SSPEC method has two distinct advantages: firstly, it can monitor the status of the measuring system to ensure the reliability of the measurement results. Secondly, it can correct the system status errors to enhance the measurement accuracy of the measuring system.
4 SSPEC method simulation experiment
Considering that the I0 in the light intensity equivalent correction can be measured directly, the reliability of the molecular number equivalent correction is directly affected by the effect of the temperature and pressure correction of the sample gas. Therefore, this part only verifies the validity of the temperature equivalent correction and the pressure equivalent correction.
According to the HITRAN database, when the temperature of the sample gas is 30°C and the pressure is 40 Torr, the relationship between the line intensity ratio (the measured absorption spectral lines over the reference absorption spectral lines) and the temperature of CH4 and CO2 is shown in Figure 4.
Figure 4. The relationship between the line intensity ratio and the temperature of CH4 and CO2.
The actual temperature of the sample gas can be calculated by using the relationship between the line intensity ratio and the temperature of CH4 and CO2. For example, when the concentrations of the CH4 and CO2 sample gas are both 3,000 ppmv, the temperature is 30.4°C, and the pressure is 39.5 Torr, the CH4 and CO2 absorption coefficients are 0.1487 and 0.0870, respectively. Actually, the measured absorption spectral lines of CH4 and CO2 (R1 and R3) over the reference absorption spectral lines (R2 and R4) are 10.0666 and 2.5478, respectively. According to the relationship in Figure 4, the temperature of the sample gas was calculated as 30°C. The absorption coefficients of CH4 and CO2 were corrected using Formula 5. After the correction, the absorption coefficients of CH4 and CO2 were 0.1491 and 0.0873 respectively. After the temperature equivalent correction, the absorption coefficients of CH4 and CO2 are corrected according to the pressure error, and the corrected absorption coefficients of CH4 and CO2 are 0.1503 and 0.0877, respectively. The process of temperature equivalent correction and pressure equivalent correction is shown in Figure 5.
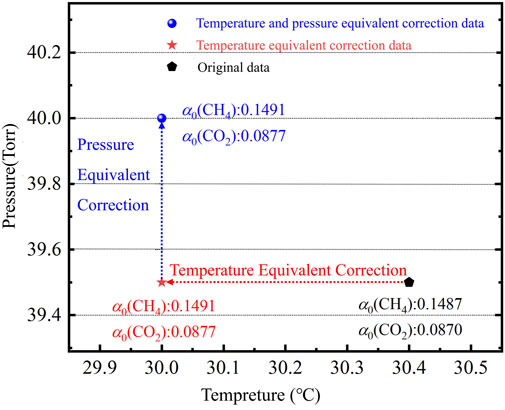
Figure 5. The process of temperature equivalent correction and pressure equivalent correction.
The corrected absorption coefficients of CH4 and CO2 are the same as that of the sample gas at 30°C and 40 Torr. The above simulation results can prove the effectiveness of temperature equivalent correction and pressure equivalent correction, and also preliminarily prove the validity of the SSPEC method based on multi-spectral line calibration.
5 SSPEC method verification experiment
5.1 Experimental validation of the SSPEC method
Take CO2 as an example, the measuring system was employed to measure a 3,000 ppmv CO2 standard gas at 25°C. To clearly illustrate the parameters correction process using SSPEC method, Table 1 records the calibration data, correction process data, measurement errors, and correction results.
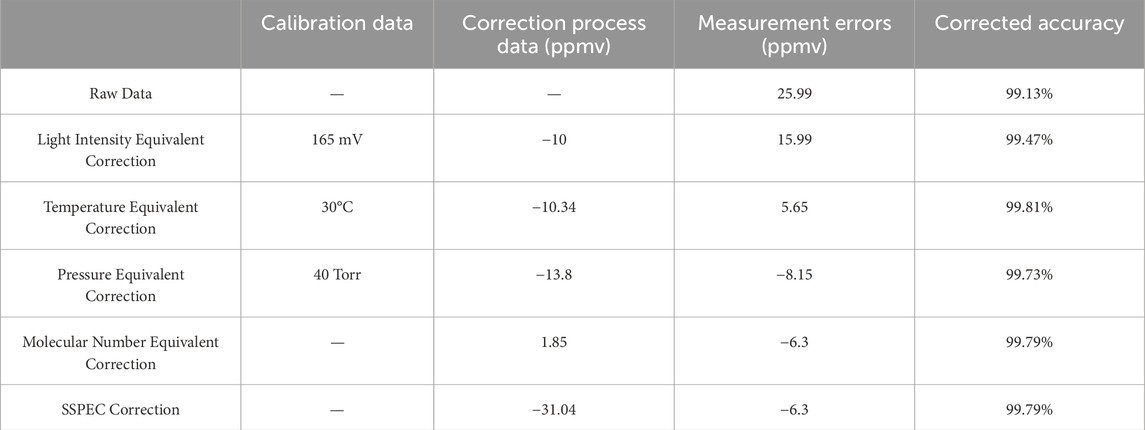
Table 1. Parameters correction process using SSPEC method.
The analysis of the aforementioned measurement results demonstrates that the SSPEC method significantly improves the accuracy of the measuring system.
5.2 The minimum detection limit
A mixed standard gas containing 1,000 ppmv of CH4 and 2,000 ppmv of CO2 was analyzed over an 18-min period. Given that the measuring system is subject to measurement errors due to random noise and gradual baseline drift, Allan variance analysis was employed to assess the MDL. The relationships between the MDLs of two gases and the integration time are illustrated in Figures 6A, B.
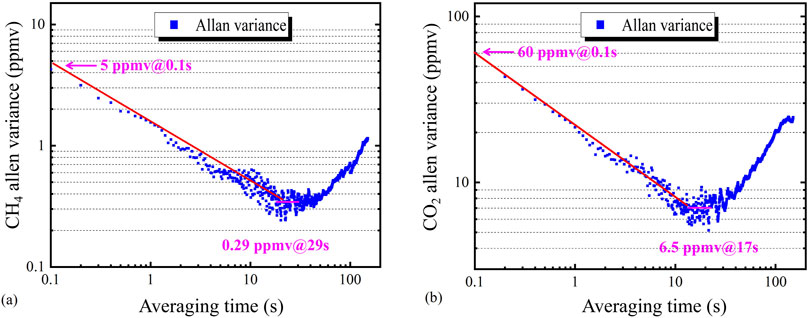
Figure 6. (a) Allan variance analysis for CH4, (b) Allan variance analysis for CO2.
When the integration time is 0.1s, the MDLs for CH4 and CO2 are 5 ppmv and 60 ppmv, respectively. The optimal MDLs of 0.29 ppmv for CH4 and 6.5 ppmv for CO2 are achieved at integration times of 29s and 17s, respectively. When the integration time exceeds the aforementioned period, low-frequency noise becomes dominant in the system noise, leading to a deterioration in the MDL performance parameters.
5.3 Measurement uncertainty
A mixed standard gas containing 1,000 ppmv of CH4 and 3,000 ppmv of CO2 was analyzed over a 50-min period. The measurement data for CH4 and CO2, along with their respective statistical distributions, are presented in Figures 7A, B.
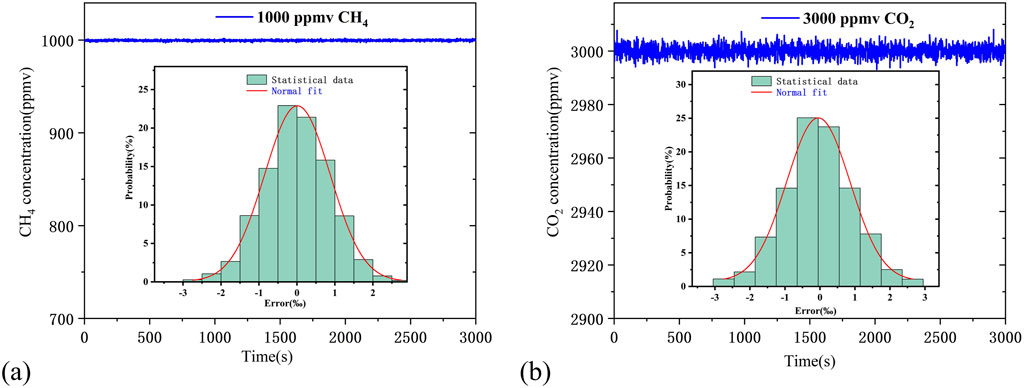
Figure 7. (a) CH4 measurement data and corresponding statistical distribution, (b) CO2 measurement data and corresponding statistical distribution.
As shown in Figure 7, the maximum measurement uncertainty for the mixed standard gas containing 1,000 ppmv CH4 and 3,000 ppmv CO2 is less than 3‰. The maximum concentration measurement errors for CH4 and CO2 are 3 ppmv and 7 ppmv, respectively. Within the 98% confidence interval, the measurement uncertainties for the mixed standard gas with 1,000 ppmv CH4 and 3,000 ppmv CO2 are 2.4‰ and 2.5‰, respectively.
5.4 Measurement accuracy
To evaluate the accuracy of the measurement results, a mixed standard gas containing 500 ppmv CH4 and 1,000 ppmv CO2 was measured six times in a laboratory. The measurement results are presented in Figure 8.

Figure 8. Measurement Results of 500 ppmv CH4 and 1,000 ppmv CO2.
As can be seen from Figure 8, the maximum measurement errors of CH4 and CO2 are 2.3‰ and 2.5‰ respectively. The above test results show that the a CH4 and CO2 measuring system using SSPEC method can meet the application requirements of high-accuracy gas measurement.
5.5 Environmental adaptability
To assess the environmental adaptability of the measuring system using SSPEC method, the experiment was conducted in four distinct environments: a laboratory environment with 20°C, a seismic station environment with 10°C, a 30°C campus environment in summer, and a −10°C campus environment in winter. The mixed standard gas containing 1,500 ppmv CH4 and 2,000 ppmv CO2 was continuously measured 30 times in each environment. The measurement results are presented in Figures 9A, B.
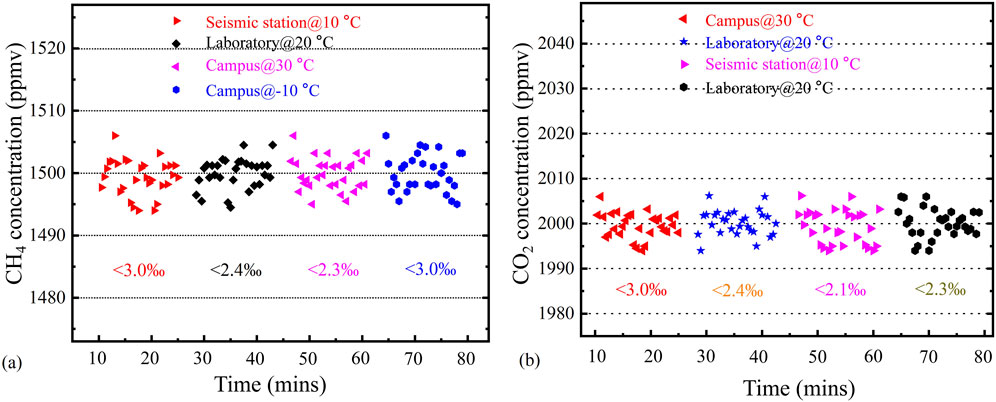
Figure 9. (a) CH4 test results, (b) CO2 test results.
The maximum deviation for both CH4 and CO2 measurements was less than 3‰. These findings demonstrate that the CH4 and CO2 measuring system, which employs SSPEC method, exhibits robust environmental adaptability and is well-suited for gas measurement in field conditions [24, 25].
5.6 Comparative analysis of detection system performance
To highlight the advantages of the proposed CH4 and CO2 measuring system in terms of measurement uncertainty, and measurement range, a comparative analysis was conducted with internationally commercial system, the Los Gatos Research (LGR) UGGA-915. The performance parameters are summarized in Table 2.

Table 2. Measuring performance parameters.
As shown in Table 2, compared with the UGGA-915, the proposed CH4 and CO2 measurement system exhibits significantly reduced measurement uncertainty and a broader measurement range. Additionally, it offers the advantage of in-situ field measurement.
6 Conclusion
This paper investigates a SSPEC method to eliminate system state error and enhance measurement accuracy, which was research from three perspectives: theoretical derivation, simulation analysis, and experimental validation. The results of both simulation analysis and experimental validation demonstrate that the SSPEC method can significantly improve the measurement accuracy of the measuring system. Compared to internationally commercial system, the CH4 and CO2 measuring system exhibits advantages in measurement range, and measurement accuracy.
However, in long-term field observations, the proposed system has exhibited drift issues. Future research will focus on developing self-calibration technology for the system to ensure its long-term and reliable operation.
Data availability statement
The raw data supporting the conclusions of this article will be made available by the authors, without undue reservation. Requests to access the datasets should be directed to Chen Chen, Y2NoZW5Aamx1LmVkdS5jbg==.
Author contributions
YL: Writing–original draft. XL: Writing–review and editing. JC: Writing–review and editing. LD: Writing–review and editing. PL: Writing–review and editing. CC: Writing–review and editing.
Funding
The author(s) declare that financial support was received for the research and/or publication of this article. This work was supported in part by the National Key Research and Development Program of China under Grant 2024YFC2814303 and Grant 2023YFF0714700, in part by the Science and Technology Department of Jilin Province of China under Grant 20240304195SF, in part by the Industrial Technology Research and Development Project of Jilin Provincial Development and Reform Com-mission under Grant 2024C007-5, and in part by the Science and Technology Research Project of Department of Education, Jilin Province, China, under Grant JJKH20211112KJ.
Conflict of interest
Author LD was employed by Jilin Yumai Aviation Co., Ltd. Author PL was employed by Henghui Optoelectronic Measurement Technology (Jilin) Co., Ltd.
The remaining authors declare that the research was conducted in the absence of any commercial or financial relationships that could be construed as a potential conflict of interest.
Generative AI statement
The author(s) declare that no Generative AI was used in the creation of this manuscript.
Publisher’s note
All claims expressed in this article are solely those of the authors and do not necessarily represent those of their affiliated organizations, or those of the publisher, the editors and the reviewers. Any product that may be evaluated in this article, or claim that may be made by its manufacturer, is not guaranteed or endorsed by the publisher.
References
1. Chen Z, Chai Z, Cheng B, Liu H, Cao Y, Cao Z, et al. Geochemistry of high-maturity crude oil and gas from deep reservoirs and their geological significance: a case study on Shuntuoguole low uplift, Tarim Basin, western China. AAPG Bull (2021) 105(1):65–107. doi:10.1306/07072019015
2. Lin C, Cheng Z, Chen X, Lü Z, Pang Z, Xue J, et al. Application of multi-component gas geochemical survey for deep mineral exploration in covered areas. J Geochemical Exploration (2021) 220:106656. doi:10.1016/j.gexplo.2020.106656
3. Zhou X, Liu L, Chen Z, Cui Y, Du J. Gas geochemistry of the hot spring in the Litang fault zone, Southeast Tibetan Plateau. Appl Geochem (2017) 79:17–26. doi:10.1016/j.apgeochem.2017.01.022
4. Luo Q, Song C, Yang C, Gui W, Sun Y, Jeffrey Z. Headspace oxygen concentration measurement for pharmaceutical glass bottles in open-path optical environment using TDLAS/WMS. IEEE Trans Instrumentation Meas (2019) 69(8):5828–42. doi:10.1109/TIM.2019.2958582
5. Huang A, Cao Z, Zhao W, Zhang H, Xu L. Frequency-division multiplexing and main peak scanning WMS method for TDLAS tomography in flame monitoring. IEEE Trans Instrumentation Meas (2020) 69(11):9087–96. doi:10.1109/TIM.2020.2998935
6. Jiang J, Zhao M, Ma G, Song HT, Li CR, Han X, et al. TDLAS-based detection of dissolved methane in power transformer oil and field application. IEEE Sensors J (2018) 18(6):2318–25. doi:10.1109/JSEN.2017.2788871
7. Xia J, Zhu F, Zhang S, Kolomenskii A, Schuessler H. A ppb level sensitive sensor for atmospheric methane detection. Infrared Phys and Technol (2017) 86:194–201. doi:10.1016/j.infrared.2017.09.018
8. Nwaboh J, Werhahn O, Ortwein P, Schiel D, Ebert V. Laser-spectrometric gas analysis: CO2-TDLAS at 2 µm. Meas Sci Technol (2012) 24(1):015202. doi:10.1088/0957-0233/24/1/015202
9. Wagner S, Fisher B, Fleming J, Ebert V. TDLAS-based in situ measurement of absolute acetylene concentrations in laminar 2D diffusion flames. Proc Combustion Inst (2009) 32(1):839–46. doi:10.1016/j.proci.2008.05.087
10. Li C, Dong L, Zheng C, Tittel FK. Compact TDLAS based optical sensor for ppb-level ethane detection by use of a 3.34 μm room-temperature CW interband cascade laser. Sensors Actuators B: Chem (2016) 232:188–94. doi:10.1016/j.snb.2016.03.141
11. Huang Q, Wei Y, Li J. Simultaneous detection of multiple gases using multi-resonance photoacoustic spectroscopy. Sensors Actuators B, Chem (2022) 369:132234. doi:10.1016/j.snb.2022.132234
12. Wu G, Ye H, Zhang X, Gong Z, Tao P, Peng W, et al. All fiber-optic photoacoustic spectroscopy sensor combining resonance and nonresonance photoacoustic cells for high-sensitivity simultaneous dual-gas sensing. IEEE Sensors J (2024) 24(19):30168–75. doi:10.1109/JSEN.2024.3435438
13. Li J, Parchatka U, Fischer H. Development of field-deployable QCL sensor for simultaneous detection of ambient N2O and CO. Sensors Actuators B, Chem (2013) 182:659–67. doi:10.1016/j.snb.2013.03.073
14. Liu N, Xu L, Zhou S, Zhang L, Li J. Simultaneous detection of multiple atmospheric components using an NIR and MIR laser hybrid gas sensing system. ACS Sensors (2020) 5(11):3607–16. doi:10.1021/acssensors.0c01910
15. Yu R, Xia H, Pang T, Wu B, Li Z, Sun P, et al. Simultaneous detection of CO2/CH4 based on off-axis integrated cavity output spectroscopy and time-division-multiplexing-based wavelength modulation spectroscopy. Opt Commun (2023) 545:129731. doi:10.1016/j.optcom.2023.129731
16. Li J, Deng H, Sun J, Yu B, Fischer H. Simultaneous atmospheric CO, N2O and H2O detection using a single quantum cascade laser sensor based on dual-spectroscopy techniques. Sensors Actuators B, Chem (2016) 231:723–32. doi:10.1016/j.snb.2016.03.089
17. Xu L, Zhou S, Liu N, Zhang M, Liang J, Li J. Multigas sensing technique based on quartz crystal tuning fork-enhanced laser spectroscopy. Anal Chem (Washington) (2020) 92(20):14153–63. doi:10.1021/acs.analchem.0c03233
18. Ma L, Fan X, Zhang S, Wang W, Wei G. Research on CH4 gas detection and temperature correction based on TDLAS technology. Spectrosc Spectral Anal (2021) 41(11):3625–31. doi:10.3964/j.issn.1000-0593(2021)11-3632-07
19. Liu N, Xu L, Zhou S, Zhang L, Li J. Soil respiration analysis using a mid-infrared quantum cascade laser and calibration-free WMS-based dual-gas sensor. Analyst (2021) 146(12):3841–51. doi:10.1039/d1an00503k
20. Shao L, Fang B, Zheng F, Qiu X, He Q, Wei J, et al. Simultaneous detection of atmospheric CO and CH4 based on TDLAS using a single 2.3 μm DFB laser. Spectrochimica Acta A: Mol Biomol Spectrosc (2019) 222:117118. doi:10.1016/j.saa.2019.05.023
21. Lemière A, Maldonado A, Désévédavy F, Kibler B, Mathey P, Gadret G, et al. Towards absorption spectroscopy by means of mid-infrared supercontinuum generation in a step index tellurite fiber. Laser Phys (2021) 31(2):025702. doi:10.1088/1555-6611/abd9af
22. Gordon I, Rothman L, Hargreaves E, Hashemi R, Karlovets E, Skinner F, et al. The HITRAN2020 molecular spectroscopic database. J quantitative Spectrosc radiative transfer (2022) 277:107949. doi:10.1016/j.jqsrt.2021.107949
23. Ren Q, Chen C, Wang Y, Wang Y. A prototype of ppbv-level midinfrared CO2 sensor for potential application in deep-sea natural gas hydrate exploration. IEEE Trans Instrumentation Meas (2020) 69(9):7200–8. doi:10.1109/TIM.2020.2975404
24. Singh A, Kuttippurath J, Abbhishek K, Mallick N, Raj S, Chander G, et al. Biogenic link to the recent increase in atmospheric methane over India. J Environ Manage (2021) 289:112526. doi:10.1016/j.jenvman.2021.112526
Keywords: measurement of CH4 and CO2, TDLAS technology, SSPEC method, elimination of measuring system error, environmental adaptability test
Citation: Liu Y, Li X, Chen J, Du L, Lu P and Chen C (2025) A high accuracy measurement of CH4 and CO2 using system state parameter equivalence correction method. Front. Phys. 13:1573242. doi: 10.3389/fphy.2025.1573242
Received: 08 February 2025; Accepted: 12 March 2025;
Published: 25 March 2025.
Edited by:
Jingsong Li, Anhui University, ChinaReviewed by:
Linguang Xu, Anhui Polytechnic University, ChinaZhechao Qu, Physical-Technical Federal Institute, Germany
Gong Zhenfeng, Dalian University of Technology, China
Copyright © 2025 Liu, Li, Chen, Du, Lu and Chen. This is an open-access article distributed under the terms of the Creative Commons Attribution License (CC BY). The use, distribution or reproduction in other forums is permitted, provided the original author(s) and the copyright owner(s) are credited and that the original publication in this journal is cited, in accordance with accepted academic practice. No use, distribution or reproduction is permitted which does not comply with these terms.
*Correspondence: Chen Chen, Y2NoZW5Aamx1LmVkdS5jbg==; Jiayuan Chen, Y2hqeXVhbkBqbGp5LmVkdS5jbg==