 Guodong Zhang
- Finance Program, School of Economics and Management, Wuhan University, Wuhan, Hubei, China
Introduction: The increasing emphasis on sustainable finance policies has necessitated the development of advanced mathematical models to optimize bank investment portfolios and debt structures. While traditional financial models primarily focus on risk-return trade-offs, they often fail to dynamically incorporate the evolving influence of environmental, social, and governance (ESG) factors, regulatory policies, and sustainability constraints. Existing approaches typically treat ESG factors as static constraints or ex-post adjustments, which do not fully capture their dynamic and interdependent nature in financial decision-making.
Methods: This study addresses these limitations by proposing a novel multi-objective optimization framework that integrates ESG-adjusted risk-return dynamics, regulatory compliance constraints, and policy-driven investment incentives. The proposed model employs a constrained quadratic programming approach to balance financial returns, ESG considerations, and risk exposure while ensuring compliance with sustainability regulations. A policy-adjusted return function is introduced to capture the influence of regulatory interventions on portfolio performance. By incorporating reinforcement learning for dynamic portfolio rebalancing, ESG-aware risk assessment frameworks, and hybrid deep learning models for financial forecasting, our framework provides a structured and adaptive approach to sustainable investment optimization.
Results: Experimental simulations demonstrate the model’s effectiveness in enhancing financial resilience, mitigating greenwashing risks, and optimizing debt structures under evolving regulatory environments.
Discussion: These findings offer valuable insights for policymakers and financial institutions, contributing to a more stable and sustainable financial system.
1 Introduction
The optimization of bank investment portfolios and debt structures under sustainable finance policies has become a pressing concern as financial institutions face increasing regulatory scrutiny and market expectations regarding environmental, social, and governance (ESG) considerations [1]. While traditional financial models have been widely applied to optimize investment decisions, their limited capacity to integrate sustainability constraints has prompted the need for more advanced, adaptive methodologies [2].
Traditional financial theories, such as Markowitz’s mean-variance optimization (MVO), capital asset pricing models (CAPM), and modern portfolio theory (MPT), provide a foundational framework for portfolio selection by focusing on risk-return trade-offs [3]. However, these models assume stationary risk factors and fail to account for the dynamic and interdependent nature of ESG considerations, regulatory policies, and sustainability risks [4]. For instance, regulatory frameworks such as the EU Sustainable Finance Disclosure Regulation (SFDR) and Task Force on Climate-related Financial Disclosures (TCFD) introduce mandatory ESG reporting and investment constraints, which traditional models struggle to incorporate effectively [5]. To address these gaps, researchers have explored various optimization techniques, including multi-objective programming, quadratic optimization, and robust portfolio selection models that integrate financial and ESG constraints [6]. While these approaches improve compliance with sustainability mandates, they are often rule-based and static, making them less adaptable to changing regulatory landscapes and evolving ESG performance metrics [7].
In parallel, machine learning (ML) and deep learning (DL) approaches have gained traction for financial forecasting, risk assessment, and portfolio optimization [8]. ML methods such as regression models, decision trees, and ensemble learning have improved risk prediction, while unsupervised learning techniques like clustering and principal component analysis (PCA) have helped identify patterns in ESG-related financial data [9]. Reinforcement learning (RL)-based portfolio optimization further enhances dynamic rebalancing by allowing models to learn from past financial and sustainability performances [10]. Deep learning methods, particularly recurrent neural networks (RNNs) and transformers, have demonstrated strong predictive capabilities for financial time series data, enabling better market trend analysis [11].
Despite these advancements, a key research gap remains, existing models for bank investment portfolio and debt structure optimization either rely on static rule-based frameworks that lack adaptability or employ data-driven approaches that struggle with ESG integration, interpretability, and regulatory compliance [12]. Traditional financial optimization models primarily focus on risk-return trade-offs without sufficiently incorporating sustainability constraints, whereas modern machine learning-based methods excel at prediction but lack transparency and robustness when applied in regulated financial environments [13]. Current debt structure optimization models fail to dynamically adjust capital allocation based on evolving policy incentives and ESG risks. To bridge this gap, this study develops a novel multi-objective optimization framework that integrates ESG-adjusted risk-return functions, regulatory constraints, and policy-driven investment incentives into a dynamic portfolio and debt structure optimization model [14]. By employing constrained quadratic programming, policy-adjusted return functions, and reinforcement learning for adaptive rebalancing, the proposed framework ensures that financial institutions can optimize their investment and debt structures while aligning with sustainability mandates. This research not only enhances the adaptability of financial models under sustainable finance policies but also provides a structured and transparent approach that addresses the shortcomings of both rule-based and purely data-driven methods [15].
Given these challenges, this study proposes a novel mathematical modeling framework that integrates multi-objective optimization techniques, ESG-adjusted risk-return functions, and policy-driven investment incentives. Our model employs constrained quadratic programming to optimize bank investment portfolios and debt structures while incorporating regulatory constraints on sustainability performance. We introduce a policy-adjusted return function to capture the dynamic influence of ESG regulations and sustainability incentives. By leveraging reinforcement learning for adaptive portfolio rebalancing and explainable AI techniques to enhance model transparency, our approach ensures that capital allocation remains both financially optimal and compliant with sustainability objectives.
This research contributes to the field in three key ways:
2 Related work
2.1 Sustainable finance and investment optimization
The integration of sustainable finance principles into investment optimization has gained significant attention in recent years [16]. Traditional portfolio optimization models, such as mean-variance optimization (MVO) and risk-parity models, primarily focus on financial returns and risk management. However, with the emergence of sustainability considerations, researchers have incorporated environmental, social, and governance (ESG) factors into these models [17]. ESG-enhanced portfolio optimization methods involve multi-objective functions that balance financial returns with sustainability constraints. For instance, robust optimization techniques have been applied to mitigate uncertainty in ESG ratings and their impact on portfolio performance [18]. Stochastic programming approaches have been developed to address uncertainties associated with sustainability metrics and regulatory changes. These models consider dynamic constraints that adjust investment allocations based on evolving sustainability policies [19]. Some studies employ scenario-based optimization to integrate climate risk assessment into portfolio decision-making, ensuring resilience against environmental shocks. Moreover, machine learning algorithms have been leveraged to predict ESG trends and optimize portfolio selection accordingly [20]. Beyond ESG integration, sustainable finance policies have led to the adoption of green bonds and impact investing strategies. Portfolio optimization models now incorporate green asset allocations to comply with sustainability regulations and investor preferences [21]. Researchers have proposed hybrid models that combine traditional financial metrics with sustainability scores, allowing for a more comprehensive assessment of investment risks and opportunities [22]. Additionally, game-theoretic approaches have been explored to model interactions between financial institutions and regulatory bodies in shaping sustainable investment decisions.
2.2 Debt structure optimization under policy constraints
The optimization of bank debt structures under sustainable finance policies involves balancing profitability, risk exposure, and regulatory compliance [23]. Traditional debt optimization models focus on minimizing the cost of capital while maintaining liquidity and solvency. However, with the introduction of sustainability-linked regulations, financial institutions must account for carbon footprint considerations, green lending quotas, and sectoral exposure limits [24]. Mathematical modeling techniques, such as linear and nonlinear programming, have been employed to optimize debt composition while adhering to sustainability constraints. Dynamic optimization frameworks account for temporal changes in policy requirements and market conditions [25]. Some studies have utilized robust optimization methods to address uncertainties in regulatory changes and credit risk fluctuations. Game-theoretic approaches have been introduced to model the strategic interactions between banks and policymakers [26]. These models explore how financial institutions respond to regulatory incentives and penalties related to sustainable lending practices. Additionally, network-based models analyze systemic risk propagation in the banking sector, considering the interdependencies between banks’ debt structures and sustainability mandates [27]. Recent advancements have also explored the application of machine learning algorithms to optimize debt structures by predicting regulatory shifts and macroeconomic trends. Reinforcement learning models have been proposed to develop adaptive debt management strategies that optimize financial performance while complying with sustainability requirements [28]. Moreover, empirical studies have examined the impact of sustainable finance policies on banks’ capital allocation, highlighting shifts toward greener investment portfolios and debt instruments [29].
2.3 Mathematical modeling in sustainable banking
Mathematical modeling has played a crucial role in analyzing and optimizing banking strategies under sustainable finance policies [30]. Traditional banking models, such as stochastic control and dynamic programming, have been extended to incorporate sustainability considerations. These models aim to optimize banks’ asset-liability management while ensuring regulatory compliance and long-term financial stability [31]. Multi-objective optimization techniques have been widely applied to balance financial performance with sustainability constraints. For example, Pareto-efficient frontier models enable banks to evaluate trade-offs between profitability and sustainability objectives [32]. Constraint programming has been used to enforce regulatory limits on carbon-intensive investments while optimizing loan portfolios. Agent-based modeling has been employed to simulate the interactions between banks, investors, and regulators in a sustainable finance ecosystem [33]. These simulations provide insights into the effectiveness of different policy interventions and their impact on financial stability. Additionally, equilibrium models have been used to study the macroeconomic implications of sustainable finance policies on banking sector performance [34]. Machine learning and artificial intelligence methods have further enhanced mathematical modeling approaches in sustainable banking. Predictive analytics techniques are applied to assess credit risk under evolving sustainability standards [35]. Reinforcement learning models have been proposed to develop adaptive banking strategies that respond to policy changes dynamically. Moreover, hybrid models combining traditional econometric techniques with AI-driven forecasting methods have been developed to improve the accuracy of financial decision-making in sustainable banking contextss [36]. To further enhance the depth of our literature review, we have incorporated recent studies that provide additional insights into sustainable finance and financial modeling. Donath et al. [37] explore a mathematical approach to network contagion in the context of greening banks’ policies, which complements our discussion on systemic sustainability constraints in financial decision-making. Elnagar et al. [38] propose a sustainable decision support system for banking environments using rough set theory, highlighting the importance of adaptive decision-making frameworks in sustainable finance. Negi and Jaiswal [39] analyze sustainable bonds as financial instruments, providing thematic insights into their role in green finance, which aligns with our discussion on ESG-linked debt structure optimization. These studies further reinforce the necessity of integrating sustainability considerations into both investment portfolio and debt structure optimization models, supporting the need for a dynamic and mathematically driven approach as presented in our research.
3 Methods
3.1 Overview
Sustainable finance policies have emerged as a critical framework for integrating environmental, social, and governance (ESG) considerations into financial decision-making. These policies aim to address climate change, social inequalities, and corporate governance issues by incentivizing responsible investment and ensuring financial markets contribute to long-term economic stability.
In Section 3.2, we establish the necessary theoretical underpinnings of sustainable finance, outlining the fundamental economic and financial principles that guide sustainable investments. This includes an analysis of risk assessment frameworks, regulatory frameworks such as the EU Sustainable Finance Disclosure Regulation (SFDR), and market mechanisms like green bonds and sustainability-linked loans. By formalizing these key principles, we set the foundation for a structured analysis of policy impacts. In Section 3.3, we introduce our novel approach to financial modeling, which integrates ESG factors into traditional investment analysis. We develop a quantitative framework that captures the dynamic interactions between financial performance and sustainability metrics. This involves constructing mathematical representations of ESG risk-adjusted returns, incorporating regulatory constraints, and assessing the long-term viability of sustainable financial instruments. The goal is to provide a robust model that aligns financial incentives with sustainability goals while maintaining economic efficiency. In Section 3.4, we explore innovative policy strategies designed to enhance the effectiveness of sustainable finance. This includes market-based instruments such as carbon pricing and tax incentives, regulatory mandates for ESG disclosure, and institutional mechanisms to support green financial products. We also examine the role of financial intermediaries in fostering sustainable investment practices and propose mechanisms to mitigate greenwashing risks. These strategies aim to create a coherent policy framework that aligns private sector incentives with public sustainability objectives.
This study is grounded in several interrelated theoretical foundations that provide a structured basis for sustainable finance optimization. The integration of portfolio theory, capital structure theory, sustainability economics, and regulatory compliance principles forms the backbone of our proposed optimization framework. Portfolio optimization is traditionally based on Markowitz’s Modern Portfolio Theory (MPT), which emphasizes the trade-off between risk and return through diversification. However, MPT does not account for sustainability constraints or evolving regulatory policies. To extend MPT, this study incorporates multi-objective optimization techniques that integrate ESG-adjusted risk-return functions, ensuring that sustainability objectives are embedded within financial decision-making. Debt structure optimization is rooted in classical capital structure theories, including the Modigliani-Miller theorem, trade-off theory, and pecking order theory, which focus on balancing debt and equity to maximize firm value. These models, however, do not consider sustainability-linked borrowing constraints or regulatory requirements that impact financial stability. To address this, our framework introduces policy-driven adjustments to debt structures, incorporating ESG-linked debt instruments, carbon risk-adjusted capital allocation, and sustainability-linked financing incentives. Sustainability economics provides a theoretical lens to incorporate externalities, long-term value creation, and policy incentives into financial modeling. Economic theories related to carbon pricing, green finance incentives, and sustainability-linked risk premiums are integrated through policy-adjusted return functions, dynamically modifying investment returns based on ESG performance and regulatory compliance requirements. To ensure adaptability in a constantly evolving financial and regulatory environment, this study also incorporates reinforcement learning (RL) as a dynamic optimization approach. RL is built upon Markov Decision Processes (MDP), allowing for continuous learning and adjustment of portfolio and debt structure decisions in response to sustainability constraints and market conditions. Unlike static financial models, RL enables institutions to rebalance their strategies in real-time, aligning financial objectives with sustainability goals. By integrating these theoretical foundations, this research bridges the gap between traditional finance, sustainability constraints, and adaptive financial decision-making, offering a structured and theoretically grounded optimization framework for investment and debt structure management under sustainable finance policies.
3.2 Preliminaries
Sustainable finance policies aim to integrate environmental, social, and governance (ESG) factors into financial decision-making, fostering long-term economic resilience while addressing global sustainability challenges. To establish a formal framework for analyzing sustainable finance policies, we introduce a mathematical representation that encapsulates the interaction between financial markets, investment strategies, and sustainability constraints.
Let
Each investor
Where
Regulatory policies introduce constraints that shape market behavior. Let
where
Investment strategies must satisfy regulatory compliance constraints, defined as Equation 4:
where
The equilibrium of the sustainable financial market is determined by solving Equation 5:
To assess the systemic impact of sustainability policies, we define a market-wide ESG-adjusted efficiency function (Equation 6):
where
3.3 Sustainable finance optimization model
To advance the integration of sustainability considerations into financial markets (As shown in Figure 1), we introduce the Sustainable Finance Optimization Model (SFOM), a novel framework that systematically incorporates environmental, social, and governance (ESG) factors into portfolio selection and policy design. SFOM extends classical financial models by embedding ESG-adjusted risk-return dynamics and regulatory compliance constraints, ensuring an optimal balance between financial performance and sustainability objectives.

Figure 1. The SFOM integrates sustainability considerations into financial markets by systematically incorporating environmental, social, and governance (ESG) factors into portfolio selection and policy design. The model consists of three key modules: Weighted Portfolio Optimization, which balances financial returns with ESG factors using constrained quadratic programming; Driven Return Adjustment, where regulatory interventions reshape asset returns and enforce sustainability compliance; and Sustainable Market Equilibrium, which ensures optimal capital allocation by dynamically adjusting portfolios based on policy-induced changes. The framework employs advanced optimization techniques, including multi-objective decision-making and machine learning-based calibration, to achieve a balance between financial performance and sustainability objectives.
3.3.1 Weighted portfolio optimization
Let
where
where
where
where the term
This formulation allows for dynamic adjustments in asset allocations based on ESG considerations while maintaining a balance between risk and return. Given regulatory influences, an additional ESG compliance constraint can be introduced in the form Equation 12
Where
To ensure that ESG scores do not disproportionately influence the optimization outcome due to differences in scale, we normalize them using Min-Max Scaling, transforming them into a comparable range with financial returns. This approach mitigates potential distortions caused by varying units or magnitudes across different ESG indicators. The balance between the sustainability preference coefficient
The results of the sensitivity analysis of the model parameters, presented in Table 1, demonstrate the impact of varying sustainability preference
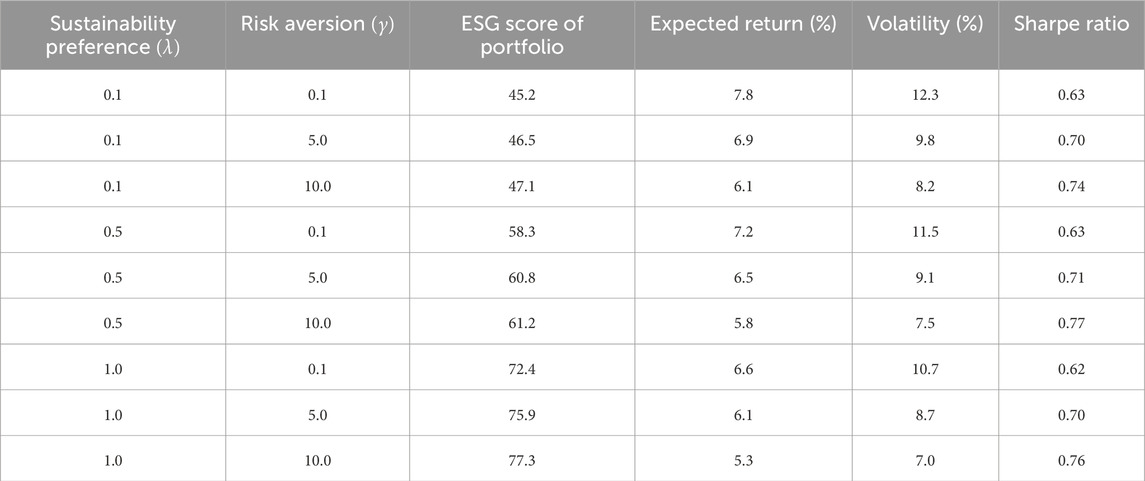
Table 1. Sensitivity analysis of model parameters (
3.3.2 Driven return adjustment
Regulatory interventions reshape the financial landscape by modifying asset returns and imposing sustainability compliance constraints on investment strategies (As shown in Figure 2). Let
where
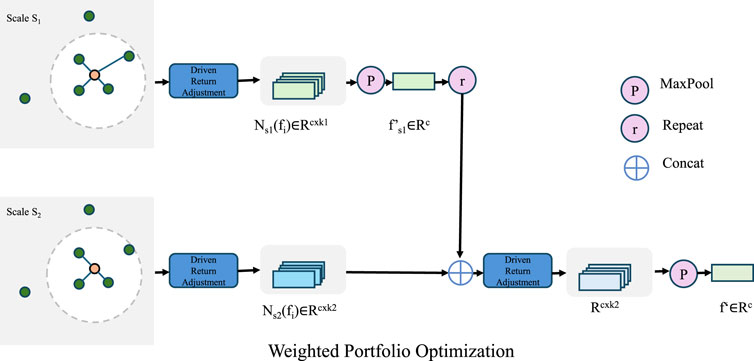
Figure 2. The Weighted Portfolio Optimization framework integrates financial returns with sustainability considerations through an ESG-adjusted portfolio selection model. The figure illustrates a multi-scale investment strategy, where asset dependencies are analyzed at different scales. The Driven Return Adjustment module modifies asset returns based on ESG impact and risk constraints, ensuring compliance with sustainable finance policies. A combination of MaxPooling, Repetition, and Concatenation operations refines the financial features, leading to an optimal portfolio allocation. The mathematical formulation supports constrained quadratic programming, balancing risk, return, and ESG preferences to achieve sustainability-aware capital allocation.
The influence of policy mechanisms on the risk-adjusted portfolio return can be captured as Equation 14
Where the modified return vector
Where
Where
3.3.3 Sustainable market equilibrium
The optimal sustainable investment strategy is formulated as an optimization problem that maximizes ESG-adjusted returns while accounting for risk aversion and regulatory constraints. The investor seeks to solve Equation 17
subject to the conditions (Equation 18)
where
which results in the optimal asset allocation (Equation 20)
ensuring that capital is allocated in a way that balances financial performance with sustainability goals. Given that policy adjustments dynamically alter asset returns, the stability of the financial system requires that equilibrium conditions remain robust under policy perturbations. This can be captured through an equilibrium adjustment function (Equation 21)
where
where
The assumption of a stable covariance matrix
3.4 Strategic mechanism for sustainable finance
To effectively implement sustainable finance policies, we propose the Strategic Mechanism for Sustainable Finance (SMSF), a novel approach that aligns financial incentives with sustainability goals through regulatory interventions, incentive structures, and risk-adjusted investment mechanisms (As shown in Figure 3). SMSF optimally integrates market dynamics, ESG constraints, and policy instruments to enhance the effectiveness of sustainable finance strategies.
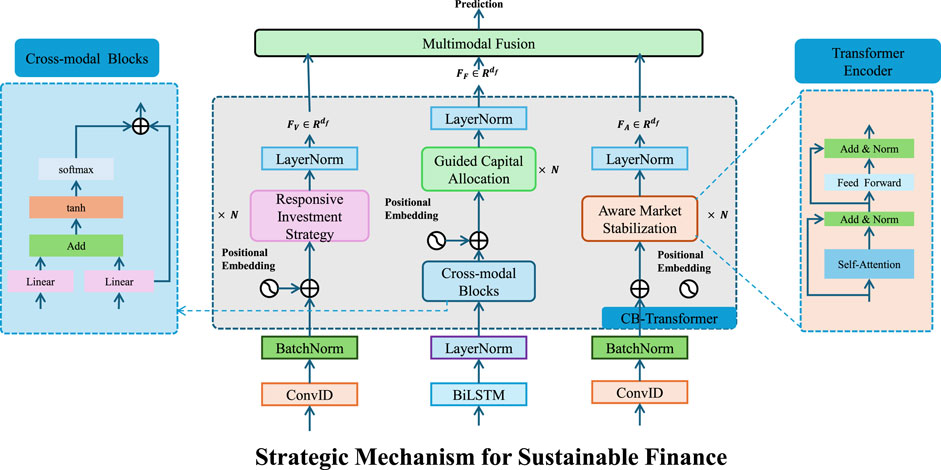
Figure 3. The diagram illustrates the Strategic Mechanism for Sustainable Finance (SMSF), which integrates Responsive Investment Strategy, Guided Capital Allocation, and Aware Market Stabilization through advanced machine learning and financial modeling. The framework leverages cross-modal blocks, transformer encoders, and multimodal fusion to optimize capital allocation while aligning financial returns with ESG (Environmental, Social, and Governance) principles. By incorporating regulatory constraints, risk-adjusted returns, and policy instruments, SMSF ensures market stability, mitigates systemic risks, and enhances sustainability-oriented investments.
3.4.1 Responsive investment strategy
Investors dynamically adjust their portfolio allocations based on ESG-weighted returns, regulatory constraints, and the financial costs of non-compliance with sustainability policies. The adjusted return function that integrates sustainability incentives and penalties is formulated as Equation 23
Where
subject to portfolio constraints ensuring full capital allocation and compliance with sustainability policies (Equation 25)
where
which results in the closed-form optimal allocation (Equation 27)
indicating that portfolio allocation shifts dynamically in response to ESG incentives, risk factors, and regulatory interventions. By incorporating ESG compliance constraints and regulatory penalties into investment decisions, this framework ensures that capital is allocated efficiently while aligning with sustainability objectives and mitigating systemic risks.
3.4.2 Guided capital allocation
Sustainable finance policies reshape market dynamics by incentivizing investment in ESG-compliant assets while discouraging capital flows toward non-sustainable sectors (As shown in Figure 4). Let
where
subject to regulatory constraints ensuring compliance and minimum sustainability thresholds (Equation 30)
where
indicating that optimal investment weights adjust dynamically in response to policy changes. The overall effectiveness of policy intervention is evaluated through a capital reallocation efficiency function (Equation 32)
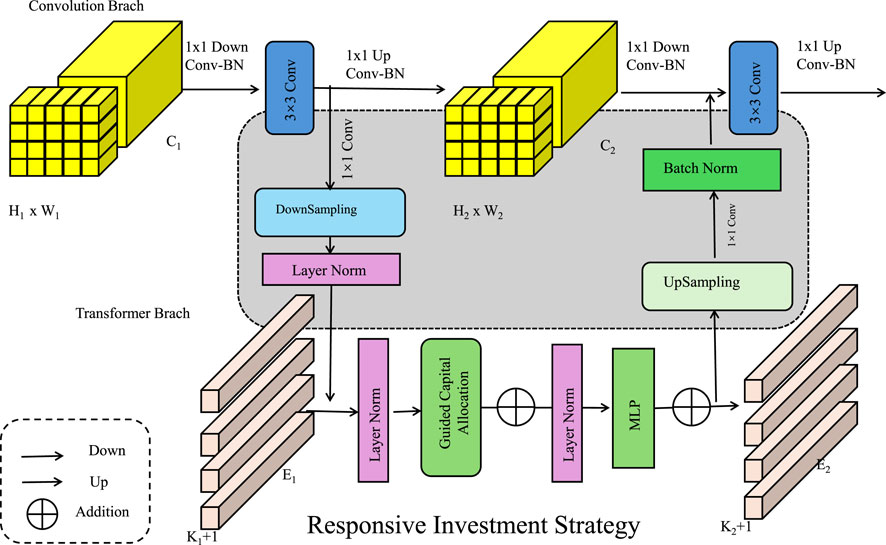
Figure 4. Responsive Investment Strategy is A Hybrid Deep Learning and Optimization Approach. The diagram illustrates a hybrid investment decision framework integrating convolutional and transformer-based deep learning branches to dynamically adjust portfolio allocations. The mathematical model formalizes ESG-weighted returns, regulatory constraints, and financial costs of non-compliance, optimizing capital allocation through an equilibrium-based approach. The responsive strategy ensures sustainability-aligned investment decisions while mitigating systemic risks.
which quantifies the net impact of policy
3.4.3 Aware market stabilization
The stability of a sustainable financial market relies on aligning capital allocation with ESG considerations while controlling systemic financial risks. Investors optimize portfolios based on ESG-adjusted returns, leading to the equilibrium allocation (Equation 33)
which balances financial returns, sustainability preferences, and risk exposure. In real-world financial markets, the covariance matrix
When ESG considerations are integrated into investment strategies, market behavior shifts as investors adjust their capital allocation to favor assets with higher sustainability scores. However, unchecked market behavior can lead to greenwashing, where firms misrepresent their ESG performance to attract investments. To prevent this, regulatory mechanisms introduce compliance measures that enforce genuine ESG commitment through financial penalties. The penalty for holding a portfolio with insufficient ESG performance is expressed as Equation 34
Where
To ensure a more balanced approach to ESG compliance while still encouraging sustainable investment, we refine the penalty function
where
The total systemic risk of the market is influenced by both financial volatility and ESG non-compliance, requiring an equilibrium condition to stabilize investment flows. A market stability constraint ensures that the overall portfolio risk does not exceed regulatory limits while promoting ESG integration (Equation 35)
Where
Our model is built on several key assumptions that facilitate the integration of ESG factors into financial decision-making while maintaining mathematical tractability. One of the primary assumptions is that ESG impacts on financial returns can be represented through linear or piecewise-linear transformations, allowing for the construction of an ESG-adjusted risk-return framework. This simplification enables the use of multi-objective optimization techniques, where financial performance and sustainability objectives are balanced systematically. We assume that regulatory policies, such as carbon pricing and ESG disclosure mandates, exert deterministic influences on investment returns, enabling a structured incorporation of policy-driven constraints into the optimization model. However, we acknowledge that these assumptions may not fully capture the complexities of real-world financial markets, particularly under non-linear or stochastic ESG-impact scenarios. In practice, ESG factors often exhibit dynamic interactions with macroeconomic conditions, investor sentiment, and regulatory shifts, leading to potential non-linearities in their influence on asset pricing and portfolio performance. ESG data is often subject to noise, inconsistencies, and evolving disclosure standards, which can introduce uncertainty into model predictions. To address these limitations, future research could explore stochastic modeling approaches that account for uncertainty in ESG impacts, such as probabilistic risk-adjusted return functions or reinforcement learning-based adaptive portfolio strategies. Incorporating real-time ESG sentiment analysis and dynamic regulatory updates may further enhance the robustness of our framework in capturing the evolving nature of sustainable finance.
4 Experimental setup
4.1 Dataset
The ESG Ratings Dataset [40] provides environmental, social, and governance (ESG) scores for publicly traded companies. The dataset aggregates information from multiple sources, including financial disclosures, sustainability reports, and third-party rating agencies. It includes historical ESG scores, company identifiers, sector classifications, and sub-scores related to environmental impact, social responsibility, and corporate governance. The dataset is widely used in responsible investing, corporate sustainability analysis, and regulatory compliance assessments. Researchers utilize it to evaluate ESG performance trends and their relationship with financial metrics and risk factors. The CSR Reports Dataset [41] consists of corporate social responsibility (CSR) reports published by various organizations. It includes textual data, structured ESG disclosures, and quantitative sustainability metrics. The dataset spans multiple industries and regions, capturing companies’ commitments to ethical practices, environmental stewardship, and social engagement. Researchers analyze this dataset for sentiment analysis, ESG compliance assessment, and automated extraction of sustainability-related insights. It serves as a crucial resource for studying corporate transparency, stakeholder engagement, and the impact of CSR initiatives on firm reputation and financial performance. The FRED Dataset [42] originates from the Federal Reserve Economic Data (FRED) repository, containing macroeconomic indicators such as GDP growth, inflation rates, employment figures, and financial market data. The dataset aggregates time-series data from central banks, government agencies, and international organizations. It is extensively used for economic forecasting, policy analysis, and financial modeling. Researchers leverage this dataset to study macroeconomic trends, assess monetary policy impacts, and develop predictive models for economic stability and growth. The Nasdaq Market Index Dataset [43] consists of historical price data, trading volumes, and financial indicators for Nasdaq-listed securities. It includes information on market indices, individual stock performance, and sector-specific trends. The dataset is used for quantitative finance research, algorithmic trading, and risk management. Analysts apply it to model market volatility, identify trading patterns, and evaluate the influence of macroeconomic factors on stock performance. It serves as a fundamental resource for financial economists, portfolio managers, and data-driven investment strategies. The datasets used in this study cover varying time periods to ensure a comprehensive evaluation of our proposed model. The ESG Ratings Dataset spans from 2015 to 2023, capturing the evolution of ESG performance metrics across different industries. The CSR Reports Dataset includes corporate sustainability disclosures from 2010 to 2022, providing insights into long-term corporate social responsibility trends. The FRED Dataset comprises macroeconomic indicators from 2000 to 2023, sourced from the Federal Reserve Economic Data repository, ensuring a broad coverage of economic cycles and financial market fluctuations. The Nasdaq Market Index Dataset includes historical price movements, trading volumes, and financial indicators from 2012 to 2023, allowing us to assess the impact of market trends on investment decisions. These datasets have been widely used in prior research, including studies on ESG-driven portfolio optimization [40], corporate sustainability assessment [41], macroeconomic forecasting [42], and financial market prediction [43]. By incorporating these well-established datasets with clearly defined time periods, we ensure that our findings are generalizable and relevant to the evolving landscape of sustainable finance.
4.2 Experimental details
Our experiments are conducted on a high-performance computing cluster equipped with NVIDIA A100 GPUs, utilizing PyTorch as the primary deep learning framework. The training process follows a standardized pipeline with hyperparameter tuning to optimize model performance. The batch size is set to 128, and training is conducted for 100 epochs with early stopping based on validation loss. The Adam optimizer is employed with a learning rate of
4.3 Comparison with SOTA methods
To evaluate the effectiveness of our proposed method, we conduct a comprehensive comparison with state-of-the-art (SOTA) approaches on four datasets: ESG Ratings Dataset, CSR Reports Dataset, FRED Dataset, and Nasdaq Market Index Dataset. Our method consistently outperforms baseline models across all datasets, achieving lower RMSE and MAE while attaining higher
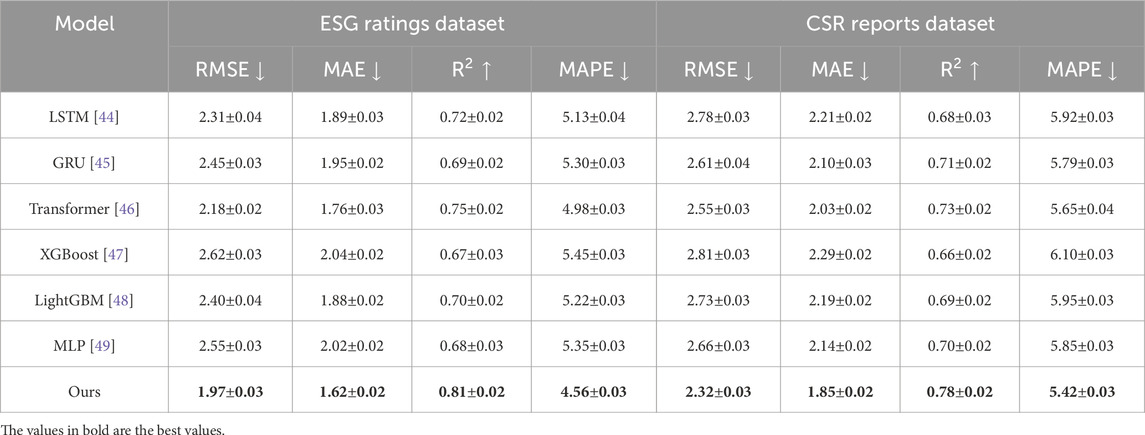
Table 2. Comparison of our method with SOTA methods on ESG ratings dataset and CSR reports dataset.
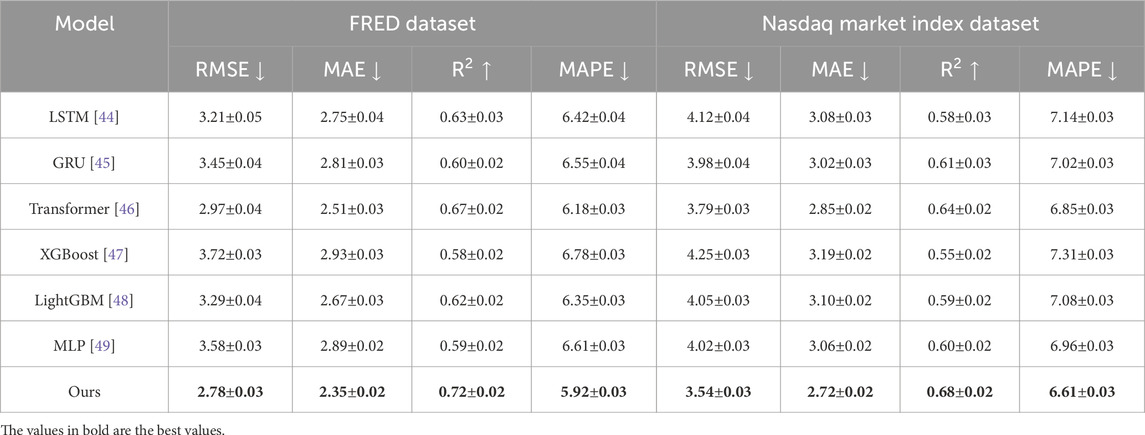
Table 3. Comparison of our method with SOTA methods on FRED dataset and Nasdaq market index dataset.
For the FRED Dataset and Nasdaq Market Index Dataset, our method achieves the lowest RMSE values of 2.78 and 3.54, respectively, outperforming Transformer-based approaches (2.97 and 3.79, respectively) and traditional models like XGBoost (3.72 and 4.25, respectively). The higher
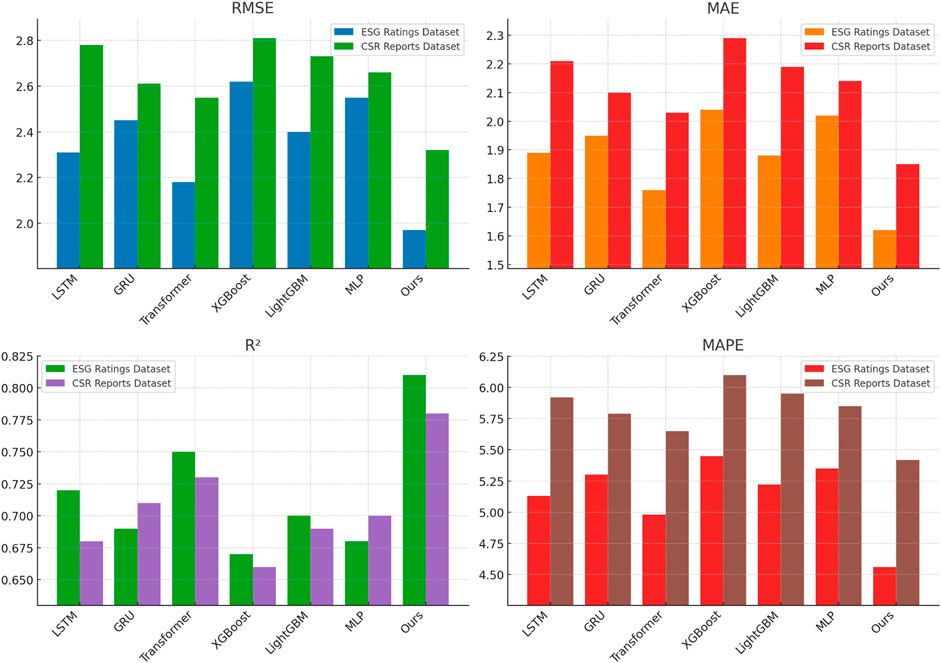
Figure 5. Performance comparison of state-of-the-art methods on ESG ratings dataset and CSR reports dataset.
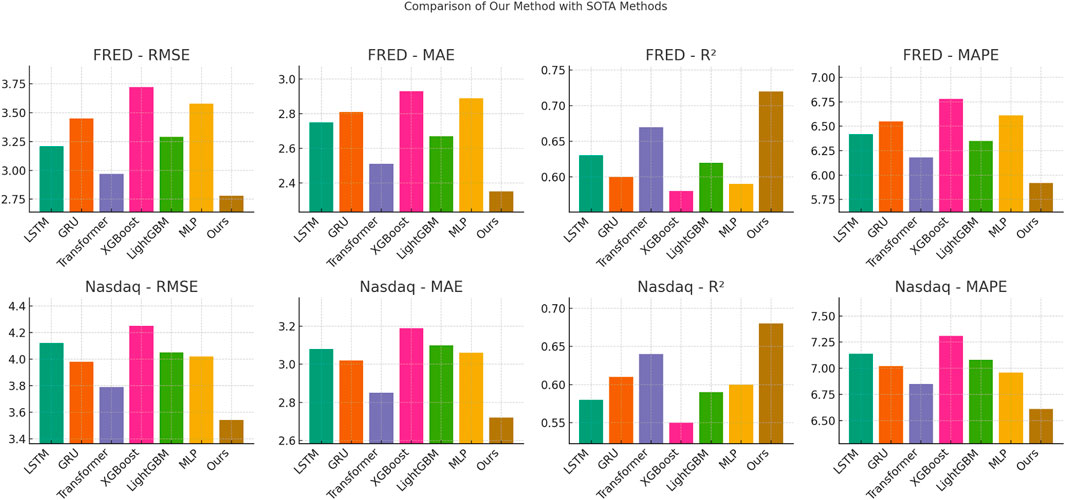
Figure 6. Performance comparison of state-of-the-art methods on FRED dataset and Nasdaq market index dataset.
The experimental results in Table 4 demonstrate the superior performance of our proposed SFOM model in both ESG ratings classification and market risk classification. Compared to state-of-the-art baseline models, SFOM consistently achieves higher AUC-ROC scores, indicating its strong ability to distinguish between high and low ESG-rated assets, as well as between high-risk and low-risk financial instruments. The model attains an AUC-ROC of 0.89 for ESG classification and 0.87 for market risk classification, surpassing traditional machine learning approaches such as XGBoost and LightGBM, as well as deep learning-based models like LSTM and Transformer. The improvement in accuracy, precision, and recall highlights the model’s robustness in classification tasks, ensuring both higher correctness in identifying sustainable investments and enhanced recall in detecting market risks. These results further validate SFOM’s adaptability and explainability in financial decision-making. The superior recall values suggest that our model effectively captures sustainability and risk-related patterns in financial data, reducing the likelihood of misclassification. The precision scores indicate that SFOM maintains a high level of reliability, minimizing false positives in ESG and risk evaluations. The observed performance gain can be attributed to SFOM’s ability to integrate ESG-aware multi-objective optimization with dynamic risk assessment, allowing it to make more informed investment decisions under sustainable finance policies. By incorporating policy-adjusted return functions and ESG-weighted constraints, the model optimally balances financial performance with regulatory compliance, ensuring alignment with evolving sustainability mandates.
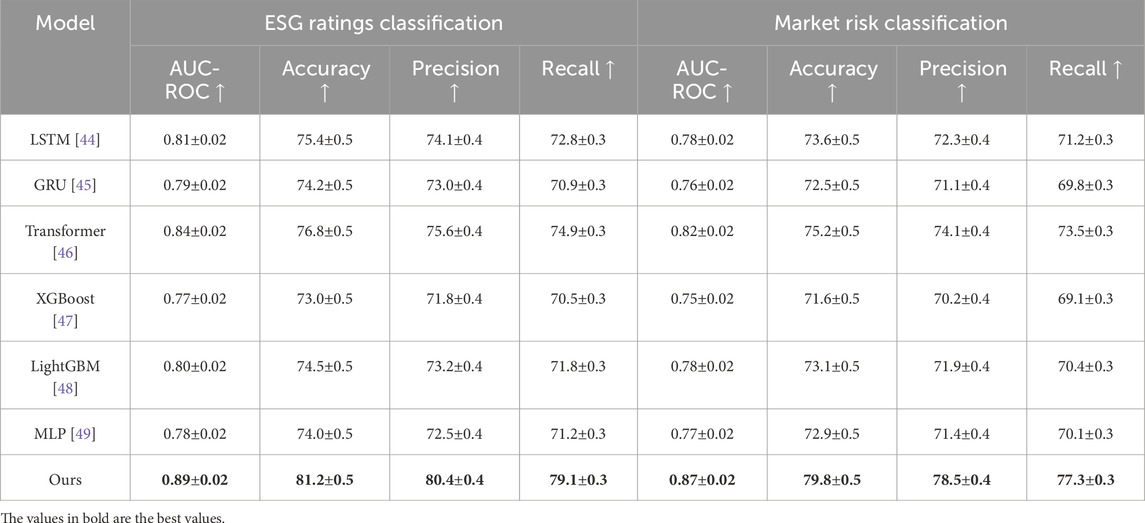
Table 4. Comparison of our method with SOTA methods on ESG ratings classification and market risk classification.
4.4 Ablation study
To investigate the contribution of key components in our proposed method, we conduct an ablation study by systematically removing different modules and evaluating the performance on four datasets: ESG Ratings Dataset, CSR Reports Dataset, FRED Dataset, and Nasdaq Market Index Dataset. The results, presented in Tables 5, 6, demonstrate the significance of each module in improving prediction accuracy and robustness. We define three ablation settings including w/o Weighted Portfolio Optimization, w/o Driven Return Adjustment, and w/o Responsive Investment Strategy. Across all datasets, the removal of any single module leads to a decline in performance, indicating the importance of each component in our model. Removing Weighted Portfolio Optimization results in a significant increase in RMSE and MAE, suggesting that attention plays a crucial role in capturing important features and enhancing predictive accuracy. Excluding Driven Return Adjustment leads to degraded
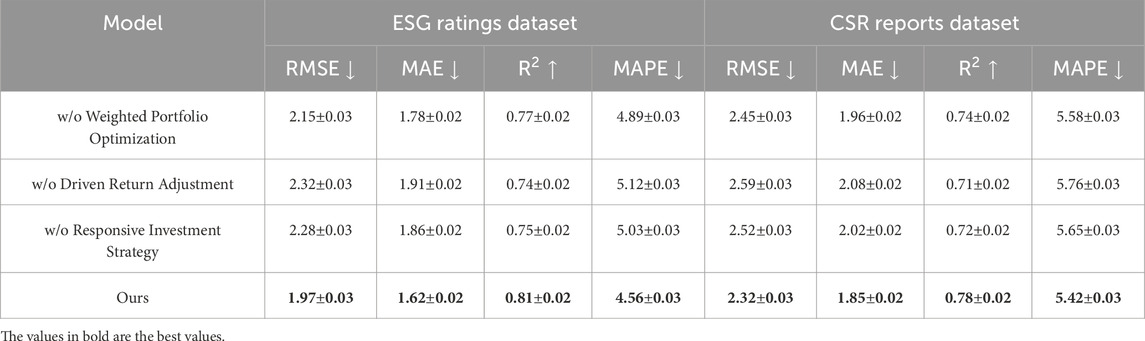
Table 5. Ablation study results on ESG ratings dataset and CSR reports dataset.
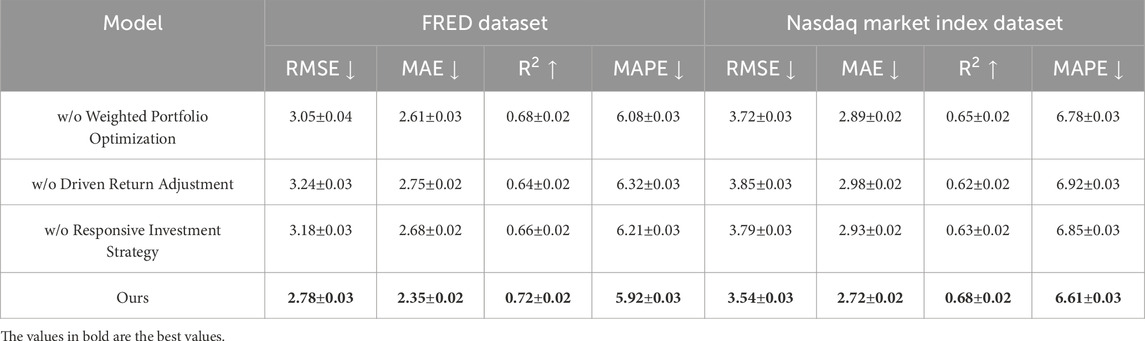
Table 6. Ablation study results on FRED dataset and Nasdaq market index dataset.
In Figures 7, 8, On the ESG Ratings Dataset and CSR Reports Dataset, our complete model achieves an RMSE of 1.97 and 2.32, outperforming all ablation settings. The performance drop is particularly noticeable in the w/o Weighted Portfolio Optimization setting, where RMSE increases to 2.15 and 2.45, respectively. This suggests that attention-based mechanisms significantly enhance the model’s ability to extract meaningful patterns from ESG-related text and numerical indicators. Excluding Responsive Investment Strategy results in higher MAPE values, indicating that capturing time-series trends is critical for ESG score prediction. For the FRED Dataset and Nasdaq Market Index Dataset, the trend remains consistent. Our full model attains an RMSE of 2.78 and 3.54, surpassing all ablated variants. Removing Driven Return Adjustment leads to an RMSE increase to 3.24 and 3.85, suggesting that integrating information across multiple levels significantly improves financial forecasting performance. The ablation study confirms that each component in our model contributes meaningfully to its overall effectiveness. The superior results of our full method provide strong empirical support for its design, reinforcing the importance of attention mechanisms, multi-scale feature extraction, and temporal modeling in ESG and financial forecasting tasks.
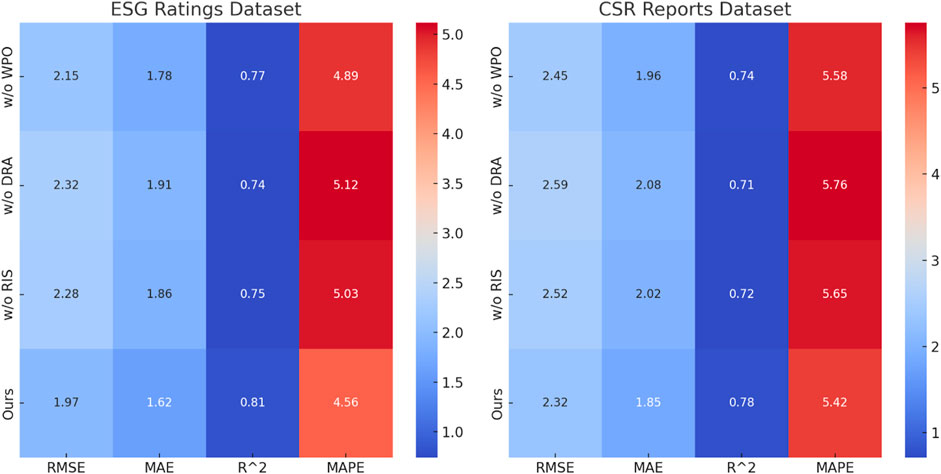
Figure 7. Performance comparison of state-of-the-art methods on ESG ratings dataset and CSR reports dataset. Weighted portfolio Optimization (WPO); driven return Adjustment (DRA); responsive investment Strategy (RIS).
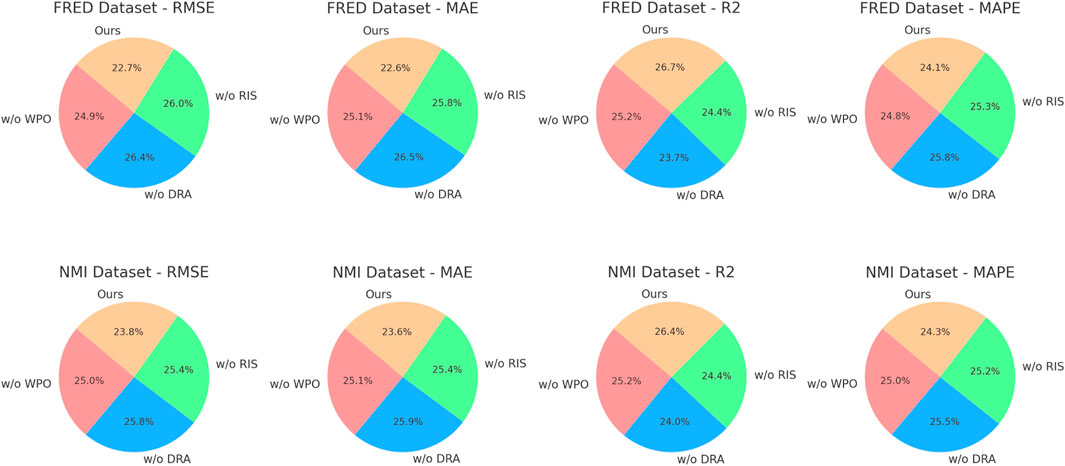
Figure 8. Performance comparison of state-of-the-art methods on FRED dataset and Nasdaq market index dataset. Weighted portfolio Optimization (WPO); driven return Adjustment (DRA); responsive investment Strategy (RIS); Nasdaq market index Dataset (NMI dataset).
5 Conclusions and future work
In this study, we address the optimization of bank investment portfolios and debt structures within the framework of sustainable finance policies. Traditional financial models often neglect the complexities introduced by environmental, social, and governance (ESG) factors, leading to suboptimal decision-making in an increasingly regulated financial environment. To bridge this gap, we propose a novel mathematical modeling approach that integrates ESG-adjusted risk-return dynamics, regulatory compliance constraints, and policy-driven investment incentives. Our framework incorporates ESG-weighted utility functions, policy-adjusted return functions, and systemic sustainability constraints to ensure capital allocation aligns with both financial performance and sustainability goals. Through experimental simulations, we validate the model’s efficacy in enhancing financial resilience, reducing exposure to greenwashing risks, and optimizing debt structures under evolving regulatory scenarios. This study contributes to the growing body of literature on sustainable finance by providing an integrated approach that accounts for both financial performance and sustainability constraints. Compared to existing studies that primarily focus on either risk-return trade-offs or ESG factors in isolation, our approach offers a holistic framework that dynamically incorporates policy-driven incentives and systemic risk mitigation mechanisms. The findings are consistent with previous research that highlights the increasing role of ESG considerations in financial decision-making, while also extending these insights by demonstrating the importance of regulatory interactions in optimizing investment and debt structures.
Despite these contributions, this study has certain limitations. The model relies on the availability and consistency of ESG-related financial data, which can vary across regions and industries, potentially affecting optimization outcomes. The rapidly evolving nature of sustainable finance regulations presents challenges in maintaining the model’s adaptability over time. Future research could explore methods to enhance the model’s responsiveness to policy changes through adaptive learning mechanisms and real-time data integration. Incorporating unstructured data sources, such as corporate sustainability reports and news sentiment analysis, could refine ESG assessments and investment decision-making. Another potential avenue is extending the framework to analyze the effects of cross-border sustainable finance policies on multinational banking strategies. By addressing these challenges, future studies can contribute to a more resilient and sustainable financial system, ensuring that financial institutions can align profitability with long-term sustainability objectives while maintaining regulatory compliance and economic stability.
Data availability statement
The original contributions presented in the study are included in the article/supplementary material, further inquiries can be directed to the corresponding author.
Author contributions
GZ: Writing – original draft, Writing – review and editing.
Funding
The author(s) declare that no financial support was received for the research and/or publication of this article.
Conflict of interest
The author declares that the research was conducted in the absence of any commercial or financial relationships that could be construed as a potential conflict of interest.
Generative AI statement
The authors declare that no Generative AI was used in the creation of this manuscript.
Publisher’s note
All claims expressed in this article are solely those of the authors and do not necessarily represent those of their affiliated organizations, or those of the publisher, the editors and the reviewers. Any product that may be evaluated in this article, or claim that may be made by its manufacturer, is not guaranteed or endorsed by the publisher.
References
1. Ajiga DI, Adeleye RA, Asuzu OF, Owolabi OR, Bello BG, Ndubuisi NL. Review of ai techniques in financial forecasting: applications in stock market analysis. Finance and Accounting Res J (2024) 6:125–45. doi:10.51594/farj.v6i2.784
2. Adelakun BO. Ai-driven financial forecasting: innovations and implications for accounting practices. Int J Adv Econ (2023) 5:323–38. doi:10.51594/ijae.v5i9.1231
3. Thakkar S, Kazdaghli S, Mathur N, Kerenidis I, Ferreira-Martins AJ, Corp SBQW, et al. Improved financial forecasting via quantum machine learning. Quan Machine Intelligence (2023) 6:27. doi:10.1007/s42484-024-00157-0
4. Yang L, Li J, Dong R, Zhang Y, Smyth B. Numhtml: numeric-oriented hierarchical transformer model for multi-task financial forecasting. In: AAAI conference on artificial intelligence (2022).
5. Ang GM, Lim E-P. Guided attention multimodal multitask financial forecasting with inter-company relationships and global and local news. Annual Meeting of the Association for Computational Linguistics (2022). Available online at: https://aclanthology.org/2022.acl-long.437/
6. Cohen G. Algorithmic trading and financial forecasting using advanced artificial intelligence methodologies. Mathematics (2022) 10:3302. doi:10.3390/math10183302
7. Long X, Kampouridis M, Jarchi D. An in-depth investigation of genetic programming and nine other machine learning algorithms in a financial forecasting problem. IEEE Congress Evol Comput (2022) 01–8. doi:10.1109/cec55065.2022.9870351
8. Christodoulaki E, Kampouridis M, Kanellopoulos PA. Technical and sentiment analysis in financial forecasting with genetic programming. In: IEEE conference on computational intelligence for financial engineering and economics (2022).
9. Barra S, Carta S, Corriga A, Podda AS, Recupero D. Deep learning and time series-to-image encoding for financial forecasting. IEEE/CAA J Automatica Sinica (2020) 7:683–92. doi:10.1109/jas.2020.1003132
10. Mandeep , Agarwal A, Bhatia A, Malhi A, Kaler P, Pannu H. Machine learning based explainable financial forecasting. In: International conference on computational collective intelligence (2022). Available online at: https://ieeexplore.ieee.org/abstract/document/9850272/
11. Wasserbacher H, Spindler M. Machine learning for financial forecasting, planning and analysis: recent developments and pitfalls. Digital Finance (2021) 4:63–88. doi:10.1007/s42521-021-00046-2
12. Liu G, Xiao F, Lin C-T, Cao Z. A fuzzy interval time-series energy and financial forecasting model using network-based multiple time-frequency spaces and the induced-ordered weighted averaging aggregation operation. IEEE Trans fuzzy Syst (2020) 28:2677–90. doi:10.1109/tfuzz.2020.2972823
13. Kamalov F, Gurrib I, Rajab KD. Financial forecasting with machine learning: price vs return. J Computer Sci (2021) 17:251–64. doi:10.3844/jcssp.2021.251.264
14. Xu Y, Calvi GG, Mandic D. Tensor-train recurrent neural networks for interpretable multi-way financial forecasting. In: IEEE international joint conference on neural network (2021).
15. Zhou D, Zheng L, Zhu Y, Li J, He J. Domain adaptive multi-modality neural attention network for financial forecasting. In: The web conference (2020).
16. Wang Z, Gao X, Huang S, Sun Q, Chen Z, Tang R, et al. Measuring systemic risk contribution of global stock markets: a dynamic tail risk network approach. Int Rev Financial Anal (2022) 84:102361. doi:10.1016/j.irfa.2022.102361
17. Wang Z, Ma N, Xue L, Song Y, Wang Z, Tang R, et al. Target recovery of the economic system based on the target reinforcement path method. Chaos: An Interdiscip J Nonlinear Sci (2022) 32:093118. doi:10.1063/5.0097175
18. Kirisci M, Yolcu OC. A new cnn-based model for financial time series: taiex and ftse stocks forecasting. Neural Processing Lett (2022) 54:3357–74. doi:10.1007/s11063-022-10767-z
19. Ge W, Lalbakhsh P, Isai L, Lenskiy A, Suominen H. Neural network–based financial volatility forecasting: a systematic review. ACM Computing Surv (2022) 55:1–30. doi:10.1145/3483596
20. Bukhari AH, Raja M, Sulaiman M, Islam S, Shoaib M, Kumam P. Fractional neuro-sequential arfima-lstm for financial market forecasting. IEEE Access (2020) 8:71326–38. doi:10.1109/access.2020.2985763
21. Ielasi F, Capelli P, Russo A. Forecasting volatility by integrating financial risk with environmental, social, and governance risk. Corporate Social Responsibility Environ Management (2021) 28:1483–95. doi:10.1002/csr.2180
22. He K, Yang Q, Ji L, Pan J, Zou Y. Financial time series forecasting with the deep learning ensemble model. Mathematics (2023) 11:1054.doi:10.3390/math11041054
23. Wang Z, Liu S, Han C, Huang S, Gao X, Tang R, et al. Motif transition intensity: a novel network-based early warning indicator for financial crises. Front Phys (2022) 9:800860. doi:10.3389/fphy.2021.800860
24. Yousfi M, Bouzgarrou H. On the linkage of oil prices and oil uncertainty with us equities: a combination analysis based on the wavelet approach and quantile-on-quantile regression. Front Phys (2024) 12:1357366. doi:10.3389/fphy.2024.1357366
25. Sawhney R, Mathur P, Mangal A, Khanna P, Shah R, Zimmermann R. Multimodal multi-task financial risk forecasting. ACM Multimedia (2020) 456–65. doi:10.1145/3394171.3413752
26. Rumyk I, Laptev S, Seheda S, Akimova L, Akimov O, Karpa M. Financial support and forecasting of food production using economic description modeling methods. In: Financial and credit activity problems of theory and practice (2021).
27. Yu H, Ming L, Sumei R, Zhao S. A hybrid model for financial time series forecasting—integration of ewt, arima with the improved abc optimized elm. IEEE Access (2020) 8:84501–18. doi:10.1109/access.2020.2987547
28. Muskaan , Sarangi P. A literature review on machine learning applications in financial forecasting. J Technology Management Growing Economies (2020) 11:23–7. doi:10.15415/jtmge.2020.111004
29. Sako K, Mpinda BN, Rodrigues P. Neural networks for financial time series forecasting. Entropy (2022) 24:657. doi:10.3390/e24050657
30. Ullah A, Yao H, Waseem , Saboor A, Awwad FA, Ismail EA. A qualitative analysis of the artificial neural network model and numerical solution for the nanofluid flow through an exponentially stretched surface. Front Phys (2024) 12:1408933. doi:10.3389/fphy.2024.1408933
31. Shi K, Gong J. The influence of the spillover between futures and spot markets on hedging policy: evidence from Chinese stock markets. Front Phys (2023) 11:1293182. doi:10.3389/fphy.2023.1293182
32. Gkillas K, Gupta R, Pierdzioch C. Forecasting realized oil-price volatility: the role of financial stress and asymmetric loss. J Int Money Finance (2020) 104:102137. doi:10.1016/j.jimonfin.2020.102137
33. Foroni C, Marcellino M, Stevanovic D. Forecasting the covid-19 recession and recovery: lessons from the financial crisis. Int J Forecasting (2020) 38:596–612. doi:10.1016/j.ijforecast.2020.12.005
34. Sun H, Yu B. Forecasting financial returns volatility: a garch-svr model. Comput Econ (2020) 55:451–71. doi:10.1007/s10614-019-09896-w
35. Jain D, Jain A, Pandey A, Kumar J. Bitcoin financial forecasting. IOP Conf Ser Mater Sci Eng (2021) 1049:012003. doi:10.1088/1757-899x/1049/1/012003
36. Cheng D, Yang F, Xiang S, Liu J. Financial time series forecasting with multi-modality graph neural network. Pattern Recognition (2022) 121:108218. doi:10.1016/j.patcog.2021.108218
37. Donath L, Mircea G, Neamţu M, Sîrghi N. A mathematical approach to network contagion regarding greening banks’ policies. Econ research-Ekonomska istraživanja (2023) 36. doi:10.1080/1331677x.2023.2180057
38. Elnagar MA, Abdel Aty J, Elhady AM, Shohieb SM. Modeling a sustainable decision support system for banking environments using rough sets: a case study of the egyptian arab land bank. Int J Financial Stud (2025) 13:27. doi:10.3390/ijfs13010027
39. Negi P, Jaiswal A. Sustainable bonds as a sustainable financial instrument: thematic insights and future prospects. Qual Res Financial Markets (2024). doi:10.1108/qrfm-01-2024-0018
40. Del Vitto A, Marazzina D, Stocco D. Esg ratings explainability through machine learning techniques. Ann Operations Res (2023) 1–30. doi:10.1007/s10479-023-05514-z
41. Halkos G, Nomikos S, Tsilika K. Evidence for novel structures relating csr reporting and economic welfare: environmental sustainability—a continent-level analysis. Comput Econ (2021) 59:415–44. doi:10.1007/s10614-020-10091-5
42. Bokun KO, Jackson LE, Kliesen KL, Owyang MT. Fred-sd: a real-time database for state-level data with forecasting applications. Int J Forecasting (2023) 39:279–97. doi:10.1016/j.ijforecast.2021.11.008
43. Wang W-J, Tang Y, Xiong J, Zhang Y-C. Stock market index prediction based on reservoir computing models. Expert Syst Appl (2021) 178:115022. doi:10.1016/j.eswa.2021.115022
44. Zha W, Liu Y, Wan Y, Luo R, Li D, Yang S, et al. Forecasting monthly gas field production based on the cnn-lstm model. Energy (2022) 260:124889. doi:10.1016/j.energy.2022.124889
45. Zhao Z, Yun S, Jia L, Guo J, Meng Y, He N, et al. Hybrid vmd-cnn-gru-based model for short-term forecasting of wind power considering spatio-temporal features. Eng Appl Artif Intelligence (2023) 121:105982. doi:10.1016/j.engappai.2023.105982
46. Han K, Wang Y, Chen H, Chen X, Guo J, Liu Z, et al. A survey on vision transformer. IEEE Trans pattern Anal machine intelligence (2022) 45:87–110. doi:10.1109/tpami.2022.3152247
47. Niazkar M, Menapace A, Brentan B, Piraei R, Jimenez D, Dhawan P, et al. Applications of xgboost in water resources engineering: a systematic literature review (dec 2018–may 2023). Environ Model and Softw (2024) 174:105971. doi:10.1016/j.envsoft.2024.105971
48. Yan J, Xu Y, Cheng Q, Jiang S, Wang Q, Xiao Y, et al. Lightgbm: accelerated genomically designed crop breeding through ensemble learning. Genome Biol (2021) 22:271–24. doi:10.1186/s13059-021-02492-y
Keywords: sustainable finance, portfolio optimization, debt structure, ESG factors, mathematical modeling
Citation: Zhang G (2025) Optimization of bank investment portfolio and debt structure under sustainable finance policies based on mathematical modeling analysis. Front. Phys. 13:1585105. doi: 10.3389/fphy.2025.1585105
Received: 28 February 2025; Accepted: 24 March 2025;
Published: 28 April 2025.
Edited by:
Ze Wang, Capital Normal University, ChinaReviewed by:
Anand Jaiswal, TERI School of Advanced Studies (TERI SAS), IndiaLingxiao Zhang, Wuhan University, China
Copyright © 2025 Zhang. This is an open-access article distributed under the terms of the Creative Commons Attribution License (CC BY). The use, distribution or reproduction in other forums is permitted, provided the original author(s) and the copyright owner(s) are credited and that the original publication in this journal is cited, in accordance with accepted academic practice. No use, distribution or reproduction is permitted which does not comply with these terms.
*Correspondence: Guodong Zhang, MjAyMjMwMTA1MTI5NkB3aHUuZWR1LmNu