 Chao Liu1
 Chunxiang Liu
- 1Business College, Jiangsu Vocational College of Electronics and Information, Huaian, Jiangsu, China
- 2School of Marxism, Jiangsu Vocational College of Electronics and Information, Huaian, Jiangsu, China
- 3School of Computer Science and Communication, Jiangsu Vocational College of Electronics and Information, Huaian, Jiangsu, China
Chain information management system is widely used, providing convenience for the operation and management of enterprises. However, the problem of abnormal network traffic becomes increasingly prominent currently. Therefore, this paper proposes a convolutional neural network based on attention mechanism and autoencoder improvement, namely, CBAM-AE-CRF. CBAM AE-CRF integrates the convolutional block attention module (CBAM) into convolutional neural network to enhance the model’s ability to learn anomalous features in network traffic. CBAM improves the detection accuracy of abnormal traffic in chain information management system by adaptively adjusting channel attention. At the same time, the Autoencoder module (AE) is also introduced into the model to automatically extract and reconstruct anomalous features from complex network traffic data. Finally, the conditional random field (CRF) determines the optimal label sequence based on the conditional probability distribution and applies the Viterbi algorithm to complete the sequence labeling of network traffic in chain information management system. Through extensive experimental verification, CBAM-AE-CRF can comprehensively understand the semantics of network traffic, accurately identify anomalies in network traffic of chain information management system, provide strong support for network traffic management.
1 Introduction
The chain information management system is becoming increasingly complex and network security issues are becoming more prominent [1]. Chain enterprises achieve centralized management and efficient scheduling of resources such as goods, funds and personnel by building a unified information management system. These systems not only improve the operational efficiency of enterprises, but also enhance their market competitiveness and brand influence.
Chain information management system typically includes multiple modules such as supply chain management. They are interconnected through complex network structures and together form the core of enterprise operations. With the expansion of enterprise scale and business scope, the traffic data in the system network also shows an explosive growth trend. These traffic data not only contain normal business interaction information, but may also hide various abnormal traffic, such as network attacks, data leaks, system failures, etc. It poses a serious threat to the information security of enterprises [2, 3]. The information management system of chain enterprises usually consists of multiple distributed nodes, including headquarters data centers, regional distribution centers and various stores. This complex network architecture brings many network security challenges to enterprises. Firstly, the expansion of network boundaries and the increase in attack surface make the system more vulnerable to external attacks [4]. Secondly, frequent data transmission between nodes increases the risk of data leakage. Furthermore, chain enterprises often involve multiple business system, such as POS system, inventory management system, customer relationship management system, etc. The data exchange between the system also brings potential security risks.
In recent years, there have been frequent incidents of cyber-attacks targeting chain enterprises. For example, in 2019, an international chain retail enterprise suffered a large-scale DDoS attack. It caused stores worldwide to be unable to operate normally, resulting in billions of dollars in economic losses. In 2020, customer data of a well-known chain catering enterprise was stolen by hackers, involving personal information and payment data of millions of users, seriously damaging the reputation of the enterprise. These cases highlight the severe network security situation faced by chain information management system.
Abnormal network traffic, as one of the main security threats, may lead to serious consequences such as system paralysis and data leakage, causing huge economic losses and reputation damage to enterprises. Traditional methods for detecting abnormal traffic are mainly based on rule matching and statistical analysis. When facing increasingly complex and covert network attacks, they often exhibit problems such as low detection efficiency and high false alarm rates [5]. Rule based methods identify abnormal traffic through pre-defined feature patterns, such as Snort, Suricata and other intrusion detection system. This method has good detection performance for known attack types, but it is difficult to deal with new and variant attacks. Based on statistical methods, abnormal behavior deviating from normal patterns is identified by analyzing the statistical characteristics of network traffic, such as traffic size, packet length distribution, protocol type, etc. This type of method can detect unknown attacks, but it is susceptible to changes in the network environment and has a high false positive rate.
With the increasing complexity and concealment of network attack methods, the limitations of traditional detection methods become more apparent. Firstly, they are difficult to effectively handle high-dimensional and nonlinear network traffic data. Secondly, when faced with massive amounts of data, detection efficiency and real-time performance often fail to meet practical needs. Finally, these methods typically require a significant amount of manual intervention and rule updates, resulting in high maintenance costs. Therefore, exploring new methods for detecting abnormal traffic and improving the efficiency of detection has become an important research direction in the current field of network security.
In recent years, deep learning technology provided new ideas for solving abnormal traffic detection problems in complex network environments [6, 7]. Convolutional neural networks (CNNs) have the characteristics of weight sharing and hierarchical feature extraction, making them very suitable for processing network traffic data with spatiotemporal correlations. CNNs as one of the important models in deep learning, are particularly suitable for processing data with grid structures [8]. In network traffic analysis, traffic data can be converted into a format suitable for CNN processing, such as arranging traffic features into a two-dimensional matrix. CNN automatically extracts local features of traffic through convolutional layers, reduces data dimensionality through pooling layers and finally performs classification through fully connected layers. This method can effectively capture spatiotemporal correlations in network traffic, improving the efficiency and accuracy of feature extraction. On the one hand, CNNs can automatically extract representative features from raw network traffic data without the need for manually designing feature extractors. This not only improves the accuracy of detection, but also reduces reliance on expert experience. On the other hand, CNNs have strong nonlinear fitting capabilities and can handle high-dimensional, nonlinear and large-scale network traffic data. In addition, CNNs also have adaptability, which can automatically adjust model parameters as network traffic changes, improving the robustness of detection.
The detection of abnormal network traffic in chain information management system still faces many challenges. On the one hand, with the complexity of network attack methods, the characteristics and patterns of abnormal traffic are also constantly changing. This requires the detection model to be constantly updated and optimized to adapt to new attack methods. On the other hand, with the expansion of enterprise scale and business scope, the traffic data in the system network also shows an explosive growth trend. This requires the detection model to have efficient processing capabilities and scalability to meet the needs of practical applications. Most existing research focuses on anomaly detection in general network environments, with relatively less research on specific industries or application scenarios. The information management system of chain enterprises has unique network architecture and business characteristics, requiring specialized anomaly detection methods. In addition, existing research still has shortcomings in the interpretability and real-time performance of the model, which limits its promotion in practical applications. Our main contributions are summarized as follows.
(1) This paper proposes CBAM-AE-CRF, which uses a spatiotemporal fusion to detect abnormal traffic in chain information management system network. By introducing an attention mechanism, it focuses on learning and paying attention to key features in the input traffic data.
(2) In CBAM-AE-CRF, the AE maps the input traffic data to latent space through the encoder, then reconstructs the original traffic data through the decoder to extract the main features and patterns in the input traffic data, thereby capturing potential abnormal behaviors in network traffic.
(3) Multiple experiments are conducted on different datasets to validate the effectiveness of CBAM-AE-CRF by comparing advanced baselines and extensive experiments.
The remaining part of this paper consists of four parts. Section Ⅱ is related literature related to the work. Section Ⅲ provides a description to the model research of abnormal traffic detection driven by deep learning in chain information management system network. Section Ⅳ analyzes the comparative effect and performance of CBAM-AE-CRF through experiments. Finally, Section Ⅴ is the summary.
2 Literature review
With the development of artificial intelligence technology and mathematical theory, deep learning based temporal prediction methods have gradually become mainstream in recent years. By integrating multiple hidden layers and multi-level extraction of temporal features of data, nonlinear relationships were captured in the time dimension and accurate prediction models were established. Relevant research has been widely applied to time series prediction and anomaly detection in the fields of transportation and the Internet [9, 10]. CNNs are a nonlinear deep learning model implemented through multi-layer convolutional computation, which captured the intrinsic correlation features of input data by performing region convolution on it. With the increase of convolution layers, complex temporal correlations could be gradually mined from simple temporal data, achieving sequence feature learning from low to high levels. Therefore, Zheng et al. [11] proposed Multi Channels Deep Convolutional Neural Networks (MC-DCNN), which extracted temporal features of sequences through two-dimensional convolution. It utilized the multi-layer perceptron integrated in MC-DCNN as an evaluation mechanism for system state, searching for abnormal samples in multivariate time series. The experiment proved that the method had good generalization ability and could be applied to various prediction scenarios, revealing the potential application of deep learning algorithms in WSN traffic anomaly detection. However, due to the fact that network traffic data was usually a one-dimensional time series with simpler features, the practical application scope of MC-DCNN was greatly limited. To extract more comprehensive temporal features from a single variable sequence as much as possible, Deng et al. [12] proposed a multi time scale convolutional neural network prediction method. By adding a downsampling module to CNN, the prediction model could gain a more detailed understanding of the temporal correlation of traffic at different resolutions. The experiment had demonstrated that integrating a multi-scale sampling strategy into a neural network model could enhance the model’s understanding of sequence time dependencies and effectively improve the accuracy of time series prediction. However, he pointed out that CNN required a high sample size for the training set and the prediction results of untrained models will show significant performance degradation. To alleviate this drawback of CNN, Qiu et al. [13] utilized transfer learning strategy and integrated MU-Net module into U-Net convolutional network, hoping to extract common features from different network temporal problems. However, he ignored the heterogeneity of different temporal problems in the time-frequency domain, the prediction accuracy of this method was not ideal. Su et al. [14] proposed a multivariate RNN anomaly detection algorithm, which demonstrated good detection accuracy on three aerospace server datasets. He pointed out that RNN might encounter the problem of “gradient vanishing” or “gradient explosion” when building models for long-term time series, the iterative gradient of the model will exponentially decay or grow during backpropagation. Therefore, RNNs found it difficult to retain earlier information in the sequence and could not effectively establish accurate long-term prediction models based on historical information.
Variational Auto Encoder (VAE) is a more stable deep learning data compensation algorithm with a more rigorous theoretical framework [15–17]. VAE was originally a feature extraction algorithm derived from Auto Encoder. Auto Encoder fitted the encoder and decoder through neural networks and generated new virtual samples through the decoder. Based on the above principles, Osada et al. [18] first proposed a semi supervised VAE detection model, which simply enhanced attack features by expanding the sample size, laying the foundation for the application of VAE models in the field of network intrusion detection. Wan et al. [19] believed that compared to traditional data compensation algorithms, VAE exhibited better minority class feature enhancement performance. However, Abdulhammed et al. [20] concluded based on extensive experiments that the virtual samples generated by VAE had limited improvement in network intrusion detection performance, further research was needed to enhance attack features using VAE. Due to VAE being an unsupervised learning method, the types of virtual samples generated could not be controlled, which did not fundamentally solve the problem of imbalanced training samples. Therefore, Khanam et al. [21] used the class focusing loss function to optimize the training process of traditional VAE, generating more realistic and higher quality intrusion detection samples. The effectiveness of this method had been validated on the NSL-KDD dataset by combining it with Deep Neural Network (DNN). Vu et al. [22] proposed a multi distribution VAE intrusion detection method, attempting to integrate the label information of data samples into the loss function of VAE, controlled the generation of attack class samples. It improved the accuracy of intrusion detection to a certain extent. This further proved that by controlling the preference of VAE sample generation, attack sample enhancement could be achieved, improving intrusion detection accuracy.
3 Abnormal traffic detection based on deep learning for chain information management system network
3.1 Overview of CBAM-AE-CRF
The improved model architecture mainly consists of three parts, namely, the CNN integrated with CBAM, AE and CRF. In the CNN, CBAM is mainly used in the feature extraction stage, enhancing useful information in the feature map and suppressing irrelevant information through two sub modules of channel attention and spatial attention, thereby improving the network’s attention to abnormal traffic features. In optimizing the feature learning process, CBAM is introduced into each convolutional layer of CNN to help the network learn and extract key features in the chain information management system network more accurately. By introducing CBAM, it is not just about simply increasing the depth or width of the network, but also by adaptively enhancing and suppressing certain parts of the feature map to improve the overall quality of feature extraction.
The AE is mainly used in the anomaly detection stage. Through a semi supervised approach, it uses normal network traffic data from the chain information management system for training, effectively reconstructing the normal network traffic characteristics of the chain information management system. After training, the difference between the input data and its reconstructed data can be calculated to reconstruct the error and evaluate whether the data points are abnormal. Data points with larger reconstruction errors are considered to be abnormal data. In the anomaly detection stage, the autoencoder provides core algorithm support, which can effectively identify abnormal patterns from the learned normal patterns and perform accurate anomaly traffic detection.
In terms of optimizing network performance, CBAM and AE work together in the entire anomaly traffic detection model, CBAM improves the quality of input traffic features by enhancing feature expression ability, thereby providing more effective input traffic data for subsequent autoencoders. The autoencoder utilizes these optimized features for anomaly detection, achieving efficient anomaly traffic detection functionality. The introduction of CBAM optimizes the feature extraction stage, enabling the network to better capture important features in network traffic. AE uses these traffic features for anomaly detection, enhancing the accuracy and stability of CBAM-AE-CRF in detecting abnormal data.
CRF plays an important role in the sequence labeling task of abnormal traffic in chain information management system network. It predicts the most likely label sequence for a given input sequence based on conditional probability distribution [23]. Specifically, the features obtained after the previous steps are first calculated to obtain scores for each label sequence, which reflect the degree of matching between different label sequences and the input data. To convert these scores into probabilities, they need to be input into a softmax function for normalization. Finally, to determine the optimal label sequence, the Viterbi algorithm is applied. The Viterbi algorithm determines the most probable label sequence by searching for the optimal path among all possible label sequence paths. Figure 1 shows the overall structure of CBAM-AE-CRF in the abnormal traffic detection task for chain information management system network.

Figure 1. Abnormal traffic detection based on CBAM-AE-CRF.
During the preprocessing stage of data, CBAM-AE-CRF uses traffic packets from the original chain information management system network as analysis data for abnormal detection, which can preserve all feature information of each traffic packet to the greatest extent possible. Through analysis using network packet analysis software, it is found that the original traffic packet is a series of hexadecimal encoded data. The core of data preprocessing is the segmentation and extraction of traffic data streams. In the segmentation process of traffic data streams, the packet header and packet content form the original PCAP traffic file. If the number of data packets is
Where
In this, the quintuple properties of traffic packets are the same, so there is
In the network feature extraction process of the chain information management system, the processed 1,600 dimensional one-dimensional vector values are mapped to the range of 0–255. Because grayscale images usually use integers between 0 and 255 to represent pixel intensity, where 0 represents black and 255 represents white. Finally, the Matplotlib library in Python is used to display grayscale images rearranged into 40 rows and 40 columns, where each pixel value in the grayscale image represents a numerical expression of a specific position or data feature. The first convolutional layer uses a 5 × 5 convolution kernel for feature extraction, with a stride of one and adopts the ‘SAME’ zero padding mode to maintain the spatial dimension of the feature map. This layer is followed by a 2 × 2 max pooling layer, which reduces the size of the feature map by half through local max downsampling. The second convolutional layer is configured with 64 3 × 3 convolution kernels, maintaining stride = 1 and ‘SAME’ padding. And the ReLU activation function is used to introduce nonlinear transformation with ɑ = 0.01, followed by 2 × 2 max pooling. After two downsampling steps, the feature map dimensions are normalized to 8 × 8 × 64, the data is converted into 4,096 dimensional feature vectors and input into the fully connected layer. To prevent overfitting, a dropout layer with a rate of 0.5 is set before the fully connected layer. Finally, the entity label classification results of the data are obtained through the CRF layer. After the model training is completed, the Viterbi algorithm is used to find the optimal label sequence.
3.2 CBAM
CBAM is a module that combines convolutional blocks and attention mechanisms in CNN [24]. It is mainly used to enhance the representation ability of CNN on input network traffic features, especially when processing data such as images and videos, which can help the network focus on important features. CBAM combines two key components, channel attention module [25] and spatial attention module [26], to enhance the network’s ability. In the channel attention module, the importance weight of each channel is mainly obtained through global average pooling, then channel attention weights are generated through fully connected layers and activation functions. This can make the network pay more attention to important features in the channel dimension. In the spatial attention module, the importance weights of spatial positions are obtained by applying max pooling and average pooling on each channel, then combining these two pooling results to generate spatial attention weights. This can make the network pay more attention to important regions in the spatial dimension.
In CBAM, the channel attention mechanism dynamically adjusts the information response of each channel in the feature map by learning the importance weight of each channel. This attention mechanism enables modules to focus on channels that are useful for specific tasks and suppress channels that are irrelevant to the task. The output of the channel attention mechanism is a weighted channel feature map to enhance the representation of important features. The spatial attention mechanism adjusts the information response of different positions in the feature map by learning the weights of each spatial position. This mechanism helps the module focus its attention on important areas in the image or feature map, improving the model’s sensitivity to spatially significant features. The output of spatial attention mechanism is a weighted spatial feature map that highlights important spatial position information. The calculation method is shown in Equations 3, 4.
Where
In the channel attention module, the feature map is first globally averaged to obtain a feature map of size 1 × 1×
Where
In the spatial attention module, the first step is to perform global average pooling on the feature map in the height and width dimensions, with the aim of extracting global spatial information. Then, the feature map is subjected to global maximum pooling in the height and width dimensions, with the aim of extracting salient features from the global spatial information. Then, the obtained spatial average pooling and spatial maximum pooling are input into two independent MLPs for processing. Each MLP learns to nonlinearly map the globally pooled features to obtain appropriate spatial attention weights. Finally, the outputs of the two MLPs are weighted and fused, and the Sigmoid activation function is applied to ensure that the generated spatial attention values are within the range of [0,1]. The calculation for the output feature map of the spatial attention module is shown in Equation 6.
Where
3.3 AE
AE is a classic unsupervised learning model that aims to learn the intrinsic structure and features of data through compressed representations of its own data. It consists of two main components, namely, encoder and decoder. The encoder converts input data into a low dimensional dense representation, which is called encoding. The decoder attempts to reconstruct the original data from the encoding, making the reconstructed data as close as possible to the input data. The training objective of autoencoders is usually to minimize reconstruction errors, which is achieved through optimization algorithms such as gradient descent. This model has wide applications in data denoising, feature learning and generative models, such as using VAEs for generative tasks, or as a pre trained model to improve the performance of supervised learning tasks [27]. The features of input data can be compressed through encoder decoding, the calculation of feature vectors is shown in Equation 7.
Where,
After obtaining the compressed characteristic
Where
Finally, the difference between generated flow data
Where
4 Experiment and result analysis
4.1 Binary classification network traffic experiment
The system version of the experimental environment in this paper is Linux 16.04, the processor is Intel i7-7700k, the frequency is 4.2 GHz and the memory is 256 GB. The graphics card is a single core 8 GB NVIDIA RTX3060Ti with 3584 CUDA cores. Python three is the main programming language, jQuery is a JavaScript tool library, Echart is used for data visualization and Pytorch framework is used. We evaluate the effectiveness and reliability of our proposed model on three publicly available network datasets, primarily from the Cloud Vulnerability Database [28], Freebuf website [29] and CICIDS-2017 [30]. CICIDS-2017 is a dataset widely used in network security research, particularly in the fields of intrusion detection system and network traffic analysis. The dataset collects rich network traffic samples, including various types of attacks such as denial of service attacks (DoS), distributed denial of service attacks (DDoS), scanning activities, botnet attacks, etc. It also includes normal network traffic such as HTTP requests, FTP transfers, etc. The structured data of the Cloud Vulnerability Database contains thousands of real vulnerability cases, covering detailed technical descriptions of common web vulnerabilities such as SQL injection, XSS, CSRF, affected system versions and repair solutions. These standardized features provide clear supervised learning signals for convolutional neural networks, especially for feature extraction of known attack patterns, which plays a key role. In contrast, the FreeBuf website dataset, as a continuously updated network security community resource, is valuable in providing unstructured real-world analysis reports and emerging threat intelligence. It includes APT attack cases, 0 day vulnerability analysis and accompanying traffic capture data such as HTTP request logs and malicious IP lists. Based on the network characteristics of chain information management system, they can effectively demonstrate the detection performance of models in actual deployment environment.
The experiment uses accuracy, precision, recall, and F1 score as key evaluation indicators for quantifying model performance. The specific calculation is shown in the Equations 10–13.
Accuracy provides an intuitive evaluation of the overall performance of the model, but may be misleading when there is class imbalance. Such as when normal traffic significantly exceeds abnormal traffic, high accuracy may only reflect the recognition ability of the majority of classes. Precision and recall respectively measure the reliability and coverage ability of the model in predicting abnormal traffic, there is an inherent trade-off between the two. The focus needs to be adjusted according to actual application scenarios. F1, as a harmonic mean of precision and recall, can comprehensively evaluate the stability of the model in identifying anomalous classes. The joint use of these indicators not only meets the need for comprehensive evaluation of model performance, but also alleviates the limitations of a single indicator through multi angle cross validation. Especially it is suitable for the common problems of imbalanced category distribution and complex abnormal patterns in network traffic data of chain information management system. We select multiple baselines for comparative experiments on network data security threat identification, including LSTM [31], LSTM-CRF [32], BiLSTM-CRF [33], CBAM [34], CNN-GRU [35], CNN BiLSTM-CRF [36] and CBAM-AE-CRF. The selection of this baseline effectively validates the effectiveness of the improved method proposed in this paper, while also systematically evaluating the adaptability of different feature extractions in the context of chain network scenarios. For example, CNN-GRU can extract spatial local features of traffic data through CNN, then capture temporal dependencies through GRU. This architecture has superiority. Secondly, CNN-BiLSTM-CRF further introduces BiLSTM and CRF on the basis of CNN, which can not only model bidirectional temporal features, but also learn the transition rules of traffic states through the CRF layer. This is important for the continuity detection of multi hop network traffic in chain information management system. Table 1 is a comparison table of binary classification.
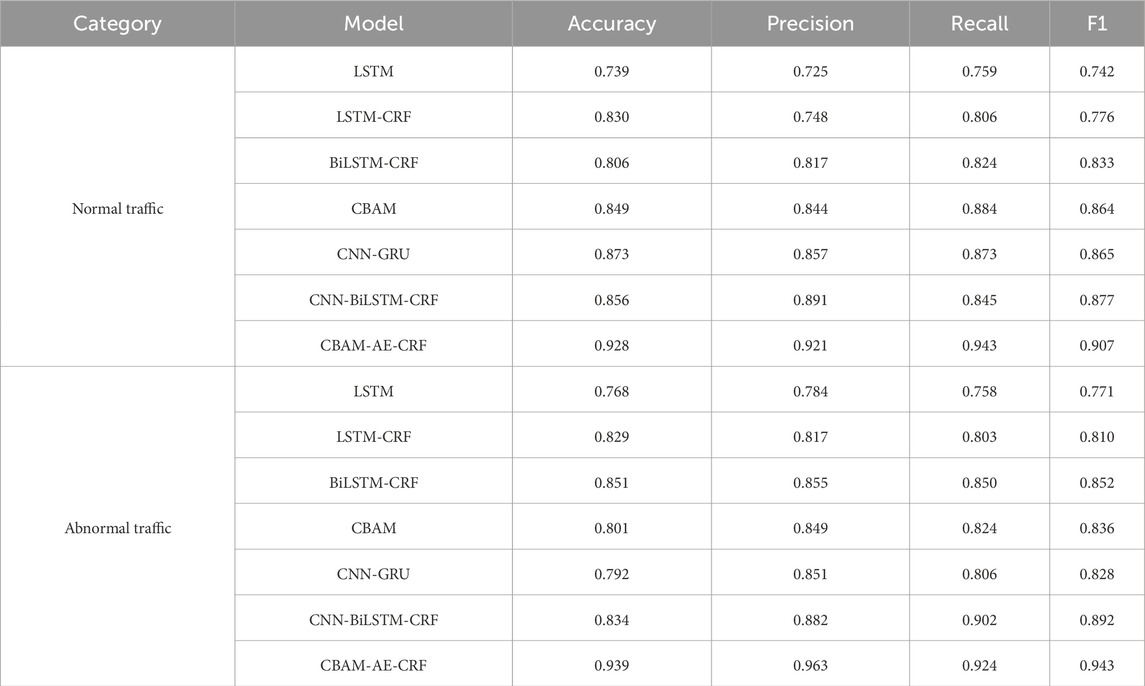
Table 1. Test results of binary classification network traffic detection.
According to the experimental results shown in Table 1, CBAM-AE-CRF performs the best in normal traffic detection tasks, with an accuracy of 0.928 and F1 of 0.907, significantly better than other models. This indicates that the model has high classification ability and stability when dealing with normal traffic. The introduction of CBAM effectively improves the model’s ability to extract key features, the combination of AE and CRF further enhances the model’s ability to capture contextual information. CNN-GRU and CNN-BiLSTM-CRF also perform well, with F1 of 0.865 and 0.877, respectively, indicating that the combination of CNN with GRU or BiLSTM can effectively capture the temporal and spatial characteristics of normal traffic. The performance of LSTM and LSTM-CRF is relatively weak, indicating that a single LSTM structure has certain limitations in processing complex traffic data. In the task of detecting abnormal traffic, CBAM-AE-CRF also performs the best, indicating that the model has extremely high sensitivity and accuracy in detecting abnormal traffic. It can effectively identify abnormal behavior in the network. CNN-BiLSTM-CRF also performs well in abnormal traffic detection, with F1 of 0.892, indicating that the combination of CNN and BiLSTM can effectively capture the complex patterns of abnormal traffic. The performance of CBAM in abnormal traffic detection is slightly lower than its performance in normal traffic detection, with F1 score of 0.836. This may be due to the diversity and complexity of abnormal traffic, which makes it difficult for the model to accurately classify in certain situations. In general, the performance of a single model in complex traffic detection tasks is relatively weak, indicating that a single structure has certain limitations. Figures 2, 3 are visual representations of the experimental results in Table 1, respectively.
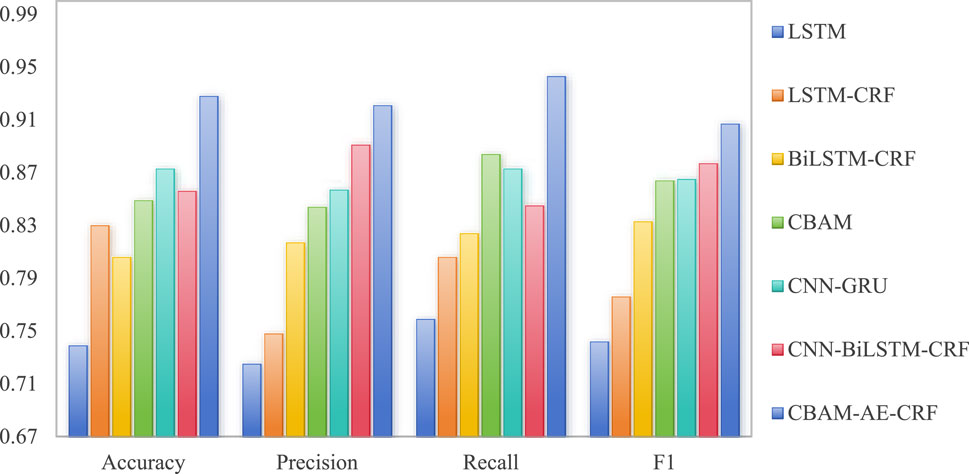
Figure 2. Comparison results based on normal traffic in binary classification experiment.
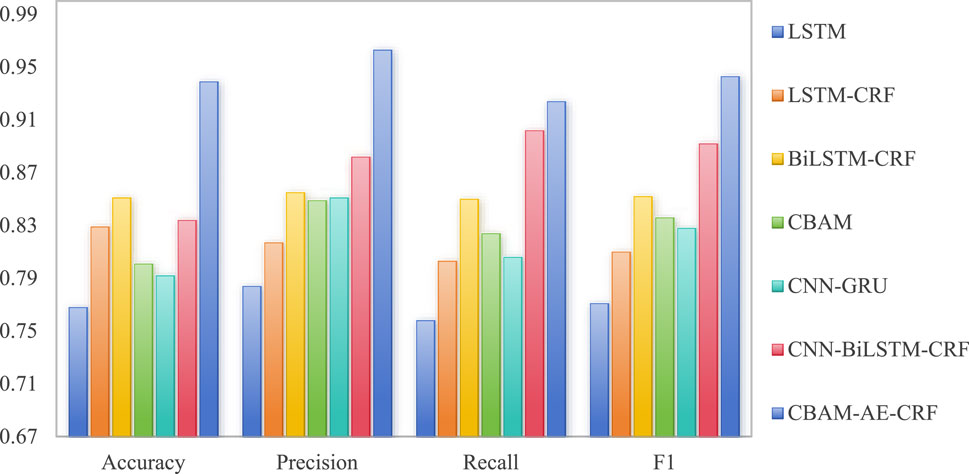
Figure 3. Comparison results based on abnormal traffic in binary classification experiment.
As shown in Figure 2, the accuracy of CBAM-AE-CRF reaches 0.928, which is about 6.3% higher than the second best performing CNN-GRU and 25.6% higher than a single LSTM, indicating its significant advantage in overall classification ability. In terms of precision, the precision of CBAM-AE-CRF is 0.921, which is about 3.4% higher than CNN-BiLSTM-CRF and 23.1% higher than LSTM-CRF, indicating its excellent performance in reducing false alarm rates. This indicates that the combination of CNN, AE, and CRF can effectively improve the accuracy of abnormal traffic detection in chain information management system network.
As shown in Figure 3, in terms of recall rate, CBAM-AE-CRF has a recall rate of 0.924, which is about 2.4% higher than the CNN-BiLSTM-CRF and 21.9% higher than the LSTM. This indicates that it can more comprehensively capture abnormal traffic samples, reduce the possibility of missed reports and provide strong protection for traffic security for chain information management system network.
4.2 Multi classification network traffic experiment
In addition, the multi classification experiment uses the Macro-F1 as a key evaluation indicator for quantifying the model’s effectiveness, as shown in Equation 14 for specific calculation. In the dataset CICIDS-2017, there is one type of normal traffic and ten types of abnormal traffic. For the classification of abnormal traffic, it is obviously a multi classification problem. Therefore, the Macro-F1 evaluation metric is introduced, which calculates the F1 of each category and then adds up the F1 values of all categories to take the average.
Where
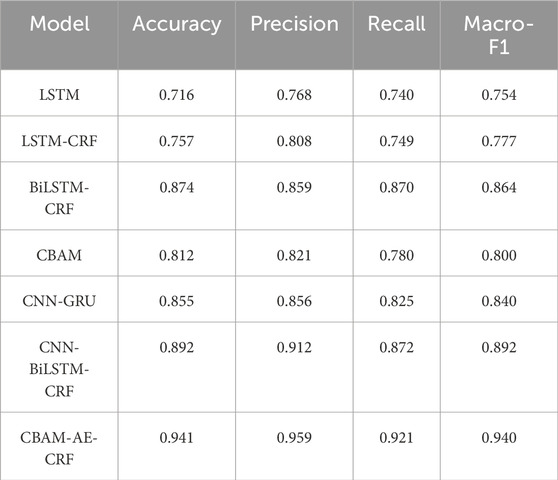
Table 2. Test results of Multi classification network traffic detection.
According to the experimental results shown in Table 2, there are significant differences in the performance of each model, with CBAM-AE-CRF performing the most outstandingly, while LSTM is relatively weaker. The accuracy of LSTM is 0.716, while Macro-F1 is 0.754, which is at a relatively low level among all models. This indicates that simple LSTM has certain limitations in processing complex network traffic data and may be difficult to fully capture the spatiotemporal dependencies in traffic characteristics. In contrast, LSTM-CRF and BiLSTM-CRF significantly improve performance by introducing CRF and BiLSTM structure. CBAM introduces attention mechanism, with an accuracy of 0.812 and Macro-F1 of 0.800, outperforming basic LSTM but not as good as BiLSTM-CRF. This indicates that attention mechanism can indeed improve model performance, but may need to be combined with other structures to have a greater impact. CNN-BiLSTM-CRF integrates CNN, BiLSTM and CRF, achieving an accuracy of 0.892, while Macro-F1 achieves 0.892, demonstrating excellent performance. The most outstanding performance is CBAM-AE-CRF, far exceeding other models, indicating that it can more effectively capture key features and complex patterns in network traffic. Figure 4 is a visual representation of the experimental results in Table 2.
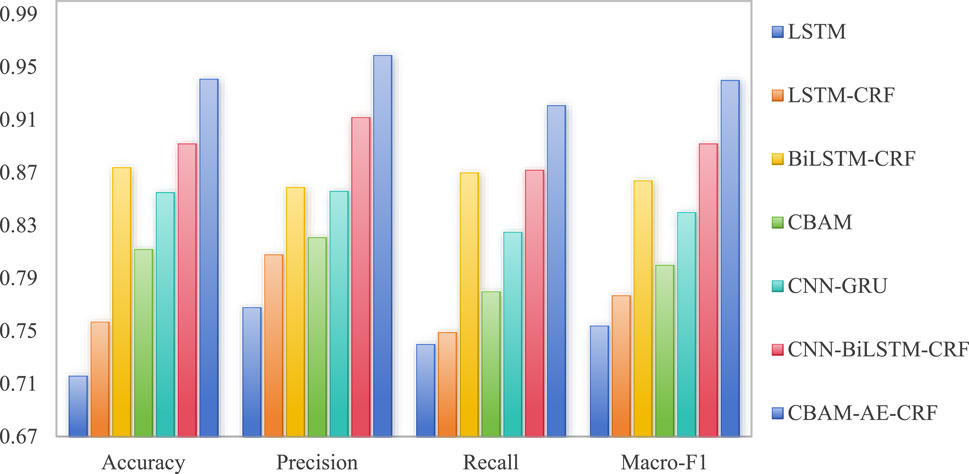
Figure 4. Comparison of multi classification network traffic detection.
In Figure 4, CBAM-AE-CRF performs significantly better than other models in multi classification network traffic detection task. On Macro-F1, CBAM-AE-CRF leads with a score of 0.94, which is 5.4% higher than CNN-BiLSTM-CRF and 24.7% higher than LSTM. These data fully demonstrate the significant advantages of CBAM-AE-CRF in comprehensive performance, providing strong support for network security protection for chain information management system. In addition, we use AUC as a key indicator to evaluate the performance of models, which is specifically defined by the ROC curve. The closer the AUC value is to 1.0, the better the performance of abnormal traffic detection for chain information management system network and the more accurate it can identify potential anomalies. The experimental comparison results of CNN-BiLSTM-CRF and CBAM-AE-CRF in multi classification experiment are shown in Figure 5.
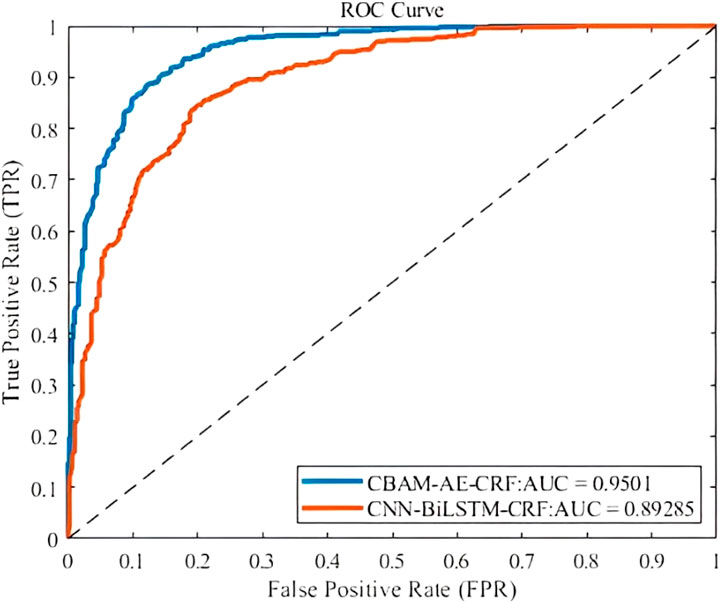
Figure 5. Comparison of AUC.
From Figure 5, it can be seen that CBAM-AE-CRF occupies a higher position on ROC curve, especially in the region with lower FPR. It indicates that CBAM-AE-CRF can more accurately detect true network abnormal traffic, demonstrating better detection performance for chain information management system network.
5 Conclusion
This paper improves convolutional neural networks by introducing CBAM and AE, proposes CBAM-AE-CRF to enhance the performance of abnormal traffic detection for chain information management system network. CBAM enhances the network’s ability to learn abnormal features and effectively improves the accuracy of abnormal traffic detection through its unique channel attention and spatial attention mechanism. Meanwhile, AE fully utilizes the feature extraction capability of autoencoders to optimize the network’s learning process for traffic data representation. Finally, sequence annotation is completed through CRF to comprehensively identify abnormal threats in the network traffic for chain information management system. The experimental results display that CBAM-AE-CRF outperforms other methods on datasets, verifying the effectiveness of CBAM and AE in network abnormal traffic detection for chain information management system network. However, in terms of the richness and authenticity of the dataset, more diverse and realistic traffic datasets can be constructed. It covers different network environments, application scenarios and attack types, to better evaluate the performance of CBAM-AE-CRF in complex network environments.
Data availability statement
The original contributions presented in the study are included in the article/supplementary material, further inquiries can be directed to the corresponding author.
Author contributions
CL: Project administration, Conceptualization, Funding acquisition, Methodology, Writing – original draft. CxL: Data curation, Writing – original draft, Investigation, Supervision, Resources. CgL: Formal Analysis, Visualization, Resources, Software, Validation, Writing – review and editing.
Funding
The author(s) declare that financial support was received for the research and/or publication of this article. This work is supported as follows: Research on the Ideological and Political Reform of the Principles of Chain Operation Management Course in Higher Vocational Colleges (xhyblx2023048). Funded by the “Qinglan Project” of Jiangsu Universities. Philosophy and Social Sciences Research Project of Jiangsu Provincial Department of Education: Practical Research on Promoting Rural Revitalization through Industry-University-Research Alliances in the Digital Economy Era Based on Big Data from the Xuyi Lobster Industry (2020SJA1821). Jiangsu Provincial Science and Technology Project: Process Optimization and Development Application of the Shrimp-Rice Industry Chain Management Platform (SZ-HA2019010). Research on the Reform of Ideological and Political Education in the Course of Principles of Chain Operation Management in Higher Vocational Colleges - A Study Project Funded by Jiangsu Vocational Education Research for the 2023-2024 Academic Year, under the auspices of the Jiangsu Province Vocational and Technical Education Association.
Conflict of interest
The authors declare that the research was conducted in the absence of any commercial or financial relationships that could be construed as a potential conflict of interest.
Generative AI statement
The author(s) declare that no Generative AI was used in the creation of this manuscript.
Publisher’s note
All claims expressed in this article are solely those of the authors and do not necessarily represent those of their affiliated organizations, or those of the publisher, the editors and the reviewers. Any product that may be evaluated in this article, or claim that may be made by its manufacturer, is not guaranteed or endorsed by the publisher.
References
1. El Kadiri S, Grabot B, Thoben KD, Hribernik K, Emmanouilidis C, von Cieminski G, et al. Current trends on ICT technologies for enterprise information systems. Comput Industry (2016) 79:14–33. doi:10.1016/j.compind.2015.06.008
2. Miao J, Wang Z, Wang M, Xing L. A secure and efficient lightweight vehicle group authentication protocol in 5G networks. Wireless Commun Mobile Comput (2021) 2021:2023. doi:10.1155/2021/4079092
3. Perwej Y, Abbas SQ, Dixit JP, Akhtar DN, Kumar Jaiswal A. A systematic literature review on the cyber security. Int J scientific Res Manag (2021) 9(12):669–710. doi:10.18535/ijsrm/v9i12.ec04
4. Miao J, Wang Z, Wang M, Garg S, Hossain MS, Rodrigues JJ. Secure and efficient communication approaches for Industry 5.0 in edge computing. Computer Networks (2024) 242:110244. doi:10.1016/j.comnet.2024.110244
5. Fan W, Jia X, Li J, Ma S. Reasoning about record matching rules. Proc VLDB Endowment (Pvldb) (2009) 2(1):407–18. doi:10.14778/1687627.1687674
6. Otter DW, Medina JR, Kalita JK. A survey of the usages of deep learning for natural language processing. IEEE Trans Neural networks Learn Syst (2020) 32(2):604–24. doi:10.1109/tnnls.2020.2979670
7. Sorin V, Barash Y, Konen E, Klang E. Deep learning for natural language processing in radiology—fundamentals and a systematic review. J Am Coll Radiol (2020) 17(5):639–48. doi:10.1016/j.jacr.2019.12.026
8. Sharma N, Jain V, Mishra A. An analysis of convolutional neural networks for image classification. Proced Comput Sci (2018) 132:377–84. doi:10.1016/j.procs.2018.05.198
9. Papastefanopoulos V, Linardatos P, Panagiotakopoulos T, Kotsiantis S. Multivariate time-series forecasting: a review of deep learning methods in internet of things applications to smart cities. Smart Cities (2023) 6(5):2519–52. doi:10.3390/smartcities6050114
10. Torres JF, Hadjout D, Sebaa A, Martínez-Álvarez F, Troncoso A. Deep learning for time series forecasting: a survey. Big data (2021) 9(1):3–21. doi:10.1089/big.2020.0159
11. Zheng Y, Liu Q, Chen E, Ge Y, Zhao J. Time series classification using multi-channels deep convolutional neural networks[C]//International conference on web-age information management. Cham: Springer International Publishing (2014). p. 298–310.
12. Deng Z, Wang B, Xu Y, Xu T, Liu C, Zhu Z. Multi-scale convolutional neural network with time-cognition for multi-step short-term load forecasting. IEEE Access (2019) 7:88058–71. doi:10.1109/access.2019.2926137
13. Qiu S, Zaheer Q, Ehsan H, Hassan Shah SMA, Ai C, Wang J, et al. Multimodal fusion network for crack segmentation with modified U-net and transfer learning–based MobileNetV2. J Infrastructure Syst (2024) 30(4):04024029. doi:10.1061/jitse4.iseng-2499
14. Su Y, Zhao Y, Niu C, Liu R, Sun W, Pei D, et al. Robust anomaly detection for multivariate time series through stochastic recurrent neural network[C]. In: Proceedings of the 25th ACM SIGKDD international conference on knowledge discovery and data mining (2019). p. 2828–37.
15. Yu P, Zhao X, Jiao J. An aeromagnetic compensation algorithm based on a deep autoencoder. IEEE Geosci Remote Sensing Lett (2020) 19:1–5. doi:10.1109/lgrs.2020.3044999
16. Ren L, Pan Z, Cao J, Liao J. Infrared and visible image fusion based on variational auto-encoder and infrared feature compensation. Infrared Phys and Technology (2021) 117:103839. doi:10.1016/j.infrared.2021.103839
17. Zhao X, Yao J, Deng W, Jia M, Liu Z. Normalized conditional variational auto-encoder with adaptive focal loss for imbalanced fault diagnosis of bearing-rotor system. Mech Syst Signal Process (2022) 170:108826. doi:10.1016/j.ymssp.2022.108826
18. Osada G, Omote K, Nishide T. Network intrusion detection based on semi-supervised variational auto-encoder[C]//Computer security–ESORICS 2017: 22nd European symposium on research in computer security, Oslo, Norway, september 11-15, 2017, proceedings, Part II 22. Springer International Publishing (2017). p. 344–61.
19. Wan Z, Zhang Y, He H. Variational autoencoder based synthetic data generation for imbalanced learning[C]. In: 2017 IEEE symposium series on computational intelligence (SSCI). IEEE (2017). p. 1–7.
20. Abdulhammed R, Faezipour M, Abuzneid A, AbuMallouh A. Deep and machine learning approaches for anomaly-based intrusion detection of imbalanced network traffic. IEEE sensors Lett (2018) 3(1):1–4. doi:10.1109/lsens.2018.2879990
21. Khanam S, Ahmedy I, Idris MYI, Jaward MH. Towards an effective intrusion detection model using focal loss variational autoencoder for internet of things (IoT). Sensors (2022) 22(15):5822. doi:10.3390/s22155822
22. Vu L, Cao VL, Nguyen QU, Nguyen DN, Hoang DT, Dutkiewicz E. Learning latent distribution for distinguishing network traffic in intrusion detection system. In: ICC 2019-2019 IEEE international conference on communications (ICC). IEEE (2019). p. 1–6.
23. Lin JCW, Shao Y, Zhang J, Yun U. Enhanced sequence labeling based on latent variable conditional random fields. Neurocomputing (2020) 403:431–40. doi:10.1016/j.neucom.2020.04.102
24. Bhuyan P, Singh PK, Das SK. Res4net-CBAM: a deep cnn with convolution block attention module for tea leaf disease diagnosis. Multimedia Tools Appl (2024) 83(16):48925–47. doi:10.1007/s11042-023-17472-6
25. Lee H, Park J, Hwang JY. Channel attention module with multiscale grid average pooling for breast cancer segmentation in an ultrasound image. IEEE Trans Ultrason ferroelectrics, frequency Control (2020) 67(7):1344–53. doi:10.1109/tuffc.2020.2972573
26. Zhu X, Cheng D, Zhang Z, Lin S, Dai J. An empirical study of spatial attention mechanisms in deep networks. Proc IEEE/CVF Int Conf Comput Vis (2019) 6688–97.
27. Shao H, Yao S, Sun D, Zhang A, Liu S, Liu D, et al. “Controlvae: controllable variational autoencoder,” in International conference on machine learning. PMLR (2020). p. 8655–64.
28. Bauskar S. A review on database security challenges in cloud computing environment. International Journal Of Computer Engineering And Technology (Ijcet) (2024) 15(5):842–52.
29. Kritikos K, Magoutis K, Papoutsakis M, Ioannidis S. A survey on vulnerability assessment tools and databases for cloud-based web applications. Array (2019) 3:100011. doi:10.1016/j.array.2019.100011
30. Panwar SS, Raiwani YP, Panwar LS. An intrusion detection model for CICIDS-2017 dataset using machine learning algorithms. In: 2022 international conference on advances in computing, communication and materials (ICACCM). Dehradun, India (2022). p. 1–10.
31. Yu Y, Si X, Hu C, Zhang J. A review of recurrent neural networks: LSTM cells and network architectures. Neural Comput (2019) 31(7):1235–70. doi:10.1162/neco_a_01199
32. Panchendrarajan R, Amaresan A. Bidirectional LSTM-CRF for named entity recognition. In: 32nd pacific asia conference on language, information and computation (2018).
33. Chen T, Xu R, He Y, Wang X. Improving sentiment analysis via sentence type classification using BiLSTM-CRF and CNN. Expert Syst Appl (2017) 72:221–30. doi:10.1016/j.eswa.2016.10.065
34. Wang W, Tan X, Zhang P, Wang X. A CBAM based multiscale transformer fusion approach for remote sensing image change detection. IEEE J Selected Top Appl Earth Observations Remote Sensing (2022) 15:6817–25. doi:10.1109/jstars.2022.3198517
35. Sajjad M, Khan ZA, Ullah A, Hussain T, Ullah W, Lee MY, et al. A novel CNN-GRU-Based hybrid approach for short-term residential load forecasting. IEEE Access (2020) 8:143759–68. doi:10.1109/access.2020.3009537
Keywords: anomaly detection, convolutional neural network, chain information management system, network traffic, accuracy
Citation: Liu C, Liu C and Liu C (2025) An abnormal traffic detection method for chain information management system network based on convolutional neural network. Front. Phys. 13:1592975. doi: 10.3389/fphy.2025.1592975
Received: 13 March 2025; Accepted: 14 April 2025;
Published: 28 April 2025.
Edited by:
Hui-Jia Li, Nankai University, ChinaCopyright © 2025 Liu, Liu and Liu. This is an open-access article distributed under the terms of the Creative Commons Attribution License (CC BY). The use, distribution or reproduction in other forums is permitted, provided the original author(s) and the copyright owner(s) are credited and that the original publication in this journal is cited, in accordance with accepted academic practice. No use, distribution or reproduction is permitted which does not comply with these terms.
*Correspondence: Chunxiang Liu, MDYyMjQxQGpzZWkuZWR1LmNu