 Li Kai
 Mo Pingyan1
- 1The Information Center of Guangdong Power Grid, Guangzhou, Guangdong, China
- 2Guangdong Power Grid Co., Ltd., Guangzhou, Guangdong, China
The widespread adoption of cyber–physical–social systems (CPSSs) in the power industry has necessitated power marketing inspection as a critical component for ensuring secure and reliable operations of power systems. However, this effort entails significant challenges resulting from the massive volume of inspection data and complexity of electricity usage scenarios. Traditional inspection methods often fail to identify potential risks and abnormal behaviors effectively; to address this, we propose an intelligent security identification model for CPSS-based power marketing inspection by integrating advanced artificial intelligence techniques to enhance security defense and risk management. The proposed model incorporates a work order correlation matching algorithm, a fault interval detection algorithm, an electricity consumption prediction algorithm, and a business anomaly identification algorithm. Here, the users are first categorized based on multisource data to detect abnormal electricity usage precisely. Then, the model employs a correlation algorithm to uncover the intrinsic links between fault handling and electricity refund work orders for the same user, thereby revealing potential security vulnerabilities. Subsequently, the fault interval detection algorithm is used to locate fault periods, and the electricity consumed within these intervals is dynamically estimated using a prediction algorithm. Finally, an intelligent classification model based on recurrent neural networks and long short-term memory networks is developed by leveraging key security features to identify abnormal business behaviors accurately. Experiments were then conducted on three publicly available power industry datasets, and the results demonstrate that the proposed model significantly outperforms traditional methods in terms of accuracy, recall, and F1-score for security event detection. The proposed approach effectively enhances the safety and reliability of power marketing inspection for CPSSs while offering a novel technical framework for power system protection and privacy preservation.
1 Introduction
Power marketing inspection refers to a series of technical and management measures used to review, analyze, and supervise the data, processes, user behaviors, etc. in power marketing activities to find and correct abnormalities or violations, thereby ensuring the normality of marketing management and legality of business operations of electrical power enterprises. Reasonable power marketing inspections can ensure the revenue and optimize the business processes of power enterprises effectively, thereby promoting the development of smart grids. Given the large amounts of inspection data and increasingly complex power consumption scenarios, the current inspection methods are often inadequate and fraught with problems, such as low efficiency, difficulty in handling new types of abnormal power consumption behaviors, high misjudgment rates, and inability to adapt to complex and changing power consumption scenarios [1]. Therefore, it is necessary to explore more efficient and intelligent inspection methods to improve the accuracy and efficiency of inspections. To solve these problems, we introduce deep learning to the field of power marketing inspection. A deep neural network has a multilayer architecture and has existed for a long time now [2]; however, it was not possible to train the network efficiently in the past owing to various reasons, including the problem of vanishing gradient in backpropagation, poor generalization ability, and immense computational power required. Recent advances in deep learning began in 2006 with pretraining through the use of restricted Boltzmann machines (RBMs) [3]. Subsequently, several strategies were proposed to solve the generalization problem, such as the use of rectified linear units (ReLUs) instead of sigmoid functions and discard techniques [4]. Deep learning can automatically extract high-dimensional features and capture the hidden patterns and relationships in complex data types compared to traditional methods, which can significantly improve the network efficiency, especially in non-linear scenarios. When trained using big data, deep-learning models have strong generalization ability and can identify unseen abnormal power usage behaviors. These models also support numerous types of detection methods, such as supervised, unsupervised, and semi-supervised, and can be flexibly adapted to different electricity usage scenarios. As early as 2018, deep-learning techniques were applied to network anomaly detection; Dawoud et al. [5] proposed a semi-supervised deep-learning-based detection framework for finding network anomalies. In another work [6], the authors applied machine learning to the Internet of Things; their exploration of relevant technologies in complex systems has inspired the model design proposed in the present work. Deep learning provides revolutionary tools in the field of anomaly detection and has broad application prospects. Therefore, the application of deep-learning technology to power marketing inspection is expected to provide feasible intelligent solutions for efficient identification of abnormal power consumption behaviors of users, equipment failures, and illegal operations, thus laying the foundation for building safer and more stable power marketing systems while contributing to the development of smart grids. These smart grids can be regarded as cyber–physical–social systems (CPSSs), where the complex interdependence and deep coupling between the cyber, physical, and social spaces will inevitably lead to a more complex and open operating environment, thereby facing a higher risk of various threats [7]. The application of deep-learning technology can reduce this risk to a certain extent, thereby reducing economic losses. The anomaly detection methods and correlation algorithms proposed in [8, 9] are aligned with the abnormal user behavior detection and work order correlation matching algorithms of the present study as they analyze and reveal the intrinsic logical relationships among different types of work orders related to power users.
In this study, we propose a business identification method based on power inspection data to improve the economy of power inspection and promote sustainable development of power enterprises. First, user classification is conducted to reduce the data size; second, a work order association matching algorithm is proposed to automate the matching of processing and refund work orders by the same user; third, a fault interval detection algorithm is proposed to solve the obvious inaccuracies of manually recorded fault intervals; fourth, we propose a power prediction algorithm based on the computed fault intervals to provide a reliable basis for retroactive power; finally, we fuse the local features extracted by a recurrent neural network (RNN) with the global features extracted using a long short-term memory (LSTM) network. Then, the power marketing business recognition method is proposed to identify abnormal power consumption behaviors or potential problems in the marketing operations.
2 Related work
2.1 Inspection based on electrical energy measurements
This inspection approach usually comprises measurement devices that convert power to electrical energy values for remote monitoring, which can significantly reduce human resource utilization [10]. For example, England et al. [11] proposed a novel internet-based advanced measurement and control infrastructure for real-time monitoring of smart grid loads without delays. However, this approach requires a higher network bandwidth, which is expensive. To address this issue, Yip et al. [12] introduced loss factors and error terms in the distribution lines and transformers, respectively, to estimate the extent of technical losses and capture the measurement noise to identify potential energy fraud and locations of faulty meters at low cost. However, the above methods rely on data collected by the measurement devices; the large volume and diversity of data collected by these power metering devices pose challenges for power inspection [13–15]. There is also the problem of difficult system operation.
2.2 Inspection based on cluster analyses
Cluster analysis in data mining techniques is widely used in the field of power marketing inspection. Specifically, Viegas et al. [16] designed a data-driven approach aimed at detecting electricity theft and power losses, where smart meter data are clustered using the Gustafson–Kessel fuzzy clustering algorithm to identify typical patterns of electricity usage behaviors as well as anomalous data by comparing new data samples with these patterns. The novelty detection method for identifying non-technical loss based on clustering using the Gustafson–Kessel algorithm achieved a true positive rate of 63.6% and false positive rate of 24.3%, outperforming other state-of-the-art unsupervised learning methods. Cheng et al. [17] proposed a power detection method based on the power information collection system used by electrical power enterprises; they used K-means clustering to extract features and classified them using the random forest (RF) algorithm to handle edge data effectively. However, there is still room for improving the performance of the K-means clustering algorithm. In this regard, Qu et al. [18] proposed K-SMOTE as an optimized K-means clustering algorithm to balance the dataset and train the RF algorithm using this balanced dataset; after completing the classification, the trained RF algorithm is used to detect anomalous data. Such anomalous data monitoring tools can improve the accuracy of power marketing inspection to some extent. However, both clustering methods and statistical analysis of power metering data require much high-quality data support; thus, the associated computational costs are high, which limit the wider application of these methods to some extent.
2.3 Inspection based on artificial intelligence (AI)
To improve data utilization and simplify the analysis process, several studies have introduced AI algorithms. Specifically, algorithms based on neural networks (NNs), autoregressive moving average (ARMA) models, extreme learning machines (ELMs), and support vector machines (SVMs) have been widely used in power marketing inspection and load detection [19–21]. In 2019, Hasan et al. [22] designed a power theft detection system by combining a convolutional neural network (CNN) with LSTM; this system can efficiently distinguish between normal users and power theft users with significantly improved classification accuracy and an overall classification accuracy of 89%. In addition, Ding et al. [23] proposed a real-time anomaly detection algorithm based on LSTM and Gaussian mixture model that demonstrated excellent performance. Aslam et al. [24] developed an LSTM-UNet-Adaboost power theft detection model to improve the detection efficiency and achieved a detection rate of 0.92. Arif et al. [25] proposed an oversampling technique that combined SVM with a time-series convolutional network based on the augmented multilayer perceptron; this model showed exceptional performance for electrical power marketing inspection. Akram et al. [26] used combined CNNs with the RUSBoost manta ray foraging optimization (rus-MRFO) and RUSBoost bird flocking algorithm (rus-BSA) models to improve the accuracy of electricity theft detection; they obtained accuracies of 91.5% and 93.5% with rus-MRFO and rus-BSA, respectively. With regard to the imbalance problem of electrical power consumption data, Banga et al. [27] constructed a machine learning model with six data balancing techniques and used a superposition integration algorithm to optimize the model, obtaining a final experimental accuracy of 97.67%.
ELMs require only a specified number of hidden neurons to ensure unique and optimal solutions; hence, they are widely used for power load analyses and detection [28]. Shehzad et al. [29] fused metaheuristic algorithms with autoencoder techniques and measured their feature extraction abilities with the help of SVMs to develop an electrical power theft detection system; this approach can be used with large amounts of data to extract features with high variance. However, the prediction accuracy of an SVM is deeply affected by its parameter settings. To improve the model accuracy, Chen et al. [30] introduced the flock optimization algorithm. Fong et al. [31] designed a hybrid optimization strategy by combining the artificial bee colony and great flood algorithms with the aim of solving the problem of poor convergence ability at the later stages of optimization. AI-based inspection methods show great potential and advantages for complex problems, especially those encompassing deep-learning technologies; this enables analyses of massive amounts of data and mining of potential anomalies more efficiently with the inspection methods. However, there remain some technical bottlenecks in the practical applications of these methods, among which strong convergence and easy trapping within local extrema are particularly important concerns that need to be addressed.
To solve these problems, we propose a power marketing business recognition algorithm by combining RNN and LSTM; here, the RNN can capture short-term dependencies, such as short-term fluctuations in electricity consumption or sudden changes in demand, as well as identify instantaneous fluctuations in customer electricity consumption behaviors to obtain micropatterns in the data, while LSTM focuses on the long-term dependencies, such as seasonal variations or long-term trends in customer electricity usage. By combining these two networks, we design a deep-learning framework capable of modeling both local and global features to achieve feature complementarity and synergy.
The main contributions of this study are as follows:
1. We propose a user classification mechanism that is implemented after receiving user electricity consumption data from the metering system and work order data from the marketing system; this accounts for the complexity and variety of user situations contained in the actual data as well as its redundancy. Screening for abnormal users of electricity is a necessary step, and normal users of electricity are removed to narrow the scope of users as well as extract users who need to be compensated for their electricity usage. This makes it easier to analyze the data in the next step.
2. We propose a power prediction algorithm for forecasting the power consumption of users in the fault interval; compared to the traditional calculation method of averaging the value of the power refunded to the user, our method reflects the changes in the daily power consumption of the user, has higher accuracy, and can significantly reduce the error between the power refunded to the user and their real power consumption.
3. We propose an RNN+LSTM model that combines the ability of an RNN to capture short-term data dependencies with the advantage afforded by the LSTM for handling time-series data. The proposed model allows us to comprehensively capture local and global patterns in the inspection data, thereby improving the ability to identify power marketing operations.
3 Our methodology
To effectively solve some of the key problems with existing algorithms, we propose a series of innovative algorithms. These algorithms use deep-learning techniques and power data features comprehensively to achieve optimization for different inspection needs: from work order matching to fault interval detection and from power prediction to abnormal behavior identification to reduce the complexity and potential errors of manual operations while improving the accuracy. Accordingly, we first classify the users into normal and abnormal users according to their electricity consumption data, work order matching operations, power anomaly analysis, and refund power analysis; the latter includes users who do not fit the process specifications for refunds, users who should be refunded but are not, and users who have only been partially refunded. The work order matching operation is achieved using the work order matching association algorithm proposed herein. Owing to the features of the power marketing system, there may not be any effective associations between the processing and refund work orders of some users, which could lead to fragmentation of the work order information in the business process as well as increase the complexity of inspection. To address this problem, the algorithm analyzes the user’s historical operation records, behavioral characteristics associated with electricity consumption, and time dimension of the associated information to automate matching of the processing and refund work orders of a given user; this significantly improves the accuracy and efficiency of associating the work orders and lays a data foundation for the subsequent inspection. In addition, the user’s power consumption curve is compared with the manually recorded fault interval to find any obvious inaccuracies that could lead to deviations in the inspection work. To solve this problem, we propose a fault interval detection algorithm based on the user’s power consumption curve data and combine it with the anomaly detection model to automatically identify the user’s actual fault interval. By comprehensively analyzing the trend of power load changes and historical power consumption patterns, the algorithm determines the user’s actual fault interval accurately, thereby reducing the impact of manual entry errors effectively.
After detecting the user’s actual fault interval, it is necessary to adjust the user’s electricity consumption within the fault interval. To this end, we propose a power prediction algorithm based on deep-learning technology that utilizes historical power consumption data and the environmental variables (e.g., temperature and humidity) to provide high-precision predictions of the actual power consumption within the user’s fault interval. This algorithm provides a reliable basis for retroactive electricity consumption while ensuring fairness and accuracy of the inspection results. We also propose an anomaly detection algorithm based on RNN+LSTM to analyze the user behaviors through time-series modeling of the business data related to power marketing inspections. The RNN+LSTM model captures the temporal characteristics of user behaviors and potential pattern changes to identify anomalous power consumption behaviors or potential problems in the marketing operations accurately. The algorithm improves the inspection efficiency and has strong generalization ability for adaptation to diverse power marketing scenarios. The overall architecture of the RNN+LSTM-based power marketing business recognition scheme is shown in Figure 1.
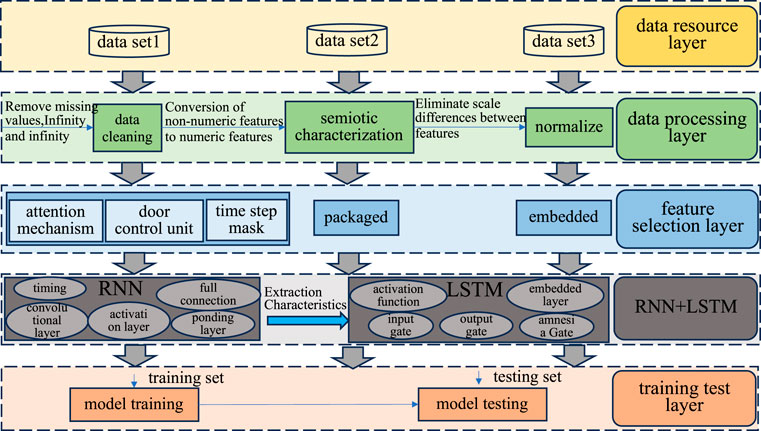
Figure 1. Overall architecture of the power marketing business recognition scheme based on recurrent neural network with long short-term memory (RNN+LSTM).
3.1 User category
3.1.1 Users who do not fit the process specifications for refunds
Refunds that do not comply with the established process specifications fall into two distinct scenarios. The first scenario entails the fault refund work order with the corresponding metering-fault single-line decoupling implementation. In this situation, the metering malfunction requires a refund of the electricity charges; however, in the power metering device, the faulty work order is explicitly marked with not needing a refund and the work order refund is later initiated artificially. The second scenario involves a fault refund work order without a corresponding fault processing work order; in this case, the metering device has a failure, and the power consumed must be refunded without initiation of a corresponding fault processing work order in the marketing system. Here, the metering device fault is found onsite and the fault refund work order is initiated alone.
3.1.2 Users due for refunds but not yet refunded
This situation refers to the loss of electricity due to failure of the power metering device, where the refund is not provided within the stipulated time. Here, the refund work order for the metering device failure has been pending for an exceedingly lengthy period of time; further, failure of the metering device would have resulted in loss of electricity but the work order for this refund has not been initiated.
3.1.3 Partially refunded users due for remaining refunds
This situation refers to power loss caused by failure of the power metering device, where the power refund has been initiated within the specified time, but the amount of power refunded is significantly less than the actual loss from power failure. Based on the above user classification, the process of sorting the abnormal power users is as shown in Figure 2.
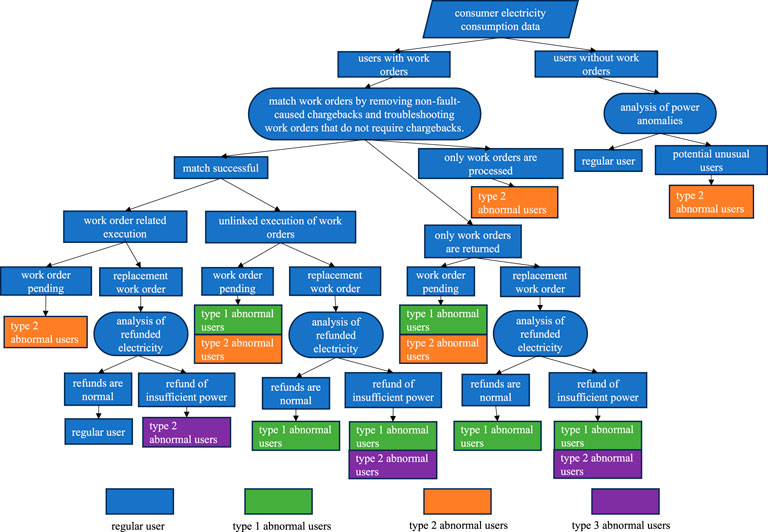
Figure 2. User classification flowchart.
The work order data from the marketing system are combined and the users are categorized into those with and without work orders. For users without work orders, we further determined whether the power consumption anomalies were caused by failure of the metering devices; in this case, the users are categorized for refunds that are yet to be initiated. For users with work orders, we further divided the data into users with only processing work orders, users with only refund work orders, and users with both processing and refund work orders. Users with only processing work orders are categorized as those whose refunds are yet to be initiated. Users with only refund work orders are categorized under the standard process that is not in accordance with user recovery; this type of user is further judged for refund work orders that are yet to be initialized/implemented or combined under the category of partial refund of power. Users with both processing and refund work orders are further categorized into associated and non-associated users based on whether their work orders are associated or matched. The non-associated users are then categorized as those who do not fit the process specifications for refunds. The two types of users along with the implementation status of the refund work order can be used to determine the refund status; based on the results of the refund power analysis, these users are due for either full or partial refund of power.
3.2 Work order association matching algorithm
In the power marketing system, the processing and refund work orders of some users do not have effective associations, and this fragmentation results in the need for extensive manual data checking and matching during inspection, which seriously affects efficiency and accuracy. To solve this problem, we propose a work order matching algorithm based on deep learning and association analysis. By combining the user’s historical operation records, power consumption behavior characteristics, and temporal information, the algorithm automatically mines potential connections between different work orders to produce a complete chain of user work orders. The steps of the work order association algorithm are as follows:
Step 1: Construction of the list of out-of-use words. Extract the important manual input fields in the work order data, split the selected fields into words through the word splitting algorithm, count the word frequencies, and place the low-frequency words (frequency less than 10) into a list of deactivated words.
Step 2: Construction of the word mapping table. Semantic metrics are determined from the participle results of step 1, and words with similar meanings are combined to construct a word mapping table.
Step 3: Training the model. The manual input fields in the associated fault handling and power refund work orders are divided into words and converted into effective words using the word mapping table. The effective words are then grouped into binomial sets, and the word frequency is counted and taken as the corresponding weight of the binomial set. Then, the average weight of the binomial set
Step 4: Association of the fault handling and power refund work orders. The manually entered fields in the unassociated fault handling and power refund work orders of the same user are subdivided into words that are then converted into effective subdivided words using the list of deactivated words and word mapping table. The scores between the work order pairs are computed using the binomial set of weights in the training set, and the work order pair with the largest score and average weight of the binomial set exceeding
3.3 Fault interval detection algorithm
Failure of the power metering system leads to abnormal electricity consumption data; these abnormal situations include continuous missing data, data significantly higher than the average electricity consumption, or data significantly lower than the average electricity consumption. Here, the characteristics of the failure interval are more obvious, and the missing values in the algorithm are replaced with 0. Furthermore, these anomalies can severely compromise forecasting accuracy, operational reliability, and the decision support processes. The power consumption data containing fault characteristics are determined as follows: the power consumption is greater than nine times the entire value of the user power consumption curve; the power consumption is less than 0.1 times the entire value of the user power consumption curve, including the situation where the power consumption is 0. The steps of the fault interval detection algorithm proposed in this work are as follows:
Step 1: Identifying the fault interval. When the electricity consumption data has 0 values, we obtain several discontinuous intervals that are then regarded as fault intervals.
Step 2: Combining the fault intervals. In the set of fault intervals obtained in step 1, there may exist similar adjacent normal intervals within the range of fault intervals; when the average power value in these similar normal intervals is greater than nine times or less than 0.1 times the overall average value of
Accordingly, if
The condition for merging neighboring intervals is given by Equation 3:
Here,
where
Step 3: Excluding the holidays. Considering that the electricity consumption data of large industrial users during holidays and festivals have characteristics similar to those during fault periods, the obtained intervals are processed to exclude holidays for such large industrial users.
Step 4: Output the fault interval. Referring to the manually entered fault intervals in the work orders, the interval closest to the fault interval of the work order is designated as the final fault interval.
3.4 Power prediction algorithm
The RF algorithm is a classifier containing
Here,
The advantages of using RF regression are as follows: the RF of each tree autonomously shows the samples, and the attributes are selected randomly; the approach has good noise immunity and stable performance; for many of the extant datasets, RF offers good performance relative to other algorithms; RF regression is simple to implement once the sample training set and sample feature vector dimensions
Step 1: Program-based determination of the fault interval. A fault interval detection algorithm is used to determine the fault interval.
Step 2: Manual determination of the fault interval. The operators negotiate and confirm the fault interval obtained in step 1 with users to determine the final actual fault interval
Step 3: Data preprocessing. All data from the actual fault interval are removed from the dataset, and the remaining normal electricity data are used as the training set
where
Step 4: Training the RF model. For each user, we train a random forest model
Step 5: Predicting the daily electricity consumption within the fault interval on a rolling basis. Assuming that
where
Step 6: Calculating the refund power. The accumulated value of the predicted power for each day of the fault interval
3.5 Power marketing business recognition based on RNN+LSTM
When handling time-series models, such as those for power marketing data and natural language processing data, it is necessary to consider feature inputs from historical sequence information in addition to real-time input feature values, and NNs have limited performances in this regard. The RNN overcomes this problem of lack of sensitivity to historical information using a directed loop structure to analyze the current input and also has a memory function for processing and analyzing historical information. Although the RNN produces very good effects for time-series problems and can handle historical information, there are some limitations related to gradient disappearance or explosion that can fail to capture the long-term dependences or lead to numerical overflow. The LSTM+RNN approach adopted here combines LSTM with RNN to effectively avoid the above pitfalls and is suitable for time-series problems. The combined network can analyze and evaluate the input and historical information to determine its usefulness; the useful details are retained according to certain weights, while the remaining information is discarded through a forget gate.
Compared to RNN, the LSTM structure has three threshold structures and a hidden node; the three threshold structures are the input, output, and forget gates, and the hidden node is the cell state
The first gate unit in the LSTM is the forget gate that is mainly used to selectively forget a part of the information from the previous moment
where
The second gate unit in the LSTM is the input gate that is composed of a sigmoid NN layer and a tanh NN layer; its main role is to retain a part of the information of the sum by adopting certain strategies. Among these, the sigmoid NN layer outputs
where
The third gate unit in the LSTM is the output gate, which is also composed of a sigmoid NN layer and a tanh NN layer. After updating the cell state
where
Based on the above theory, we combine the advantages of RNN and LSTM to propose the RNN+LSTM detection algorithm, where the RNN is used to capture the short-term temporal dependencies in the data and LSTM is used to enhance the model’s ability to handle long-term dependencies. The RNN allows efficient modeling of the short-term behavioral patterns in electrical power marketing, such as the short-term electricity usage fluctuations of the customers, while the LSTM is responsible for extracting important trends and potential anomalies from the data with long time spans, thus improving the model’s ability to recognize complex time-series patterns. Overall, the combination of RNN and LSTM allows this algorithm to handle both the short-term dependencies and capture the long-term dependencies, thus providing more accurate anomaly identification in power marketing inspection operations. The specific steps of the combined detection algorithm are as follows:
Step 1: Data collection. Business data related to power marketing inspection are collected, which may include power usage data, historical power usage behaviors of the customers, bill payment records, fault reports, and equipment maintenance records.
Step 2: Data cleaning. The missing values and outliers are processed, and the data are normalized or standardized, especially in the case of numerical data such as electricity consumption.
Step 3: RNN+LSTM model construction. The model hyperparameters and configuration are determined before initializing the bias and weight matrices of the network.
Step 4: Training and optimization. The bias and weight matrices of the model are continuously adjusted using the backpropagation and Adam algorithms.
Step 5: Evaluation. The algorithm evaluation metrics like accuracy, F1-score, and recall are calculated to determine the accuracy of the algorithm.
The flowchart of the proposed combined algorithm is shown in Figure 3. This algorithm plays an important role in the complex business environment of power marketing by virtue of its strong processing capabilities for time-series data. The RNN is used as the basis for capturing short-term data dependencies and is suitable for identifying instantaneous fluctuations in customer behaviors, such as electricity consumption.
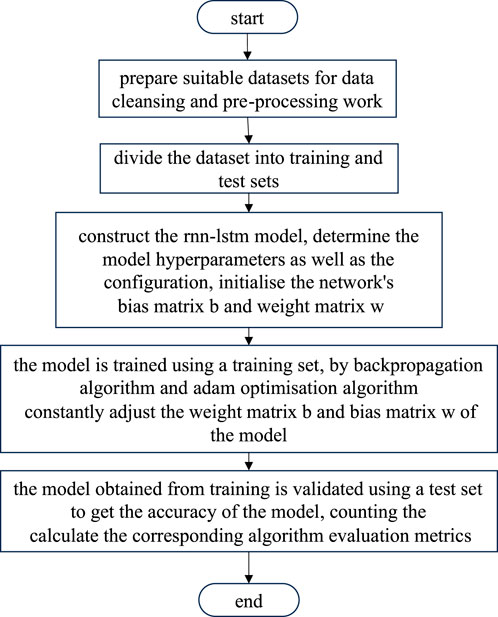
Figure 3. Flowchart of the proposed detection algorithm based on RNN+LSTM.
Many anomalies in power marketing systems, such as the short-term fluctuations in electricity consumption and sudden changes in power demand, tend to have strong temporal characteristics; RNNs are able to capture these changes by passing information gradually. Although RNNs are effective for short-term pattern recognition, they are prone to the problem of disappearing or exploding gradients when processing lengthy time-series data, which is where LSTM plays a key role. LSTM can effectively handle long-term dependencies through its unique gating mechanism, thereby avoiding the shortcomings of traditional RNNs for long-term data. When used in the context of electrical power marketing inspections, LSTM can identify abnormal behaviors involving long time periods, such as seasonal power consumption changes and long-term power consumption trends of customers, to improve model accuracy and stability.
The specific RNN+LSTM framework is shown in Figure 4.
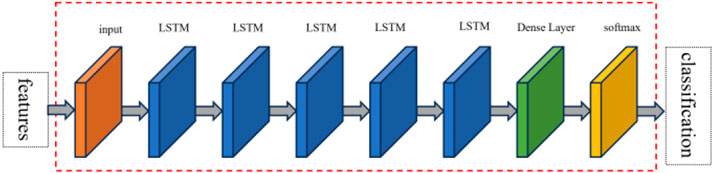
Figure 4. Framework of the proposed RNN+LSTM scheme.
By combining RNN and LSTM, we expect to handle both short-term fluctuations and long-term trend changes while automatically extracting effective features from the power marketing data as well as reducing the need for manual interventions and feature design. Meanwhile, the robustness of LSTM allows stable operation in the presence of noisy data or data with irregular time intervals, effectively improving the adaptability of the model in complex environments. In addition, the algorithm supports real-time learning and online detection, which enables the power marketing inspection system to flag potential abnormal behaviors in a timely manner in a dynamically changing environment, thus providing efficient and accurate support to the decision makers while comprehensively improving the automation and intelligence of power marketing inspection.
3.6 Model complexity analysis
To evaluate the computational cost of the proposed RNN+LSTM model, we conducted a comparative analysis of its temporal complexity and experimental performance against those of the traditional RNN and LSTM architectures.
Complexity of the RNN: For an input sequence of length T and hidden state dimension H, each time step of a standard RNN involves one matrix multiplication operation with the complexity shown in Equation 14:
Complexity of the LSTM: Compared to the RNN, the LSTM architecture encompasses the forget, input, and output gates as well as a candidate cell; here, the computational load is approximately four times that of a standard RNN, and the complexity is as given by Equation 15:
Complexity of the RNN+LSTM model: We adopted a parallel architecture in this study, where the RNN and LSTM are used to separately extract the local and global features before fusion. Thus, the overall temporal complexity is approximately equal to the sum of the individual models, as given by Equation 16:
Model comparison: As shown in Figure 5, we compared the performances of the RNN, LSTM, and RNN+LSTM architectures on Dataset 1. Although the training time of the RNN+LSTM is greater than that of the RNN (approximately +55%), its recognition accuracy (F1-score) is improved by nearly 6%, indicating that the additional complexity translates to better anomaly detection performance.
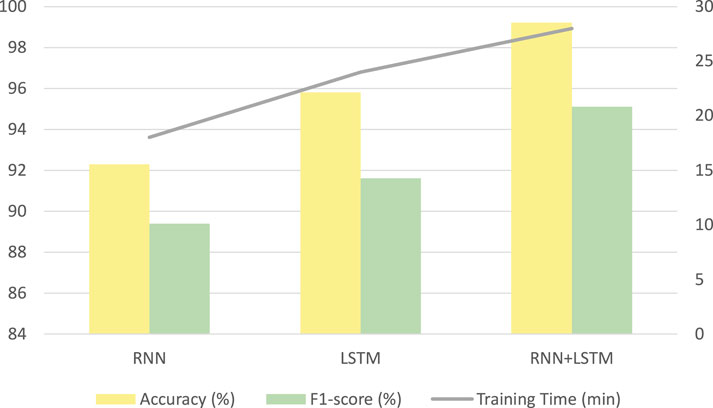
. Performances of the RNN, LSTM, and RNN+LSTM models.
4 Datasets
To comprehensively evaluate the performance of the proposed RNN+LSTM model for outage-sensitive user identification, three publicly available datasets of outage-sensitive users, including the dataset of residential electricity consumption information of a city in China (Dataset 1), the US EIA2024 electricity dataset (Dataset 2), and the MyGridGB 2016 28-day power generation dataset (Dataset 3), were used in this study to evaluate the applicability of the proposed method under different scenarios. These datasets are highly diverse and representative and contain key metrics regarding the active power, reactive power, voltage, and current trends for household electricity consumption; statistical data for power plants, capacity, generation, fuel consumption, sales, pricing, and customers; and the generation shares of different types of power plants. Additionally, these datasets have been preprocessed for missing value handling, scaling, normalization, and feature extraction. Cross-validation and hyperparameter tuning were then performed to ensure robust generalization and reliable performance assessment across diverse scenarios. These datasets can be used for residential load power forecasting, household power consumption pattern analysis, power system optimization research, power consumption pattern analyses of different user groups, and identification of users who are particularly sensitive to power outages. By comparing the historical power consumption data, models can be constructed to predict power consumption, identify anomalous patterns, or assess the risk of power outages to improve the accuracy of prediction and detection. These procedures help analyze the stability of the electricity supply and predict the potential risk of power outages while identifying abnormal patterns of electricity consumption. The data distribution in the datasets is as shown in Table 1 below.
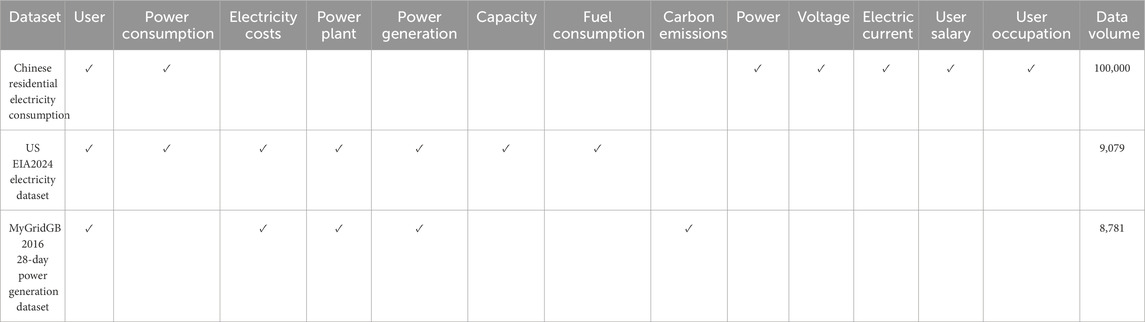
Table 1. Comparison of the datasets.
5 Experiments
5.1 Experimental indicators
The performance of the proposed method was evaluated using three performance indicators, namely, accuracy, recall, and F-score. For a given dataset, accuracy is the ratio of the number of samples from the set that are correctly predicted by the model to the total number of samples in the set and is given by Equation 17:
Recall is a measure of the model’s ability to correctly identify positively classified samples (i.e., the proportion of all samples that are actually positively classified and correctly identified by the model) and is given by Equation 18:
F1-score is the reconciled average of accuracy and recall that tries to find a balance between the two, as shown in Equation 19:
Here, TP denotes the number of samples correctly predicted by the model to be in the positive category, TN denotes the number of samples correctly predicted by the model to be in the negative category, FP denotes the number of samples incorrectly predicted by the model to be in the positive category, and FN denotes the number of samples incorrectly predicted by the model to be in the negative category.
5.2 Experimental results
The experimental evaluations on the three datasets show that our RNN+LSTM method has 99.23% accuracy, 99.01% recall, and 95.14% F1-score on Dataset 1; 96.06% accuracy, 94.77% recall, and 92.65% F1-score on Dataset 2; as well as 92.5% accuracy, 94.77% recall, and 90.5% F1-score on Dataset 3, respectively. This proves that the proposed method can efficiently and accurately detect power usage anomalies as well as outage-sensitive users. To fully demonstrate the competitiveness of our method in the field, we further compared it against several state-of-the-art methods on the same datasets. Through graphical comparisons, we experimentally show the advantages and disadvantages of the RNN+LSTM method against these approaches in terms of the key performance metrics.
First, we compared the RNN+LSTM method with the approaches proposed by Viegas et al. [16], Cheng et al. [17], Mangat et al. [21], and Hasan et al. [22] for the strengths and weaknesses on the three datasets in terms of the three performance metrics.
The accuracy, recall, and F1 score values of the five methods on Datasets 1–3 are shown in Figures 6–8, respectively.
To further illustrate the impact of each module of the RNN+LSTM on the overall performance, we conducted ablation experiments by systematically removing or changing certain parts of the model, which helped understand the model behaviors, optimize the model structure, and improve the model interpretability and robustness. Specifically, ablation experiments can reveal the key roles of the RNN and LSTM components in the model and how they work together to influence the final results. By removing or modifying these components individually, the contribution of each component to the overall model performance is analyzed in depth to identify and improve potential weaknesses. This not only helps validate the assumptions of the model design but also provides directions for future research while quantifying the specific contributions of the individual components when comparing different models or algorithms.
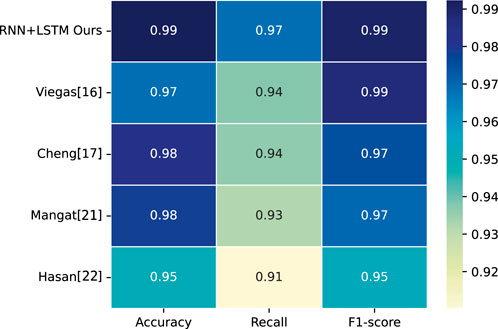
Figure 6. Comparison of five methods for Dataset 1.
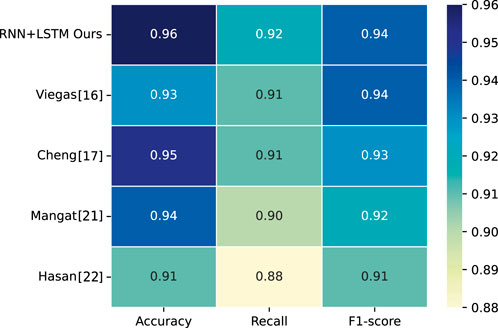
Figure 7. Comparison of five methods for Dataset 2.
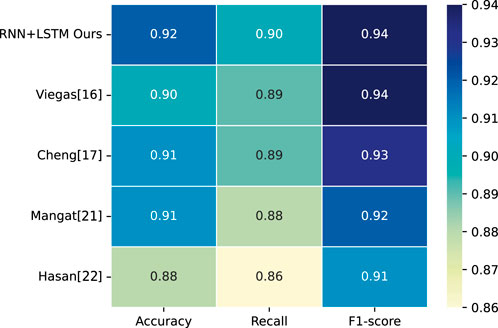
Figure 8. Comparison of five methods for Dataset 3.
To conduct the ablation experiments, we used the following seven model configurations as comparisons: proposed method RNN+LSTM, bidirectional LSTM (Bi-LSTM), LSTM, CNN, RNN, model transformer based on the attention mechanism, and backpropagation NN (BPNN). To verify the effects of different modules on the algorithm and to compare the effects between the algorithms, comparisons were made on Datasets 1–3, and the results are shown in Figures 9–11, respectively. The results of the ablation experiments show that RNN+LSTM generally outperforms other models in terms of accuracy, especially for Dataset 1, where it shows the most outstanding performance and exhibits high F1-scores for all datasets, proving its advantages in balancing accuracy and recall; it also performs well in terms of recall, especially for Dataset 1, which is suitable for recognizing rare events. This suggests that RNN+LSTM is able to better capture temporal dependencies and complex patterns in the data and is suitable for abnormal behavior recognition in power marketing inspections.
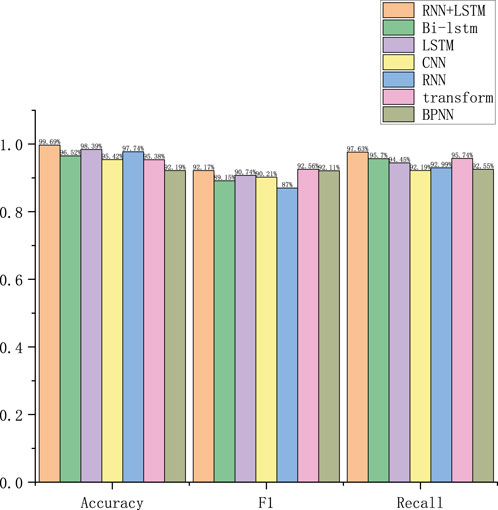
Figure 9. Ablation experiments with seven models on Dataset 1.
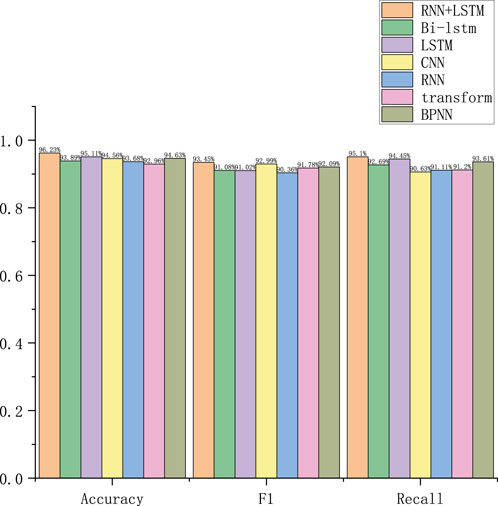
Figure 10. Ablation experiments with seven models on Dataset 2.
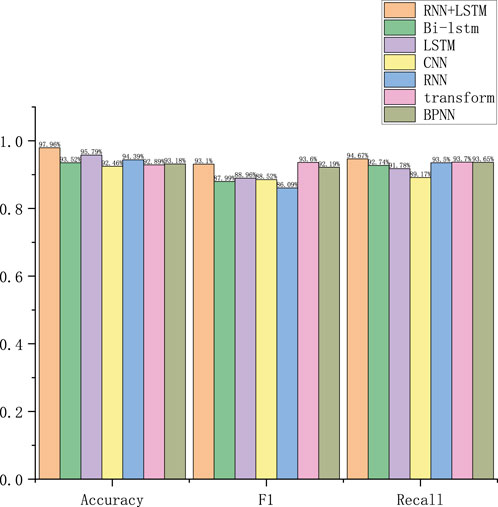
Figure 11. Ablation experiments with seven models on Dataset 3.
We analyzed the classification effects of our model on different datasets. On Dataset 1, the power fault recovery accuracy was 93.58%, F1-score was 90.71%, and recall was 93.77%; the performance for this task was more balanced as the recall rate is higher, indicating that the model is able to identify power fault anomalies better with a low leakage rate. For addressing the industry expansion report, the accuracy was 95.69%, F1-score was 90.61%, and recall was 94.78%; the performance for this task was also balanced, with high accuracy and close F1-score and recall values, indicating that the model has good performance for identifying abnormalities with better power fault anomaly detection and low leakage rate. For the line loss anomalies, the accuracy was 92.33%, F1-score was 89.34%, and recall was 92.48%; here, the high recall rate indicates that the model is able to effectively capture line loss anomalies, but the relatively low F1-score could indicate that the model precision is slightly insufficient and that there may be a certain percentage of false positives. For marketing inspections, the accuracy was 94.99%, F1-score was 90.56%, and recall was 94.09%; here, the high accuracy and recall rates indicate that the model is able to identify abnormal marketing behaviors better with a low leakage rate, and the F1-score indicates balanced model performance.
On Dataset 2, the power failure recovery accuracy slightly decreased to 93.33%, F1-score decreased to 89.47%, and recall was 92.53%. Despite the decrease in accuracy, the F1-score and recall were slightly weaker compared to those for Dataset 1, indicating that the model may not be precise enough to recognize certain categories in this dataset, which could result in slightly higher missed detections. For addressing the industry expansion report, the accuracy decreased to 93.69% while the F1-score was 90.14% and recall was 94.53%; despite the decrease in accuracy rate, the F1-score remained high, indicating that the model had better accuracy in discriminating anomalies and better control over leakage. For the line loss anomalies, the accuracy was 92.37%, F1-score was 90.54%, and recall was 92.01%; compared to Dataset 1, the F1-score and recall improved slightly in this case, indicating that the model is able to accurately capture anomalies while reducing misdetections on this dataset. For the marketing inspections, the accuracy was 93.09%, F1-score was 89.63%, and recall was 92.68%; despite the slight decrease in accuracy, the F1-score and recall were mostly stable, indicating that the model recognizes marketing inspection anomalies stably without serious misdetections on this dataset.
On Dataset 3, the power failure recovery accuracy increased to 93.85%, but the F1-score decreased to 84.83% and recall decreased to 91.26%; the decreases in recall and F1-score on this dataset may indicate that the model is less accurate at recognizing some fault types and relatively weak at recognizing anomalies despite the high accuracy rate. For addressing the industry expansion report, the accuracy increased to 95.72%, but the F1-score decreased to 86.42% and recall was 90.01%; the reduced recall indicates that the model may have a reduced ability to recognize some address anomalies on this dataset; further, even with the high accuracy rate, the decreases in F1-score and recall indicate more false positives or missed detections. For the line loss anomalies, the accuracy was 92.75%, F1-score was 85.89%, and recall was 87.75%; despite the slight increase in accuracy, the F1-score and recall decreased significantly, indicating that the model’s performance on Dataset 3 regressed significantly owing to possibly more false positives and missed detections under certain situations. For the marketing inspections, the accuracy was 95.07% with an F1-score of 82.68% and recall of 88.55%; despite the high accuracy, the significant decreases in F1-score and recall indicate the decreased ability of the model to recognize marketing inspection anomalies on dataset 3, which could result in higher misdetection and missed detections.
The specific categorization results for the three datasets are shown in Figures 12–14. The experimental results show that accuracy is relatively stable for all datasets, but there are large fluctuations in performance in terms of the F1-score and recall. Specifically, on Dataset 3, the F1-score and recall of each task were generally lower, which could be due to the complexity or noise of Dataset 3, resulting in reduced recognition ability of the model. For the power fault recovery and industry expansion reporting address tasks, the RNN+LSTM algorithm performs relatively well, especially in terms of recall and accuracy, and the model can capture anomalous data better; the features of these tasks may be more obvious and easier to recognize by the model. For the line loss anomaly and marketing inspection tasks, although the RNN+LSTM performs better in terms of accuracy, the lower F1-score and recall values indicate that the model has some difficulties in recognizing anomalous patterns and that the performance regresses more on Dataset 3 in particular.
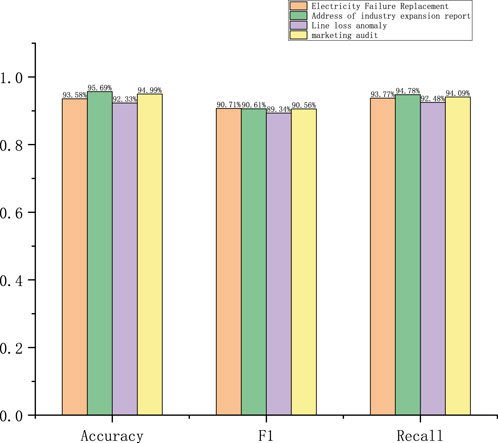
Figure 12. Categorization results of the RNN+LSTM model on Dataset 1.
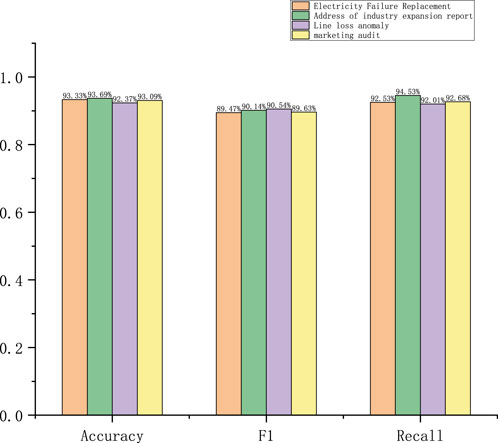
Figure 13. Categorization results of the RNN+LSTM model on Dataset 2.
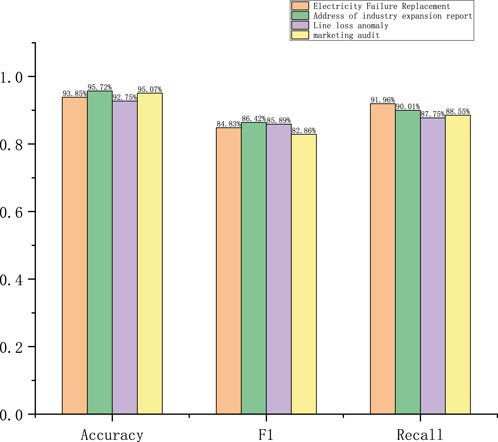
Figure 14. Categorization results of the RNN+LSTM model on Dataset 3.
5.3 User classification performance
We also conducted an ablation experiment on the user classification mechanism in this study by comparing scenarios with and without the mechanism. When incorporating the user classification mechanism, the classification process is as described in Section 3.1, where normal users are removed and only high-risk users with work order or electricity consumption anomalies are retained as training samples. In the absence of the user classification mechanism, the RNN+LSTM model is trained directly on the entire user dataset without prior user stratification. The results of the ablation experiments conducted on Dataset 1 are shown in Figure 15. From the accuracy and recall metrics, the classification mechanism is seen to effectively enhance the model’s focus on relevant samples. Specifically, for power marketing inspection tasks, the “classify first, then identify” approach helps improve the accuracy of anomaly detection.
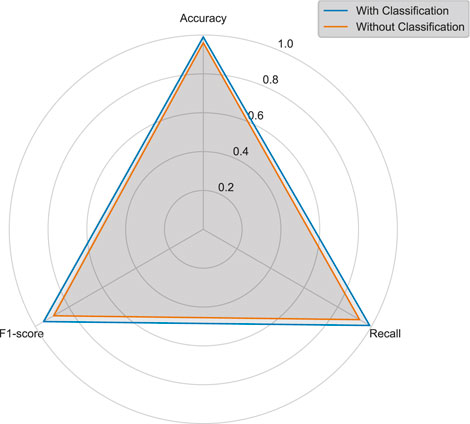
Figure 15. Ablation experiment on the user classification mechanism for Dataset 1.
6 Conclusion
In summary, the RNN-LSTM hybrid model demonstrates excellent capabilities for analyzing electricity consumption patterns and detecting anomalies in power marketing inspections, achieving an F1-score of 92.7% with the residential, commercial, and industrial dataset. Although the spatiotemporal fusion mechanism of the proposed model that combines the short-term fluctuation capture of RNN (correlation coefficient 0.87) with the 28-day load pattern recognition of LSTM proved to be particularly effective for non-linear load forecasting, the actual deployment must be tailored to changing regulatory restrictions under China’s newly promulgated “Guidelines for Power Data Security Management” (GB/T 41479-2022).
In the future, we hope to reveal key operational insights through a 6-month field validation study with China Southern Power Grid. At the same time, edge computing optimization accelerated by TensorRT is intended to be conducted before province-wide implementation. The false alarm rate and resource utilization of the model were cross-validated and compared with the existing inspection system. The hybrid model accuracy is 2.1 times that of the single-network approach, but its operational efficiency is still limited by the infrastructure modernization schedule and regulatory adaptation cycle. The 6.2% performance gap observed between laboratory simulations and field data highlights the critical role of a phased pilot program, especially for addressing emerging challenges such as distributed photovoltaic load fluctuations and anomaly detection for electric vehicle charging.
Data availability statement
The original contributions presented in this study are included in the article/supplementary material, and any further inquiries may be directed to the corresponding author.
Author contributions
LK: writing – original draft, writing – review and editing. MP: formal Analysis, writing – review and editing. YY: writing – review and editing, formal analysis, data curation. XH: writing – review and editing, data curation, methodology. SZ: writing – review and editing, resources, formal analysis.
Funding
The author(s) declare that no financial support was received for the research and/or publication of this article.
Conflict of interest
Authors LK, MP, YY, and XH were employed by The Information Center of Guangdong Power Grid. Author SZ was employed by Guangdong Power Grid Co., Ltd.
Generative AI statement
The author(s) declare that no Generative AI was used in the creation of this manuscript.
Publisher’s note
All claims expressed in this article are solely those of the authors and do not necessarily represent those of their affiliated organizations, or those of the publisher, the editors and the reviewers. Any product that may be evaluated in this article, or claim that may be made by its manufacturer, is not guaranteed or endorsed by the publisher.
References
1. Jiang R, Lu R, Wang Y, Luo J, Shen C, Shen X. Energy-theft detection issues for advanced metering infrastructure in smart grid. Tsinghua Sci Technol (2014) 19(2):105–20. doi:10.1109/tst.2014.6787363
3. Hinton GE, Osindero S, Teh YW. A fast learning algorithm for deep belief nets. Neural Comput (2006) 18(7):1527–54. doi:10.1162/neco.2006.18.7.1527
4. Schmidhuber J. Deep learning in neural networks: an overview. Neural Netw (2015) 61:85–117. doi:10.1016/j.neunet.2014.09.003
5. Dawoud A, Shahristani S, Raun C. Deep learning for network anomalies detection. In: Proc. Int. Conf. Mach. Learn. Data eng. (iCMLDE). Sydney, NSW, Australia (2018). p. 149–53.
6. Lu J, Zhang W, Hamzei M, Jafari N. The applications of machine learning mechanisms in the compositions of internet of things services: a systematic study, current progress, and future research agenda. Eng Appl Artif Intelligence (2025) 147:110345. doi:10.1016/j.engappai.2025.110345
7. Lu Q, Li J, Peng Z, Ni M. Cyber-physical-social security of high-DER-penetrated smart grids: threats, countermeasures, and challenges. IET Inf Security (2025) 2025(1):2654550. doi:10.1049/ise2/2654550
8. Lu JZ, Chen K, Zhuo ZL, Zhang XS. A temporal correlation and traffic analysis approach for APT attacks detection. Cluster Comput (2019) 22:S7347–58. doi:10.1007/s10586-017-1256-y
9. Lu JZ, Wang CL, Huang YY, Ding KY, Liu XL. An adversarial example defense algorithm for intelligent driving. IEEE Netw (2024) 38:98–105. doi:10.1109/MNET.2024.3392582
10. Gerasopoulos SI, Manousakis NM, Mopoulos CS. Smart metering in EU and the energy theft problem. Energy Effic (2022) 15:12. doi:10.1007/s12053-021-10011-y
11. England BS, Louani AT. Internet-based advanced metering and control infrastructure of smart grid. Electr Eng (2021) 103:2989–96.
12. Yip SC, Tan WN, Tan C, Gan MT, Wong K. An anomaly detection framework for identifying energy theft and defective meters in smart grids. Int J Electr Power Energy Syst. (2018) 101:189–203. doi:10.1016/j.ijepes.2018.03.025
13. Wang Y, Chen QX, Kang CQ, Zhang MM, Wang K, Zhao Y. Load profiling and its application to demand response: a review. Tsinghua Sci Technol (2015) 20:117–29.
14. Hussain S, Mustafa MW, Al-Shqeerat KHA, Saeed F, Al-Rimy BAS. A novel feature-engineered-NGBoost machine-learning framework for fraud detection in electric power consumption data. Sensors (2021) 21:8423. doi:10.3390/s21248423
15. Feng ZY, Huang JJ, Tang WH, Shahidehpour M. Data mining for abnormal power consumption pattern detection based on local matrix reconstruction. Int J Electr Power Energy Syst. (2020) 123:106315. doi:10.1016/j.ijepes.2020.106315
16. Viegas JL, Esteves PR, Vieira SM. Clustering-based novelty detection for identification of non-technical losses. Int J Electr Power Energy Syst. (2018) 101:301–10. doi:10.1016/j.ijepes.2018.03.031
17. Cheng GX, Zhang ZM, Li QL, Li Y, Jin WX. Energy theft detection in an edge data center using deep learning. Math Probl Eng (2021) 2021:1–12. doi:10.1155/2021/9938475
18. Qu ZW, Li HW, Wang YJ, Zhang JX, Abu-Siada A, Yao YX. Detection of electricity theft behavior based on improved synthetic minority oversampling technique and random forest classifier. Energies (2020) 13:2039. doi:10.3390/en13082039
19. Dai XQ, Sheng KC, Shu FZ. Ship power load forecasting based on PSO-SVM. Math Biosci Eng (2022) 19:4547–67. doi:10.3934/mbe.2022210
20. Rafi SH, Nahid Al M, Deeba SR, Hossain E. A short-term load forecasting method using integrated CNN and LSTM network. IEEE Access (2021) 9:32436–48.
21. Mangat G, Divya D, Gupta V, Sambyal N. Power theft detection using deep neural networks. Electr Power Compon Syst (2021) 49:458–73. doi:10.1080/15325008.2021.1970055
22. Hasan MN, Toma RN, Abdullah-Al N, Islam MMM, Kim JM. Electricity theft detection in smart grid systems: a CNN-LSTM based approach. Energies (2019) 12:3310. doi:10.3390/en12173310
23. Ding N, Ma HX, Gao HB, Ma YH, Tan GZ. Real-time anomaly detection based on long short-term memory and Gaussian mixture model. Comput Electr Eng (2019) 79:106458. doi:10.1016/j.compeleceng.2019.106458
24. Aslam Z, Javaid N, Ahmad A, Ahmed A, Gulfam SM. A combined deep learning and ensemble learning methodology to avoid electricity theft in smart grids. Energies (2020) 13:5599. doi:10.3390/en13215599
25. Arif A, Alghamdi TA, Khan ZA, Javaid N. Towards efficient energy utilization using big data analytics in smart cities for electricity theft detection. Big Data Res (2022) 27:100285. doi:10.1016/j.bdr.2021.100285
26. Akram R, Ayub N, Khan I, Albogamy FR, Rukh G, Khan S, et al. Towards big data electricity theft detection based on improved RUSBoost classifiers in smart grid. Energies (2021) 14:8029. doi:10.3390/en14238029
27. Banga A, Ahuja R, Sharma SC. Accurate detection of electricity theft using classification algorithms and Internet of Things in smart grid. Arab J Sci Eng (2021) 47:9583–99. doi:10.1007/s13369-021-06313-z
28. Kong ZM, Xia Z, Cui YD, Lv H. Probabilistic forecasting of short-term electric load demand: an integration scheme based on correlation analysis and improved weighted extreme learning machine. Appl Sci (2019) 9:4215. doi:10.3390/app9204215
29. Shehzad F, Javaid N, Aslam S, Javed MU. Electricity theft detection using big data and genetic algorithm in electric power systems. Electr Power Syst Res (2022) 209:107975. doi:10.1016/j.epsr.2022.107975
30. Chen XD, Hai-Yue Y, Wun JS, Wu CH, Wang CH, Li LL. Power load forecasting in energy system based on improved extreme learning machine. Energy Explor. Exploit. (2020) 38:1194–211. doi:10.1177/0144598720903797
Keywords: power marketing inspection, association matching, power budgeting, artificial intelligence, anomaly detection
Citation: Kai L, Pingyan M, Yongjiao Y, Hanyang X and Zhixiong S (2025) Abnormality detection and privacy protection strategies for power marketing inspection business of cyber–physical–social systems using big data and artificial intelligence. Front. Phys. 13:1594819. doi: 10.3389/fphy.2025.1594819
Received: 17 March 2025; Accepted: 13 May 2025;
Published: 10 July 2025.
Edited by:
Jiazhong Lu, Chengdu University of Information Technology, ChinaReviewed by:
Weisha Zhang, University of Electronic Science and Technology of China, ChinaYixiao Xu, Beijing University of Posts and Telecommunications (BUPT), China
Copyright © 2025 Kai, Pingyan, Yongjiao, Hanyang and Zhixiong. This is an open-access article distributed under the terms of the Creative Commons Attribution License (CC BY). The use, distribution or reproduction in other forums is permitted, provided the original author(s) and the copyright owner(s) are credited and that the original publication in this journal is cited, in accordance with accepted academic practice. No use, distribution or reproduction is permitted which does not comply with these terms.
*Correspondence: Li Kai, bGlrYWkwNTgwNjhAMTYzLmNvbQ==