Abstract
This paper proposes an optimization method based on image enhancement and feature detection to address the challenges of low-quality X-ray images,significant noise interference, and difficulty in defect identification during the detection of ablation defects in high-voltage cable buffer layers. By analyzing the advantages of X-ray detection technique and its practical challenges, the study employs a Multi-Scale Retinex with Color Restoration(MSRCR) algorithm to enhance image contrast, balancing dynamic range compression and color constancy, thereby improving the visibility of defects in low-light or lowcontrast regions. The research optimizes the Speeded-Up Robust Features(SURF) detection algorithm by adjusting the Hessian matrix threshold to enhance sensitivity to low-contrast defects. It combines multi-scale analysis with directional constraints to reduce false detections in complex backgrounds and utilizes Lanczos3 interpolation to reconstruct defect edge textures with high fidelity while suppressing ringing artifacts. Practical results demonstrate that this method significantly improves the recognition accuracy and visualization of defect regions in X-ray images, supports automatic localization and magnification, and provides reliable technical support for rapid diagnosis of high-voltage cable buffer layer conditions.
1 Introduction
Cross-linked polyethylene (XLPE) insulated cables have become the mainstream choice for urban power transmission projects due to their excellent electrical and mechanical properties, simple manufacturing processes, and ease of installation and maintenance. In recent years, incidents of cable defects caused by buffer layer ablation have been reported in domestic and international cities. Damage or defects in the buffer layer, such as ablation, wear, or cracks, may lead to severe cable failures, including fires or power outages. Therefore, regular inspection of high-voltage cable buffer layers is critical for maintaining the normal operation of power systems [1–4].
Current methods for detecting ablation defects in high-voltage cable buffer layers include ultrasonic testing, infrared thermography, capacitive imaging, high-frequency electromagnetic testing, and X-ray detection [5–7]. Ultrasonic testing detects internal ablation, voids, or delamination defects by analyzing reflected acoustic waves. Infrared thermography identifies temperature anomalies caused by altered thermal conductivity in ablation regions. Capacitive imaging detects defects through changes in electrical properties. X-ray imaging, however, stands out due to its non-contact nature, non-destructive inspection, and ability to visualize internal structures, making it a vital tool for identifying internal defects such as pores, cracks, or inclusions without sample destruction [8, 9].
Nevertheless, X-ray detection of high-voltage cable buffer layers faces challenges such as environmental noise, scattered radiation, and equipment instability, which degrade image quality and hinder accurate defect identification. Signal attenuation in thick buffer layers further reduces image resolution. Additionally, the large volume of X-ray data demands high-performance computing and advanced image processing algorithms [10, 11]. To address these issues, this study focuses on optimizing X-ray images to enhance defect visibility, enable automated defect recognition, and implement magnification functions for improved diagnostic efficiency.
2 Image processing algorithm
2.1 Image enhancement
Retinex theory is an image enhancement method that simulates the human visual system, especially suitable for low light or low contrast images [12, 13]. The fundamental principle of Retinex theory is to decompose an image into reflective and illumination components, and enhance the image by adjusting the illumination component. Its theoretical foundation is the trichromatic theory and colour constancy. Specifically, an object’s color is determined by its ability to reflect long-wave, medium-wave, and short-wave light, not by the absolute intensity of the reflected light. Due to this property, the object’s color remains unaffected by non-uniform illumination, demonstrating consistency. Retinex theory is grounded in this principle of color constancy.
In contrast to the traditional linear and non-linear methods that can only enhance a certain type of features in an image, Retinex can strike a balance between dynamic range compression, edge enhancement and colour constancy, and therefore can adaptively enhance a wide range of different types of images. Retinex theory suggests that the image I (x, y) is the final image data we get, consisting of an illumination image and a reflection image. Firstly, it is illuminated by the incident light, then reflected by the object into the imaging system, and finally forms the image we see, as shown in the following equations: the former refers to the illumination component, which describes the distribution of the ambient light, and is usually a low-frequency signal (e.g., shadows, luminance gradient), denoted by L (x, y); and the latter refers to the reflection component, which reflects the intrinsic properties of the object (e.g., texture, colour), and is a high-frequency signal, denoted by R (x, y), as shown in Equation 1. The Retinex image principle as illustrated in Figure 1.
FIGURE 1
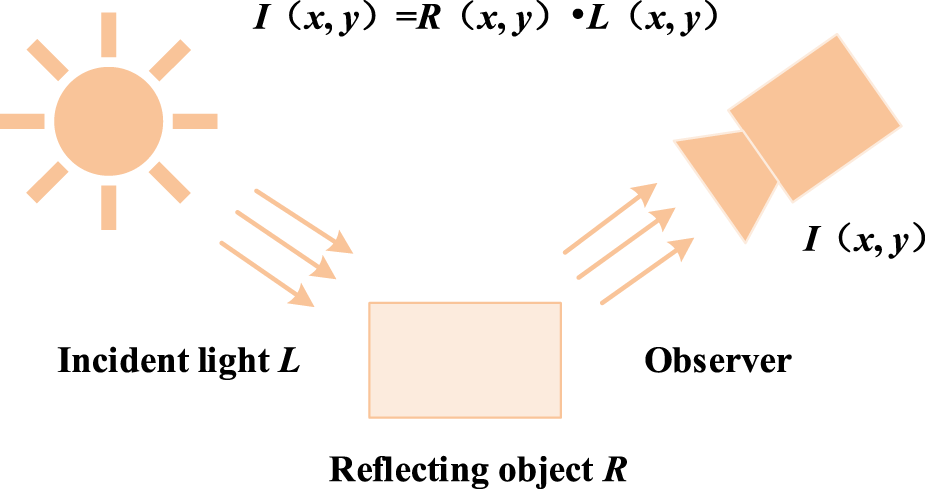
Principle of Retinex theory.
The Retinex-based image processing method is illustrated in Figure 2. Since the logarithmic domain closely mimics the human visual system’s perception of brightness, the entire process is transformed into logarithmic operations. By estimating and removing the illumination component l(x,y), the enhanced reflection component r(x,y) can be obtained. This conversion not only aligns with human visual perception but also reduces computational complexity by transforming multiplicative operations into additive ones, as shown in Equation 2 and Equation 3.
FIGURE 2
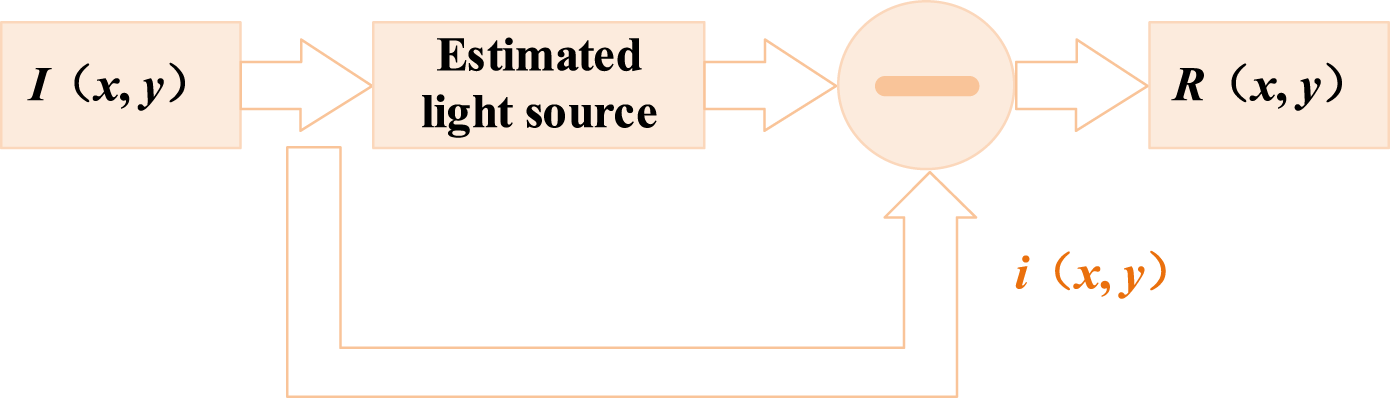
Flowchart of Retinex image processing method.
There are several variants of the Retinex algorithm, with the most common being Single Scale Retinex (SSR), Multi-Scale Retinex (MSR), and Multi-Scale Retinex with Colour Restoration (MSRCR) [14, 15]. Among these, Multi-Scale Retinex extends Single Scale Retinex by applying multiple sigma values [16] and computing a weighted average of the SSR results across different scales. This approach enhances the final image and better handles illumination variations at different scales, as demonstrated in Equation 4.
This study employs the Multi-Scale Retinex with Color Restoration (MSRCR) algorithm for image enhancement [17]. The detailed implementation workflow of this algorithm is illustrated in Figure 3. The method adds a color restoration step to MSR, restoring color by applying logarithmic operations to each channel’s pixel values and multiplying them by coefficients alpha and beta, thereby better preserving image color information. Additionally, since the Retinex algorithm compresses the original image’s dynamic range, grayscale stretching is applied to the processed image to enhance its grayscale dynamic range. Color restoration in MSR is usually computed using Equation 5 [18].
FIGURE 3
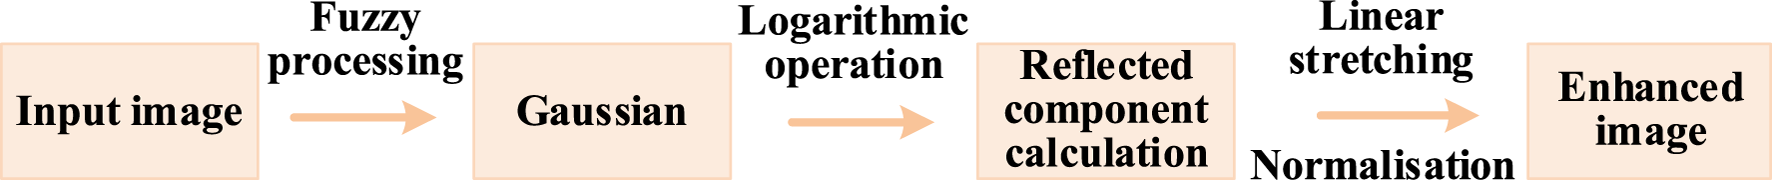
Multi-scale Retinex algorithm flow.
For the selection of intermediate parameters, the standard deviation (sigma) of the Gaussian filter determines the smoothness of the illumination component, a smaller sigma preserves more detail while a larger sigma better handles global lighting variations. The weight distribution (weight_list) typically employs uniform weighting (e.g [1/3, 1/3, 1/3]), but these can be adjusted based on image characteristics. The color restoration coefficient (alpha) should be set between 100–200, with the exact value requiring further adjustment according to the specific image.
The application of Retinex image processing algorithms to cable buffer layer X-ray images solves, to some extent, the traditional problems of high noise and low contrast in X-ray images, and small differences between defects and background. It has the following advantages:
(1) Simulation of human vision with excellent colour constancy;
(2) Multi-scale processing adapts to different lighting conditions;
(3) Dynamic range compression balanced with detail enhancement.
2.2 Image feature detection
The SURF detection algorithm is a feature detection and description algorithm used in image processing, which maintains the robustness of the SIFT algorithm while significantly enhancing computational efficiency through algorithmic optimizations. In contrast to the SIFT algorithm, which employs the difference of Gaussians pyramid to detect scale-space extrema, the SURF algorithm utilizes the Fast Hessian matrix for extremum detection, an improvement that grants it superior performance in scale-space computation [19]. Innovatively, the SURF algorithm introduces the Integral Image technique, which efficiently computes gradients and feature descriptors within the neighborhood of keypoints, thereby substantially accelerating the computational process. Owing to its good invariance to scale, rotation, and affine transformations, as well as its faster processing speed, the SURF algorithm demonstrates stronger applicability in scenarios with high real-time requirements. The feature extraction process of the SURF algorithm can be primarily divided into three parts: feature point detection, feature point orientation assignment, and feature descriptor generation.
2.2.1 Feature point detection
For keypoint localization, SURF utilizes integral images and Boxfilter to efficiently compute the Hessian matrix. The locations and scales of feature points are determined by comparing the extremum of the Hessian matrix determinant. In contrast to the SIFT, which relies on the DOG operator, SURF constructs a multi-scale spatial pyramid by dynamically adjusting the size and variance parameters of the Box filters [20]. Constructing the Hessian matrix to construct the Gaussian image pyramid: First, the scale space is constructed for the input image. This usually involves constructing a pyramid of images using Gaussian filters to detect features at different scales by using images at different scales. SURF uses a Hessian matrix determinant approximation of the image. A Hessian matrix is a square matrix consisting of the second-order partial derivatives of a real-valued function whose independent variables are vectors. For ease of arithmetic, the function f (x, y) is assumed and the Hessian matrix H is a square matrix consisting of the second order partial derivatives of the function. The Hessian matrix at a given pixel location in the image is shown in Equation 6.
For each pixel in the image, a corresponding Hessian matrix can be computed. The sign of the matrix determinant det(H) determines whether the point represents an extremum. To ensure scale invariance of feature points, Gaussian smoothing must be performed prior to Hessian matrix construction. The computational procedure consists of two steps: first applying Gaussian filtering to the image, followed by per-pixel Hessian matrix calculation, with the detailed formulation provided in Equation 7.where L (x, y) represents the multi-scale representation of an image, which is essentially obtained by convolving the Gaussian kernel G(t) with the original image function I(x) at point x, yielding Gaussian-smoothed images at different scales. To optimize the trade-off between approximation error and precision, a scale-adaptive weighting coefficient is introduced. Accordingly, the discriminant of the Hessian matrix can be expressed by Equation 8.where the coefficient 0.9 is used to balance the approximation error of the Gaussian filter.
During keypoint detection, each pixel is first evaluated based on its Hessian matrix response value. A preliminary localization of keypoints is achieved by comparing each pixel with its 26 neighboring points in both the 2D image space and the scale-space domain to identify local extrema. Subsequently, unstable keypoints with low contrast are filtered out through thresholding, and edge response points are eliminated to correct mislocalizations. This ensures that only stable keypoints with significant feature responses are retained. For the detected extremum points (either maxima or minima), a quadratic interpolation method is applied to further refine their spatial positions and scale parameters. This optimization enhances localization accuracy to sub-pixel precision and yields floating-point scale information.
2.2.2 Feature point orientation assignment
In SURF, the orientation assignment of feature points is achieved by analyzing Haar wavelet responses within a circular neighborhood around each feature point [21]. As illustrated in Figure 4, the left template computes the response in the x-direction, while the right template computes the response in the y-direction. The weights are assigned such that darker regions have a coefficient of −1, whereas lighter regions have a coefficient of +1.
FIGURE 4
Schematic diagram of Haar wavelet filter model.
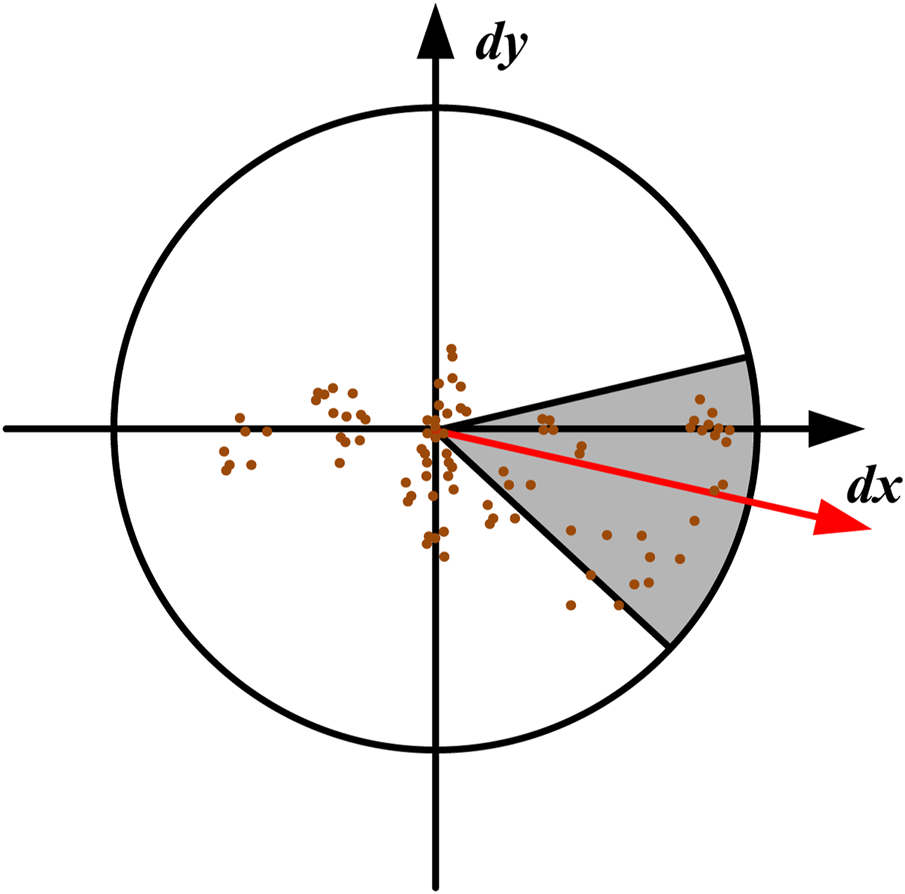
In the circular neighborhood of the feature point, the sum of horizontal and vertical Haar wavelet features of all the points in the 60-degree sector is counted, and then the sector is rotated at certain intervals and after counting the values of the Haar wavelet features in the region again, the direction of the sector with the largest value is finally taken as the main direction of the feature point. The schematic diagram of feature point direction assignment is shown Figure 5. The specific method is to first draw a circle with a diameter of 6s at the location of the feature point, with s as the scale. Calculate the HaarX and HaarY features at each point in this circle sampled at s*s intervals, and calculate the feature direction of each point at the same time: θi = arctan (HaarY/HaarX). The respective sums sumX and sumY of the HarrX and HarrY of the points falling within the angular range of the sector are counted in a 60-degree sector, which is rotated around the center with an accuracy of 15° at a time, and the direction of the sector that maximizes the modal length of sum is selected as the direction of the feature point. If a secondary peak exists with magnitude exceeding 80% of the maximum response, multi-directional feature points are generated.
FIGURE 5
Schematic of feature point direction assignment.
2.2.3 Feature descriptor generation
To generate 64- or 128-dimensional vectors describing the texture information around feature points, the following procedure is employed: First, a 20σ×20σ region centered at the feature point is divided into 4 × 4 sub-regions. Within each sub-region, the horizontal and vertical Haar wavelet responses (dx and dy) are computed at 25 uniformly sampled points, and four key statistical measures are aggregated: the sum of horizontal responses (∑dx), the sum of absolute horizontal responses (∑|dx|), the sum of vertical responses (∑dy), and the sum of absolute vertical responses (∑|dy|). Each sub-region contributes four feature values, ultimately forming a 64-dimensional descriptor vector. Finally, normalization is applied to enhance the descriptor’s robustness to illumination variations, thereby achieving an effective representation of local texture information. A schematic diagram of the feature descriptor generation principle is illustrated in Figure 6.
FIGURE 6
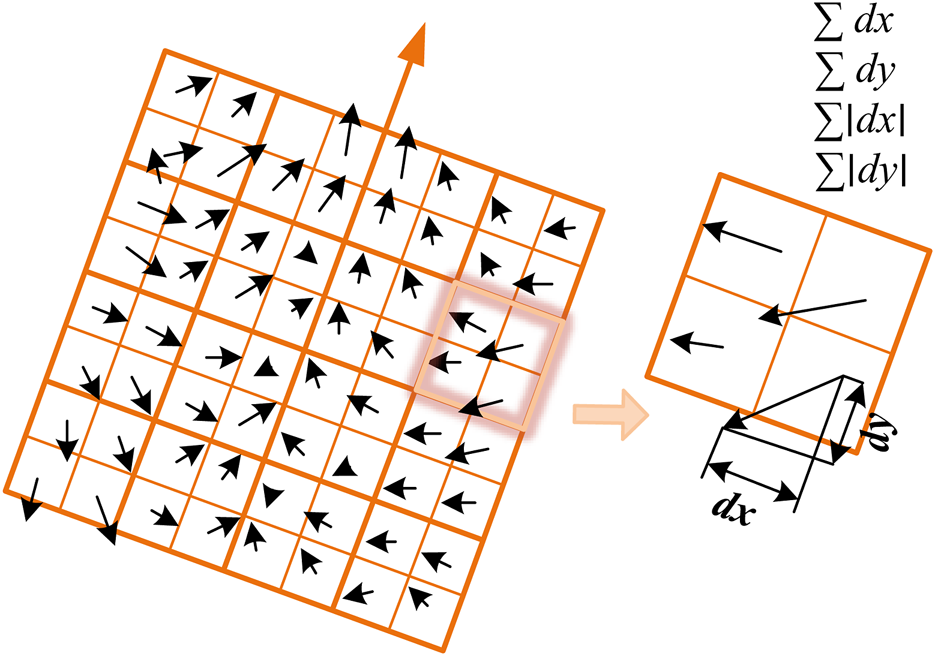
Schematic diagram of feature descriptor generation.
2.2.4 Optimization scheme for feature detection algorithm
In the imaging optimization process for X-ray defect detection in high-voltage cable buffer layers, the SURF algorithm exhibits the following application limitations: It is prone to false detections in high-texture regions, and complex backgrounds tend to generate redundant feature points. Additionally, the algorithm demonstrates insufficient sensitivity to low-contrast features, necessitating parameter tuning when processing blurred or low-contrast defects (such as those in X-ray imaging).
This study focuses on feature detection optimization in the following aspects, which significantly improves defect detection accuracy, enhances operational convenience, and further optimizes performance: 1) Adjustment of Hessian threshold: When the image contrast is relatively low, the detection algorithms with high thresholds have difficulty in accurately detecting the image, and therefore the thresholds can be appropriately lowered to increase the sensitivity to the weak features. 2) Multiscale analysis: Increase the number of Octave layers to capture defects of different sizes, and at the same time refine the scale level to improve the detection of small defects. 3) Orientation constraints: Limit the orientation range for the axial features of the cable. 4) Defect amplification display: Lanczos3 interpolation and amplification method is used, Lanczos3 is a high-quality image interpolation algorithm, and its core idea is to reconstruct the pixel values by the product of the window function (Lanczos window) and the sinc function, which reduces the ringing effect while preserving the image details.
The Lanczos3 interpolation kernel consists of two components: The ideal signal reconstruction sinc function, whose equation is given by Equation 9.
Lanczos window function: Limits infinite oscillations of the sinc function, reducing the amount of computation and ringing effects. The Lanczos3 window is defined as Equation 10.where the parameter “3” indicates that the window coverage is [-3, 3][-3, 3], six neighboring pixels are considered in each direction.
For the target pixel position x, the interpolated result can be obtained by calculating the weighted sum of its neighboring pixels, as formally expressed in Equation 11.
3 Results and discussion
A section of cable buffer layer X-ray inspection images as an example of optimization processing, before and after the comparison results are shown in Figure 7.
FIGURE 7
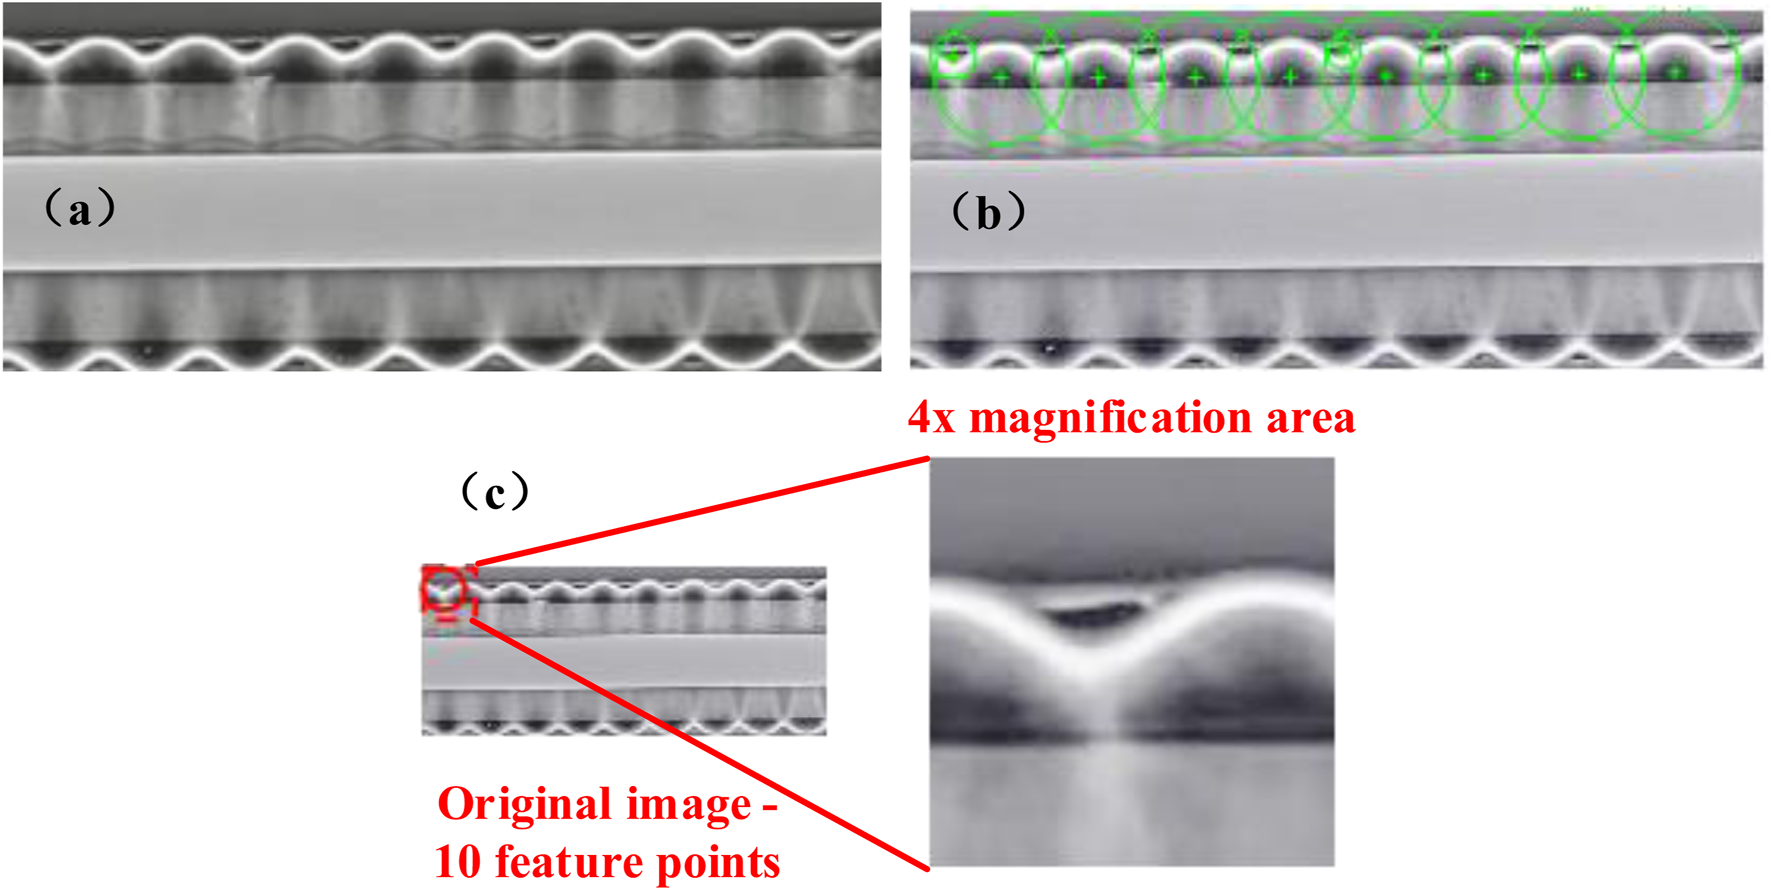
Detection optimization results, (a) Original image, (b) Feature point, (c) Zoomed-in map for individual feature point extraction.
For high-voltage cable buffer layer X-ray defect detection images, the Lanczos3 interpolation amplification method can more accurately reconstruct the image edges and texture through a wider neighborhood (6 × 6) sampling, especially suitable for amplifying low-contrast defects (such as the cable buffer layer of the small cracks). Furthermore, the window function L(x) can effectively attenuate the high-frequency oscillation of the sine function, reducing the “ghosting” phenomenon at the edges, which is more suitable for high-precision defect analysis, such as detection of tiny bubbles or cracks in X-ray images, and its high-fidelity characteristics can significantly improve the usability of the magnified area, helping to accurately identify tiny defects. At the same time, through a reasonable choice of interpolation algorithms and the use of hardware acceleration, the efficiency and quality can be taken into account. The algorithm in this paper performs better in enhancing the color reproduction and detail clarity of the image, which is more in line with the vision of the human eye, and has different types of enhancement effects on images with different characteristics, possessing different advantages and processing images more comprehensively.
4 Conclusion
The integrated approach combining Retinex-based image enhancement algorithms with SURF-optimized feature detection significantly improves the quality of X-ray images for high-voltage cable buffer layer inspection. This method effectively enhances the discernibility of low-contrast defects while enabling automated defect detection and magnification. Meanwhile, the average processing time for a single image after GPU acceleration is 100–300 ms, which can be close to real-time processing to provide reliable support for operational condition assessment by inspection personnel. With demonstrated advantages in luminance adjustment, detail enhancement, and noise suppression, the processed images exhibit more natural visual representation and superior clarity, meeting the requirements of diverse inspection scenarios.
Statements
Data availability statement
The original contributions presented in the study are included in the article/supplementary material, further inquiries can be directed to the corresponding author.
Author contributions
BL: Writing – original draft, Writing – review and editing. WW: Writing – original draft. TL: Writing – original draft. ZX: Writing – original draft. XK: Writing – review and editing. XZ: Writing – review and editing. YC: Writing – review and editing.
Funding
The author(s) declare that financial support was received for the research and/or publication of this article.
Conflict of interest
Authors BL, WW, TL, ZX, XK, XZ, and YC were employed by Shangqiu Power Supply Bureau of Henan Power Supply Grid Co., Ltd.
The authors declare that this study received funding from State Grid Henan Electric Power Company Science and Technology Project “Research on the ablation characteristics of the buffer layer of wrinkled aluminum-sheathed high-voltage cables and detection optimisation technology” (5217B0240003). The funder had the following involvement in the study: study design, data collection and analysis, decision to publish, and preparation of the manuscript.
Generative AI statement
The author(s) declare that no Generative AI was used in the creation of this manuscript.
Publisher’s note
All claims expressed in this article are solely those of the authors and do not necessarily represent those of their affiliated organizations, or those of the publisher, the editors and the reviewers. Any product that may be evaluated in this article, or claim that may be made by its manufacturer, is not guaranteed or endorsed by the publisher.
References
1.
ZhangHGaoJWuKZhaoGSuiHZhangKet alEffects of the inhomogeneous microstructures on buffer layer ablation failure in high voltage cables. Eng Fail Anal (2023) 152:107491. 10.1016/j.engfailanal.2023.107491
2.
ZhengZChenYZhongXFanQZhangJWuRet alCumulative effect of reignition overvoltage caused by vacuum circuit breaker on shunt reactor insulation in offshore wind farm. IEEE Trans Power Del (2025) 40:1158–68. 10.1109/TPWRD.2025.3542392
3.
ChengYHaoYChenYHuiBFuMYangLet alEffects of condition of water blocking tape on the buffer layer failures of high voltage XLPE cables in electric field and temperature field. Eng Fail Anal (2022) 131:105823. 10.1016/j.engfailanal.2021.105823
4.
LiYLiuYZhaoQZhouKChenYKongJ. Mechanism of status evaluation for water blocking buffer layer of high-voltage cable based on characteristic gas analysis. IEEE Trans Dielectr Electr Insul (2024) 31:2216–25. 10.1109/TDEI.2024.3399178
5.
LiuJMaMLiuXXuH. High-voltage cable buffer layer ablation fault identification based on artificial intelligence and frequency domain impedance spectroscopy. Sensors (2024) 24:3067. 10.3390/s24103067
6.
RenZGaoJZhangHTangYWuKLiJ. Understanding electrical conductivity deterioration of buffer layer in high-voltage cables under electrohumid stress. IEEE Trans Dielectr Electr Insul (2024) 31:2768–75. 10.1109/TDEI.2024.3388410
7.
ZhanHZhangJLanYZhangFHuangQZhouKet alAdaptive enhancement of thermal infrared images for high-voltage cable buffer layer ablation. Processes (2024) 12:2543. 10.3390/pr12112543
8.
ConnollyC. X‐ray systems for security and industrial inspection. Sens Rev (2008) 28(28):194–8. 10.1108/02602280810882535
9.
LiaoMLiLDuanXChenDLiuF. Local source-translation ct imaging for testing in-service high-voltage cables. Acta Opt Sin (2022) 42:1611002. 10.3788/AOS202242.1611002
10.
EilbertRFShiS. Improved imaging for X-ray inspection systems. IEEE Aerosp Electron Syst Mag (2005) 20:23–8. 10.1109/MAES.2005.1412123
11.
WangJDingWLiuYZhengZGeC. Application of X-ray inspection for ultra high voltage gas-insulated switchgear. IEEE Trans Power Del (2019) 34:1412–22. 10.1109/TPWRD.2019.2903531
12.
GanegodaASelichaJWangZSaddaSRHuZ. Automated retinal layer segmentation using graph-based algorithm incorporating deep-learning-derived information. Sci Rep (2020) 10:9541. 10.1038/s41598-020-66355-5
13.
SrinidhiCLAparnaPRajanJ. Automated method for retinal artery/vein separation via graph search metaheuristic approach. IEEE Trans Image Process (2019) 28:2705–18. 10.1109/TIP.2018.2889534
14.
SikderNMasudMBairagiAKArifASMNahidAAAlhumyaniHA. Severity classification of diabetic retinopathy using an ensemble learning algorithm through analyzing retinal images. Symmetry (2021) 13:670. 10.3390/sym13040670
15.
AlwazzanMJIsmaelMAAhmedAN. A hybrid algorithm to enhance colour retinal fundus images using a wiener filter and clahe. J Digit Imaging (2021) 34:750–9. 10.1007/s10278-021-00447-0
16.
ZhangSWangTDongJYuH. Underwater image enhancement via extended multi-scale Retinex. Neurocomputing (2017) 245:1–9. 10.1016/j.neucom.2017.03.029
17.
PetroABSbertCMorelJM. Multiscale retinex. Image Process On Line (2014) 107:71–88. 10.5201/ipol.2014.107
18.
JiangBWoodellGAJobsonDJ. Novel multi-scale retinex with color restoration on graphics processing unit. J Real-time Image Proc (2015) 10:239–53. 10.1007/s11554-014-0399-9
19.
LiJWangYWangY. Visual tracking and learning using speeded up robust features. Pattern Recogn Lett (2012) 33:2094–101. 10.1016/j.patrec.2012.08.002
20.
BayHEssATuytelaarsTVan GoolL. Speeded-Up robust features (SURF). Comput Vis Image Underst (2008) 110:346–59. 10.1016/j.cviu.2007.09.014
21.
ZhangXYounanNHO'HaraCG. Wavelet domain statistical hyperspectral soil texture classification. IEEE Trans Geosci Remote Sens (2005) 43:615–8. 10.1109/TGRS.2004.841476
Summary
Keywords
X-ray detection, image optimization, defect detection, retinex algorith m, SURF (speeded-up robust features) 1
Citation
Liu B, Wang W, Liu T, Xu Z, Kong X, Zhou X and Cheng Y (2025) Image optimization method for ablation defects in high-voltage cable buffer layers based on X-ray detection technique. Front. Phys. 13:1604821. doi: 10.3389/fphy.2025.1604821
Received
02 April 2025
Accepted
29 April 2025
Published
16 May 2025
Volume
13 - 2025
Edited by
Li Zhang, Shandong University, China
Reviewed by
Tiandong Zhang, Harbin University of Science and Technology, China
Jian Wang, North China Electric Power University, China
Updates
Copyright
© 2025 Liu, Wang, Liu, Xu, Kong, Zhou and Cheng.
This is an open-access article distributed under the terms of the Creative Commons Attribution License (CC BY). The use, distribution or reproduction in other forums is permitted, provided the original author(s) and the copyright owner(s) are credited and that the original publication in this journal is cited, in accordance with accepted academic practice. No use, distribution or reproduction is permitted which does not comply with these terms.
*Correspondence: Baiyuan Liu, 1069599142@qq.com
Disclaimer
All claims expressed in this article are solely those of the authors and do not necessarily represent those of their affiliated organizations, or those of the publisher, the editors and the reviewers. Any product that may be evaluated in this article or claim that may be made by its manufacturer is not guaranteed or endorsed by the publisher.