 Peng Xia1
 Suyang Zhou
- 1State Grid Energy Research Institute Co. Ltd., Beijing, China
- 2School of ElectricalEngineering, Southeast University, Nanjing, China
This paper addresses the current challenges in coordinating interactions between the power market and the carbon market, particularly the shortcomings arising from the insufficient consideration of renewable energy subsidies. To tackle these issues, we propose a collaborative optimization approach for an integrated electric–carbon market that incorporates a renewable subsidy mechanism. The aim is to foster deeper integration between the power and carbon markets, enhance the share of clean energy in the overall mix, and drive low-carbon transitions. A joint market clearing model is constructed that explicitly includes renewable subsidy costs in the objective function, thereby capturing the true cost-benefit dynamics of renewable projects. A case study based on a regional power system demonstrates the model’s effectiveness and feasibility, with the Particle Swarm Optimization (PSO) algorithm successfully converging to a near-optimal solution. This research not only provides theoretical support for the real-world application of coordinated electric–carbon market operations but also offers significant practical value by incorporating renewable energy incentives into the market design.
1 Introduction
Global climate change requires reducing emissions and advancing low-carbon energy transitions. As the world’s largest emitter, China has set ambitious ‘dual carbon’ goals—carbon peaking and neutrality—through clean energy expansion and energy market optimization. Renewable energy is central to these goals and relies heavily on policy support for large-scale growth. The 2011 Renewable Energy Development Fund marked China’s commitment to accelerating renewable energy through subsidies. Both the power and carbon markets are critical for low-carbon transitions: the power market optimizes energy allocation with price signals, while the carbon market incentivizes emission reductions with carbon pricing. Coordinating these markets is key to achieving low-carbon goals.
The power market determines electricity prices through competition, optimizing resource allocation [1]. Power generators decide output based on demand and costs, while consumers choose suppliers based on price signals. Government policies ensure market fairness, efficiency, and sustainability. The carbon market reduces emissions through market-based mechanisms, with emission allowances allocated by the government and traded among companies. Companies that emit less than their allowance can sell surplus, while those exceeding their allowance must buy more permits [2]. This incentivizes emission reductions and supports low-carbon transitions. Research on integrating electric and carbon markets has progressed, particularly with diverse market clearing models. For example, Yuan et al. [3] proposed a model to enhance thermal power flexibility, Feng and Zhang [4] developed a two-stage optimization model that increases thermal power revenue and renewable energy integration, and Qu et al. [5] introduced a multi-energy model that reduces emission costs by 23%. Studies have also explored renewable energy integration, with Alizadeh et al. [6] emphasizing the role of thermal power flexibility and demand-side response in mitigating renewable variability. Additionally, Zhao et al. [7] proposed a carbon trading framework for virtual power plants (VPPs), demonstrating a 14% revenue increase but highlighting the need for subsidies. Garoarsdottir et al. [8] showed that improving thermal power cycling can reduce wind curtailment by 8%–15%, and Zhang et al. [9] found that interprovincial carbon trading yields greater economic benefits than intraprovincial trading. However, renewable energy subsidies are not yet fully integrated into market clearing models, limiting their economic impact. The Variable-Temporal Carbon Heat Rate (V-TCHR) model by Akpan and Fuls [10] highlights that fixed
This paper develops a market clearing model for integrated electric-carbon markets, incorporating renewable energy subsidies, and validates the model through a regional power system case study. We assume rational participants aiming to maximize their payoffs: power generators decide output based on electricity and carbon prices, while consumers choose suppliers based on prices [15]. Participants have access to accurate market information, and emission allowances are allocated using a baseline method. For simplicity, we assume that: (1) all participants are price takers; (2) carbon allowance supply is fixed or changes based on specific rules; (3) electricity demand is constant in the short term; and (4) power generators use both fossil fuels and clean energy. These assumptions focus the analysis on the impact of renewable energy subsidies. This study offers valuable insights for improving coordination between power and carbon markets and assessing the effect of subsidy policies on clean energy use.
2 Construction of the electric-carbon joint market collaborative optimization model
2.1 Generation cost
This study focuses on thermal power generation, specifically including coal-fired and gas-fired power plants, as well as renewable energy generation such as wind and solar power. According to the research by Al-Hasan [16], the generation cost
where
For renewable energy plants (such as wind and solar), the costs are mainly attributed to capital costs and operational maintenance costs, as these technologies do not require fuel. The generation cost
where
Thus, the total generation cost
2.2 Carbon cost
In the electric-carbon market clearing model, we need to separately consider carbon emissions and carbon allowances for conventional power plants (coal, gas) and renewable energy plants (wind, solar). The carbon trading cost is mainly determined by the carbon emissions, carbon allowances, and the carbon market price [18]. If the emissions exceed the allocation, the plant must purchase additional carbon allowances. Conversely, if there are excess allowances, the plant can sell them and gain revenue. The allocation of carbon allowances for conventional power plants is typically done using the baseline method, based on the plant’s generation and industry carbon emission standards, yielding the carbon allocation
where
If the actual carbon emissions
where
Unlike conventional plants, renewable energy plants (wind, solar) do not directly emit
where
Thus, the total carbon trading cost
2.3 Renewable energy subsidy cost
The government typically provides subsidies to renewable energy plants, but the environmental benefits from the displacement of fossil fuel generation should also be taken into account. The total renewable energy subsidy cost
where
Renewable energy generation displaces fossil fuel generation, reducing greenhouse gas emissions. If each unit of
Thus, the renewable energy subsidy cost
2.4 Constraints
In the electric-carbon joint market clearing, several constraints must be satisfied to ensure the stability and safe operation of the system, as shown in Equations 12–18.
2.4.1 Power output constraints
2.4.1.1 Conventional power plants
where
2.4.1.2 Renewable energy plants
where
2.4.2 Transmission line capacity constraints
2.4.2.1 Power flow constraints
where
2.4.2.2 Ramp Rate Constraints
To ensure smooth operation of the power plants, the output change between adjacent periods should remain within reasonable limits
where
2.4.3 Node power balance constraints
where
2.4.4 Renewable energy generation proportion constraint
where
Based on these constraints, the system’s total cost is minimized over 24 trading periods. The objective function is given by Equation 19:
where
3 Case study
To verify the effectiveness of the proposed method, a test system is set up with one coal-fired unit (G1), one gas-fired unit (G2), one wind unit (R1), and one photovoltaic (R2) unit for a 24-h market clearing simulation. We employ the PSO algorithm to solve the objective function, which integrates the generation cost of conventional units, the generation cost of renewable energy units, the carbon trading cost, and the renewable subsidy cost. In the actual solution process, to address various constraints—such as unit output limits, ramping constraints, power flow balance, and line capacity restrictions—a penalty function is introduced. Constraint violations are penalized by adding large penalty terms to the objective function.
3.1 Parameter settings
3.1.1 Thermal unit cost parameters
The cost function for the coal-fired unit is given by Equation 20, and the cost function for the gas-fired unit is given by Equation 21.
3.1.1.1 Coal-fired unit (G1)
3.1.1.2 Gas-fired unit (G2)
3.1.2 Renewable unit cost parameters
3.1.2.1 Wind Unit (R1)
Using a levelized cost of electricity (LCOE) approach, the capital cost is
3.1.2.2 PV Unit (R2)
Similarly, the capital cost is
3.2 Carbon market parameters
Carbon allowances are allocated based on a baseline method, with an emission factor of
3.3 Renewable subsidy parameters
Again, adopt
3.4 Other constraints
3.4.1 Power-flow constraints for conventional units
Consider a grid with three nodes and two transmission lines, where the line data are given as the Table 1.
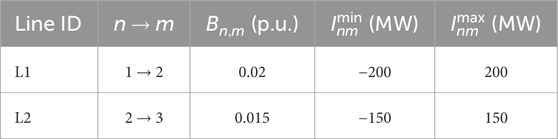
Table 1. Line parameters.
Voltage phase-angle constraints are given by Equation 22:
3.4.2 Power-flow constraints for renewable units
The renewable units share the same grid lines as the conventional units, with the same line limits and phase-angle constraints.
3.4.3 Thermal unit output constraints
The thermal unit output constraints for the coal unit and gas unit are given by Equations 23, 24.
3.4.3.1 Coal unit (G1)
3.4.3.2 Gas unit (G2)
3.4.4 Renewable unit output constraints
The renewable unit output constraints for the wind unit and PV unit are given by Equations 25, 26.
3.4.4.1 Wind unit (R1)
An example of the forecasted wind output

Table 2. Example time segment and power output for wind unit.
3.4.4.2 PV unit (R2)
The forecasted PV output for sample time segments is as Table 3.

Table 3. Example time segment and power output for PV unit.
3.4.5 Renewable penetration constraint
The renewable penetration constraint is given by Equation 27.
which ensures that the renewable generation at any time does not exceed 60% of the total load.
Figure 1 shows how the Particle Swarm Optimization (PSO) algorithm converges to a near-optimal solution over 1,000 iterations. The horizontal axis represents the number of iterations, and the vertical axis indicates the objective function value. At the beginning of the process, the objective function value is relatively high (around
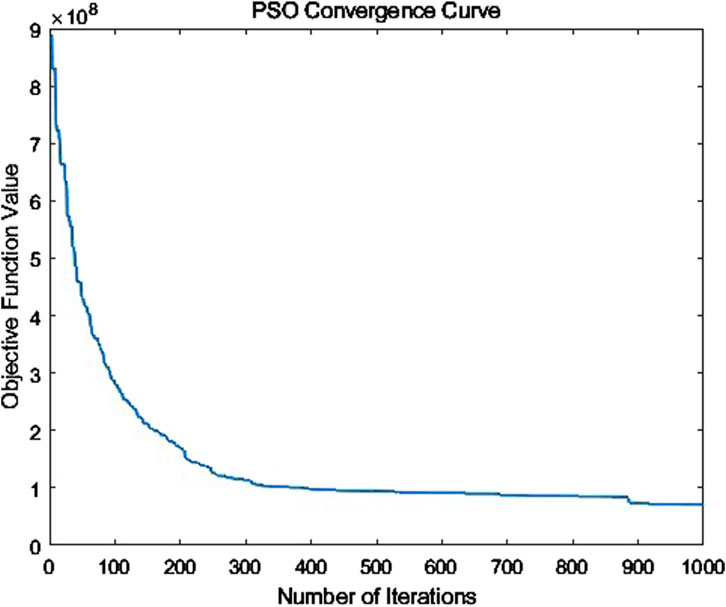
Figure 1. The optimal objective value.
Figure 2 demonstrates the trade-off between reducing
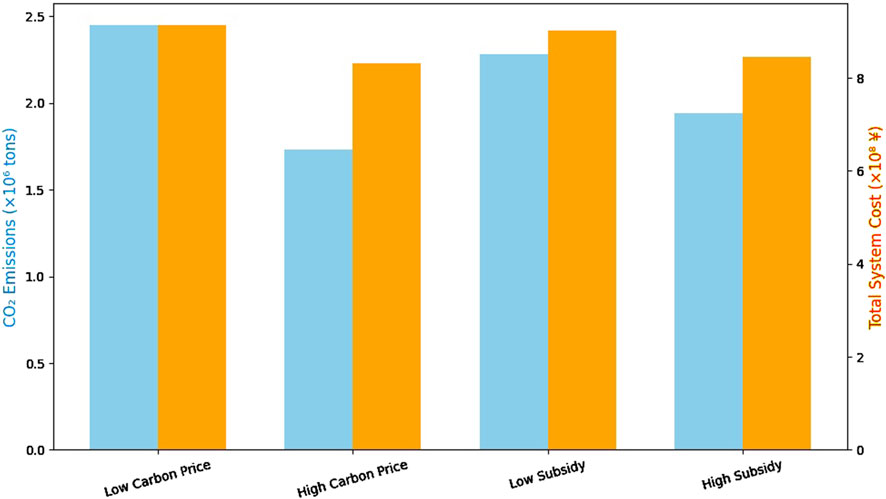
Figure 2. Effect of Carbon Price and Subsidy Rate on
4 Conclusion
This paper introduces a renewable energy subsidy mechanism to address limitations in current electric-carbon joint market clearing models, specifically the insufficient consideration of renewable subsidies. The key findings are as follows: 1. A joint electric-carbon market clearing model is proposed, incorporating renewable subsidies. This model overcomes the traditional market shortcoming of neglecting renewable energy incentives. By integrating renewable subsidy costs into the objective function, the total system cost is more comprehensively captured, and market signals more accurately reflect the cost-effectiveness of renewable projects. 2. Strengthening the connection between renewable subsidy policies and market clearing mechanisms ensures effective coordination between policy goals and market operations. This alignment promotes an optimized energy mix and supports the achievement of low-carbon transition targets. 3. The model accounts for the bidirectional interaction between the power market and the carbon market, achieving a dynamic balance that fosters the innovation and development of clean energy technologies. To further enhance the joint electric-carbon market clearing model and its handling of renewable subsidies, we suggest the following directions for future research: 1. Future research can incorporate uncertainties such as renewable output forecast errors and carbon price fluctuations. This would improve the model’s robustness, adaptability, and practical applicability. 2. Investigating the coordination between mid-to long-term carbon allowance allocations and short-term market clearing could improve policy continuity and ensure the stability and effectiveness of market mechanisms over time. 3. Exploring interconnections between cross-regional electric-carbon markets would enable broader resource optimization, increase energy utilization efficiency, and enhance market competitiveness. Based on our findings, we recommend the following policy actions: 1. Design renewable energy subsidies that are dynamic and performance-based, adjusting according to regional integration capabilities and marginal system benefits. 2. Develop coordinated carbon allowance allocation mechanisms that balance baseline allocation with incentives for flexibility improvements in power generation systems. 3. Establish stronger coordination between market operators and regulators to harmonize electricity prices with carbon pricing signals, ensuring a more effective and efficient market structure.The proposed joint electric-carbon market clearing model incorporating renewable subsidies offers significant theoretical and practical value. It enhances synergy between the power and carbon markets while optimizing resource allocation. As renewable energy technologies advance and policy frameworks evolve, this research has the potential to support deeper market integration and drive progress toward green, low-carbon energy transitions. Future efforts to refine and adapt the model to real-world conditions will be crucial for creating a more sustainable and efficient energy structure.
Data availability statement
The original contributions presented in the study are included in the article/supplementary material, further inquiries can be directed to the corresponding author.
Author contributions
PX: Conceptualization, Methodology, Writing – original draft, Writing – review and editing, Software, Visualization. BY: Conceptualization, Methodology, Writing – original draft, Writing – review and editing. GL: Conceptualization, Methodology, Writing – original draft, Writing – review and editing. QZ: Conceptualization, Methodology, Writing – review and editing. FZ: Conceptualization, Methodology, Writing – review and editing. SZ: Conceptualization, Methodology, Writing – review and editing, Writing – original draft.
Funding
The author(s) declare that financial support was received for the research and/or publication of this article. This study was funded by the State Grid Corporation Headquarters Science and Technology Project of China (1400-202457293A-1-1-ZN71804062); State Grid Energy Research Institute Young Talents Project of China. The funder was not involved in the study design, collection, analysis, interpretation of data, the writing of this article, or the decision to submit it for publication.
Conflict of interest
Authors PX, BY, GL, QZ, and FZ were employed by State Grid Energy Research Institute Co. Ltd.
The remaining author declares that the research was conducted in the absence of any commercial or financial relationships that could be construed as a potential conflict of interest.
Generative AI statement
The author(s) declare that no Generative AI was used in the creation of this manuscript.
Publisher’s note
All claims expressed in this article are solely those of the authors and do not necessarily represent those of their affiliated organizations, or those of the publisher, the editors and the reviewers. Any product that may be evaluated in this article, or claim that may be made by its manufacturer, is not guaranteed or endorsed by the publisher.
References
1. In S, He Y, Li Z, Li S, Wang P, Chen Z. A novel multi-timescale optimal scheduling model for a power–gas mutual transformation virtual power plant with power-to-gas conversion and comprehensive demand response. Energies (2024) 17:3805. doi:10.3390/en17153805
2. Kadeer A, Yang J, Zhao S. Complexity analysis of the interaction between government carbon quota mechanism and manufacturers’ emission reduction strategies under carbon cap-and-trade mechanism. Sustainability (2024) 16:7115. doi:10.3390/su16167115
3. Yuan RS, Liu M, Chen WX, Yan JJ. Costs versus revenues of flexibility enhancement techniques for thermal power units in electricity-carbon joint markets. Energy (2024) 302:131925. doi:10.1016/j.energy.2024.131925
4. Feng SD, Zhang XP. An electricity-carbon joint market optimization model for coal-fired power system under China’s “dual-carbon” target. J Clean Prod (2023) 423:138746. doi:10.1016/j.jclepro.2023.138746
5. Qu KP, Yu T, Huang LN, Yang B, Zhang XS. Decentralized optimal multi-energy flow of large-scale integrated energy systems in a carbon trading market. Energy (2018) 149:779–91. doi:10.1016/j.energy.2018.02.083
6. Alizadeh MI, Moghaddam MP, Amjady N, Siano P, Sheikh-El-Eslami MK. Flexibility in future power systems with high renewable penetration: a review. Renew and Sustainable Energy Rev (2016) 57:1186–93. doi:10.1016/j.rser.2015.12.200
7. Zhao Y, Wang Y, Han M, Zhong LP, Cai KJ. Research on optimization strategy for low carbon joint trading of virtual power plants considering aggregatable resources. In: Proceedings of 2024 international conference on power electronics and artificial intelligence (PEAI 2024) (2024). p. 505–10.
8. Garoarsdottir SO, Goransson L, Normann F, Johnsson F. Improving the flexibility of coal-fired power generators: impact on the composition of a cost-optimal electricity system. Appl Energy (2018) 209:277–89. doi:10.1016/j.apenergy.2017.10.085
9. Zhang WJ, Zhang N, Yu YN. Carbon mitigation effects and potential cost savings from carbon emissions trading in China’s regional industry. Technol Forecast Social Change (2019) 141:1–11. doi:10.1016/j.techfore.2018.12.014
10. Akpan PU, Fuls WF. Cycling of coal fired power plants: a generic co2 emissions factor model for predicting co2 emissions. Energy (2021) 214:119026. doi:10.1016/j.energy.2020.119026
11. Qi C, Choi Y. A study on the co2 marginal abatement cost of coal-fueled power plants: is the current price of China’s pilot carbon emission trading market rational? Carbon Management (2020) 11:303–14. doi:10.1080/17583004.2020.1755596
12. Impram S, Nese SV, Oral B. Challenges of renewable energy penetration on power system flexibility: a survey. Energy Strategy Rev (2020) 31:100539. doi:10.1016/j.esr.2020.100539
13. Liu YQ, Liu S, Shao XY, He YQ. Policy spillover effect and action mechanism for environmental rights trading on green innovation: evidence from China’s carbon emissions trading policy. Renew and Sustainable Energy Rev (2022) 153:111779. doi:10.1016/j.rser.2021.111779
14. Feng YH, Liu QY, Feng DH, Zhou Y. Wind power investment equilibrium guided by reliability option considering electricity-carbon emission trading-trading green certificate joint market. Sustainable Energy Grids and Networks (2024) 37:101275. doi:10.1016/j.segan.2024.101275
Keywords: collaborative optimization, particle swarm optimization, market clearing model, renewable energy subsidy, low-carbon transition
Citation: Xia P, Yuan B, Lu G, Zhao Q, Zhang F and Zhou S (2025) Research on collaborative optimization of the electric-carbon joint market based on renewable energy subsidies. Front. Phys. 13:1606657. doi: 10.3389/fphy.2025.1606657
Received: 06 April 2025; Accepted: 30 April 2025;
Published: 29 May 2025.
Edited by:
Dun Han, Jiangsu University, ChinaCopyright © 2025 Xia, Yuan, Lu, Zhao, Zhang and Zhou. This is an open-access article distributed under the terms of the Creative Commons Attribution License (CC BY). The use, distribution or reproduction in other forums is permitted, provided the original author(s) and the copyright owner(s) are credited and that the original publication in this journal is cited, in accordance with accepted academic practice. No use, distribution or reproduction is permitted which does not comply with these terms.
*Correspondence: Suyang Zhou, MzM0NzE0MjY5MUBxcS5jb20=