 Yanzhi Duan1
 Yi Wang
- 1Research Institute of Natural Gas Economics, PetroChina Southwest Oil & Gasfield Company, Chengdu, China
- 2PetroChina Southwest Oil & Gasfield Company, Chengdu, China
- 3College of Management Sciences, Chengdu University of Technology, Chengdu, China
The causal impacts between economic policy and listed oil companies have been discussed previously, reporting either positive or negative impacts. However, various channels bridge the impacts flowing between them, resulting in multiple causal impacts rather than only a single causal impact. This work employs a dynamics-based causality method, namely, pattern causality, and aims to reveal multiple causal interactions between economic policy and listed oil companies in China. Using the economics policy uncertainty index and the stock prices of nine popular listed oil companies in China from 2006 to 2025, several interesting findings are discovered. 1) Three kinds of causalities exist between economic policy and listed oil companies: positive, negative, and dark causality. Dark causality suggests more complex interactions, which may drive two variables to evolve with fluctuations; 2) rather than only one kind of causality, three heterogeneous causalities exist simultaneously with different magnitudes; 3) the causal impacts between the economic policy and listed oil companies are asymmetric; 4) by comparing the causal magnitudes, dark causality is shown to play a relatively dominant role between economic policy and listed oil companies. These new findings suggest complex interactions between economic policy and listed oil companies, requiring a reassessment of the underlying risks for market participants. Our approaches also offer an alternative perspective on understanding the complexity of social systems.
1 Introduction
The global energy landscape is undergoing a profound transformation, shaped by overlapping forces such as climate change mitigation efforts [1, 2], geopolitical realignments [3, 4], and technological innovation [5]. Central to this transformation is the interplay between economic policy uncertainty (EPU) and the strategic behavior of listed oil companies [6, 7]. As governments grapple with decarbonization targets, energy security concerns, and macroeconomic stabilization, the resultant policy volatility creates both risks and opportunities for oil firms [8]. Conversely, the operational decisions of these firms—ranging from capital expenditure allocations to lobbying activities—significantly influence policy trajectories [9, 10]. This paper explores the bidirectional dynamical impacts between EPU and listed oil companies in China, addressing a critical gap in the literature by analyzing the dynamic feedback mechanisms that characterize their interactions.
Economic policy uncertainty, defined as the ambiguity surrounding future policy actions [11], has surged in recent decades due to factors such as trade wars, regulatory reforms, and the transition to net-zero economies [12, 13]. For the oil sector, which is capital-intensive, politically sensitive, and exposed to long-term demand risks, EPU exacerbates operational challenges [14]. For example, the EU’s evolving carbon pricing framework and the US’s vacillating stance on shale oil subsidies have created a climate of uncertainty that disrupts investment planning (BP, 2022). Conversely, oil company responses—such as divesting from fossil fuels or expanding into renewable energy—can alter policymakers’ perceptions of industry viability, thereby shaping subsequent regulatory choices [13].
Existing studies on EPU and oil firm behavior primarily focus on directional impacts [15, 16]. For instance, a large body of research documents how EPU reduces corporate investment [17], increases financing costs [18], and distorts innovation trajectories [19]. In the energy sector, scholars have examined how policy uncertainty affects renewable energy adoption (Aklin & Urpelainen, 2012) and oil price volatility [20, 21]. However, these studies often treat policy as an exogenous shock, neglecting the role of firms in shaping policy outcomes. The findings are mixed regarding the impacts between EPU and oil firms. Some scholars report negative causal impacts between EPU and firm behavior [22]. For example, some scholars suggest that policy uncertainty may increase uncertainty as it leads to increased costs and, therefore, negatively affects investment behavior. Bloom [23] has reported that increased uncertainty raises the “real option value to wait,” which forces companies to delay their investment until the uncertainty is reduced. In contrast, some literature provides evidence of positive causal impacts. Belderbos et al. [24] reported that firms in across-country investments improve the value of growth options, and this often occurs when high market uncertainty exists in host countries. In summary, the impacts between EPU and listed oil companies are debatable and mixed concerning the directional and bidirectional as well as positive and negative impacts, requiring new techniques to clarify the complex connections between EPU and oil firms.
The interplays between EPU and listed oil companies may occur from various channels, as shown in Figure 1 [25–27]. 1) For investment decision-making. Policy uncertainty increases the unpredictability of a company’s future cash flows, leading oil companies to postpone or reduce long-term capital expenditures such as exploration and development and refining capacity expansion [28]. 2) Financing cost channel. The rise in market risk premiums caused by policy fluctuations is transmitted through debt financing costs and equity financing costs [22]. 3) Expectation management [29]. The ambiguity of policy signals leads to deviations in management’s forecasts of future demand. OPEC + member countries adjusted their monthly production quotas repeatedly due to the repeated release policy of the US Strategic Petroleum Reserve. 4) Supply chain reconfiguration. Changes in trade policies (such as the US sanctions on Venezuelan crude oil) force oil companies to adjust their procurement networks, increasing logistics costs [30]. 5) Tax policy. Changes in policies such as windfall profit taxes directly affect corporate profits (for example, the UK’s Energy Profits Levy in 2022 led to a 12% decline in BP’s quarterly net profit.) 6) Technological innovation. The uncertainty of the carbon pricing mechanism affects the R&D investment of oil companies in carbon capture, utilization, and storage (CCUS) technologies [31]. 7) Market access. The tightening of environmental protection policies (such as the EU’s plan to ban the sale of fuel-powered vehicles by 2030) forces oil companies to adjust their business structures. 8) Consumer expectation [32]. The expected fluctuations in energy prices triggered by policy uncertainty affect terminal demand [33]. 9) Political risk channel [21, 34, 35]. Geopolitical conflicts (such as the Russia–Ukraine war) combined with the uncertainty of energy policies led to the revaluation of the assets of oil companies. These channels form a dynamic feedback mechanism. For example, oil companies influence policy-making through political donations, thus forming a two-way interaction between policies and corporate behavior. It is obvious that some channels may pass positive impacts between economic policy and listed oil companies, while negative impacts flow through other channels. These facts suggest not simply a single causal impact between economic policy and listed oil companies. Moreover, the fluctuation trends between variables are often neither the same nor opposite. In addition to the positive and negative impact patterns, more complex patterns may exist between EPU and listed oil companies.
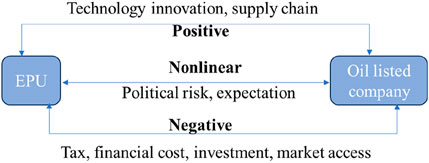
Figure 1. Possible impact patterns and channels between EPU and listed oil companies.
Some scholars aim to detect the interplay and volatility spillover between economic policy and listed oil companies [36, 37]. Another popular approach is causality analysis [38–40]. The Granger causality test is one of the popular causality analysis methods, and it is widely used in economics and finance [41]. Due to the nonlinearity in many real-world systems, the nonlinear Granger causality test was developed to measure nonlinear causal impacts [42]. However, traditional Granger causality methods are based on statistic regression and are reliable for stable series, but they show limitations for unstable series. Moreover, they also show limitations when we must quantify the strength of causal impacts. Transfer entropy is a nonparametric tool that investigates causality by measuring the information flowing between observations. As certified by previous works, transfer entropy is equal to the Granger causality test when the sample datasets are Gaussian distributed [43]. Unlike previous statistical approaches, cross-convergent mapping (CCM) is developed from the dynamics embedded in the state space [44]. It reports that the time series variables are causally linked if they are generated from the same dynamical system and they share a common attractor. The CCM method has a satisfactory ability to detect causality in complex nonlinear systems, which solves the limitation of the Granger causality test.
Although several causal detection techniques are widely used in financial systems, like Granger causality, transfer entropy, and CCM, these methods can only distinguish a single causal impact. For example, only positive or negative causal impacts can be obtained between two observations via traditional methods. This is very limited for practical situations. If there is only a single causal impact (e.g., positive impact) from variable X to variable Y, then the increase (decrease) of X will drive the increase (decrease) of variable Y. In other words, they are more likely to evolve in similar directions. However, these rules are often rare for many real-world observations; their fluctuation associations are complex, neither the same nor opposite directions. The complex causality between them can be partially explained by the aforementioned various channels. Some channels propagate positive impacts, while others flow through negative causal impacts. Thus, we speculate that there may be more than one kind of causal impact between economic policy and listed oil companies and possibly multiple impacts. Thus, more reliable methods are needed to reveal the complex interactions in real-world systems. Stavroglou et al. [45] proposed the pattern causality algorithm (PC) based on the state space reconstruction theory, which can not only detect causality, but it can also quantify causal strength. More importantly, PC can distinguish both positive and negative causal impacts as well as a more complex causal interaction, namely, dark causality.
Thus, this work employs pattern causality methods to examine multiple causality impacts between economic policy and listed oil companies. The study makes three contributions. First, it utilizes a new theoretical framework that captures the complex dynamical causalities between EPU and listed oil firms in China. Second, in addition to the previously reported positive and negative causality, it reveals more complex causal interactions (dark causality) between EPU and the stock prices of listed companies, both positive and negative. Third, it analyzes the dominant causal interactions between economic policy and listed oil companies by quantifying the magnitude of multiple causalities.
The remainder of this paper is organized as follows: Section 2 describes the methods. Section 3 depicts the sample data. In Section 4, we investigate the complex causal impacts between EPU and the stock prices of listed oil companies in China. Section 5 summarizes our main findings.
2 Methods
According to dynamical systems theory, in a dynamic system, if we can estimate the state of component Y based on the dynamics of component X, we can infer causality from variable Y to variable X [46]; the more accurate the estimation can be, and the stronger the causality is. On the other hand, inaccurate estimation indicates variable Y has no dynamics information left in variable X. We speculate that there is no causal interaction from Y to X. According to [44], it is possible to test estimations by the mappings between reconstructed dynamical structures from time series variables. In particular, we can measure the causality by mapping among neighbor points in the reconstructed dynamical structure. The dynamical structure is reconstructed based on the delay embedding theory. Thus, we can test the dynamical causal interactions between variables based on the accuracy of mutual estimations. As we know, the causal interactions between variables can be positive or negative, even in more complex ways. In addition, the strengths of impacts are different for different samples, thus requiring not only causality inference but also the causal strength and causal type.
A dynamics-based causality method is proposed to solve the above issues, namely, pattern causality, which examines causality from X to Y by quantifying how consistently average patterns in the state space of X correspond to average patterns in the state space of Y in contemporaneous neighborhoods. According to pattern causality, there may exist three heterogeneous causal impacts: positive, negative, and dark causalities. A positive causality (i.e., “mutualism”) drives two variables to evolve in the same direction, while opposite forces exist for negative causality (i.e., “competition”). Dark causality suggests more complex interactions that are neither “mutualism” nor “competition,” and it forces two variables to evolve with fluctuations.
Specifically, the main processes of pattern causality are given by four fundamental steps [40, 45]. First, we must make a state space reconstruction from time series [47]. Based on Takens’ theory, we can reconstruct a multidimensional state space from time series using two faithful parameters, that is, embedding dimension E and lag
where l is the length and
Once we get the reconstructed state space for both variables X and Y, we must then determine the average pattern of each point in the state space. The average pattern shows the fluctuation trend in state space. The average pattern of
where d denotes the Euclidean distance, and
The average pattern
Nine patterns exist in a 3-dimensional state space:
Third, we distinguish three kinds of causality based on the average pattern in the state space
After identifying the type of causality, we must quantify the causal strength. The causal strength is measured by the accuracy of cross estimation between state spaces. In particular, we estimate the average pattern of
By examining all state points on
3 Data
This work aims to detect the impact of economic policy on listed oil companies. Thus, we collect the sample data about economic policy and listed oil companies. For the economic policy, we use a widely used index, namely, the economic policy uncertainty index (EPU), which is a newspaper-based index for policy uncertainty in China (More details are given at https://www.policyuncertainty.com/china_monthly.html). The monthly series from 2010/6/1 to 2025/2/1 are used. The length of the observed series is 177.
We consider the ten most popular listed oil companies: China National Petroleum Corporation, China Petrochemical Corporation, China National Offshore Oil Corporation, China Oilfield Services Limited, COSCO SHIPPING Energy Transportation, China Merchants Group, China Merchants Energy Transportation, Shenergy Company Limited, Guanghui Energy, and Jereh Group. Their monthly stock price series from 2010/6/1 to 2025/2/1 are used as sample. Their corresponding stock codes are given in Table 2. All the datasets are free at https://cn.investing.com/. The datasets are depicted in Figure 2.
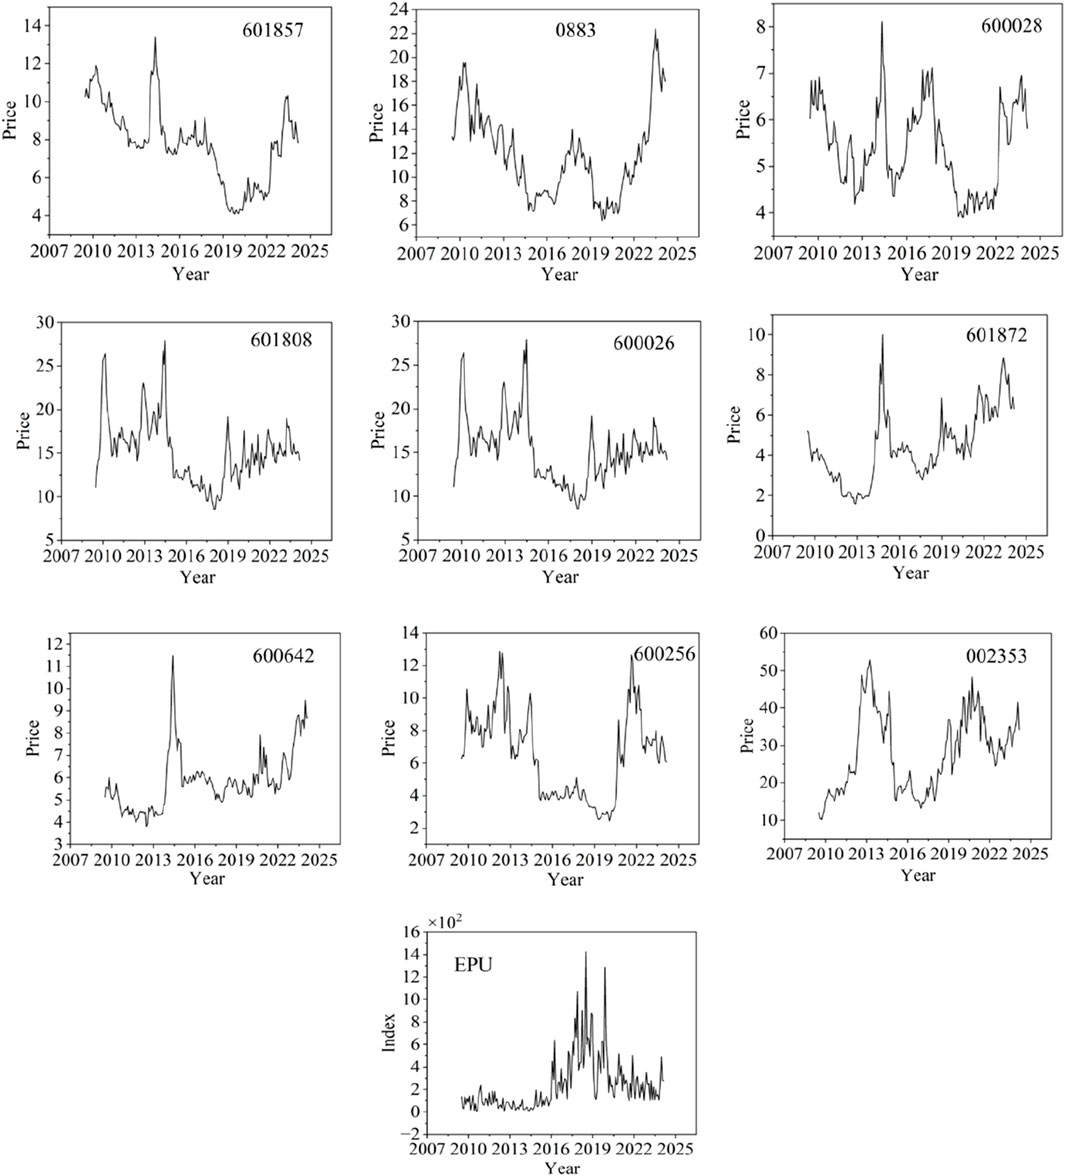
Figure 2. The selected sample data in this work.
From the statistical analysis, the stock price of China National Petroleum Corporation shows relatively higher fluctuations with a standard deviation of 20.3. Meanwhile, the stock price for China National Offshore Oil Corporation remains stable and has the lowest standard deviation. It is obvious the EPU has the highest volatility due to the highest standard deviation (see Table 1). Based on the correlation analysis, many stock prices show positive connections, while negative correlations are discovered between the EPU index and stock prices of other listed oil companies; see Figure 3.
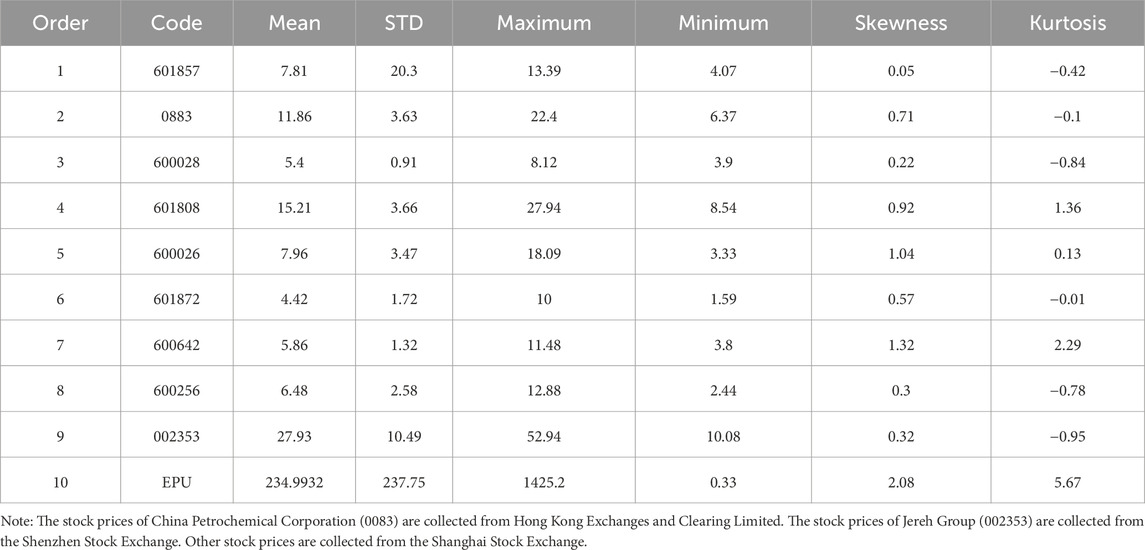
Table 1. Statistical analysis of sample datasets.
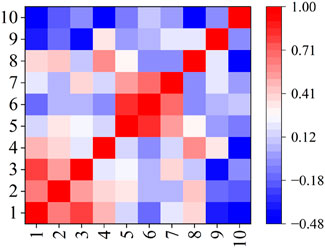
Figure 3. The Pearson correlation analyses of selected samples.
4 Results
4.1 Parameter selections and dynamics reconstructions
According to our dynamical causal interaction methods, we need to detect dynamical impacts from the reconstructed state space. On this basis, two fundamental parameters must be identified, that is, embedding dimension E and time lag
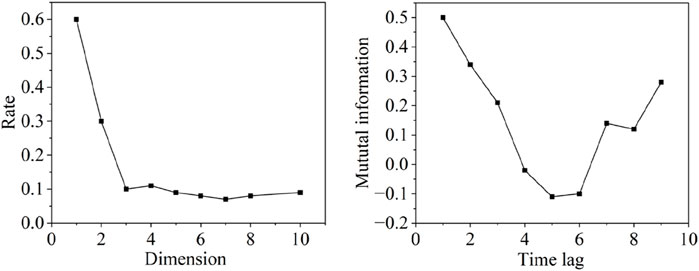
Figure 4. The selection of parameters for the reconstructions.
The time lag is another key parameter to guarantee a reliable reconstruction. If the delay time is too short, the two coordinate components of the phase space vector are so close numerically that they are indistinguishable from each other, thus failing to provide two independent coordinate components. If the delay time is too large, the two coordinate components appear to be completely independent, and there is no correlation between the projections of the trajectories of the chaotic attractor in the two directions. Therefore, a suitable method is needed to determine a suitable delay time to strike a balance between independence and correlation. This parameter is identified by mutual information that the first minimum in a plot between time delay and mutual information is a reliable selection [50]. We set
Once we identify the embedding dimension and time delay, we can perform phase space reconstruction from each time series. The reconstructed structures are given in Figure 5. In this way, we map each one-dimensional time series into a 3-dimensional state space. The trajectory depicts the dynamical evolutions for each variable. On this basis, it is possible to identify the dynamic interactions between variables.
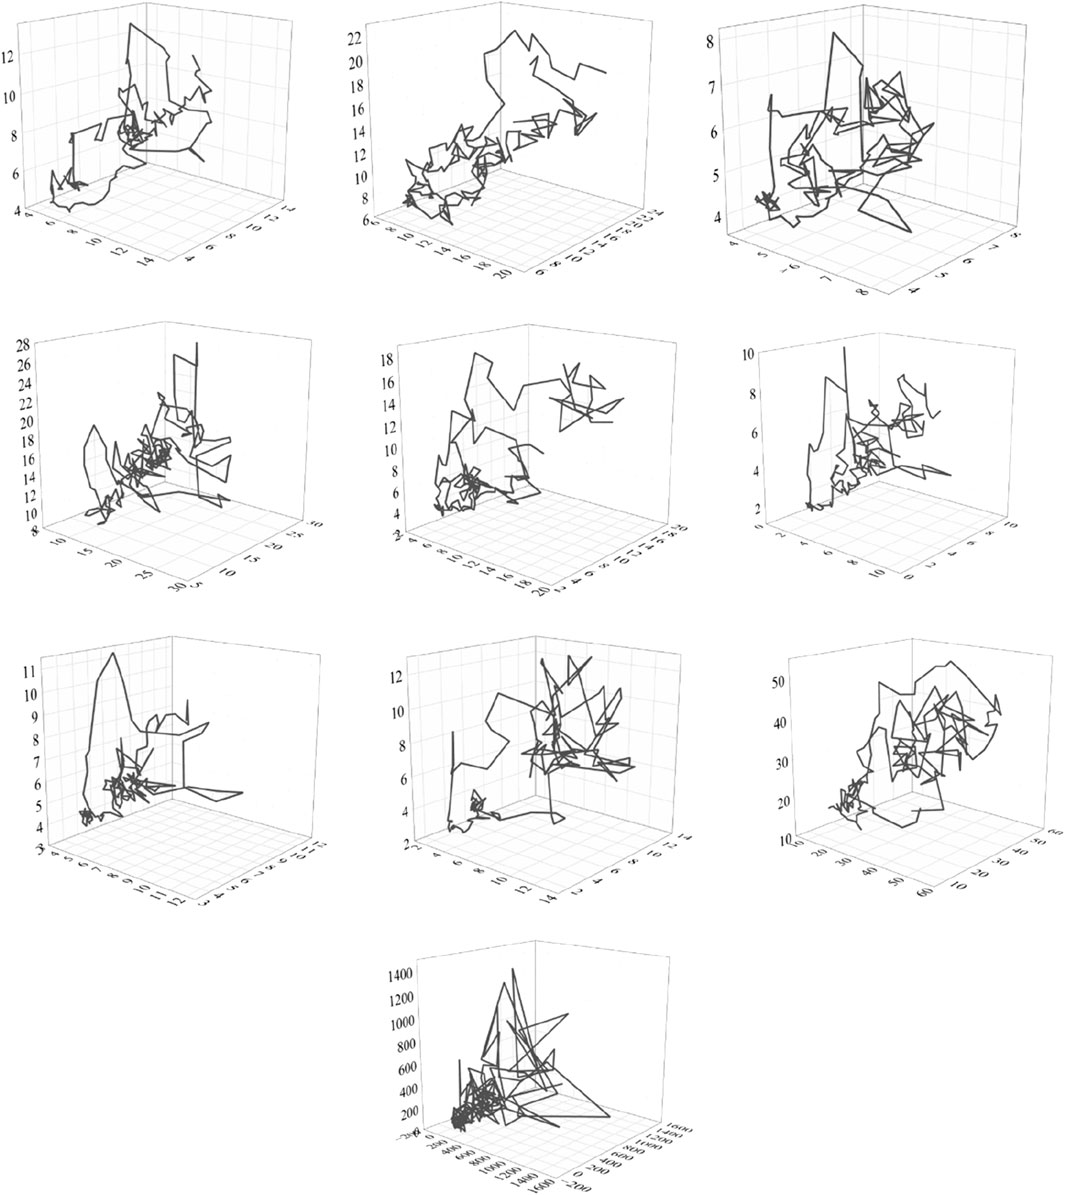
Figure 5. The reconstructed 3-dimensional state space based on the time series of sample variables. Note: the results are ordered based on Figure 2.
4.2 The positive causal impacts of economic policy on listed oil companies
In this section, we discuss the complex impacts of economic policy on the stock prices of oil companies. Causality analysis is a useful approach to reveal the causal impact between observations. We employ pattern causality to reveal their complex causal interactions. According to pattern causality, three kinds of causal interactions may exist: positive, negative, and dark causality. We first examine the positive causality between economic policy and the stock prices of listed oil companies. For each observation pair, the positive causal interactions are quantified by measuring the consistent patterns between state points on the reconstructed state space (see Figure 6). Table 2 depicts the pair-wise causal interactions for all sample variables. The direction of causality is from row variables to column variables. For example, the value 0.47 in the first row and second column (1,2) represents the causal interaction from variable 1 to variable 2, and the causal strength is 0.47. The results show positive causal interactions between sample variables. The average positive causal interaction equals 0.3. In particular, the average positive causal interaction between the listed oil companies is 0.34, while it is 0.16 between EPU and listed oil companies. These findings suggest that stock prices of listed oil companies are more likely to evolve in the same direction, and EPU also has relatively low positive causal impacts on the stock prices of listed oil companies. However, stock prices of oil companies also generate positive feedback to EPU. Moreover, the positive causal impacts are asymmetric. See Figure 6 and Table 3, which report the difference between received causal impacts and output impacts.
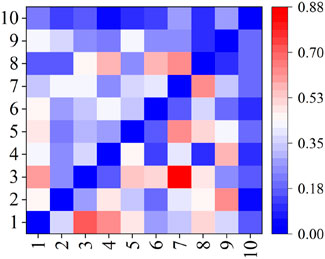
Figure 6. The positive causal impact among selected observations.
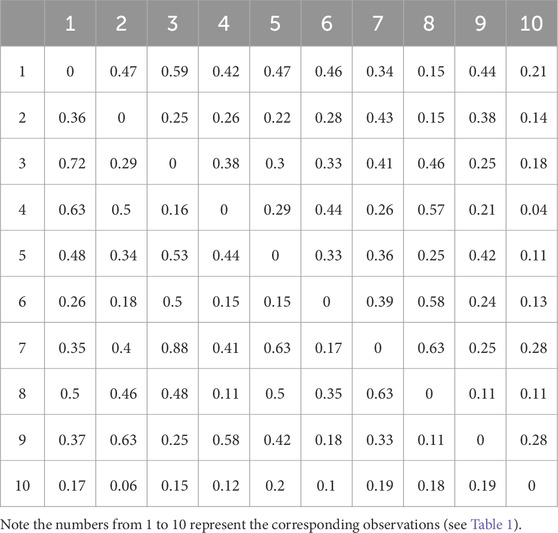
Table 2. The positive impacts among selected sample variables.
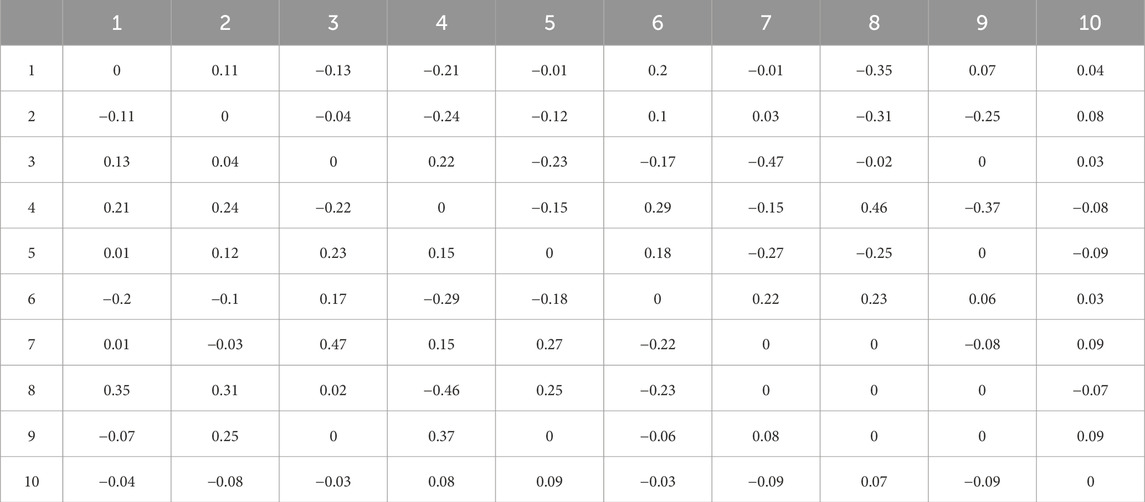
Table 3. The net positive causal impacts among samples.
4.3 The negative causal impacts of economic policy on listed oil companies
In addition to positive causal impacts, we then examine whether there exist negative impacts between EPU and stock prices of listed oil companies. According to pattern causality, the negative causal interactions can be quantified by measuring the opposite pattern of state points on the reconstructed state space. The results show negative causality between selected samples (Table 4). In total, the average negative causal impacts among all observations and only listed oil companies are 0.21 and 0.18. The average negative causal impact between EPU and listed oil companies is 0.33. These findings suggest that the negative causal impacts between the stock prices of listed oil companies are relatively lower than the impact between economic policy and listed oil companies.
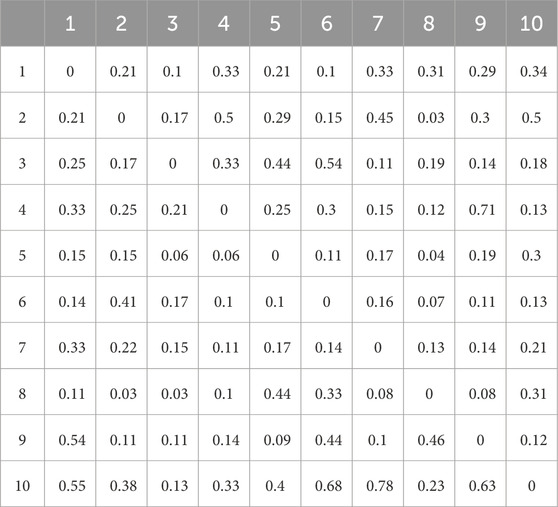
Table 4. The negative impacts among selected sample variables.
To further analyze the causal impacts, it is obvious that the received impacts and output impacts are not equal. This indicates asymmetric negative causal interactions between samples (see Figure 7). In addition, we examine the net causal impact from the difference between received and output impacts (see Table 5). The results show that the EPU is more likely to bring net negative impacts on the stock prices of listed oil companies. In general, EPU has higher negative impacts on the stock prices of listed oil companies than negative feedback from oil companies.
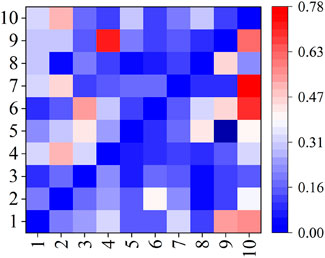
Figure 7. The negative causal impact among selected observations.
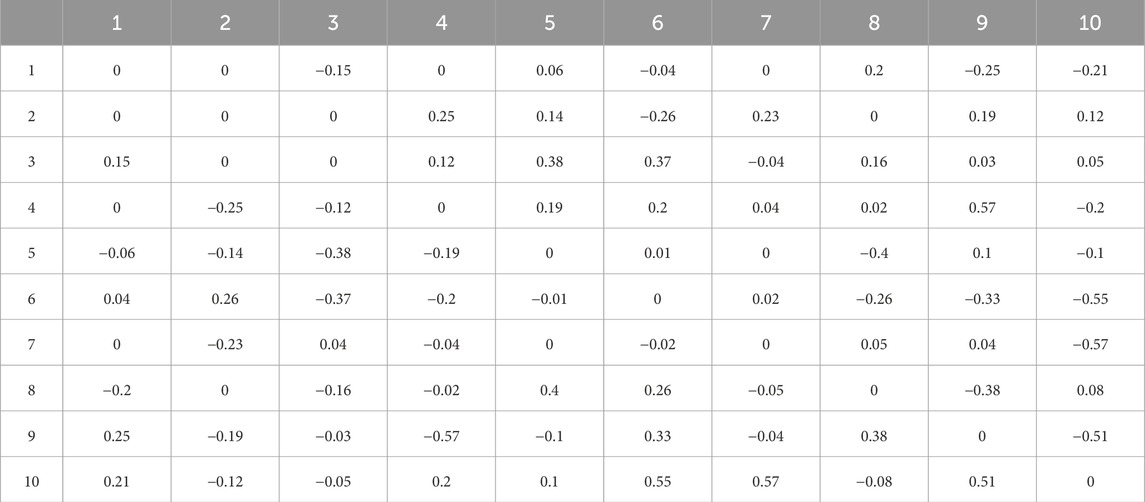
Table 5. The net negative causal impacts among samples.
4.4 The dark causal impacts of economic policy on listed oil companies
At this point, we have revealed positive and negative causal interactions between economic policy and stock prices of listed oil companies. Both positive and negative causality are widely reported by many previous works. However, we further detect whether a more complex causal interaction exists whose causal impact natures are quite different from negative and positive causality, namely, dark causality. According to pattern causality methods, the dark causal interaction can be measured by quantifying the complex patterns (neither consistent nor opposite) of state points in the reconstructed state space. The results report the dark causal impact between economic policy and the stock prices of listed oil companies (see Table 6). The average dark causal impact is 0.31. The average dark causal impact is 0.3 among the stock prices of listed oil companies, and the average dark causal impact approaches 0.45 between EPU and stock prices of listed oil companies. We can find relatively higher dark causal impacts between economic policy and listed oil companies than the impacts within listed oil companies.
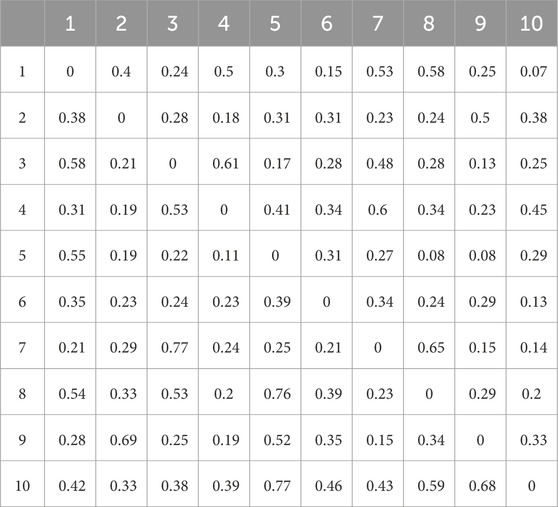
Table 6. The dark impacts among selected sample variables.
Moreover, the dark causal interactions between economic policy and listed oil companies are also asymmetric (see Figure 8). We further calculate the difference between received and output impacts; see Table 7. It is clear that the output dark impacts from economic policy to listed oil companies are higher than the received impacts. This suggests that EPUs are more likely to affect the stock prices of listed oil companies in a complex way.
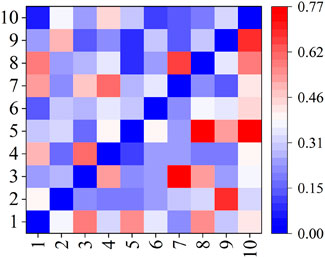
Figure 8. The dark causal impact among selected observations.
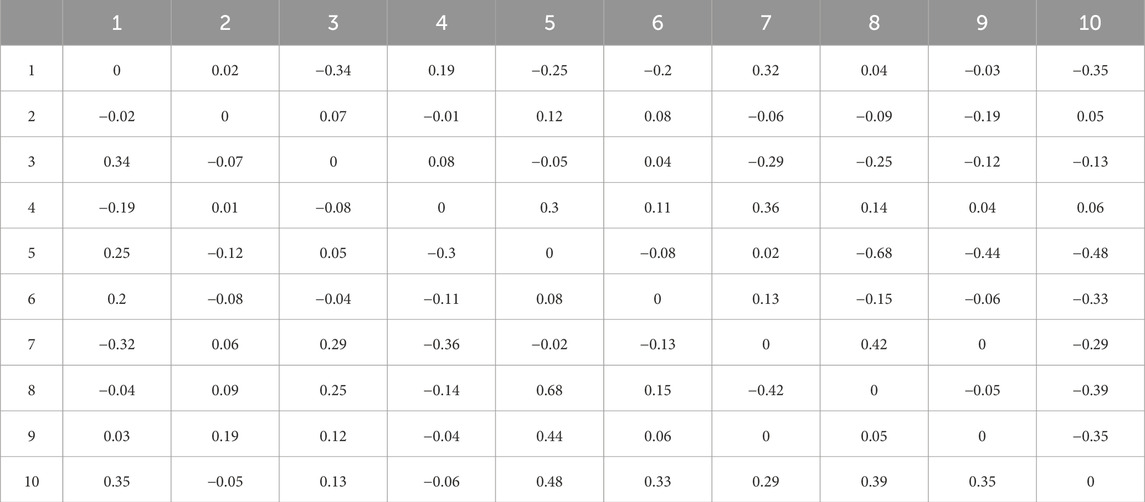
Table 7. The net dark causal impacts among samples.
4.5 The dominant causal impacts of the economic policy on listed oil companies
We have revealed positive, negative, and dark causal impacts between economic policy and listed oil companies. The three different causal impacts show different magnitudes of impacts. Thus, it is interesting to compare their strength and find the dominant causal impacts. To this end, we compare three kinds of causal impacts between each variable pair and select the highest causal interaction. The results are given in Figure 9. Dark causality plays a dominant role in our samples. Within listed oil companies, positive causality occupies a relatively higher proportion, while dark causality occupies dominant roles between economic policy and listed oil companies. These findings suggest that the causal impacts between economic policy and listed oil companies are complex, neither purely positive nor purely negative, as reported by many previous methods.
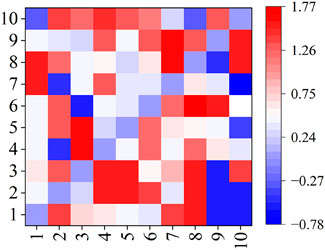
Figure 9. The dominant causal impacts in our samples. Note: negative values represent the negative causal impacts. Positive causal impacts are given by the values from [0,1]. The values larger than 1 represent the dark values. To clarify dark and positive causality, we add 1 to the original strength of dark causality.
The simultaneous existence of three different causal types between EPU and listed crude oil companies suggests a complex nonlinear impact relationship between them. Second, the strength of the three causal relationships is asymmetric, with dark causality dominating, indicating that the association between EPU and listed crude oil companies is volatile and complex. These findings help us understand the relationship between them. In addition, this complex influence relationship may make the economic system more risky, which provides the relevant market investors and market regulators with corresponding decision support.
5 Conclusion and discussion
This work employs the pattern causality method to reveal complex causality between economic policy and listed oil companies. Unlike previous findings that only one kind of causal impact between them, our study suggests that three different kinds of causal impacts simultaneously exist: positive, negative, and dark causality. Our work may have several implications for practical application and theoretical analysis.
i) Three different kinds of causal impacts between economic policy and listed oil companies suggest more complex impacts between them, which gives new inspiration to understanding complex associations between them.
ii) The causal impacts of economic policy uncertainty on stock prices of listed oil companies are dominated by dark causality, which suggests neither the same nor opposite fluctuation between them. This may give a new perspective for management. In particular, dark causality denotes more complex connections. The underlying risk may be underestimated, and market participants should reconsider risk.
iii) Market players should upgrade risk assessment methods to capture “dark causality” risks. Oil firms and investors need more advanced models, as traditional ones overlook hidden risks. Firms should use real-time policy analysis tools and conduct stress tests. Regulators should enforce clear risk disclosures about such uncertainties. To manage these underestimated risks, oil companies should diversify operations geographically and across products. Investors should diversify portfolios, too. Both should create contingency plans for rapid response to policy changes, accounting for the unpredictable nature of dark causality.
As discussed in this work, dark causality may drive two variables to fluctuate in a nonlinear manner, moving in neither perfect unison nor in complete opposition, indicating a more intricate relationship between them. The underlying economic implications of dark causality can be understood from the following aspects:
First, dark causality offers a more realistic explanation for phenomena observed in real-world economic systems. In these systems, the fluctuations between variables rarely exhibit simple, unidirectional patterns. Instead, they often display complex, intertwined trends that deviate from straightforward positive or negative correlations.
Second, it provides novel evidence for the inherent complexity of economic systems. By uncovering these hidden causal relationships, we gain deeper insights into the intricate mechanisms that govern economic behavior, enhancing our understanding of how economic systems operate and evolve.
Third, dark causality reveals an even more convoluted nature of the relationships among economic variables. This complexity gives rise to increased uncertainty, and when dark causality dominates, it may signal elevated risks. As such, dark causality has the potential to be linked to systemic risks within economic systems.
Despite several interesting findings being discovered, there are also some limitations that can be solved in the future. In particular, dark causality is a newly defined interaction, and its underlying explanation needs to be discussed further. In addition, it is also difficult to distinguish impacts from other external factors, such as other related markets.
Data availability statement
The original contributions presented in the study are included in the article/supplementary material; further inquiries can be directed to the corresponding authors.
Author contributions
YD: Funding acquisition, Investigation, Resources, Writing – review and editing, Methodology, Formal Analysis, Project administration, Conceptualization. XJ: Validation, Writing – review and editing, Supervision, Conceptualization. HX: Funding acquisition, Conceptualization, Formal Analysis, Writing – review and editing, Validation. ZW: Writing – review and editing, Formal Analysis, Supervision, Investigation, Project administration. XZ: Methodology, Data curation, Writing – review and editing, Conceptualization, Investigation. YW: Validation, Writing – review and editing, Writing – original draft, Data curation, Software, Visualization.
Funding
The author(s) declare that no financial support was received for the research and/or publication of this article.
Conflict of interest
Authors YD, XZ, XJ, and HX were employed by PetroChina Southwest Oil & Gasfield Company.
The remaining authors declare that the research was conducted in the absence of any commercial or financial relationships that could be construed as a potential conflict of interest.
Generative AI statement
The author(s) declare that no Generative AI was used in the creation of this manuscript.
Publisher’s note
All claims expressed in this article are solely those of the authors and do not necessarily represent those of their affiliated organizations, or those of the publisher, the editors and the reviewers. Any product that may be evaluated in this article, or claim that may be made by its manufacturer, is not guaranteed or endorsed by the publisher.
References
1. Dafermos Y, Nikolaidi M, Galanis G. Climate change, financial stability and monetary policy. Ecol Econ (2018) 152:219–34. doi:10.1016/j.ecolecon.2018.05.011
2. Danisman G, Bilyay-Erdogan S, Demir E. Economic uncertainty and climate change exposure. J Environ Manage (2025) 373:123760. doi:10.1016/j.jenvman.2024.123760
3. Adra S, Gao Y, Huang J, Yuan J. Geopolitical risk and corporate payout policy. Int Rev Financial Anal (2023) 87:102613. doi:10.1016/j.irfa.2023.102613
4. Apergis N, Fahmy H. Geopolitical risk and energy price crash risk. Energy Econ (2024) 140:107975. doi:10.1016/j.eneco.2024.107975
5. Liu Y, Suo X, Du X, Wu H, Lin H. Corporate digital innovation and stock price crash risk. Finance Res Lett (2024) 66:105690. doi:10.1016/j.frl.2024.105690
6. Liu C, Xu J. Risk spillover effects of new global energy listed companies from the time-frequency perspective. Energy (2024) 292:130502. doi:10.1016/j.energy.2024.130502
7. Su F, Song N, Shang H, Fahad S. The impact of economic policy uncertainty on corporate social responsibility: a new evidence from food industry in China. Plos One (2022) 17:e0269165. doi:10.1371/journal.pone.0269165
8. Mitchell JV, Mitchell B. Structural crisis in the oil and gas industry. Energy Policy (2014) 64:36–42. doi:10.1016/j.enpol.2013.07.094
9. Silvestre H, Gomes RC, Lamba JR, Correia AM. Implementation of Brazil's energy policy through the national oil company: from institutional chaos to strategic order. Energy Policy (2018) 119:87–96. doi:10.1016/j.enpol.2018.04.028
10. Diaz-Rainey I, Gehricke SA, Roberts H, Zhang R. Trump vs. Paris: the impact of climate policy on US listed oil and gas firm returns and volatility. Int Rev Financial Anal (2021) 76:101746. doi:10.1016/j.irfa.2021.101746
11. Al-Thaqeb SA, Algharabali BG, Alabdulghafour KT. The pandemic and economic policy uncertainty. Int J Finance Econ (2022) 27:2784–94.
12. Lin BQ, Bai R. Oil prices and economic policy uncertainty: evidence from global, oil importers, and exporters' perspective. Res In Int Business Finance (2021) 56:101357. doi:10.1016/j.ribaf.2020.101357
13. Shafiullah M, Miah MD, Alam MS, Atif M. Does economic policy uncertainty affect renewable energy consumption? Renew Energy (2021) 179:1500–21. doi:10.1016/j.renene.2021.07.092
14. Apostolakis GN, Floros C, Gkillas K, Wohar M. Financial stress, economic policy uncertainty, and oil price uncertainty. Energy Econ (2021) 104:105686. doi:10.1016/j.eneco.2021.105686
15. Xiao XY, Tian Q, Hou S. Economic policy uncertainty and grain futures price volatility: evidence from China. China Agric Econ Rev (2019) 11:642–54. doi:10.1108/caer-11-2018-0224
16. Jiang W, Dong L, Liu X, Zou L. Volatility spillovers among economic policy uncertainty, energy and carbon markets-The quantile time-frequency perspective. Energy (2024) 307:132683. doi:10.1016/j.energy.2024.132683
17. Feng XG, Luo WJ, Wang Y. Economic policy uncertainty and firm performance: evidence from China. J Asia Pac Economy (2023) 28:1476–93. doi:10.1080/13547860.2021.1962643
18. Xu ZX. Economic policy uncertainty, cost of capital, and corporate innovation. J Banking Finance (2020) 111:105698. doi:10.1016/j.jbankfin.2019.105698
19. Liu GC, Zhang CS. Economic policy uncertainty and firms' investment and financing decisions in China. China Econ Rev (2020) 63:101279. doi:10.1016/j.chieco.2019.02.007
20. Che M, Wang L, &Li YJ. Global economic policy uncertainty and oil price uncertainty: which is more important for global economic activity? Energy (2024) 310:133305. doi:10.1016/j.energy.2024.133305
21. Liu XJ, Wang Y, Du W, Ma Y. Economic policy uncertainty, oil price volatility and stock market returns: evidence from a nonlinear model. North Am J Econ Finance (2022) 62:101777. doi:10.1016/j.najef.2022.101777
22. Ilyas M, Khan A, Nadeem M, Suleman MT. Economic policy uncertainty, oil price shocks and corporate investment: evidence from the oil industry. Energy Econ (2021) 97:105193. doi:10.1016/j.eneco.2021.105193
24. Belderbos R, Tong TW, Wu SB. Multinational investment and the value of growth options: alignment of incremental strategy to environmental uncertainty. Strateg Management J (2019) 40:127–52. doi:10.1002/smj.2969
25. Chen Y, Dong S, Qian S, Chung K. Impact of oil price volatility and economic policy uncertainty on business investment - insights from the energy sector. Heliyon (2024) 10:e26533. doi:10.1016/j.heliyon.2024.e26533
26. Lee C, Lee C, Li Y. Assessing oil price volatility co-movement with stock market volatility through quantile regression approach. Resour Policy (2021) 55:101309.
27. Song Y, Chen B, Wang XY, Wang PP. Defending global oil price security: based on the perspective of uncertainty risk. Energy Strategy Rev (2022) 41:100858. doi:10.1016/j.esr.2022.100858
28. Adelaja AO, Akaeze HO. Supply response, economic diversification and recovery strategy in the oil sector. Energy Strategy Rev (2018) 21:111–20. doi:10.1016/j.esr.2018.05.002
29. Liu LP, Lü Z, Yoon SM. Impact of policy uncertainty on stock market volatility in the China's low-carbon economy. Energy Econ (2025) 141:108056. doi:10.1016/j.eneco.2024.108056
30. Zheng TC, Wang B, Rajaeifar MA, Heidrich O, Zheng J, Liang Y, et al. How government policies can make waste cooking oil-to-biodiesel supply chains more efficient and sustainable. J Clean Prod (2020) 263:121494. doi:10.1016/j.jclepro.2020.121494
31. Rong G, Qamruzzaman M. Symmetric and asymmetric nexus between economic policy uncertainty, oil price, and renewable energy consumption in the United States, China, India, Japan, and South Korea: does technological innovation influence? Frontier Energy Res (2022) 10:973557. doi:10.3389/fenrg.2022.973557
32. Fu LL, Yuan DY, Teng JM. Asymmetric dynamic linkage between consumer sentiment, inflation expectations, and international energy prices: evidence from time-frequency wavelet and nonlinear analysis. Plos One (2024) 19:e0308097. doi:10.1371/journal.pone.0308097
33. Liu ZH, Zhang H, Ding Z, Lv T, Wang X, Wang D. When are the effects of economic policy uncertainty on oil-stock correlations larger? Evidence from a regime-switching analysis. Econ Model (2022) 114:105941. doi:10.1016/j.econmod.2022.105941
34. Song DM, Tumminello M, Zhou WX, Mantegna RN. Evolution of worldwide stock markets, correlation structure, and correlation-based graphs. Physic Rev E (2011) 84:026108. doi:10.1103/physreve.84.026108
35. Bai XW. Tanker freight rates and economic policy uncertainty: a wavelet-based copula approach. Energy (2021) 235:121383. doi:10.1016/j.energy.2021.121383
36. Zhao L. Global economic policy uncertainty and oil futures volatility prediction. Finance Res Lett (2023) 54:103693. doi:10.1016/j.frl.2023.103693
37. Rehman MU. Do oil shocks predict economic policy uncertainty? Physica A (2018) 498:123–36. doi:10.1016/j.physa.2017.12.133
38. Cao GX, Zhang Q, Li QC. Causal relationship between the global foreign exchange market based on complex networks and entropy theory. Chaos Solitons and Fractals (2017) 99:36–44. doi:10.1016/j.chaos.2017.03.039
39. Yang L, Hamori S. Systemic risk and economic policy uncertainty: international evidence from the crude oil market. Econ Anal Policy (2021) 69:142–58. doi:10.1016/j.eap.2020.12.001
40. Wu T, Gao X, An S, Liu S. Diverse causality inference in foreign exchange markets. Int J Bifurcation Chaos (2021) 31:2150070. doi:10.1142/s021812742150070x
41. Vyrost T, Lyocsa S, Baumohl E. Granger causality stock market networks: temporal proximity and preferential attachment. Physica A (2015) 427:262–76. doi:10.1016/j.physa.2015.02.017
42. Dash SR, Maitra D. Do oil and gas prices influence economic policy uncertainty differently: multi-country evidence using time-frequency approach. Q Rev Econ Finance (2021) 81:397–420. doi:10.1016/j.qref.2021.06.012
43. Barnett L, Barrett AB, Seth AK. Granger causality and transfer entropy are equivalent for Gaussian variables. Phys Rev Lett (2009) 103:238701. doi:10.1103/physrevlett.103.238701
44. Sugihara G, May R, Ye H, Hsieh C, Deyle E, Fogarty M, et al. Detecting causality in complex ecosystems. Science (2012) 338:496–500. doi:10.1126/science.1227079
45. Stavroglou SK, Pantelous AA, Stanley HE, Zuev KM. Hidden interactions in financial markets. PNAS (2019) 22:10646–51. doi:10.1073/pnas.1819449116
46. Wang WX, Lai YC, Grebogi C. Data based identification and prediction of nonlinear and complex dynamical systems. Phys Rep (2016) 644:1–76. doi:10.1016/j.physrep.2016.06.004
47. Wu T, An F, Gao X, Zhong W, Kurths J. A novel framework for direct multistep prediction in complex systems. Nonlinear Dyn (2023) 111(10):9289–304. doi:10.1007/s11071-023-08360-7
49. Krakovska A, Mezeiova K, Budacova H. Use of false nearest neighbours for selecting variables and embedding parameters for state space reconstruction. J Complex Syst (2015) 2015:1–12. doi:10.1155/2015/932750
Keywords: economic policy, oil listed company, multiple causality, dynamics theory, complex system analysis
Citation: Duan Y, Jing X, Xu H, Wang Z, Zhang X and Wang Y (2025) Complex impacts between economic policy and listed oil companies: a dynamics-based approach. Front. Phys. 13:1609866. doi: 10.3389/fphy.2025.1609866
Received: 11 April 2025; Accepted: 19 May 2025;
Published: 27 June 2025.
Edited by:
Ze Wang, Capital Normal University, ChinaReviewed by:
Yasuko Kawahata, Rikkyo University, JapanJiusheng Chen, Chongqing Normal University, China
Copyright © 2025 Duan, Jing, Xu, Wang, Zhang and Wang. This is an open-access article distributed under the terms of the Creative Commons Attribution License (CC BY). The use, distribution or reproduction in other forums is permitted, provided the original author(s) and the copyright owner(s) are credited and that the original publication in this journal is cited, in accordance with accepted academic practice. No use, distribution or reproduction is permitted which does not comply with these terms.
*Correspondence: Zhong Wang, d2FuZ3pob25nMjAxMkBjZHV0LmVkdS5jbg==; Yi Wang, V3lkZTEwMjg3OThAMTYzLmNvbQ==