 Zhiwen Hou
 Boyu Wang1†
 Jingrui Liu
- 1Chongqing University-University of Cincinnati Joint Co-op Institute, Chongqing University, Chongqing, China
- 2College of Computer Science, Sichuan University, Chengdu, Sichuan, China
This study proposes a lightweight and efficient classification method for Power Quality Disturbances (PQDs) using the PowerMobileNet model, which combines the S-transform for time-frequency feature extraction and the MobileNetV3-CBAM neural network for enhanced classification performance. Extensive experiments demonstrate that PowerMobileNet achieves a prediction accuracy of 99.33%, significantly surpassing traditional Convolutional Neural Networks (CNNs) at 97.07% and MobileNetV3-SE at 98.58%. Compared to other state-of-the-art models, PowerMobileNet outperforms KELM (97.4%), SqueezeNet (99.0%), ShuffleNet V2 (98.6%), and AlexNet (98.3%) in terms of classification accuracy. Additionally, it exhibits superior robustness under various signal-to-noise ratio (SNR) conditions, maintaining high accuracy even at low SNR levels (e.g., 90% accuracy at 20 dB). The model’s parameter count is drastically reduced to 374,632 (1.43 MB), compared to the traditional CNN’s 112,094,345 (427.61 MB), making it highly suitable for resource-constrained environments. Furthermore, PowerMobileNet demonstrates the shortest runtime, with a training duration of 925 s and a classification time of 0.57 s. These results validate the effectiveness and efficiency of PowerMobileNet for real-time PQD classification, offering significant potential for practical power quality monitoring applications.
1 Introduction
In modern power systems, the rapid development of renewable energy generation, along with the widespread adoption of distributed generation and microgrid control strategies, has introduced a substantial number of nonlinear signals into the power system [1, 2]. From a physics perspective, the intermittency and volatility of wind and photovoltaic power generation are rooted in the inherent variability of natural energy sources. Wind speeds and solar irradiance fluctuate over time, leading to voltage fluctuations [3, 4], flicker, and harmonic distortion in the electrical domain. These phenomena can be understood through the lens of electromagnetic theory and signal processing principles, which highlight the complex interactions between renewable energy sources and the power grid [5–7]. Furthermore, the power electronic converters associated with these energy sources are highly susceptible to PQDs, such as harmonic distortion and voltage imbalance [8]. This susceptibility can be attributed to the fundamental principles of power electronics, where the conversion of electrical energy between different forms (e.g., AC-DC, DC-AC) introduces nonlinearities and potential instabilities into the system. The frequent occurrence of power quality events not only causes significant inconvenience to users but also results in substantial economic losses [9]. From a physics standpoint, accurately identifying and classifying PQDs is crucial for ensuring the stable operation of microgrids and the safe functioning of related equipment [10, 11]. This involves the application of advanced signal processing techniques and machine learning algorithms to extract meaningful features from complex, nonlinear signals. The underlying physics of these disturbances provides a foundation for developing robust and efficient detection methods, which are essential for maintaining the integrity and reliability of modern power systems.
However, PQDs in microgrids are often highly complex and exhibit multiple characteristics, making feature extraction a fundamental prerequisite for effective disturbance classification [12–15]. Traditional detection methods rely on manual operations, such as using oscilloscopes, multimeters, and power quality analyzers, whose efficiency and accuracy are increasingly inadequate for the demands of modern power systems. In contrast, fast and accurate intelligent detection methods not only reduce labor costs but also significantly mitigate equipment degradation and system failures caused by power quality issues. Therefore, developing an efficient and precise PQD detection algorithm is essential not only for minimizing production costs but also for its substantial practical significance and broad application prospects.
The identification process of PQDs primarily consists of two steps [16]:
1. Extracting features from PQD signals;
2. Classifying the disturbances based on the extracted features.
Regarding feature extraction, the main methods include Fast Fourier Transform (FFT) [17], Wavelet Transform [4], S-Transform [18], Hilbert-Huang Transform (HHT) [19], Short-Time Fourier Transform (STFT) [20], Singular Value Decomposition (SVD) [21], and Kalman Filtering (KF) [22]. The STFT has a fixed window length and shape, which limits its ability to simultaneously capture high-frequency and low-frequency signal characteristics. Although Wavelet Transform enables multi-scale analysis, the relationship between its transformation scales and frequencies is fixed, making flexible adjustments challenging. Additionally, both SVD and Kalman Filtering lack the capability to describe signal features in the frequency domain.
In contrast, S-Transform, which integrates the advantages of both Wavelet Transform and FFT as a reversible time-frequency analysis technique, has gained widespread application in PQD feature extraction in recent years [23]. By employing an analysis window that adapts to frequency variations, S-Transform provides frequency-dependent resolution [18], effectively overcoming the fixed-resolution limitation of STFT in handling high- and low-frequency signals [24]. Compared to Wavelet Transform, S-Transform not only expands its application scope but also significantly reduces sensitivity to noise [25]. This is particularly beneficial in complex power systems with substantial noise interference, as it enables more accurate extraction of time-frequency features, offering superior temporal and spectral resolution. These characteristics make S-Transform particularly advantageous for analyzing nonlinear, non-stationary, and transient PQDs, thereby providing more reliable technical support for power quality monitoring and fault diagnosis [11, 26].
In the field of PQD classification, machine learning and deep learning methods have been extensively studied and applied. Traditional machine learning techniques, such as Support Vector Machines (SVM) [27], Decision Trees [28], and Bayesian Classifiers [29], are widely used due to their efficiency and interpretability in handling classification tasks. However, these methods exhibit certain limitations when dealing with complex PQD signals. For instance, although SVM achieves high classification accuracy, its computational burden during parameter optimization is significant, particularly when processing large-scale datasets, leading to prolonged training times that fail to meet real-time requirements. Additionally, Decision Trees and Bayesian Classifiers tend to suffer from overfitting when handling high-dimensional features and complex signals, thereby reducing classification performance. Another common drawback of these conventional approaches is their reliance on manual feature extraction, which not only increases preprocessing complexity but may also result in insufficient or redundant feature selection, further impacting classification efficiency.
In recent years, the rise of deep learning has presented new opportunities for PQD classification. CNNs, as a powerful deep learning model, have been widely applied in image recognition, signal processing, and related fields [30]. By leveraging convolutional and pooling layers, CNNs can automatically extract features from signals, reducing the need for manual feature engineering while enhancing classification accuracy to some extent [31, 32]. However, CNNs also face challenges when applied to PQD signals. First, CNN models are typically highly complex and require a large number of parameters for training, which not only increases computational resource consumption but also prolongs training time, making real-time applications difficult. Second, CNNs struggle with distinguishing highly similar disturbance signals (e.g., interruptions and voltage sags), often leading to misclassification. This issue is further exacerbated by the potential introduction of redundant, non-essential features during feature extraction, which reduces classification efficiency.
In parallel, Transformer-based models, such as Vision Transformers (ViTs) and Swin Transformers, have recently emerged as competitive alternatives to CNNs in image and signal classification tasks [33, 34]. These models leverage self-attention mechanisms to capture global dependencies across the input, demonstrating strong performance in various vision applications [35]. However, despite their promising results, Transformer models exhibit several limitations in the context of PQD classification. First, they typically require substantial computational resources and memory, which hampers their feasibility for real-time deployment in embedded or resource-constrained power systems. Second, while Transformers excel at modeling global structures, they may overlook subtle local disturbances that are critical for fine-grained classification of PQD types. This limitation affects their robustness and accuracy when applied to transient and high-noise scenarios frequently encountered in real-world power systems. Similarly, popular deep learning models such as BiLSTM [36], GRU [37], and Deep Belief Networks (DBN) [38] improve classification accuracy but face challenges related to model size and computational speed.
To overcome the limitations of traditional CNNs and Transformer-based models in PQD classification, researchers have increasingly turned to lightweight neural networks such as EfficientNet (B0), GhostNet, and MobileNetV3, which have attracted considerable attention in recent years due to their efficiency and compact design [39]. However, each exhibits varying degrees of limitations in terms of feature extraction capability, architectural flexibility, or deployment adaptability. Table 1 lists the comparative analysis and shows their differences.
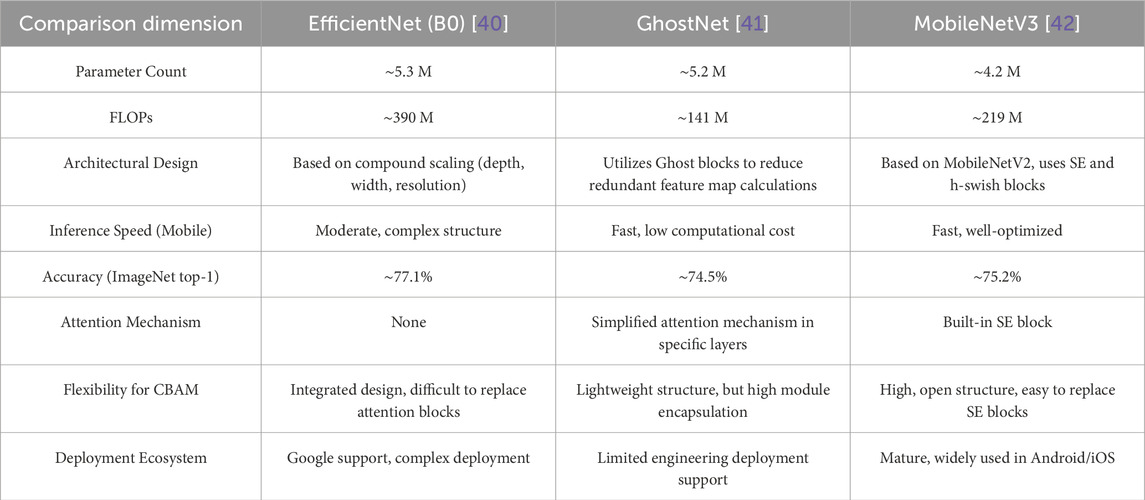
Table 1. Comparison of lightweight convolutional neural networks.
From Table 1, it is evident that EfficientNet, despite its high accuracy, has a complex structure and challenges in integrating attention mechanisms flexibly. GhostNet, while extremely lightweight, shows slightly lower accuracy and high module encapsulation, hindering further improvements. MobileNetV3 strikes a balance between efficiency and performance, but further refinement is needed.
To address the limitations of traditional methods in PQD classification, we propose a lightweight deep learning model, PowerMobileNet, based on an improved MobileNet V3 architecture. Compared to CNNs, BiLSTMs, and other deep learning models, MobileNet offers advantages in computational efficiency and parameter reduction. However, its feature extraction capabilities remain insufficient. To enhance this aspect, we incorporate the Convolutional Block Attention Module (CBAM). This integration does not significantly increase computational complexity, as CBAM is relatively lightweight and can be implemented using simple convolutional and pooling operations. As a result, MobileNet retains its lightweight nature while benefiting from enhanced feature extraction. Consequently, PowerMobileNet achieves high classification accuracy while substantially reducing model parameters and computational complexity, making it more suitable for real-time PQD classification tasks.
This study makes the following key contributions:
• In terms of feature extraction, we employ S-Transform for time-frequency analysis. By incorporating a Gaussian window function, S-Transform overcomes the fixed window width limitation of traditional methods, enabling effective processing of nonlinear and non-stationary PQD signals. Compared to Short-Time Fourier Transform (STFT) and Wavelet Transform, S-Transform offers superior time-frequency resolution, allowing for more precise feature extraction and providing a more reliable foundation for subsequent classification tasks.
• In terms of model architecture, we enhance MobileNet V3 by integrating the CBAM [42]. Unlike conventional Squeeze-and-Excitation (SE) modules, CBAM not only focuses on channel attention but also optimizes spatial attention, further refining the feature extraction process. This dual optimization significantly enhances the model’s capability to capture key features while preserving its lightweight structure, making it well-suited for deployment in resource-constrained environments.
• In terms of model complexity, the MobileNetV3-CBAM model achieves a substantial reduction in computational complexity. The total number of parameters is reduced from 112,094,345 (427.61 MB) to 374,632 (1.43 MB). This improvement makes the model highly suitable for real-time deployment on mobile devices and embedded systems, aligning with the power system’s efficiency and real-time processing requirements.
• In terms of loss function optimization, we refine the original cross-entropy loss function by introducing a dynamically adjusted Bias Loss, effectively mitigating random prediction errors caused by insufficient data features. This enhancement improves the model’s robustness under varying signal-to-noise ratio (SNR) conditions.
The experimental results demonstrate that PowerMobileNet achieves a prediction accuracy of 99.33%, significantly surpassing traditional CNN (97.11%) and MobileNet V3-SE (98.58%). The model excels under high SNR conditions and maintains high classification accuracy even in low-SNR environments, validating its effectiveness and efficiency in practical applications. Through these improvements, PowerMobileNet not only addresses the challenges of high computational complexity and poor real-time performance associated with traditional methods but also enhances model performance and applicability by incorporating a lightweight architecture and an optimized loss function.
The structure of this paper is organized as follows: Section 1 reviews related work on PQD classification. Section 2 provides a detailed description of the feature extraction process, the proposed method, and its key modules. Section 3 presents the experimental results and compares them with state-of-the-art algorithms to validate the effectiveness of the proposed approach. Finally, Section 4 concludes the study and discusses future research directions.
2 Models
2.1 S-transform and feature extraction
The S-transform is a reversible time-frequency analysis method that introduces a Gaussian window function into the Fourier transform framework [44]. This allows the analysis window’s width to vary with frequency, thereby overcoming the fixed window width limitation of the short-time Fourier transform. The S-transform exhibits multi-resolution analysis capabilities, making it suitable for analyzing nonlinear, non-stationary, and transient PQD signals. The continuous S-transform is defined as shown in Equation 1 below:
where
In this study, the S-transform is employed to extract the time-frequency features of PQD signals. The detailed steps are as follows:
1. Signal Preprocessing: The collected power signals are normalized to adjust their amplitudes to the range of [0,1].
2. Feature Extraction: The S-transform is applied to extract signal features, generating a two-dimensional time-frequency matrix. In this matrix, rows represent different time points, columns represent different frequency points, and the values correspond to the energy intensity at the respective time and frequency.
3. Matrix Cropping: The extracted time-frequency matrix is cropped into a 224 × 224 square matrix, which serves as the input for the neural network.
2.2 The construction of the MobileNetV3-CBAM model
To enhance the precision and efficiency of PQD classification, we employed the lightweight neural network model MobileNet V3, which is fundamentally based on depthwise separable convolutions [45]. By decomposing standard convolutions into depthwise convolutions and pointwise convolutions, the former reduces spatial computation, while the latter decreases channel computation, thereby significantly reducing both parameter count and computational cost. Additionally, the model integrates the CBAM, which focuses on critical features across channel and spatial dimensions, further improving the model’s accuracy and representational capacity [38]. The structure of CBAM is shown in Figure 1.
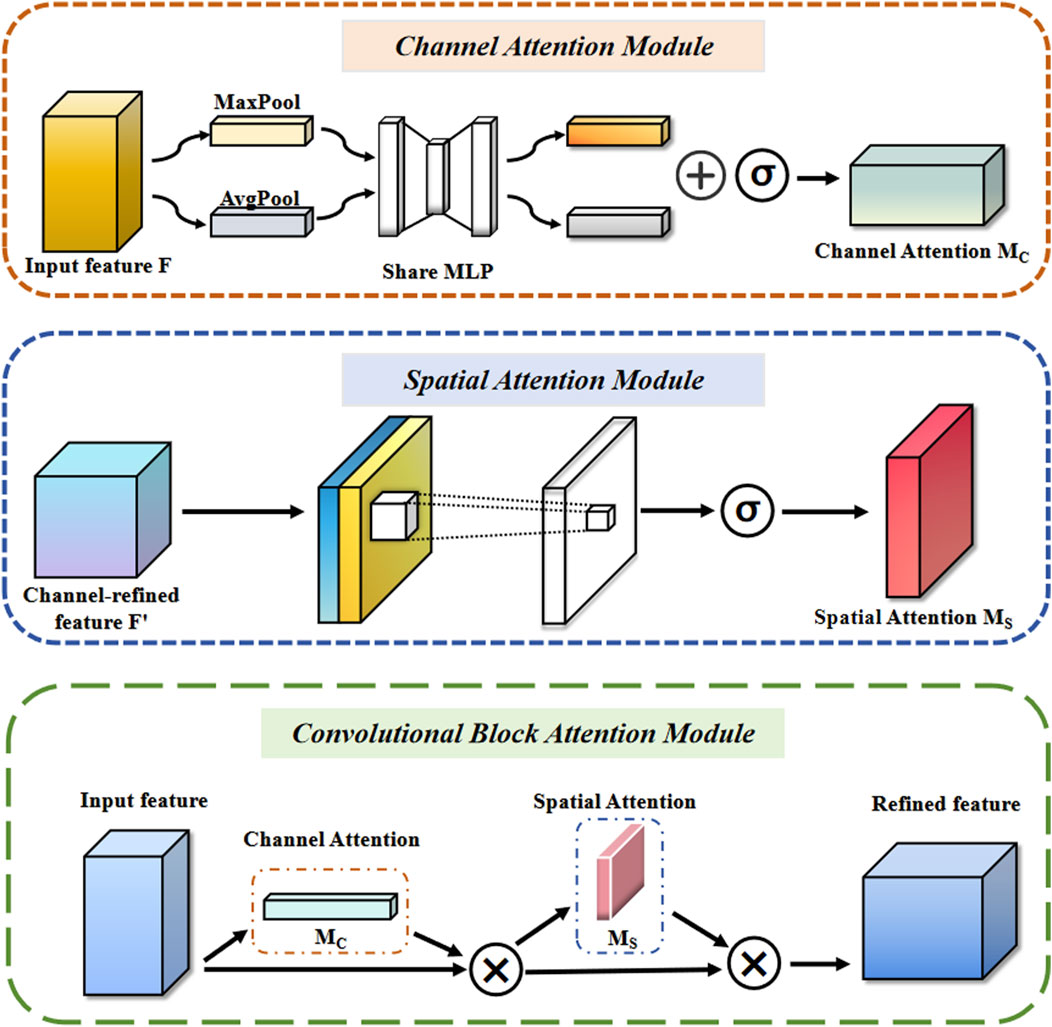
Figure 1. Structure of CBAM.
Specifically, the traditional MobileNet integrates the Squeeze-and-Excitation (SE) module, which focuses solely on channel-level features while neglecting spatial dimensions. In contrast, the CBAM module processes features across both channel and spatial dimensions while maintaining low computational overhead. The channel attention module assigns a weight to each channel by analyzing the significance of the input features along the channel dimension. Initially, the input feature
Finally, the original input feature
After generating the channel-enhanced features
Finally, the channel-enhanced feature
The MobileNet V3 model designed in this study consists of a series of Inverted Residual Blocks and Dense Layers, as shown in Table 2.
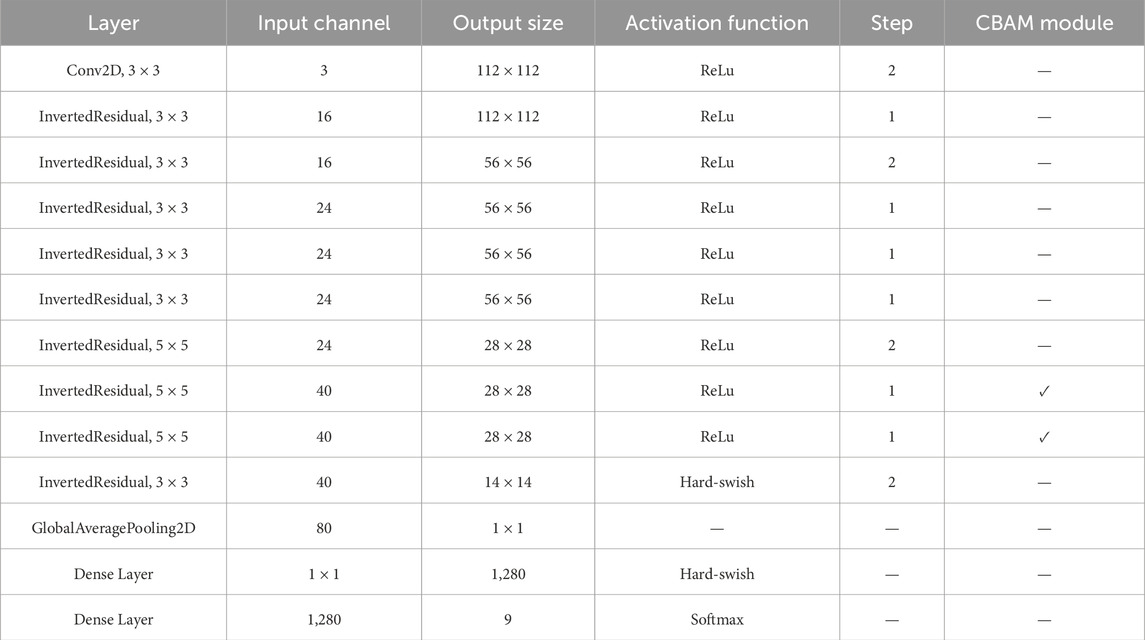
Table 2. Network structure of the MobileNet V3 model.
The initial layer employs a Conv2D 3 × 3 convolution with 3 input channels and an output size of 112 × 112, using the ReLU activation function and a stride of 2. This is followed by multiple Inverted Residual Blocks, with the number of input channels ranging from 16 to 40, and the output size gradually decreasing. Finally, a GlobalAveragePooling2D layer is applied to compress the feature map size to 1 × 1. The last two layers are fully connected layers: the first layer uses the Hard-swish activation function, with 1 × 1 input channels and an output size of 1,280; the second layer applies the Softmax activation function, with 1,280 input channels, and outputs probability scores for 9 classes. MobileNetV3 block is shown in Figure 2.
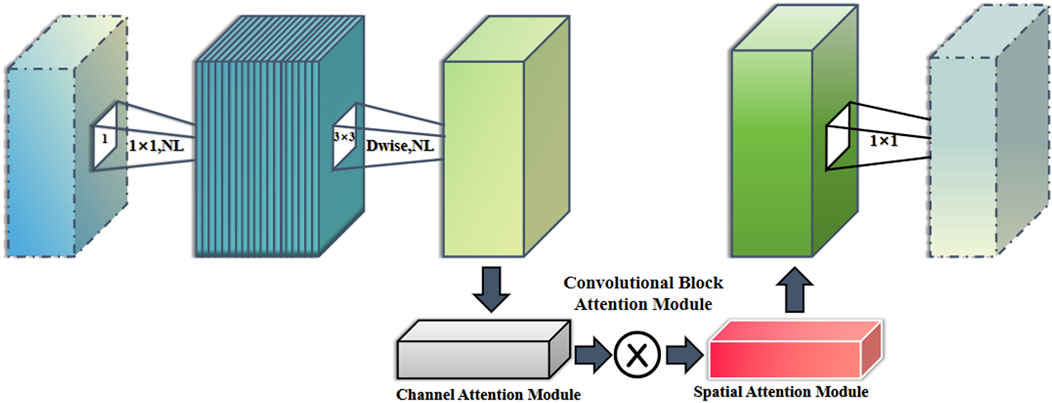
Figure 2. MobileNetV3 block.
The overall model construction of PowerMobileNet is shown in Figure 3.
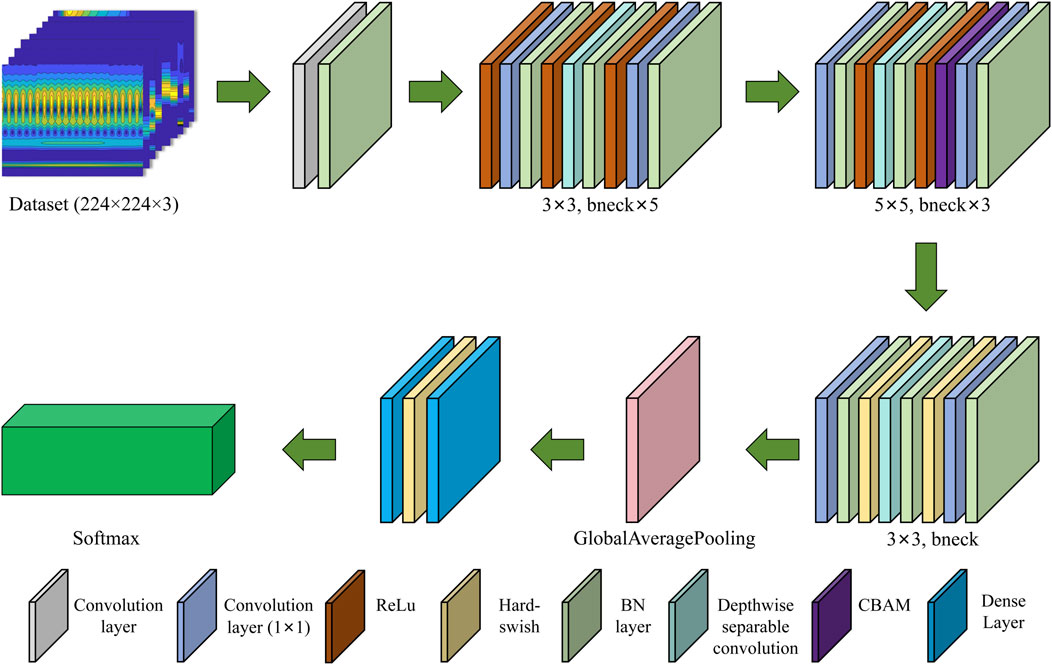
Figure 3. The computational process of the PowerMobileNet model.
Regarding the loss function, cross-entropy loss optimizes model performance by calculating the difference between the predicted probability distribution and the ground truth labels. However, the traditional cross-entropy loss function may fail to adequately account for data diversity, particularly when data points lack rich features, leading the model to generate random predictions. To address this issue, we adopt the Bias Loss function, which dynamically adjusts the weight of each data point, allowing the model to focus on samples with distinctive features during the optimization process. It is defined as follows, with Equation 6 representing the bias loss and Equation 7 defining the function z(vi):
here, N represents the number of samples, and K is the number of categories. The term
3 Experimental design
3.1 Data sample
Since the performance of deep learning networks heavily depends on the quantity and quality of training samples, it is crucial to have as many high-quality training data as possible. Adequate and well-annotated data can significantly enhance the generalization ability of the model, reducing the risk of overfitting and improving its robustness in real-world applications [46]. To validate the effectiveness of PowerMobileNet, we therefore generated nine different types of PQD signals using MATLAB R2024a, adhering to the IEEE 1159–2019 standard [47], referring to Li et al. and Khetarpal et al. ’s research [48, 49]. The nine types of signals include: Normal, Harmonics, Interruption, Sag, Swell, Flicker, Sag+Harmonics, Swell+Harmonics, and Transient Oscillation. The mathematical model of PQD is shown in Table 3. The original signal, the image after S transformation and the image after CBAM processing are shown in Figure 4. The MATLAB rand function was used, with a base frequency of 50 Hz and a sampling frequency of 3.2 kHz. The generated signals exhibit random amplitude and random disturbance occurrence times, within specified parameter ranges and sampling durations. After S-transformation, the image data is divided into training, testing and validation sets in a 4:1:1 ratio, with 9,000 samples for training, 2,250 samples for testing and 2,250 samples for validation, ensuring balanced class distribution.
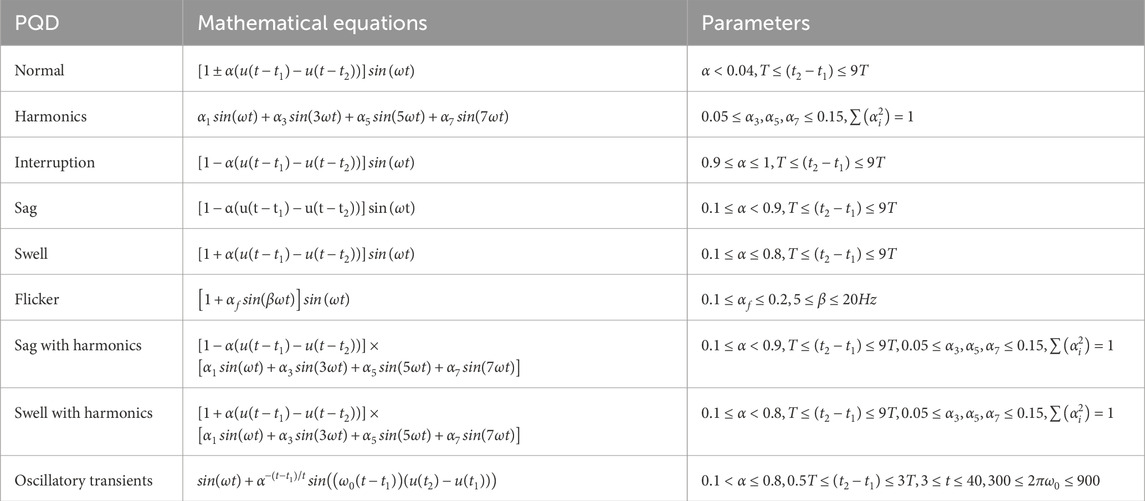
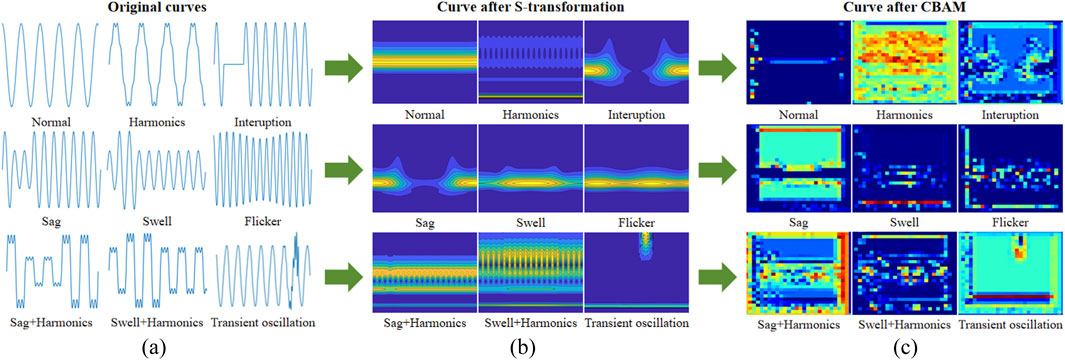
Figure 4. Correspondence diagram of the attention mechanism: (a) Original signal, (b) image after S-transformation processing, (c) image after CBAM processing.
To train the PowerMobileNet model, we used the SGD optimizer with a learning rate of 0.01 and momentum set to 0.9. The model was trained for 100 epochs with a batch size of 32. All input images were resized to 224 × 224 × 3 and normalized to the range [0, 1]. During training, data augmentation was applied including shear transformation (range: 0.2), zoom (range: 0.2), and horizontal flipping to improve generalization and prevent overfitting.
3.2 Comparison of the model with mainstream methods
Figures 5, 6 illustrate the variation of accuracy and loss function over the number of iterations for the compared models. It can be observed that PowerMobileNet stabilizes after approximately 25 epochs, with relatively minor fluctuations after convergence. In contrast, CNN exhibits poor convergence performance, with higher loss values and significant oscillations during training. Even after 100 epochs, its accuracy only hovers around 97%. When MobileNet V3 integrates the CBAM module, the validation accuracy steadily approaches 98.5%, and the loss function stabilizes around 0.10 after 40 iterations. Furthermore, replacing the cross-entropy loss function with Bias Loss and incorporating the CBAM module further improves classification accuracy by 0.76% and reduces the loss by 0.07. These results demonstrate that introducing the Bias Loss function mitigates random prediction issues in the optimization process, highlighting the robustness of PowerMobileNet and validating the effectiveness of the proposed method.
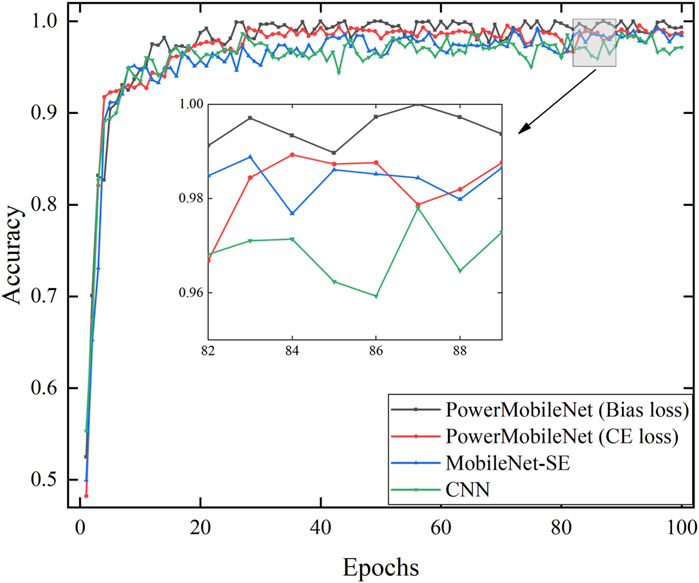
Figure 5. Comparison of accuracy with mainstream models.
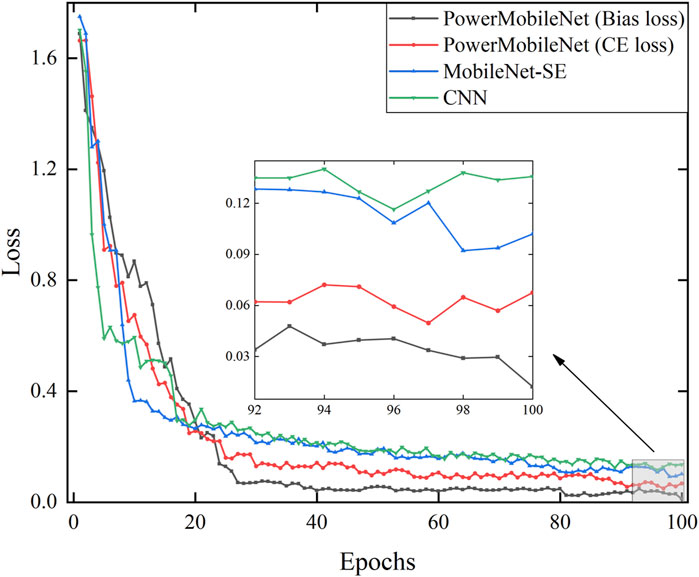
Figure 6. Comparison of loss function with mainstream models.
Figure 7 compare the confusion matrices of CNN, MobileNet-SE, and PowerMobileNet. The CNN model selected for comparison consists of 12 layers, similar to the layer count of the MobileNetV3 used in this study. It includes two convolutional blocks, each containing convolutional layers, LeakyReLU activation layers, and max-pooling layers. The convolutional output gradually increases to 192 channels. A flattening layer transforms the output into a fully connected layer with 4,096 neurons, followed by a Softmax activation function for 9-class classification. We added 30 dB white noise to each simulated signal to simulate random disturbances. As shown in Table 4, despite the presence of disturbance, PowerMobileNet achieved the highest prediction accuracy of 99.33%.
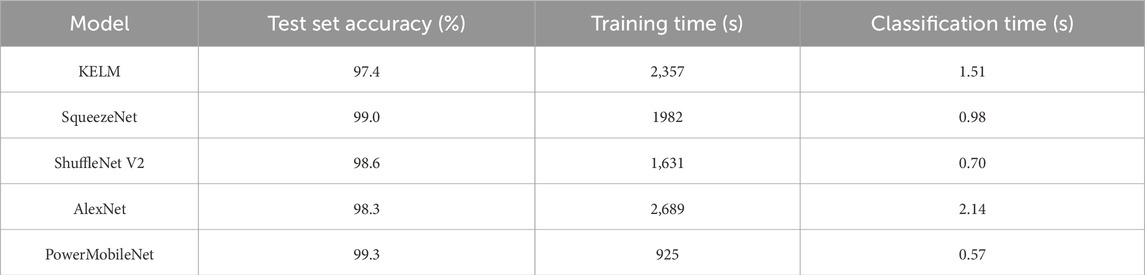
Table 4. The average classification results of each model for different types of PQD signals in 10 experiments.
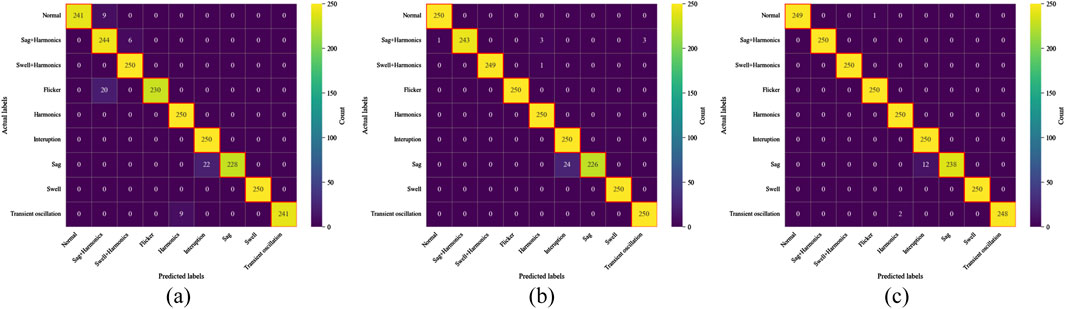
Figure 7. Comparison of confusion matrices with mainstream models: (a) the confusion matrices of CNN; (b) the confusion matrices of MobileNet-SE; (c) the confusion matrices of PowerMobileNet.
To provide a more comprehensive and rigorous evaluation and to validate the effectiveness of the proposed approach, we conducted comparative experiments between MobileNet-CBAM and state-of-the-art methods. These methods include the optimized KELM model [51] after feature vector extraction, as well as deep learning models such as SqueezeNet [50], ShuffleNet V2 [52], and AlexNet [53]. All experiments were performed on the same computing platform, which consists of an NVIDIA GeForce RTX 3060 GPU and an AMD Ryzen 7 5800H CPU, with Jupyter Notebook 7.0.8 as the programming environment. The Table 4 summarizes the average classification results of different models on various types of PQD signals over 10 experimental runs. The experimental results indicate that KELM and AlexNet require substantial memory and computational resources when processing large-scale PQD signal data, resulting in inefficiencies. In contrast, SqueezeNet and ShuffleNet V2 employ Fire Modules and layered convolution [54], respectively, to reduce the number of parameters, thereby improving test accuracy while maintaining a more compact model. The results in the table demonstrate that PowerMobileNet achieved the highest classification accuracy, outperforming KELM, SqueezeNet, ShuffleNet V2, and AlexNet by 1.95%, 0.30%, 0.71%, and 1.02%, respectively. Moreover, PowerMobileNet exhibited the shortest runtime, with a training duration of 925 s and a classification duration of 0.57 s, further validating its superior performance in PQD signal classification tasks.
3.3 The impact of noise on classification results
In real-world scenarios, PQD signals are inevitably affected by various unpredictable factors, leading to different levels of noise [48]. To demonstrate the robustness and generalizability of the proposed algorithm across different environments, we introduced noise with SNR of 40 dB, 30 dB, and 20 dB into the original signals and compared the classification performance. As shown in Table 5, the classification accuracy of PowerMobileNet exhibits a decreasing trend as the SNR decreases. However, even in a high-noise environment with an SNR of 20 dB, the lowest classification accuracy remains around 90%, highlighting its superior noise resistance.
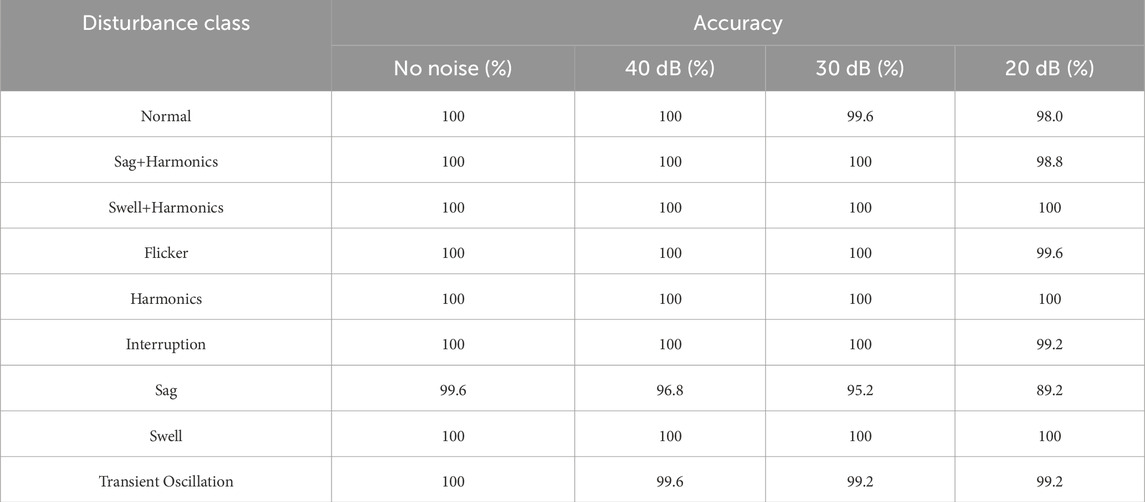
Table 5. The impact of different degrees of noise on classification results.
Figure 8 also presents the performance of the three models under varying SNR in the simulation dataset. Experiments conducted under four different conditions demonstrated that the MobileNet-CBAM model has fewer misclassified PQD instances, indicating strong robustness and exceptional performance.
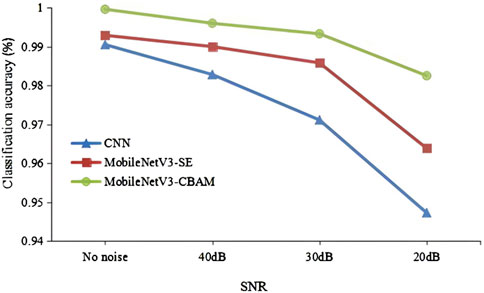
Figure 8. Model classification accuracy under different SNR conditions.
3.4 Ablation study
To quantitatively evaluate the contribution of the CBAM module to model performance, we conducted an ablation study by comparing the classification accuracy of two configurations: PowerMobileNet and its variant without CBAM module. The results are summarized in Table 6.
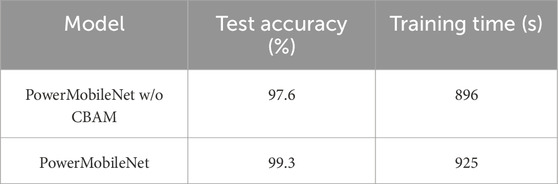
Table 6. Ablation study of attention modules on PQD classification.
As shown, the inclusion of CBAM results in a 1.7% improvement over the baseline with a minor time increase. This demonstrates that CBAM effectively enhances the focus on relevant features in both spatial and channel dimensions, thereby improving classification performance.
3.5 The comparison of model size and parameter count
In Table 7, we can clearly observe the differences in the parameter count of each model. When compared with CNNs that have similar layers and functionality, the MobileNetV3-CBAM significantly reduces computational complexity and parameter count. Moreover, while maintaining parameters comparable to MobileNetV3-SE, MobileNetV3-CBAM not only improves accuracy but also better satisfies the practical requirements for deployment on mobile devices and embedded systems.
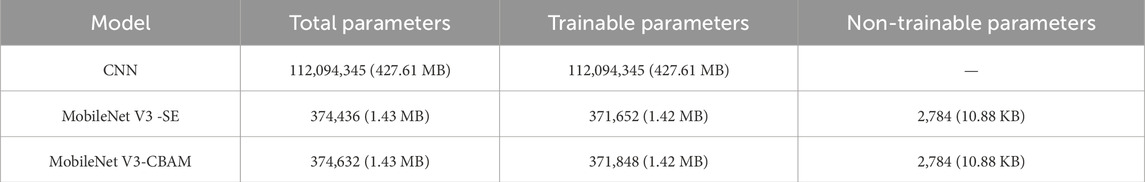
Table 7. Comparison of parameters of different models.
3.6 Validation on real-world dataset
To evaluate the real-world performance and generalization capability of PowerMobileNet, we conducted experiments on the publicly available SEED Power Quality Disturbance Dataset (SEED-PQD-v1), which is available at https://www.kaggle.com/datasets/sumairaziz/seed-power-quality-disturbance-dataset. This dataset contains 17 power disturbance classes, each with 1,000 signals sampled at 5 kHz. We compared PowerMobileNet against six representative models: CNN, MobileNet-SE, KELM, SqueezeNet, ShuffleNet V2, and AlexNet. The experimental conditions were exactly the same as the previous setup. The classification accuracy for each class and the overall average are reported.
As presented in Figure 9, PowerMobileNet achieved the highest overall classification accuracy (96.78%) across all 17 power quality disturbance (PQD) classes in the SEED-PQD-v1 dataset. This significantly outperforms the traditional CNN (88.03%), classical machine learning method KELM (85.11%), and several lightweight or well-established deep models including MobileNet-SE (91.91%), SqueezeNet (89.91%), ShuffleNet V2 (92.45%), and AlexNet (91.22%).
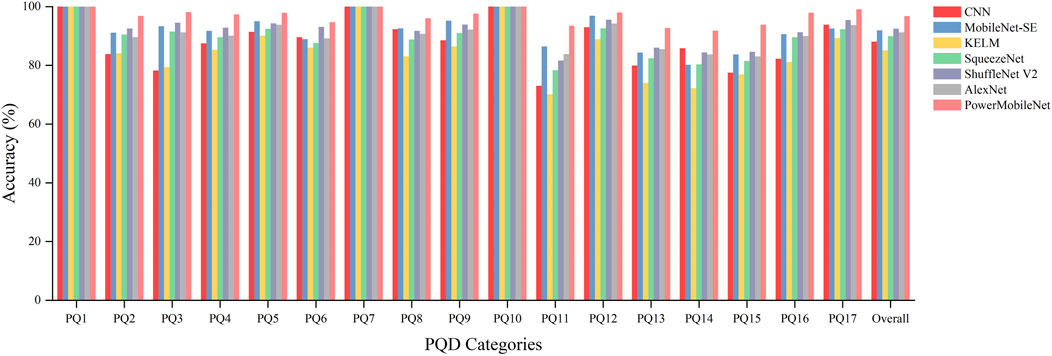
Figure 9. Class-wise accuracy comparison on SEED-PQD-v1 dataset.
In detail, for PQ2 (Sag), it outperforms CNN by 13.0% and ShuffleNet V2 by 4.3%. In PQ3 (Swell), PowerMobileNet achieves an improvement of 19.9% over CNN and 3.6% over ShuffleNet V2. Notably, PowerMobileNet exhibits improvement in several challenging PQD classesinvolving compound or transient disturbances. For instance, for PQ11 (Flicker with Sag) and PQ15 (Sag with Harmonics), the proposed model surpasses CNN by 20.5% and 16.3%, respectively, while also outperforming ShuffleNet V2 and AlexNet by 11.9% and 9.2%. These categories typically involve compound or transient features that are difficult to model using standard CNNs or shallow classifiers.
Furthermore, compared to models such as MobileNet-SE and ShuffleNet V2, which are known for their computational efficiency, PowerMobileNet still yields a clear 4%–5% accuracy gain on average, with only a modest increase in training time. These results validate the architectural enhancements introduced by CBAM and Bias Loss components.
4 Conclusion
In this study, we successfully developed a highly efficient and lightweight method for PQD classification using the PowerMobileNet model. The proposed approach integrates the S-transform for robust time-frequency feature extraction and the MobileNetV3-CBAM architecture for enhanced classification accuracy and efficiency. We compared PowerMobileNet with mainstream models in terms of accuracy, loss function, noise impact, model size and number of parameters. The experimental results achieved a classification accuracy of 99.33%, significantly surpassing traditional CNN (97.07%), MobileNetV3-SE (98.58%), and other state-of-the-art models such as KELM (97.4%), SqueezeNet (99.0%), ShuffleNet V2 (98.6%), and AlexNet (98.3%). The model also demonstrates remarkable robustness under varying SNR conditions, maintaining high accuracy even at low SNR levels (e.g., 90% accuracy at 20 dB). Additionally, PowerMobileNet achieves a substantial reduction in computational complexity, with a total parameter count of 374,632 (1.43 MB) compared to traditional CNNs (112,094,345 parameters, 427.61 MB). This efficiency is further evidenced by its short training duration of 925 s and classification time of 0.57 s. This makes it particularly well-suited for deployment in resource-constrained environments. Our research provides an efficient and accurate tool for power quality monitoring, indicating great potential for practical applications in power systems. Future research will focus on further optimizing the model structure and validating its generalization ability on broader datasets. In addition, we plan to deploy the model on embedded platforms such as Raspberry Pi or Jetson Nano in our subsequent research, in order to systematically evaluate its latency, memory consumption, and real-time performance, thereby promoting the transition of the algorithm from experimental validation to practical deployment in real-world power monitoring systems.
Data availability statement
The raw data supporting the conclusions of this article will be made available by the authors, without undue reservation.
Author contributions
ZH: Methodology, Formal Analysis, Writing – original draft, Writing – review and editing, Conceptualization, Project administration. BW: Writing – review and editing, Writing – original draft, Methodology, Visualization, Data curation. JL: Writing – original draft, Writing – review and editing, Formal Analysis, Validation, Data curation, Methodology. YH: Writing – original draft, Conceptualization, Writing – review and editing, Validation, Methodology. YY: Writing – review and editing, Resources, Data curation, Writing – original draft, Validation.
Funding
The author(s) declare that no financial support was received for the research and/or publication of this article.
Acknowledgments
The authors are grateful to all the editors and reviewers for their comments and suggestions.
Conflict of interest
The authors declare that the research was conducted in the absence of any commercial or financial relationships that could be construed as a potential conflict of interest.
Generative AI statement
The author(s) declare that no Generative AI was used in the creation of this manuscript.
Publisher’s note
All claims expressed in this article are solely those of the authors and do not necessarily represent those of their affiliated organizations, or those of the publisher, the editors and the reviewers. Any product that may be evaluated in this article, or claim that may be made by its manufacturer, is not guaranteed or endorsed by the publisher.
References
1. Huang B, Li Y, Zhan F, Sun Q, Zhang H. A distributed robust economic dispatch strategy for integrated energy system considering cyber-attacks. IEEE Trans Ind Inf (2022) 18:880–90. doi:10.1109/TII.2021.3077509
2. Wang R, Sun Q, Gui Y, Ma D. Exponential-function-based droop control for islanded microgrids. J Mod Power Syst Clean Energy (2019) 7:899–912. doi:10.1007/s40565-019-0544-3
3. Markovska M, Taskovski D, Kokolanski Z, Dimchev V, Velkovski B. Real-time implementation of optimized power quality events classifier. IEEE Trans Ind Applicat (2020) 1. doi:10.1109/TIA.2020.2991950
4. Thirumala K, Prasad MS, Jain T, Umarikar AC. Tunable-Q wavelet transform and dual multiclass SVM for online automatic detection of power quality disturbances. IEEE Trans Smart Grid (2018) 9:3018–28. doi:10.1109/TSG.2016.2624313
5. Feng S, Yang D, Zhou B, Luo Y, Li G. Real-time active power dispatch of virtual power plant based on distributed model predictive control. Electronics Lett (2022) 58:872–5. doi:10.1049/ell2.12640
6. Jing G, Liu J, Zhao T, Huang B, Wang R. Distributed dynamic event-triggered control for resilience-oriented current sharing in microgrid. IET Renew Power Gen (2024) 18:1332–45. doi:10.1049/rpg2.12799
7. Li Y, Gao DW, Gao W, Zhang H, Zhou J. A distributed double-Newton descent algorithm for cooperative energy management of multiple energy bodies in energy internet. IEEE Trans Ind Inf (2021) 17:5993–6003. doi:10.1109/TII.2020.3029974
8. Huang B, Liu L, Li Y, Zhang H. Distributed optimal energy management for microgrids in the presence of time-varying communication delays. IEEE Access (2019) 7:83702–12. doi:10.1109/ACCESS.2019.2924269
9. Qiu W, Tang Q, Liu J, Yao W. An automatic identification framework for complex power quality disturbances based on multifusion convolutional neural network. IEEE Trans Ind Inf (2020) 16:3233–41. doi:10.1109/TII.2019.2920689
10. Borges FAS, Fernandes RAS, Silva IN, Silva CBS. Feature extraction and power quality disturbances classification using smart meters signals. IEEE Trans Ind Inf (2016) 12:824–33. doi:10.1109/TII.2015.2486379
11. Tang Q, Qiu W, Zhou Y. Classification of complex power quality disturbances using optimized S-transform and kernel SVM. IEEE Trans Ind Electron (2020) 67:9715–23. doi:10.1109/TIE.2019.2952823
12. Huang G-B, Zhou H, Ding X, Zhang R. Extreme learning machine for regression and multiclass classification. IEEE Trans Syst Man Cybern B (2012) 42:513–29. doi:10.1109/TSMCB.2011.2168604
13. Zhang Q, Liu L. Whale optimization algorithm based on lamarckian learning for global optimization problems. IEEE Access (2019) 7:36642–66. doi:10.1109/ACCESS.2019.2905009
14. Yu G, Lin T, Wang Z, Li Y. Time-reassigned multisynchrosqueezing transform for bearing fault diagnosis of rotating machinery. IEEE Trans Ind Electron (2021) 68:1486–96. doi:10.1109/TIE.2020.2970571
15. Yan Y, Chen K, Geng H, Fan W, Zhou X. A review on intelligent detection and classification of power quality disturbances: trends, methodologies, and prospects. Computer Model Eng and Sci (2023) 137:1345–79. doi:10.32604/cmes.2023.027252
16. Li J, Liu H, Wang D, Bi T. Classification of power quality disturbance based on S-transform and convolution neural network. Front Energy Res. (2021) 9:708131. doi:10.3389/fenrg.2021.708131
17. Deng H, Gao Y, Chen X, Zhang Y, Wu Q, Zhao H. Harmonic analysis of power grid based on FFT algorithm. In: 2020 IEEE international conference on smart cloud (SmartCloud). Washington DC, WA, USA: IEEE (2020). p. 161–4. doi:10.1109/SmartCloud49737.2020.00038
18. Kumar R, Singh B, Shahani DT, Chandra A, Al-Haddad K. Recognition of power-quality disturbances using S-Transform-Based ANN classifier and rule-based decision tree. IEEE Trans Ind Applicat (2015) 51:1249–58. doi:10.1109/TIA.2014.2356639
19. Huang NE, Wu Z. A review on Hilbert-Huang transform: method and its applications to geophysical studies. Rev Geophys (2008) 46:2007RG000228. doi:10.1029/2007RG000228
20. Dhoriyani SL, Kundu P. Comparative group THD analysis of power quality disturbances using FFT and STFT. In: 2020 IEEE first international conference on smart technologies for power, energy and control (STPEC). Nagpur, India: IEEE (2020). p. 1–6. doi:10.1109/STPEC49749.2020.9297759
21. He S, Li K, Zhang M. A new transient power quality disturbances detection using strong trace filter. IEEE Trans Instrum Meas (2014) 63:2863–71. doi:10.1109/TIM.2014.2326762
22. Wan EA, Van Der Merwe R. The unscented Kalman filter for nonlinear estimation. In: Proceedings of the IEEE 2000 adaptive systems for signal processing, communications, and control symposium (cat. No.00EX373). Canada: IEEE, Lake Louise, Alta. (2000). p. 153–8. doi:10.1109/ASSPCC.2000.882463
23. Wang H, Wang P, Liu T. Power quality disturbance classification using the S-transform and probabilistic neural network. Energies (2017) 10:107. doi:10.3390/en10010107
24. Gu YH, Bollen MHJ. Time-frequency and time-scale domain analysis of voltage disturbances. IEEE Trans Power Deliv (2000) 15:1279–84. doi:10.1109/61.891515
25. Gao W, Ning J. Wavelet-based disturbance analysis for power system wide-area monitoring. IEEE Trans Smart Grid (2011) 2:121–30. doi:10.1109/TSG.2011.2106521
26. Wang R, Sun Q, Tu P, Xiao J, Gui Y, Wang P. Reduced-order aggregate model for large-scale converters with inhomogeneous initial conditions in DC microgrids. IEEE Trans Energy Convers. (2021) 36:2473–84. doi:10.1109/TEC.2021.3050434
27. De Yong D, Bhowmik S, Magnago F. An effective power quality classifier using wavelet transform and support vector machines. Expert Syst Appl (2015) 42:6075–81. doi:10.1016/j.eswa.2015.04.002
28. Mishra PK, Subudhi U, Jain S. Power quality disturbances classification with deep learning approach. In: 2019 international conference on information Technology (ICIT). Bhubaneswar, India: IEEE (2019). p. 273–8. doi:10.1109/ICIT48102.2019.00055
29. Dong Y, Cao H, Ding X, Xu G, Yue C. Multi-task learning method for classification of multiple power quality disturbances. IET Generation Trans and Dist (2020) 14:900–9. doi:10.1049/iet-gtd.2019.0812
30. Haddad RJ, Guha B, Kalaani Y, El-Shahat A. Smart distributed generation systems using artificial neural network-based event classification. IEEE Power Energy Technol. Syst. J. (2018) 5:18–26. doi:10.1109/JPETS.2018.2805894
31. Kumwenda B. Voltage event signature classification for power quality disturbance identification. In: Proceedings of the international conference on industrial engineering and operations management. Lusaka, Zambia: IEOM Society International (2023). doi:10.46254/AF04.20230068
32. Zheng G, Shi M-X, Liu D, Yao J, Zhu-Mei M. Power quality disturbance classification based on rule-based and wavelet-multi-resolution decomposition. In: Proceedings. International conference on machine learning and cybernetics. Beijing, China: IEEE (2002). p. 2137–41. doi:10.1109/ICMLC.2002.1175416
33. Saber AM, Selim A, Hammad MM, Youssef A, Kundur D, El-Saadany E. A novel approach to classify power quality signals using vision transformers. In: Iecon 2024 - 50th annual conference of the IEEE industrial electronics society. Chicago, IL, USA: IEEE (2024). p. 1–6. doi:10.1109/IECON55916.2024.10905293
34. Anwar MH, Baig MMA, Shaikh AJ, Abro AG (2024). Detection and classification of power quality disturbances: vision transformers vs cnn. Sch. Google. doi:10.2139/ssrn.5061558
35. Liu Z, Wang Y, Wang Q, Hu M. Vision transformer-based anomaly detection in smart grid phasor measurement units using deep learning models. IEEE Access (2025) 13:44565–76. doi:10.1109/ACCESS.2025.3549679
36. Khetarpal P, Nagpal N, Siano P, Al-Numay M. Power quality disturbance signal segmentation and classification based on modified BI-LSTM with double attention mechanism. IET Generation Trans and Dist (2024) 18:50–62. doi:10.1049/gtd2.13065
37. Li Y, Ku B, Kim G, Ahn J-K, Ko H. Seismic signal synthesis by generative adversarial network with gated convolutional neural network structure. In: Igarss 2020 - 2020 IEEE international geoscience and remote sensing symposium. Waikoloa, HI, USA: IEEE (2020). p. 3857–60. doi:10.1109/IGARSS39084.2020.9323670
38. Tran SN, d’Avila Garcez AS. Deep logic networks: inserting and extracting knowledge from deep Belief networks. IEEE Trans Neural Netw Learn Syst. (2018) 29:246–58. doi:10.1109/TNNLS.2016.2603784
39. Kazan National Research Technical University named after A.N. Tupolev. Convolutional neural network model for defects localization and classification on plates during semiconductor production. Herald Technol Univ (2024) 27(7):126–30. doi:10.55421/1998-7072_2024_27_7_126
40. Tan M, Le Q. EfficientNet: rethinking model scaling for convolutional neural networks. In: Proceedings of the 36th International Conference on Machine Learning (ICML 2019). Long Beach, CA: PMLR (2019). 6105–6114.
41. Han K, Wang Y, Tian Q, Guo J, Xu C, Xu C. GhostNet: more features from cheap operations. In: 2020 IEEE/CVF conference on computer vision and pattern recognition (CVPR). Seattle, WA, USA: IEEE (2020). p. 1577–86. doi:10.1109/CVPR42600.2020.00165
42. Howard A, Sandler M, Chen B, Wang W, Chen L-C, Tan M, et al. Searching for MobileNetV3. In: 2019 IEEE/CVF international conference on computer vision (ICCV). Seoul, Korea (South): IEEE (2019). p. 1314–24. doi:10.1109/ICCV.2019.00140
44. Stockwell RG, Mansinha L, Lowe RP. Localization of the complex spectrum: the S transform. IEEE Trans Signal Process (1996) 44:998–1001. doi:10.1109/78.492555
45. Woo S, Park J, Lee J-Y, Kweon IS. CBAM: convolutional block attention module. In: V Ferrari, M Hebert, C Sminchisescu, and Y Weiss, editors. Computer vision – eccv 2018. Cham: Springer International Publishing (2018). p. 3–19. doi:10.1007/978-3-030-01234-2_1
46. Dan H-C, Lu B, Li M. Evaluation of asphalt pavement texture using multiview stereo reconstruction based on deep learning. Construction Building Mater (2024) 412:134837. doi:10.1016/j.conbuildmat.2023.134837
47. Institute of Electrical and Electronics Engineers. IEEE recommended practice for monitoring electric power quality. New York: Institute of Electrical and Electronics Engineers (2009).
48. Li H, Zhu C, Liu X, Li L, Liu H. Hybrid binarized neural network for high-accuracy classification of power quality disturbances. Electr Eng (2024). doi:10.1007/s00202-024-02650-y
49. Khetarpal P, Tripathi MM. Classification of power quality disturbances using semi-supervised deep Belief networks. J Electr Eng Technol (2023) 18:3191–200. doi:10.1007/s42835-023-01423-0
50. Xi Y, Li X, Tang X, Li Z, Shen Y, Zeng X. Classification of multiple power quality disturbances based on continuous wavelet transform and lightweight convolutional neural network. SSRN J (2022). doi:10.2139/ssrn.4164374
51. Jing G, Wang D, Xiao Q, Shen Q, Huang B. Power quality disturbance signal classification in microgrid based on kernel extreme learning machine. Electronics Lett (2024) 60:e13312. doi:10.1049/ell2.13312
52. Laavanya M, Vijayaraghavan V. Residual learning of transfer-learned AlexNet for image denoising. IEIESPC (2020) 9:135–41. doi:10.5573/IEIESPC.2020.9.2.135
53. Ma N, Zhang X, Zheng H-T, Sun J. ShuffleNet V2: practical guidelines for efficient CNN architecture design. In: V Ferrari, M Hebert, C Sminchisescu, and Y Weiss, editors. Computer vision – eccv 2018. Cham: Springer International Publishing (2018). p. 122–38. doi:10.1007/978-3-030-01264-9_8
54. Li B, Xu J, Lian Y, Sun F, Zhou J, Luo J. Improved MobileNet V3-based identification method for road adhesion coefficient. Sensors (2024) 24:5613. doi:10.3390/s24175613
Nomenclature
BiLSTM Bidirectional long short-term memory
CBAM Convolutional block attention module
CNN Convolutional neural network
DWT Discrete wavelet transform
DBN Deep Belief Networks
FFT Fast Fourier transform
GAP Global average pooling
GRU Gated recurrent unit
GMP Global max pooling
HHT Hilbert–Huang transform
KELM Kernel extreme learning machine
KF Kalman Filtering
MLP Multi-layer perceptron
PQD Power quality disturbance
SE Squeeze-and-excitation
SNR Signal-to-noise ratio
STFT Short-time Fourier transform
SVM Support vector machine
SVD Singular Value Decomposition
ViTs Vision Transformers
Keywords: power quality disturbances, MobileNetV3-CBAM, S-transform, lightweight model, real-time monitoring
Citation: Hou Z, Wang B, Liu J, He Y and Yao Y (2025) Physics-inspired time-frequency feature extraction and lightweight neural network for power quality disturbance classification. Front. Phys. 13:1616367. doi: 10.3389/fphy.2025.1616367
Received: 22 April 2025; Accepted: 24 June 2025;
Published: 17 July 2025.
Edited by:
Priyambada Tripathi, Vidyashilp University, IndiaReviewed by:
Kunjabihari Swain, National Institute of Science and Technology, IndiaIndu Sekhar Samanta, Siksha O Anusandhan University, India
Copyright © 2025 Hou, Wang, Liu, He and Yao. This is an open-access article distributed under the terms of the Creative Commons Attribution License (CC BY). The use, distribution or reproduction in other forums is permitted, provided the original author(s) and the copyright owner(s) are credited and that the original publication in this journal is cited, in accordance with accepted academic practice. No use, distribution or reproduction is permitted which does not comply with these terms.
*Correspondence: Zhiwen Hou, aG91emVAbWFpbC51Yy5lZHU=
†These authors have contributed equally to this work