- School of Computer and Communication Engineering, University of Science and Technology Beijing, Beijing, China
Introduction: Recent advancements in brain network analysis have greatly improved the diagnosis of neurodegenerative diseases. However, most existing studies rely on single-frequency EEG representations and overlook the joint modeling of real and imaginary connectivity in the frequency domain.
Methods: To address this limitation, we propose a novel complex-valued brain network framework for diagnosis through component-aware feature fusion. EEG signals are first transformed into complex-valued representations using frequency-domain filtering. A Complex-valued Brain Network Construction (CBNC) module with multi-scale real and imaginary convolutions is then employed to capture dynamic inter-channel interactions. Finally, a Component-Aware Feature Fusion (CAFF) mechanism integrates multicomponent features by modeling cross-component semantic consistency, leading to more expressive and physiologically meaningful brain networks.
Results: Extensive experiments on two benchmark datasets show that the proposed method achieves an accuracy of 91.59% for mild cognitive impairment detection and 99.99% for stroke detection, consistently surpassing state-of-the-art methods in both accuracy and robustness.
Discussion: These results demonstrate that integrating real and imaginary connectivity with component-aware feature fusion offers a more effective and physiologically grounded representation of brain networks. The proposed framework provides a promising direction for improving the diagnosis of neurodegenerative diseases.
1 Introduction
Neurodegenerative diseases, such as mild cognitive impairment (MCI) and stroke, pose significant threats not only to individual health but also to public healthcare systems and social welfare [1, 2]. Electroencephalography (EEG) has become a powerful non-invasive tool for diagnosing such disorders by capturing electrical activity in the brain. It offers valuable insights into neural activation patterns and connectivity among regions of interest (ROIs), which reflect the cognitive and behavioral functions of the brain [3]. EEG signals can reflect variations in frequency and amplitude based on the subject’s biological state, mental state, age, disease process, etc. Consequently, the state changes in EEG signals in different periods of MCI can serve as a biomarker for MCI identification. Recent advancements in neuroimaging technology, magnetic resonance imaging (MRI), diffusion tensor imaging (DTI), functional magnetic resonance imaging (fMRI), positron emission computed tomography (PET), and other imaging techniques have made it possible to reveal the structural features and functional activity characteristics of the human brain in the early stage of disease Nordberg et al. [4]. The blood oxygen-dependent level (BOLD) signal, a neurophysiological marker obtained through resting-state functional magnetic resonance imaging (rs-fMRI), can capture changes in neuronal activities in the brain Drew [5] (see Figure 1). Jitsuishi and Yamaguchi [6] used multi-modal MRI data to identify the optimal machine learning model to classify EMCI and LMCI, achieving an accuracy of
Recent studies have demonstrated that many neurodegenerative diseases, such as Alzheimer’s disease and MCI, are associated with disruptions in the connectivity patterns among ROIs [4, 8]. These disruptions can be effectively captured through EEG-based brain network analysis, making EEG a sensitive and reliable modality for early diagnosis and progression monitoring [9, 10]. Nonetheless, EEG signals are typically non-stationary, multi-scale, and composed of complex waveforms, which complicates the extraction of discriminative features using traditional handcrafted approaches. With advancements in deep learning, data-driven models have shown great potential in learning complex representations from raw EEG data, particularly when large-scale datasets are available. These models can automatically capture high-level semantic patterns that are challenging to define manually, thereby enhancing diagnostic accuracy and model generalization.
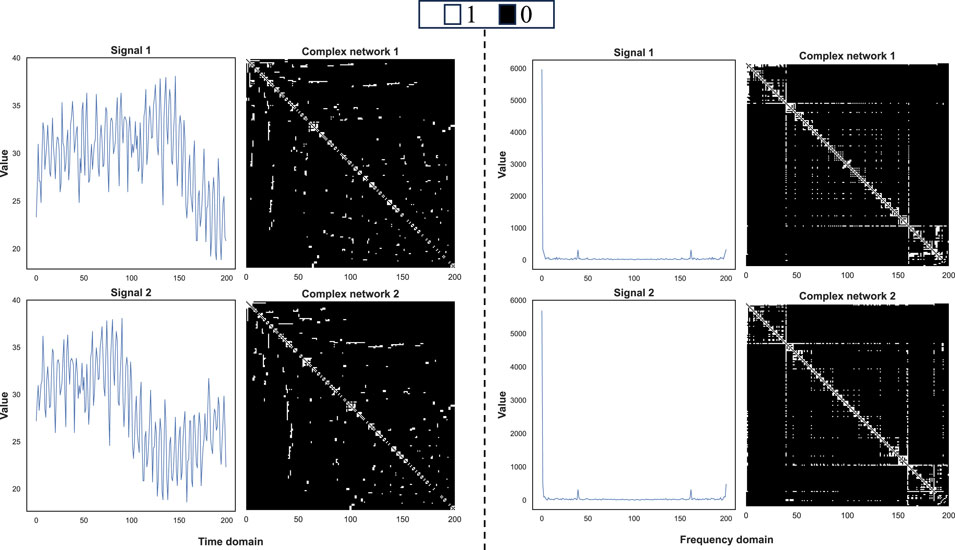
To overcome the aforementioned challenges, recent efforts have increasingly focused on deep learning methods, particularly those based on graph neural networks (GNNs), which are particularly effective for modeling graph-structured data such as EEG connectivity networks [11]. GNNs have shown excellent capabilities in capturing complex spatial dependencies and temporal dynamics within EEG signals, often surpassing traditional architectures such as convolutional neural networks (CNNs) and long short-term memory (LSTM) networks [12]. These advantages have made GNNs a promising framework for various brain-related applications, including brain-computer interfaces, affective computing, and the diagnosis of neurological and neurodegenerative disorders [13, 14]. Current studies on MCI detection have primarily focused on temporal analysis, wherein the original time-domain EEG signals are directly transformed into graph representations. Nonetheless, as illustrated in Figure 2, such approaches often neglect the phase-shift issue inherent in time-domain signals. For instance, the two EEG signals shown belong to the same class, yet Signal 2 is merely a phase-shifted version of Signal 1. When directly transformed into graph representations using a variation graph, they yield significantly different results in the time domain, despite exhibiting high similarity in the frequency domain. This observation underscores a critical advantage of frequency-domain transformation, specifically its ability to mitigate the adverse effects of phase shifts. Therefore, a key prerequisite for the success of GNN-based models is the construction of accurate and informative brain networks, as the quality of the input graph directly influences downstream performance. Notably, a significant portion of existing research has focused on constructing brain networks in the frequency domain, utilizing the spectral properties of EEG signals to capture inter-regional dependencies [15, 16]. Though this approach provides valuable physiological insights, it often ignores the complex-valued nature of EEG frequency components, particularly the joint consideration of both real and imaginary parts, which are crucial for representing effective connectivity [17, 18].
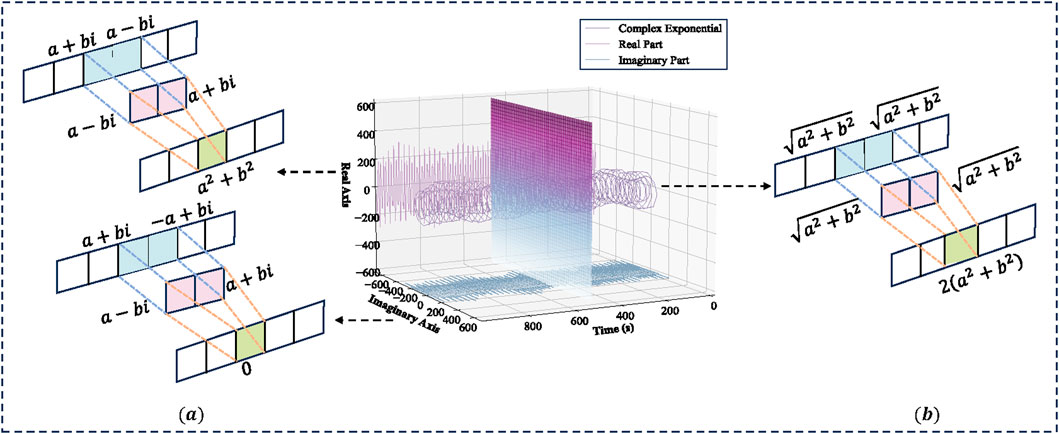
Nevertheless, two great challenges persist in existing methods. First, they often ignore the fundamental physiological significance of the complex-valued components of frequency-domain EEG signals. Due to the continuous nature of brain activity in the frequency domain, the propagation of EEG network information occurs simultaneously through both real and imaginary components [19], as depicted in Figure 3. Traditional learning approaches usually extract features only based on the amplitude of each frequency window. However, as illustrated in Figure 3a, two different complex-valued numbers with the identical amplitude
This practice fails to model the evolutionary relationships between real and imaginary components over time, resulting in the loss of critical information, particularly that reflecting phase synchronization among brain regions [20]. Furthermore, although a few studies have investigated multi-component graph representations using distinct learning pathways for real and imaginary parts, they often overlook the fusion of these components, leading to suboptimal integration and limited representation power [21]. Hence, to overcome these limitations, it is crucial to design a multi-scale convolutional framework that jointly models the dynamic interactions across EEG channels from both real and imaginary components, thereby facilitating the construction of more expressive and physiologically meaningful multi-component brain networks.
To better detect brain disorders, the fusion of diverse EEG-derived features has attracted increasing attention in recent years [22, 23]. For example, several studies have demonstrated the effectiveness of combining selected EEG channels using deep learning and machine learning techniques for accurate classification of neurodegenerative diseases in [22]. A clustering-based fusion feature selection method is proposed to effectively identify discriminative EEG features for diagnosing major depressive disorders from resting-state data in [23]. Existing methods for frequency-domain EEG feature fusion can be mainly divided into two categories. The first category transforms frequency sequences into vectorized forms and independently extracts frequency-specific and spatial features [24], often ignoring the distinct contributions of different components in the frequency spectrum. The second category aims to learn topological structures from frequency-based connectivity networks directly, but fails to account for the temporal continuity and local connectivity among EEG data points [25, 26].
However, despite these advancements, existing EEG-based brain network studies still encounter several significant limitations that hinder their diagnostic effectiveness [17, 27]. First, many approaches construct networks using single-frequency or amplitude-only representations, disregarding the combined contribution of real and imaginary components in the frequency domain, which are essential for capturing effective connectivity. Second, conventional graph construction methods often depend on static adjacency structures or predefined connectivity measures, restricting their capacity to model the dynamic and multiscale dependencies inherent in EEG signals. Third, while some studies attempt to model multi-component features, they generally process each component independently, neglecting the integration of cross-component information, which results in suboptimal representation power. Finally, existing feature fusion strategies frequently overlook the semantic consistency between components, leading to degraded discriminative capacity. Collectively, these limitations impede the development of robust and physiologically meaningful brain network models for accurate neurodegenerative disease diagnosis.
To address these challenges, this paper proposes a novel complex-valued brain network framework for the diagnosis of neurodegenerative diseases through component-aware feature fusion. The framework jointly models real and imaginary components of frequency-domain EEG through multi-scale complex-valued convolutions and dynamically integrates cross-component information via a semantic-consistency-aware fusion mechanism. This approach enables the creation of more expressive and physiologically relevant brain network representations. Based on the above motivation and discussion, the technical contributions of the proposed method are summarized as follows:
2 Methods
The proposed framework processes the EEG signals through four primary stages (Figure 4). First, the raw multi-channel EEG signals are transformed from the time domain into the frequency domain using Fast Fourier Transform (FFT), resulting in both real and imaginary components. Second, the CBNC module applies multi-scale convolutions to these components separately to capture local and multi-scale spatiotemporal interactions, constructing corresponding real-part and imaginary-part brain networks. Third, the CAFF module encodes the two brain networks and dynamically aligns their features through a correspondence matrix, enabling cross-component interaction modeling. Fourth, the fused features are processed by the Complex-valued Graph Convolution (CGC) module to learn higher-order topological representations, which are subsequently classified to produce the final diagnostic output. This sequential design ensures that each stage builds upon the previous one, from raw signal transformation to biologically informed network modeling and final disease classification.
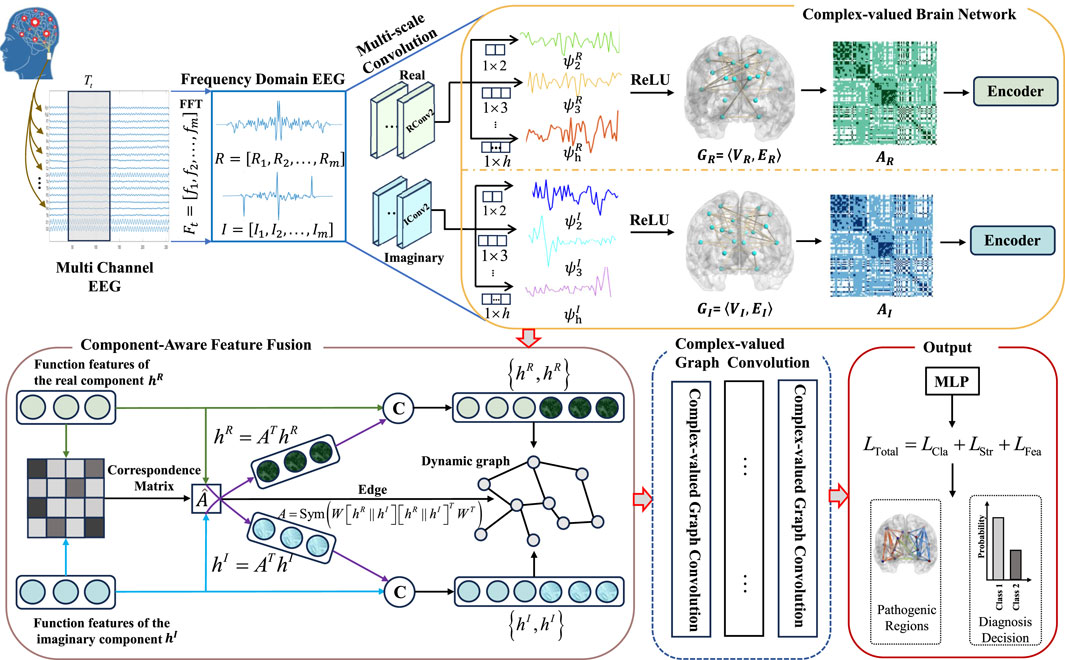
Figure 4. The schematic diagram of the proposed framework. Illustration of the proposed CBNC mechanism, including the real component and the imaginary component. The complex-valued brain networks are first encoded and then formulated into a correspondence matrix for reasoning in CAFF. The multi-component representations are embedded in CGC.
2.1 Preliminaries
Definition 1. EEG. EEG is a type of physiological signal that records electrical activities in the brain. In this paper, the height and width of an EEG signal are scaled to a fixed size
Definition 2. Brain network. A brain network of EEG with a size of
2.2 Frequency-domain analysis of EEG
Building on the EEG definitions in Section 2.1, the raw time-domain signals are first transformed into the frequency domain to obtain real and imaginary components, forming the basis for subsequent brain network construction. First, the original time-domain EEG signal
where
Therefore, multi-channel EEG can be represented as
2.3 CBNC
With the frequency-domain real and imaginary components obtained in Section 2.2, the next step is to model their spatial–temporal relationships. To achieve this, the CBNC module applies multi-scale convolution to each component, generating corresponding complex-valued brain networks. To capture dynamic interactions across EEG channels from different components (2) for the construction of complex-valued brain networks
where
Then, the nonlinear activation function ReLU is used to deal with
where
In this approach, the complex-valued brain networks can be obtained in the form of the feature matrices
The CBNC module involves the dynamic, complex-valued construction of the brain network in the frequency domain. By extracting specific features that capture dynamic interactions across EEG channels from different components, it can flexibly explore certain interactions among multiple components of the complex-valued EEG signal.
2.4 CAFF
The real-part and imaginary-part brain networks from CBNC contain complementary connectivity information. To exploit these synergies, the CAFF module encodes both networks and dynamically aligns their features for joint modeling. In this section, the dynamic graph mechanism is utilized to effectively integrate the diverse features learned by CBNC, as inspired by [28]. It regularizes latent representations by implicitly modeling cross-component semantic consistency.
2.4.1 Brain Network Encoder
The complex-valued brain networks derived from 2.3 are heterogeneous, and simply embedding features together may lead to performance degradation. In this context, it is crucial to precisely parse the brain network of each component. Formally, an encoder operation
where
2.4.2 Correspondence Matrix
With the embedded
where
2.4.3 Dynamic Graph
By obtaining the normalized correspondence matrix
With the obtained embedded representations
2.5 CGC
After feature alignment in CAFF, the real and imaginary component representations are further integrated through CGC, allowing for higher-order feature aggregation while preserving component-specific structural information. In this paper, a CGC module is proposed to perform a convolution on the multi-component brain networks. To address the heterogeneous features between components, the CGC module applies convolutions to each component and aggregates the representations of every component separately. Then, spatial aggregation is performed on the graphs for message passing instead of spectral graph convolution. Given that the brain network is fully connected, graph spatial convolution, as well as spectral graph convolutions, can aggregate global information. In this approach, the graph spatial convolution is formulated as shown in Equation 9:
where
Then, the fused features of the multi-component are defined as demonstrated in Equation 10:
Then, the Graph Isomorphism Network (GIN) is introduced to accurately capture the deeper insights into the brain network structure and its responses to various stimuli. The operational mechanism is given by Equation 11:
where
2.6 Classifier design and loss function
Finally, the fused graph features from CGC are fed into a classification module, which generates the diagnostic decision. Multiple loss terms are combined to ensure both classification accuracy and structural/feature consistency. A classifier is designed to classify the generated brain networks. It aggregates through multi-component perceptrons, containing graphical representations of rich pathological information, and ultimately connects with the Softmax function to output the prediction probability of each category of diseases. This module is composed of a three-layer backpropagation neural network, two layers of ReLu activation function, and a Softmax output layer. Specifically, the Softmax input consists of four neurons that map the results to the probabilities of four disease categories. The Dropout strategy is employed to prevent the model from overfitting.
2.6.1 Classification loss
The cross-entropy function Equation 12 is taken as the classification loss. In our study, the number of classes
2.6.2 Structural consistency loss
A structural consistency loss is designed to guarantee that the fused graph can maintain the topological characteristics of both the real part graph and the imaginary part graph in terms of structure. The fused graph is aligned with the real part graph and the imaginary component graph, respectively. This loss functions Equations 13, 14 use the Mean Squared Error (MSE) to measure the difference between the adjacency matrices:
where
2.6.3 Feature consistency loss
To improve the alignment between the encoded features of the real part graph and the imaginary part graph, the cosine similarity loss is introduced to encourage the feature vectors of the two components to maintain consistency in direction as Equation 15:
Finally, the overall loss function of the proposed model is given by Equation 16:
3 Experiment
3.1 Datasets
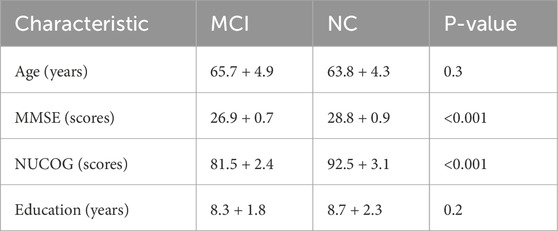
Experiments are conducted on the public MCI (www.biosigdata.com) and collected CVA datasets, as listed in Table 1:
3.2 Settings
The proposed method was implemented in Python with PyTorch. All experiments were conducted on a computer equipped with an Intel(R) Xeon(R) Platinum 8383C CPU @ 2.70 GHz and eight NVIDIA A800 80 GB GPUs. The cross-entropy loss function and the Adam optimizer were employed, with a learning rate of
Additionally, a grid search was employed in the experiments to identify the optimal hyperparameter combinations. Accuracy (ACC), precision (PRE), specificity (SPE), sensitivity (SEN), F1-score (F1), characteristic curve (AUC), and average precision (AP) were used in the experiment. Specifically, AUC is defined as the area under the Receiver Operating Characteristic (ROC) curve and the coordinate axis, serving as a measure of classification performance. AP is defined as the area under the precision-sensitivity curve, which assesses the classifier’s accuracy at different sensitivity levels. The calculation of the performance evaluation indicators is given by Equation 17:
where TP means the number of true positives, TN means the number of true negatives, FP means the number of false positives, and FN means the number of false negatives, respectively.
3.3 Baselines
To comprehensively evaluate the effectiveness of this method, it was compared with three representative baselines: the traditional graph neural network method (GCN, GAT), the traditional temporal modeling method (DLinear, SigNet, Mamba), and the brain network modeling method (LGGNet, ACTNet, XG-GNN). All models were compared using the same dataset and evaluation metrics.
3.4 Analysis of parameter sensitivity
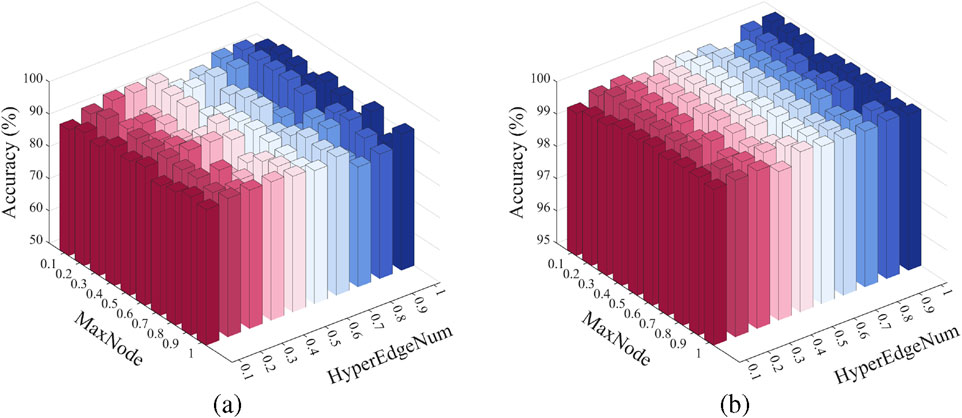
To evaluate the model’s sensitivity to the weights of different loss terms, parameter sensitivity experiments were conducted on the structural consistency loss coefficient
Figure 5 demonstrates that the model exhibits minimal performance fluctuations under different
Specifically,
Meanwhile,
In the proposed DMGP module, the hyperparameter
In conclusion, the variation of these two parameters within the specified range does not result in significant performance degradation, suggesting that the model exhibits good hyperparameter robustness and can achieve stable performance in practical applications without requiring precise tuning.
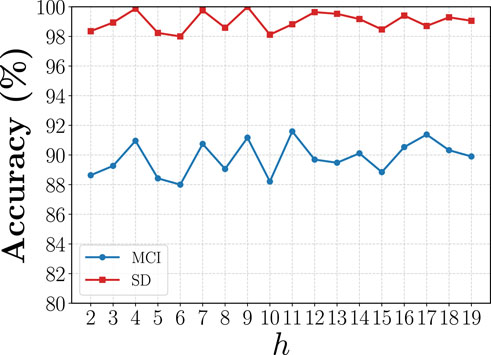
Figure 6. Sensitivity analysis of the DMGP hyperparameter on classification accuracy for MCI and SD datasets.
4 Comparison with state-of-the-art methods
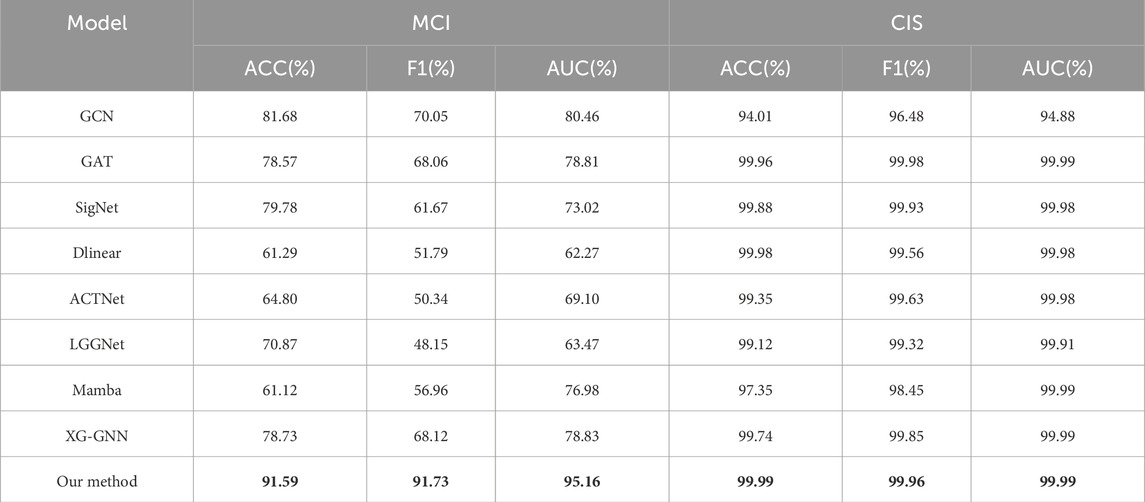
To comprehensively validate the effectiveness of our proposed framework, it is compared with eight representative baselines across three categories: general graph neural network models, temporal modeling methods, and specialized brain network modeling methods. All methods are evaluated under identical settings using the same EEG datasets and performance metrics for fairness, and the experimental results are presented in Table 2 and Figure 7.
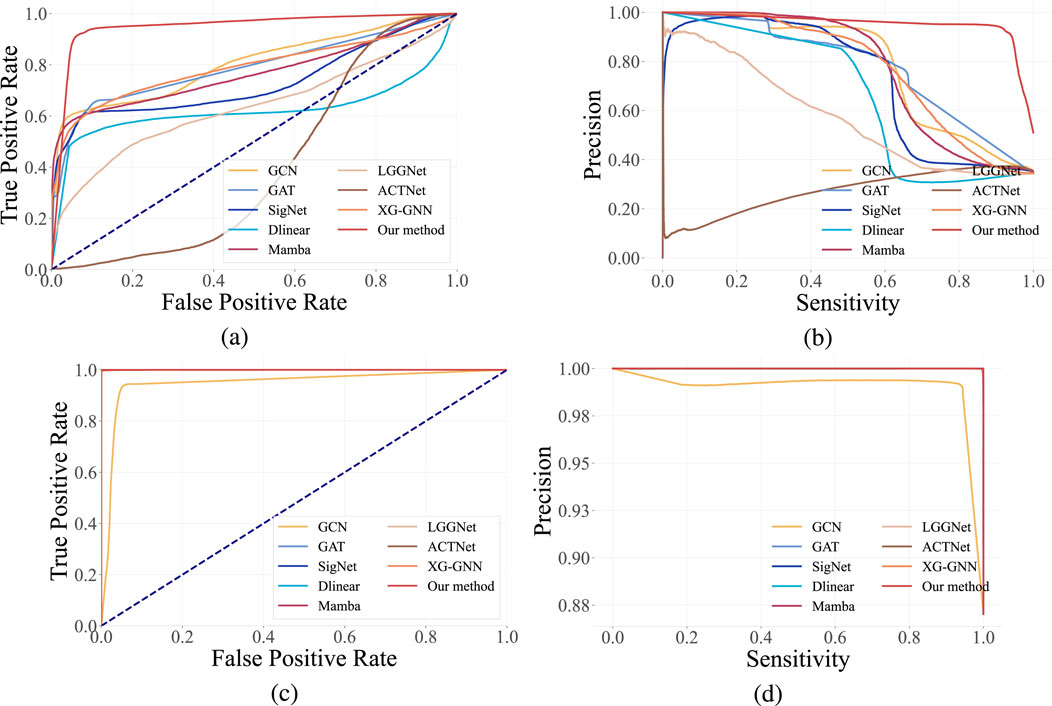
Figure 7. Comparison of our proposed framework with baseline models on different datasets. The ROC curve (left/top) demonstrates strong overall discriminative ability (closeness to the top-left corner). In contrast, the Precision-Recall (PR) curve (right/bottom) further confirms the excellent performance of our method in identifying the positive class, particularly under class imbalance (closeness to the top-right corner). (a) The area under the ROC curves in MCI. (b) The area under the PS curves in MCI. (c) The area under the ROC curves in Stroke. (d) The area under the PS curves in Stroke.
4.1 Comparison with traditional graph neural network methods
Our proposed framework is first compared with GCN and GAT, which are standard graph neural network models that operate on fixed adjacency structures. Though GCN performs localized neighborhood aggregation and GAT improves it by using learnable attention weights, both models rely heavily on manually defined or static adjacency matrices. This limitation hinders their ability to capture the dynamic and multiscale dependencies inherent in EEG signals. In contrast, our model adaptively constructs graphs from raw signals through multi-scale 2D convolutions, facilitating the learning of more biologically meaningful spatial interactions. Consequently, our method surpasses GCN and GAT in all evaluation metrics, demonstrating the advantage of data-driven and modality-specific graph construction over generic GNN designs.
4.2 Comparison with temporal modeling methods
Our model is further evaluated against DLinear, SigNet, and Mamba, which are representative temporal modeling strategies. DLinear and Mamba can capture sequence patterns with linear-time efficiency or state-space modeling, while SigNet performs well in CNN-based learning from signal-transformed matrices. Although these methods can effectively process temporal information, they fail to leverage the rich structural relationships between EEG channels, which are crucial for interpreting brain signals. In contrast, our model combines temporal and spatial information through a dual-branch architecture and dynamic graph learning, enabling the extraction of both time-aware and topology-aware representations. Our method consistently outperforms these baselines, indicating that incorporating spatial graph structures significantly enhances the discriminative capacity of temporal EEG features.
4.3 Comparison with brain network modeling methods
Finally, our model is compared with advanced brain network analysis methods, including LGGNet, ACTNet, and XG-GNN. These methods incorporate neuroscientific priors or attention mechanisms to model brain connectivity and dynamics. Although they yield promising results, most of them focus on a single modality (either the time or frequency domain) or rely on fixed graph structures, so they have limited ability to capture complex multi-component interactions. Our method addresses these limitations by: (1) simultaneously modeling both real and imaginary components in the frequency domain, (2) introducing a dynamic multi-component graph module to align and fuse cross-modal features, and (3) using gated attention-based fusion to preserve both structural accuracy and semantic consistency. Attributed to these design innovations, our model can more effectively leverage the complementary nature of EEG modalities. As indicated by the results, our method consistently surpasses these brain network models, demonstrating its superior capability in extracting informative and robust brain graph representations.
5 Ablation study
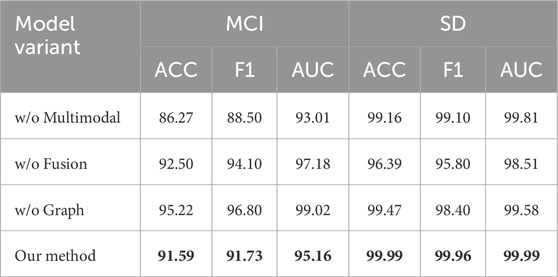
To systematically verify the effectiveness of each component in our model, ablation studies are conducted by gradually removing or replacing specific modules. Our model is composed of three key parts: (1) the multi-scale convolutional brain graph construction module, (2) the dynamic multimodal graph model, and (3) the gated graph convolution fusion module. The real and imaginary parts are retained in all variants, with ablation performed only on the core modules. Experimental results are listed in Table 3.
5.1 Effect of CBNC
First, the proposed multi-scale convolution-based brain graph construction is replaced with a simpler correlation-based method (e.g., Pearson correlation), applied separately on the real and imaginary parts. As illustrated in Table 4, performance significantly declines when this component is replaced, underscoring the importance of accurate graph construction. Without this module, the resulting graphs fail to capture rich spatiotemporal dependencies, leading to a diminished representational capacity. This validates the advantage of designing domain-aware graph topologies for EEG signals, particularly in the context of dual real-imaginary frequency decomposition.
5.2 Effect of CAFF
The second ablation removes the dynamic multimodal graph model, and instead, the two graphs (real and imaginary) are directly fed into parallel GIN encoders, followed by naive feature averaging. Without the dynamic fusion mechanism, the model fails to weigh the contribution of different modalities adaptively. Experimental results indicate a performance decline, suggesting that the dynamic multimodal graph model plays a crucial role in learning complementary and task-relevant features from dual-graph modalities. This module dynamically models the interaction between real and imaginary graphs, facilitating better exploitation of cross-modal cues and enhanced generalization.
5.3 Effect of CGC
Finally, the gated graph convolutional fusion is replaced with a static concatenation followed by a standard GIN. The original gating mechanism selectively emphasizes informative fused features, allowing the model to suppress noise and redundant information during the final representation learning phase. The performance degradation observed from this ablation confirms that the gate mechanism facilitates discriminative learning by adaptively highlighting relevant structural cues. This is particularly important in EEG analysis, where signal quality changes across electrodes and sessions. The attention-gated fusion helps to capture consistent patterns from noisy graph inputs.
6 Discussion
6.1 Multi-components of frequency EEG
To investigate the influence of different components of frequency EEG on detection accuracy, comparative experiments were conducted on the time sequence EEG, real component, imaginary component, real-imaginary components, and magnitude-phase components of the frequency EEG. It can be observed from Table 4 that the multi-component yields the best results, which aligns with the theoretical analysis.
Initially, the time-frequency dual construction strategy is removed, and only the raw time-domain signals are used for graph construction. This change significantly reduces performance, indicating that time-domain representations alone are inadequate for capturing the complex oscillatory dynamics inherent in EEG signals. The frequency domain provides richer physiological insights, particularly concerning connectivity patterns between electrodes. To further validate the importance of our dual-branch frequency-domain design, the dual construction mechanism is removed, and only the real or imaginary part is used to construct a single brain graph. This alternation also leads to a marked performance degradation, confirming that both the real and imaginary components provide complementary insights into neural oscillations in the frequency domain. The real part primarily reflects synchronous coupling, while the imaginary part captures phase-lagged interactions; their combination enriches the representation capacity of the graph and contributes to more accurate and robust brain network modeling.
6.2 Visualization of spatial-frequency feature evolution
The MSC and other dynamic structure construction methods are visualized in Figure 8, highlighting the effectiveness of MSC in capturing dynamic feature evolution and high-order interactions. Unlike variation graphs and other complex networks, which only capture local features and inadequately represent connection strength, MSC can represent higher-order relationships without distance constraints. Moreover, MSC dynamically updates connection relationships and their strengths, assigning greater weights to connections between adjacent features, thus addressing the limitations inherent in static networks.
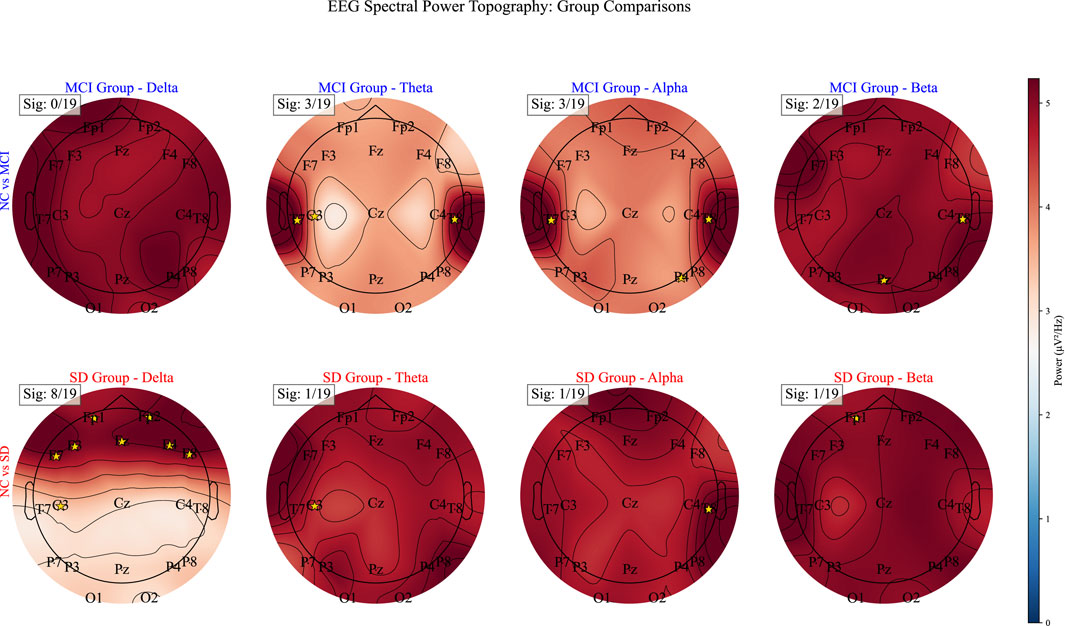
Figure 8. Visualization of the clinical interpretation of disease-specific EEG topographic patterns.
First, patients with cerebrovascular disease (SD) exhibited a significant enhancement of delta-band power in the frontal region (
6.3 Discriminative biomarker identification
To evaluate the neurophysiological relevance of our model in disease diagnosis, a top-5 region comparison was conducted between the raw EEG and model output using independent t-tests, as illustrated in Figure 9 (a) and (c). Meanwhile, the connections between the five key brain regions and other regions are depicted in Figure 9 (b) and (d). In the visualization, the real component connectivity (the left panel) highlights synchronous, near-zero-phase coupling, indicating direct co-activation between regions. For example, in MCI patients, increased real-part connectivity involving Pz suggests altered attentional and memory integration pathways. The imaginary component connectivity (the right panel) emphasizes phase-lagged interactions, which are less affected by volume conduction and represent more reliable effective connectivity. In MCI, elevated imaginary-part coupling between T4 and parietal regions reflects abnormal delayed information transfer associated with declines in language and memory. By comparing these maps with the fused network output, we can observe that the fusion selectively preserves physiologically meaningful patterns from both components. In the stroke dataset, this is evident as significant changes in real-part connectivity in motor cortex regions (C3) and corresponding imaginary-part alterations in frontal control areas (Fz, F4), aligning with known post-stroke neural reorganization. These visual examples demonstrate that our approach does not treat complex-valued features as abstract mathematical constructs; rather, it utilizes their distinct physiological interpretations to extract disease-specific neurobiomarkers.
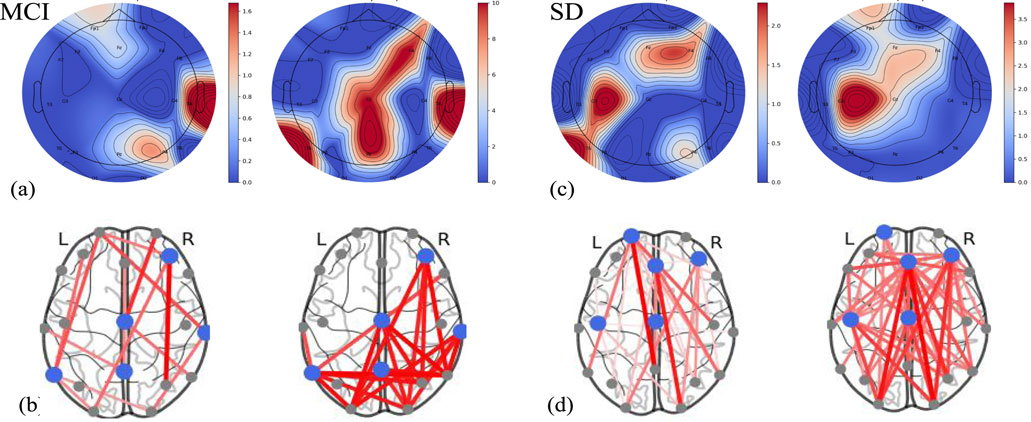
Figure 9. In (a,c), the left panel displays the topography derived from the raw EEG signals, while the right panel shows the output of the trained model on the MCI and SD datasets. In (b,d), the brain networks of the original inputs and those trained by the model are plotted.
6.4 Interpretability analysis
To enhance the interpretability of the model, we calculated and presented the importance scores of each electrode in the two datasets (MCI and SD) (see Table 5). This score reflects the weight distribution of the model’s contribution to different brain region nodes, revealing the differences in the impact of key brain regions on disease classification. For example, electrodes in the frontal lobe (such as F4, Fz), temporal lobe (such as T4, T5, T6), and central region (such as C3, Cz) all showed high importance in both SD and MCI, which is consistent with the relevant neuro-pathological mechanisms. This analysis not only supports the decision basis of the model but also provides valuable spatial feature clues for the clinical mechanism research of brain diseases.
6.5 Generalization and dataset limitations
Although the proposed framework demonstrates excellent performance on both the MCI and stroke datasets, we recognize that the dataset sizes are relatively limited (61 subjects for MCI, 79 subjects for stroke). This limitation is common in EEG-based neurodegenerative and cerebrovascular disease studies due to the high costs and complexities of clinical data acquisition, as well as the necessity for expert labeling and long recording sessions. To mitigate potential overfitting and enhance the model’s generalization capability, several strategies were employed: (1) implementing regularization and dropout in all trainable layers to suppress overfitting; (2) conducting five-fold cross-validation in all experiments to ensure that the reported results are not biased toward a specific data aligned; (3) performing parameter sensitivity analysis (Section 3.4) and ablation studies (Section 5), which demonstrated stable performance across different hyperparameters and model variants; and (4) making model design choices that incorporate neurophysiologically meaningful priors (real/imaginary connectivity) to learn disease-relevant patterns rather than purely data-driven correlations. Despite the small sample sizes, the proposed method consistently outperformed state-of-the-art baselines on both datasets with low variance across folds, indicating good robustness. In future work, we plan to validate the framework on larger and multi-center EEG datasets and explore transfer learning strategies to further improve generalization across cohorts and acquisition conditions.
7 Conclusion
In this paper, we propose a novel complex-valued brain network framework for diagnosing neurodegenerative diseases by leveraging component-aware feature fusion. The framework effectively incorporates multi-component (real and imaginary) information derived from EEG signals into a deep learning architecture, thereby enhancing the characterization of brain dynamics in the frequency domain. Specifically, a Complex-valued Brain Network Construction (CBNC) module was introduced to dynamically capture complex interactions through multi-scale convolutions while generating flexible adjacency matrices for comprehensive network modeling. In addition, a Component-Aware Feature Fusion (CAFF) mechanism was developed to integrate multi-modal features by translating inter-component correspondence into a shared latent space. This design implicitly regularizes latent representations with cross-component semantic context, further improving discriminative capacity. Extensive experimental results validate the effectiveness and generalization ability of the proposed approach, demonstrating its potential as a powerful tool for EEG-based diagnosis of neurodegenerative diseases.
Data availability statement
The original contributions presented in the study are included in the article/supplementary material, further inquiries can be directed to the corresponding author.
Ethics statement
Ethical approval was not required for the studies involving humans because the study involved publicly available datasets. The studies were conducted in accordance with the local legislation and institutional requirements. Written informed consent for participation was not required from the participants or the participants’ legal guardians/next of kin in accordance with the national legislation and institutional requirements.
Author contributions
JF: Conceptualization, Formal Analysis, Methodology, Writing – original draft, Writing – review and editing. XB: Conceptualization, Funding acquisition, Resources, Writing – review and editing.
Funding
The author(s) declare that financial support was received for the research and/or publication of this article. This work was supported in part by the National Natural Science Foundation of China under Grant 62106020.
Conflict of interest
The authors declare that the research was conducted in the absence of any commercial or financial relationships that could be construed as a potential conflict of interest.
Generative AI statement
The author(s) declare that no Generative AI was used in the creation of this manuscript.
Any alternative text (alt text) provided alongside figures in this article has been generated by Frontiers with the support of artificial intelligence and reasonable efforts have been made to ensure accuracy, including review by the authors wherever possible. If you identify any issues, please contact us.
Publisher’s note
All claims expressed in this article are solely those of the authors and do not necessarily represent those of their affiliated organizations, or those of the publisher, the editors and the reviewers. Any product that may be evaluated in this article, or claim that may be made by its manufacturer, is not guaranteed or endorsed by the publisher.
References
1. Korczyn AD, Grinberg LT. Is alzheimer disease a disease? Nat Rev Neurol (2024) 20:245–51. doi:10.1038/s41582-024-00940-4
2. Tian C, Zhang J, Tang L. Perceptual objective evaluation for multimodal medical image fusion. Front Phys (2025) 13:1588508. doi:10.3389/fphy.2025.1588508
3. Xu R, Zhu Q, Li S, Hou Z, Shao W, Zhang D. Mstgc: multi-channel spatio-temporal graph convolution network for multi-modal brain networks fusion. IEEE Trans Neural Syst Rehabil Eng (2023) 31:2359–69. doi:10.1109/tnsre.2023.3275608
4. Nordberg A, Rinne JO, Kadir A, Långström B. The use of pet in alzheimer disease. Nat Rev Neurol (2010) 6:78–87. doi:10.1038/nrneurol.2009.217
5. Drew PJ. Vascular and neural basis of the bold signal. Curr Opin Neurobiol (2019) 58:61–9. doi:10.1016/j.conb.2019.06.004
6. Jitsuishi T, Yamaguchi A. Searching for optimal machine learning model to classify mild cognitive impairment (mci) subtypes using multimodal mri data. Scientific Rep (2022) 12:4284. doi:10.1038/s41598-022-08231-y
7. Farina F, Emek-Savaş D, Rueda-Delgado L, Boyle R, Kiiski H, Yener G, et al. A comparison of resting state eeg and structural mri for classifying alzheimer’s disease and mild cognitive impairment. Neuroimage (2020) 215:116795. doi:10.1016/j.neuroimage.2020.116795
8. Zhang S, Zhao H, Wang W, Wang Z, Luo X, Hramov A, et al. Edge-centric effective connection network based on muti-modal mri for the diagnosis of alzheimer’s disease. Neurocomputing (2023) 552:126512. doi:10.1016/j.neucom.2023.126512
9. Park S, Hong CH, Lee D-g., Park K, Shin H, Initiative ADN, et al. Prospective classification of alzheimer’s disease conversion from mild cognitive impairment. Neural Networks (2023) 164:335–44. doi:10.1016/j.neunet.2023.04.018
10. Bi X-A, Wang Y, Luo S, Chen K, Xing Z, Xu L. Hypergraph structural information aggregation generative adversarial networks for diagnosis and pathogenetic factors identification of alzheimer’s disease with imaging genetic data. IEEE Trans Neural Networks Learn Syst (2022) 35:7420–34. doi:10.1109/tnnls.2022.3212700
11. Yang S, Bornot JMS, Wong-Lin K, Prasad G. M/eeg-based bio-markers to predict the mci and alzheimer’s disease: a review from the ml perspective. IEEE Trans Biomed Eng (2019) 66:2924–35. doi:10.1109/tbme.2019.2898871
12. Alvi AM, Siuly S, Wang H. A long short-term memory based framework for early detection of mild cognitive impairment from eeg signals. IEEE Trans Emerging Top Comput Intelligence (2022) 7:375–88. doi:10.1109/tetci.2022.3186180
13. Looney D, Mandic DP. Multiscale image fusion using complex extensions of emd. IEEE Trans Signal Process (2009) 57:1626–30. doi:10.1109/tsp.2008.2011836
14. Song R-J, Guo F-J, Huang X-F, Li M, Sun Y-Y, Yu A-Y, et al. Brain functional magnetic resonance imaging in icu patients who developed delirium. Front Phys (2024) 12:1391104. doi:10.3389/fphy.2024.1391104
15. Wang Y, Shi Y, Cheng Y, He Z, Wei X, Chen Z, et al. A spatiotemporal graph attention network based on synchronization for epileptic seizure prediction. IEEE J Biomed Health Inform (2022) 27:900–11. doi:10.1109/jbhi.2022.3221211
16. Javed E, Croce P, Zappasodi F, Del Gratta C. Normal aging: alterations in scalp eeg using broadband and band-resolved topographic maps. Front Phys (2020) 8:82. doi:10.3389/fphy.2020.00082
17. Wang J, Liang S, Zhang J, Wu Y, Zhang L, Gao R, et al. Eeg signal epilepsy detection with a weighted neighbour graph representation and two-stream graph-based framework. IEEE Trans Neural Syst Rehabil Eng (2023) 31:3176–87. doi:10.1109/TNSRE.2023.3299839
18. Nagarani N, Karthick R, Sophia MSC, Binda M. Self-attention based progressive generative adversarial network optimized with momentum search optimization algorithm for classification of brain tumor on mri image. Biomed Signal Process Control (2024) 88:105597. doi:10.1016/j.bspc.2023.105597
19. Chen Y, You J, He J, Lin Y, Peng Y, Wu C, et al. Sp-gnn: learning structure and position information from graphs. Neural Networks (2023) 161:505–14. doi:10.1016/j.neunet.2023.01.051
20. Zhang H, Song R, Wang L, Zhang L, Wang D, Wang C, et al. Classification of brain disorders in rs-fmri via local-to-global graph neural networks. IEEE Trans Med Imaging (2022) 42:444–55. doi:10.1109/tmi.2022.3219260
21. Xia J, Chen N, Qiu A. Multi-level and joint attention networks on brain functional connectivity for cross-cognitive prediction. Med Image Anal (2023) 90:102921. doi:10.1016/j.media.2023.102921
22. Klepl D, He F, Wu M, Blackburn DJ, Sarrigiannis PG. Cross-frequency multilayer network analysis with bispectrum-based functional connectivity: a study of alzheimer’s disease. Neuroscience (2023) 521:77–88. doi:10.1016/j.neuroscience.2023.04.008
23. Tang Y, Wu Q, Mao H, Guo L. Epileptic seizure detection based on path signature and bi-lstm network with attention mechanism. IEEE Trans Neural Syst Rehabil Eng (2024) 32:304–13. doi:10.1109/tnsre.2024.3350074
24. Du H, Riddell RP, Wang X. A hybrid complex-valued neural network framework with applications to electroencephalogram (eeg). Biomed Signal Process Control (2023) 85:104862. doi:10.1016/j.bspc.2023.104862
25. Xuan Q, Zhou J, Qiu K, Chen Z, Xu D, Zheng S, et al. Avgnet: adaptive visibility graph neural network and its application in modulation classification. IEEE Trans Netw Sci Eng (2022) 9:1516–26. doi:10.1109/tnse.2022.3146836
26. Baravalle R, Guisande N, Granado M, Rosso OA, Montani F. Characterization of visuomotor/imaginary movements in eeg: an information theory and complex network approach. Front Phys (2019) 7:115. doi:10.3389/fphy.2019.00115
27. Zhang Z, Meng Q, Jin L, Wang H, Hou H. A novel eeg-based graph convolution network for depression detection: incorporating secondary subject partitioning and attention mechanism. Expert Syst Appl (2024) 239:122356. doi:10.1016/j.eswa.2023.122356
Keywords: electroencephalogram, multi-component, complex-valued learning, neurodegenerative diseases, brain networks
Citation: Fan J and Ban X (2025) Complex-valued brain networks for neurodegenerative disease diagnosis via component-aware feature fusion . Front. Phys. 13:1665288. doi: 10.3389/fphy.2025.1665288
Received: 14 July 2025; Accepted: 19 August 2025;
Published: 15 September 2025.
Edited by:
Hui-Jia Li, Nankai University, ChinaReviewed by:
Ahmed Faeq Hussein, Alnahrain university, IraqGe Gao, Beijing Sport University, China
Qiqi Wang, Nankai University, China
Copyright © 2025 Fan and Ban. This is an open-access article distributed under the terms of the Creative Commons Attribution License (CC BY). The use, distribution or reproduction in other forums is permitted, provided the original author(s) and the copyright owner(s) are credited and that the original publication in this journal is cited, in accordance with accepted academic practice. No use, distribution or reproduction is permitted which does not comply with these terms.
*Correspondence: Xiaojuan Ban, YnhqQHVzdGIuZWR1LmNu
 Jiejie Fan
 Xiaojuan Ban*
