 Zakaria Ait Elcadi1*
 Yassine Toufique2
 Tarraf Torfeh3Renilmon Sukumaran3
 Rabih Hammoud3Noora Al-Hammadi3
 Othmane Bouhali1,4
- 1Electrical and Computer Engineering, Texas A&M University at Qatar, Doha, Qatar
- 2Energy, Materials and Numerical Physics, Abdelmalek Essaadi University, Tetouan, Morocco
- 3National Center for Cancer Care and Research, Hamad Medical Corporation, Doha, Qatar
- 4Electrical Engineering, Hamad Bin Khalifa University, Doha, Qatar
Monte Carlo simulations are widely used in medical physics to model particle interactions for accurate radiotherapy dose calculations. This study presents a methodological comparison between two leading Geant4-based simulation platforms-GATE and TOPAS-for modeling a 6 MV Varian CLINAC IX linear accelerator. The objective was to evaluate and optimize the performance of both platforms in terms of computational efficiency and dosimetric accuracy. Simulations were validated against experimental measurements using percentage depth dose and dose profiles acquired in a water phantom. Methods included geometry modeling, electron source parameter tuning, and implementation of phase space files, production thresholds, and variance reduction techniques. Results showed that TOPAS provided superior agreement with experimental data, especially in deep dose regions, while GATE offered marginally better computation times when advanced variance reduction tools were applied. These findings highlight the importance of aligning simulation platform choice with specific clinical or research objectives. This work offers a practical reference for medical physicists and researchers seeking to optimize Monte Carlo simulations for treatment planning, quality assurance, or commissioning of radiotherapy systems.
1 Introduction
Clinical linear accelerators (LINACS) generate electrons or photons with energies in the multi-MeV range, which are commonly used in cancer treatment. LINACS work on the principle of electron acceleration via high-frequency electromagnetic waves to deliver optimal radiation doses to tumor volumes while minimizing exposure to surrounding healthy tissues, lowering the risk of complications.
The efficacy of these treatments is dependent on precise dosage calculations and irradiation accuracy. To achieve this level of precision, Monte Carlo (MC) simulation is used to model the movement and interactions of individual particles within materials. Unlike analytical algorithms in commercial software, MC techniques take into account the mechanical and geometrical properties of the radiation source, as well as tissue heterogeneities in the patient’s body.
MC methods use microscopic modeling of particle transport to generate 1D, 2D, and 3D simulations. Individual particle trajectories are simulated using random numbers and cross sections to mimic physical phenomena [1–6]. Despite their precision, the practical use of MC methods in clinical settings is hampered by long computation times. Monte Carlo simulation software tools have been developed for applications in medical physics, nuclear medicine, and internal dosimetry [7–15].
Over time, platforms based on the Geant4 framework, such as GATE and TOPAS, have emerged to improve CPU performance. However, the persistent differences in options and their implications for CPU timing necessitate a thorough investigation. This study plays an important role by meticulously comparing GATE and TOPAS, going beyond a simple comparison of features. The emphasis shifts to the nuanced complexities of the CPU optimization tools provided by these platforms, allowing users to make informed decisions that balance computational efficiency and precision in Monte Carlo simulations for radiation therapy.
The primary goal of this study is to investigate and compare the performance of GATE (v9.1) and TOPAS (v3.9) using Geant4 v10.7. This entails integrating the full modeling of a Varian CLINAC IX accelerator and utilizing the university’s computational power. A targeted parallel calculation method is used to significantly reduce CPU time in simulations. A dosimetric study is used to validate virtual accelerator models in GATE and TOPAS by comparing parameters related to photon beam quality. The parameters derived from water-shot simulations are compared to experimental measurements performed in the radiotherapy department [16–21].
Although TOPAS and GATE both build on the same Geant4 core physics library, they are distinct software ecosystems with their own user interfaces, default physics lists, and specialized actors for particle control (e.g., GATE’s KillActor; TOPAS’s particle filters). These architectural differences directly affect several practical aspects of simulation, including:
Accordingly, a rigorous comparison under controlled geometry and physics conditions is necessary to guide toolkit selection for clinical and research applications. In this work, we benchmark both platforms to evaluate (i) dosimetric accuracy and (ii) the practical utility of their respective optimization tools and workflows for a medical physics group.
2 Materials and methods
The Varian CLINAC IX serves as a medical linear accelerator employed in radiation therapy for cancer treatment. It operates by delivering precise high-energy X-rays to cancerous tumors while minimizing exposure to healthy tissues. This versatile machine accommodates various treatment techniques, including intensity-modulated radiation therapy (IMRT), image-guided radiation therapy (IGRT), and stereotactic radiosurgery (SRS). Equipped with advanced imaging and treatment planning software, the CLINAC IX enables accurate targeting and shaping of the radiation beam. Widely recognized as a reliable and effective tool for cancer treatment, it is utilized in numerous hospitals and clinics globally.
Accuracy in the geometric modeling of the LINAC head is crucial, though detailed precision is not mandatory. Some data regarding the Varian CLINAC IX accelerator head’s precision are currently unavailable. Our modeling of the CLINAC Varian IX relies on data provided by the manufacturer. This accelerator features a 120 multi-leaf collimator, divided into two blocks of 60 leaves each. The accelerator head, depicted in Figure 1, comprises static elements independent of irradiation energy and beam shape (primary collimator), elements dependent on irradiation energy (target and flattening filter), and others dependent on beam shape (jaw collimator and multi-leaf collimator).
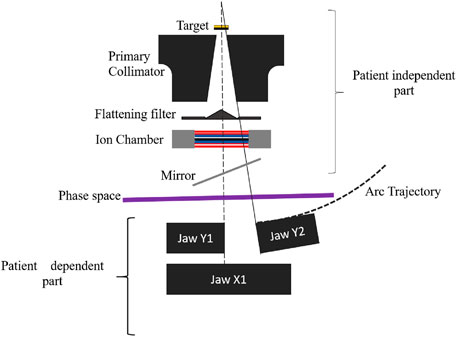
Figure 1. Illustration of the components of a Varian CLINAC IX in photon beam mode.
2.1 Geometry modeling
The modeling of the varian CLINAC IX head is the first step for the performance comparison between the two GEANT4 plateforms.
2.1.1 GATE V9.1
GATE (Geant4 Application for Tomographic Emission) stands as an open-source Monte Carlo simulation platform rooted in the Geant4 toolkit. Geant4, a software toolkit renowned for simulating particle interactions with matter, finds widespread use in high-energy physics, nuclear physics, medical physics, and other domains. The most recent iteration of this platform is GATE/Geant4 v9.1 [14, 22], incorporating numerous new features and enhancements. Notable improvements include accelerated simulation times, refined tracking algorithms, and upgraded visualization tools.
Furthermore, GATE/Geant4 v9.1 introduces enhanced models tailored for simulating nuclear medicine imaging and therapy. This encompasses the simulation of radionuclide production and decay [5, 23], enabling more precise simulations of radiopharmaceutical uptake and distribution within the human body. In essence, GATE/Geant4 v9.1 serves as a robust tool empowering researchers and clinicians to optimize treatment planning, enhance simulation accuracy, and propel advancements in the field of medical physics.
2.1.2 TOPAS V3.9
TOPAS (TOol for PArticle Simulation) serves as a Monte Carlo simulation platform designed for particle therapy, specifically catering to proton and carbon ion therapy. Recognized for its user-friendly interface, this tool empowers researchers and clinicians to simulate the trajectory of charged particles through various mediums, including biological tissues. The latest iteration, TOPAS v3.9 [24, 25], introduces several new features and enhancements.
A notable advancement in TOPAS v3.9 is its capability to simulate spot scanning proton therapy. This popular treatment technique delivers the proton beam in small spots rather than a continuous beam, enabling more precise targeting of tumors and sparing surrounding healthy tissue. Additionally, the latest version includes improved models for the production and transport of secondary particles, along with the ability to simulate the biological effects of ionizing radiation. In summary, TOPAS v3.9 stands as a robust tool, providing researchers and clinicians with the means to optimize treatment planning and enhance the accuracy of particle therapy.
2.1.3 Varian CLINAC IX head modeling
The target consists of tungsten and copper plates, where tungsten primarily facilitates photon production through braking radiation, and copper is utilized to halt low-energy X-rays unnecessary for treatment due to a lack of penetrators while efficiently dissipating heat. During the Monte Carlo (MC) simulation, the source is positioned at the target input.
The primary collimator, a tungsten block of a few centimeters in height, defines a cone that establishes the maximum radiation field. To model the flattening filter, multiple truncated cones are layered on top of each other (refer to Figure 2). The collimation system comprises two components: the XY jaws, which delineate a rectangular irradiation field with a maximum dimension of
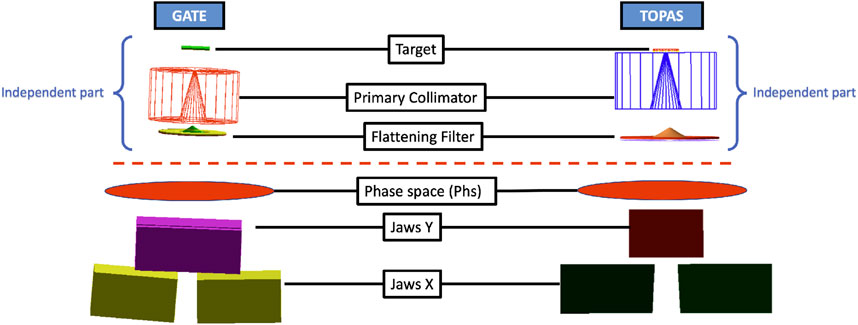
Figure 2. GATE and TOPAS modeling of Varian CLINAC IX head components for 6 MV photon beam.
The jaws consist of two pairs of tungsten blocks, each a few centimeters thick and positioned at different heights in the irradiation head. The irradiation beam is directed from the source by each jaw edge (photonic target). Notably, the Y jaws, closer to the source, move in an arc of a circle, while the X jaws move in a straight line and then rotate to track the divergence of the irradiation beam (see Figure 2).
In MC simulations, the accelerator head was modeled without the MLC to save computational time. This involved using rectangular radiation fields defined solely by the jaws. Since the MLC is located below the XY jaws (refer to Figure 2), excluding it had no impact on dose calculation. For simulation optimization, the MLC was routinely omitted from the geometry during the adjustment of initial electron characteristics. Additionally, it is noteworthy that many studies on modeling Varian accelerators in radiotherapy typically exclude the MLC [26–29].
2.2 Experimental measurements
The experimental measurements serve as a baseline against which the absorbed dose distributions calculated using MC will be compared. At CHU hospital located in Morocco, measurements are taken using the Varian CLINAC IX accelerator with an ion chamber in a water phantom for the following field sizes:
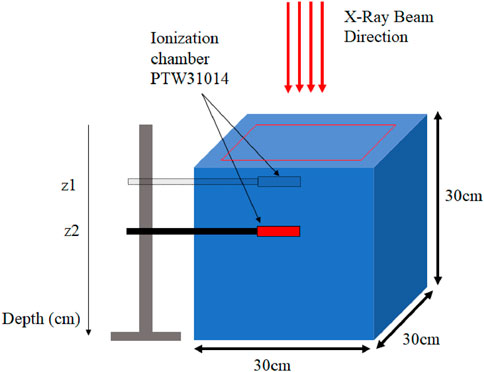
Figure 3. Illustration of a water tank of
To perform experimental measurements based on the beam field size, several ion chambers are used. The Semiflex 31010 ion chamber (PTW, Freiburg, Germany) has a cylindrical cavity with an active volume of 0.125
A comprehensive uncertainty analysis was performed on these measurements. The overall uncertainty is a quadrature sum of several components:
This leads to a combined standard uncertainty of approximately
2.3 CPU optimization
We used the high performance computing facility at Texas AM University in Qatar to reduce simulation computing time [30]. It is a Linux-based system outfitted with cutting-edge blade servers and a total of 4,128 traditional Intel Haswell CPU cores. All compute nodes are equipped with two 12-core processors and 128 GB of RAM. It is linked to a 1 PB storage system. The simulations were carried out initially with one node, and then we increased the number of nodes from two to 94 to investigate the effect of nodes number on calculation time. TOPAS, in contrast to GATE, fully supports Geant4’s multithreading simulation capability. We used the thread values from 2 to 94 in parallel to study the effect of varying the threads value on CPU timing.
2.3.1 Phase space
For simulating the water phantom where measurements were conducted, a
In each dose or fluence calculation, whether in a patient or a phantom, a comprehensive process of photon generation is simulated through direct simulation. This involves systematically calculating the transit of electrons and photons in the accelerator head for each new simulation [31]. However, due to its computational intensity, this simulation method is primarily employed for research purposes, as it is not suitable for medical applications. Many published works Mohan et al. [32], Chaney et al. [33], Nilsson and Brahme [34] utilize full simulation when maximizing photon output based on the target or quantifying diffused photons. Nevertheless, complete direct simulation of the accelerator head is not the most efficient method in terms of computational efficiency for dosimetric purposes using the photon beam.
A phase space (PhS) represents all possible states of a system as individual points, consisting of particles with various properties like energy, type, position, propagation direction, and statistical weight. These particles are collected by a surface within a given geometry, and the data is stored in a digital file that serves as a source for another simulation [35].
The use of a PhS reduces initial simulation time, requiring only the geometric description of the secondary collimation for fixed nominal energy photon processing beam (X, Y, and MLC jaws). This means that, regardless of the patient’s treatment, the modeling of the target, primary collimator, flattening filter, and simulation of the source electron beam remain consistent. Electron transport calculations are the most time-consuming part of simulating a photon beam, and a PhS enables these calculations to be performed only once, thereby saving time.
Beyond time savings, PhSs are commonly employed in dosimetric applications. Modeling a photon beam using a Phase Space (PhS) involves two steps. The first step is creating a PhS, which entails placing a PhS plane at the exit of the flattening filter to collect all particles passing through it. The data is saved in a file for subsequent simulations. The second step involves using the PhS as input multiple times, avoiding the need to recalculate the entire simulation for a simple change in field size and thereby saving time on calculations. However, it is important to note that PhS files can be large and inflexible once created.
PhS files can be generated in various formats such as ROOT [36] or PHPS [37], using software like GATE and TOPAS. When optimizing multiple parameters simultaneously, it is advisable to begin with those less dependent on others to avoid potential biases or interactions. If a final parameter value is significantly distant from its original value and strongly correlated with another previously set parameter, re-running the optimization process while keeping the earlier parameter fixed can enhance the accuracy of final estimates.
2.3.2 Physics cuts
Two types of physics cuts can significantly impact CPU time. The first type is production thresholds, designed to prevent the generation of unnecessary low-energy secondary particles through ionization and bremsstrahlung processes. The second type involves the minimum remaining kinetic energy for a track, determining the point below which particles cease to be transported. This cut serves to optimize the process by preventing particle traces, thereby reducing time per history. The cut-off energy can be defined in two ways: globally for the entire world or specifically for a modeled geometry.
When implementing cut-off energy for a detector volume, it is crucial to ensure that the calculation remains unaffected.
In GATE and TOPAS, the user is responsible for defining production thresholds. These thresholds are specified as a distance or limit distance for individual materials, internally converted into energy. In GATE, each volume is treated as a geometric region, and production thresholds are established for each region. In contrast, TOPAS allows users to define lower and upper edge production thresholds in terms of energy, providing a more detailed control option compared to GATE.
2.3.3 Variance reduction technics
A substantial portion of the total CPU time dedicated to simulating an accelerator head is allocated to tracking initial electrons in the target, which generate bremsstrahlung gammas in limited numbers. To address this, bremsstrahlung splitting serves as an effective variance reduction technique. It allows users to determine the number of gammas produced in each bremsstrahlung interaction, rather than just a single gamma. This strategic choice reduces the time spent following initial electrons and prioritizes the tracking of gammas, which have a higher likelihood of reaching the phantom.
To exclusively generate particulate matter with a pathway surpassing the production threshold, a secondary particulate matter production threshold must be defined. As the effective sections of interactions are energy-dependent, the “step” size is constrained by continuous energy loss, and its size remains nearly constant along the step if sufficiently small. Given that calculation time increases with simulation precision, a trade-off between accuracy and calculation speed is typically made. The “StepFunction” function restricts the “step” size based on the voxel size [22].
Selecting an appropriate step size in Monte Carlo tracking poses a challenge. TOPAS employs intricate logic based on local geometry, physics, and user input to determine a suitable step size. Nevertheless, a maximum size can be set in some components if applications are sensitive to this behavior. While larger steps usually do not enhance performance, smaller steps may offer improved accuracy. To find the optimal maximum step size, experimentation with different values is necessary, and the chosen value should exhibit minimal variation in results.
In GATE, users can utilize Special Slices to define four slices for limiting particle tracking:
• The overall longest possible track;
•The maximum allowable flight time;
•The minimum required kinetic energy;
•The minimum required range, which has undergone considerable change.
The “KillActor” feature in GATE prevents tracked particles from entering the volume defined by the linked “actor,” stopping the tracking of particles that do not contribute to the volume of interest. This leads to a reduction in computation time. In contrast, TOPAS employs particle filtering options to eliminate particles immediately after their creation. Users can specify which particles to track across all components and whether a component should be ignored. This option is useful when the contribution of certain particles to the final outcome is negligible, but caution is advised as it is not a variance-reduction technique.
2.4 Electron source modeling
Collisions between accelerated source electrons and the accelerator target produce photons used for treating target volumes. The spatial and energy distributions of these photons are predominantly influenced by the characteristics of the electron source beam and the target. Therefore, simulating these distributions requires special attention.
For an accurate modeling of initial electrons at the entrance of the photonic target, their energy and intensity distribution must be precisely defined. Two types of energy distributions are considered: Gaussian, characterized by its average energy and Full Width at Half Maximum (FWHM), and monoenergetic, defined by a single energy value. The spatial intensity of the electron beam can be described by a Gaussian beam with a width at half maximum or a homogeneously intense circular shape characterized by its radius.
Previous studies Blazy [38]; Franchisseur [39] utilized the PENELOPE code to simulate beams with Gaussian energy and intensity distributions. Jaffray et al. [40] demonstrated that the photon beam exhibits an elliptical intensity distribution upon leaving the source. Anai et al. [41] proposed a Gaussian model to describe the electron distribution. Given these considerations, the Gaussian description is commonly employed. Thus, we opted for a Gaussian description of energy distribution and focal spot.
Modeling the electron source beam involves selecting their energies and trajectory, as these properties significantly impact the energies and spatial distribution of photons used in patient treatment. Verhaegen and Seuntjens [42] outlined a three-stage procedure for modeling the source.
In the first stage, the energy of a mono-energetic electron beam is determined to ensure that dose calculations in a water phantom for a
It is noteworthy that Verhaegen and Seuntjens [42] observed that a change of 0.2 MeV in the average energy of source electrons has a noticeable effect on depth dose and dose profile. The radial distribution of electron beam intensity does not impact depth dose, but radial diffusion can lead to a quadratic decrease in the dose profile. Additionally, they reported that the divergence of the electron beam has a minor effect on the dose profile but no effect on the percentage depth dose.
2.4.1 Comparison of absorbed dose distributions
The Varian CLINAC IX is commonly used to assess the distribution of absorbed dose in the irradiated volume. However, studying the standard deviation between a measured dose distribution
In clinical routine, the gamma index is commonly used to compare the measured and calculated dose distributions. Several authors Childress et al. [43], Nelms and Simon [44], Esch et al. [45] have developed the gamma index method, which considers two parameters: the dose difference criterion
Where
The experimental uncertainties were considered when evaluating simulation-measurement agreement. The chosen gamma passing rate criterion of
2.4.2 Mean energy
To achieve a more precise quantification of robustness than the
2.4.3 Spot size
The second step involves determining the spatial distribution of the electron beam source by comparing the measured dose profiles to the calculated profiles based on the electron spatial distribution model. This is achieved by varying the beam width at half maximum from 1.0 to 1.5 mm with a 0.1 mm increment. The dose profile is measured and calculated in two directions: right-left (inplane) and cranio-caudal (crossplane), 1.5 cm below the water surface, for a field size of
2.4.4 Physics models
Once the parameters of the electron beam are established, it becomes imperative to choose the appropriate physical process for simulating the interactions between photons and electrons. This study employed the Standard, Livermore, and Penelope models for electromagnetic interactions. These models undergo selection, renormalization, comparison, and averaging processes on experimental data to generate useful datasets encompassing all significant photon and electron interactions. The Standard model is suitable for energies up to 10 TeV and utilizes simpler transport algorithms, making it faster and more computationally efficient than other models. However, it lacks Rayleigh diffusion and atomic relaxation. Gate 9.1 and Topas 3.9 provides four options for standard EM models. In this study, option 4 was selected for both platforms, tailored for medical and space science applications. The Livermore and Penelope models demand more CPU time but excel in handling EM interactions at lower energies compared to the Standard model. The Livermore model serves as a photon-compatible low-energy electromagnetic package added to the G4 Standard 3 option, employing a set of models based on a parameterized approach for computing cross-sections and sampling the end state. On the other hand, the Penelope model, specifically designed for Monte Carlo simulations, combines numerical databases and analytical models for various interaction mechanisms. Its physical list builds upon electromagnetic option 3 by replacing the Penelope-2008 model set. Distinguishing characteristics between the Standard and Livermore models primarily lie in their definitions of the Compton broadcast. Livermore-based models utilize Ribbenfors’ theoretical framework, while the Standard model employs a different method. All physics packages use a similar definition for producing pairs. These models accurately describe ionization, bremsstrahlung, production of pairs and other charged particles, and gamma interactions with media, except for the photoelectric effect, which assumes that atomic electrons are nearly free and thus disregards electron binding energy [23, 46–48].
3 Results and discussion
The requirement for extensive computation durations in Monte Carlo (MC) simulations mandates the application of diverse tools aimed at diminishing computation time while upholding the precision of the eventual outcomes. As outlined in Section 2, we employed GATE and TOPAS to explore various optimization methods, giving priority to those less reliant on others. Unless explicitly stated otherwise, all outcomes were derived from simulations employing
3.1 CPU timing optimization
To commence the optimization procedure, we examined the execution duration across various segments of the accelerator head to uncover potential factors for optimization. Initially, we conducted simulations of the entire accelerator head in a single step, facilitating the tracking of particles interacting with different components until they reached the phantom positioned 100 cm from the target. The phantom utilized in the simulation was modeled after a real-world phantom, featuring dimensions of
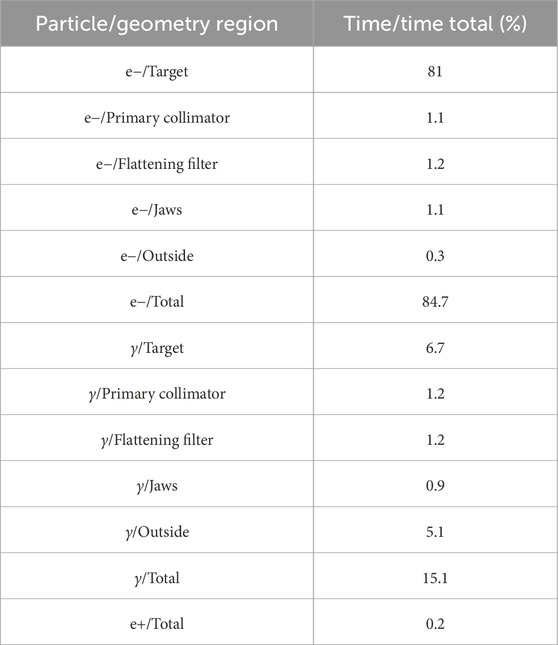
Table 1. Fraction of time spent in each Varian CLINAC IX head components by particle type.
To evaluate the gain in computing time when splitting a radiotherapy simulation task into several jobs. A radiotherapy simulation task has been performed with splitting it into 50,100, 200, 250, 300, 350, 400, 450 and 500 jobs. The execution times of the task with and without splitting were compared and a CPU time speed factor (TSF) was calculated. The TSF is estimated as follow:
Figure 4 shows the estimated TSF. Splitting the tasks into smaller jobs increase the TSF drastically (Equation 2).
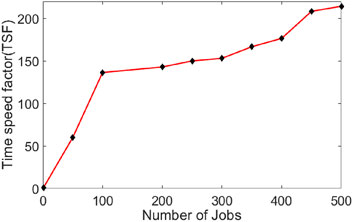
Figure 4. Time speed factor (TSF) when splitting a radiotherapy simulation task of
3.1.1 Phase space
The optimization of computation time commenced by leveraging the maximum available nodes accessible to the user. To expedite simulations, a parallelization script was implemented, dividing the simulation into 200 parallel tasks, each task comprising
Subsequently, the geometry was segmented using PhS into two distinct modules: a dependent part (module 2) and an independent part (module 1) (refer to Figure 1). In this setup, the PhS, represented as a cylinder with a diameter of 10 cm and a z-direction thickness of 1 nm, was positioned 7 cm above the secondary collimator or Y-jaws. Notably, the PhS format differs between GATE and TOPAS; while GATE features the phase space actor, which can be in PHPS or ROOT format to mitigate large file sizes, TOPAS does not support the ROOT format as a source for the second accelerator head module. Each PhS associated with a
3.1.2 Physics cuts in the phantom
Implementing a 0.1 mm cut-off threshold within the phantom and across the entire geometry facilitates the presumption that the deposited energy threshold is contained within the corresponding dose grid voxel. To validate this assumption, a PhS file was generated with a
Table 2 encapsulates the findings, suggesting that adopting a production threshold value of 0.1 mm within the water phantom would not notably impact the dose. This minimal influence on the dose likely stems from the confinement of the energy threshold within the corresponding dose grid voxel, as hypothesized, and the consistency of the phantom’s cut-off with the world’s cut-off.
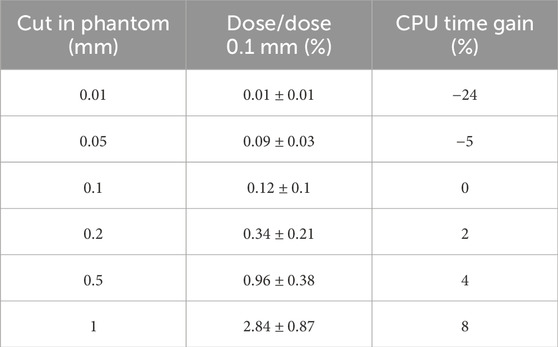
Table 2. CPU gain time for TOPAS and GATE after appliying all CPU optimization process.
In conclusion, the outcomes of this investigation imply that utilizing a 0.1 mm production threshold value in the water phantom can yield accurate dose calculations while minimizing computational expenses. However, it is essential to acknowledge that the optimal production threshold value may vary depending on the specific application and simulation parameters.
3.1.3 Variance reduction techniques
Several simulations were conducted employing variance reduction techniques. A division factor of 100 was applied, along with an energy slice of 1 mm, corresponding to 1/5 of the voxel dimension, and a step function set to 0.1 mm. Additionally, both GATE and TOPAS software programs offer parameters named “setMaxStepSizeInRegion” and “MaxStepSize” for electrons, respectively, enabling the limitation of the maximum step for a particle within a specified region. To determine the optimal value for this parameter, a range of values from 10 to 50 µm, with an increment of 10 µm, was explored. The chosen value was determined based on the recommended cut-off energy value and a reasonable calculation time, as depicted in Table 3 [49].
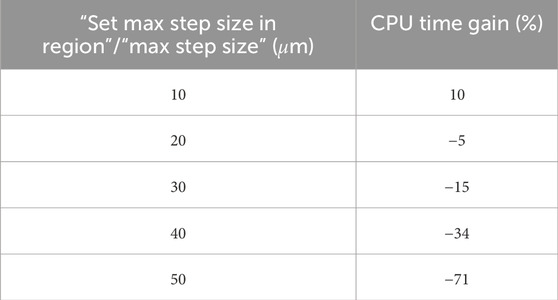
Table 3. CPU time gain for different values of “setMaxStepSizeInRegion” in GATE and “MaxStepSize” in TOPAS.
The selection of the thread number is a variance reduction technique offered by TOPAS. To analyze the impact of this technique on execution time, several simulations were conducted using 2 to 64 threads. The results indicated that using more than 32 threads in a single simulation did not result in any significant improvement in the total CPU timing.
One of the actors that GATE offer to contributes to variance reduction is the “KILL” actor, which is attached to a cylindrical geometry surrounding all of the other geometry and two boxes, one above the target and one below the water phantom. Table 4 summarizes the computational time savings for both TOPAS and GATE after implementing all processes (the first process is sumulationg the entire geometry), including PhS, cuts, and variance reduction techniques.
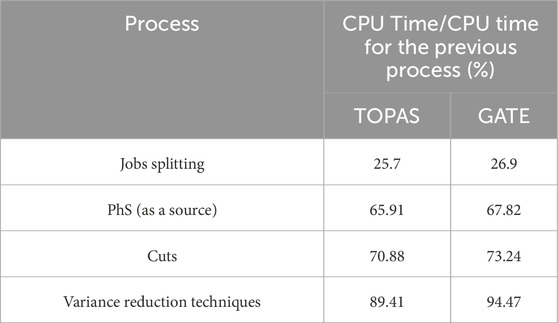
Table 4. CPU gain time for TOPAS and GATE after appliying all CPU optimization process.
Table 4 indicate that the CPU timing difference between GATE and TOPAS ranged between 2 and 3% when employing conventional techniques such as splitting jobs, phase space, and physics cuts. However, a notable disparity emerged upon the application of advanced variance reduction techniques, notably the KillActor method. In this regard, GATE exhibited a substantial advantage, with the CPU timing increasing to over 5% in its favor. This underscores the significance of specific concepts like KillActor and variance reduction techniques in influencing computational efficiency and accuracy, transcending the mere comparison of code names. By emphasizing these underlying principles, our study offers valuable insights for researchers and practitioners in the field of medical physics simulations.
The profound reduction in computation time, exceeding
This makes Monte Carlo (MC)-based dose calculation feasible for specific clinical scenarios where the highest accuracy is paramount, such as stereotactic radiosurgery (SRS) planning or dose verification in highly heterogeneous regions (e.g., near metal implants or in the lung).
While the
3.2 Adjustement of the beam source
3.2.1 Mean energy
The simulation protocol consisted of seven energy configurations, simulated in parallel on both the GATE and TOPAS platforms. The initial configuration employed a mean energy of 5.0 MeV, with six subsequent configurations generated by incrementing the mean energy in steps up to a maximum of 6.0 MeV. To assess sensitivity at a finer resolution, a supplemental investigation was conducted using a
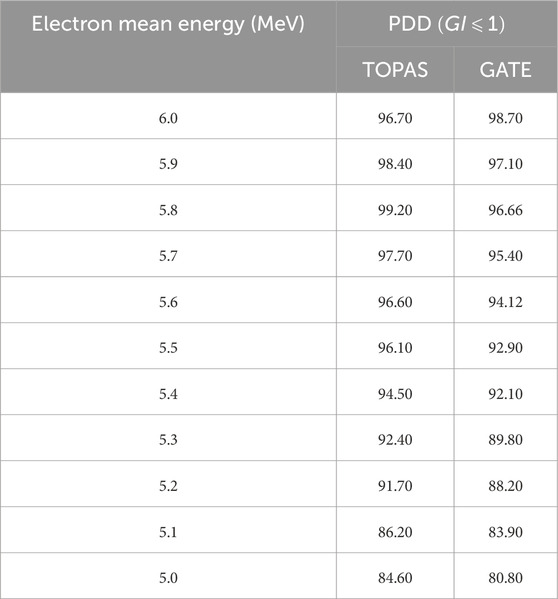
Table 5. GI results for different mean energy values.
It is noteworthy that all Monte Carlo simulations in this study computed dosimetric functions (PDD and DP) with statistical uncertainties of less than 1%. Figure 5 presents a comparison of PDDs for various energies relative to a reference field of
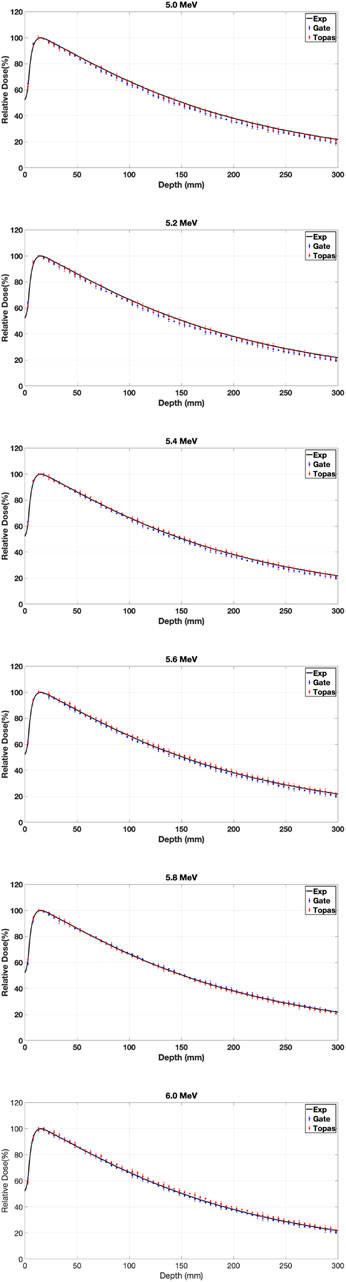
Figure 5. PDD for
Table 5 displays the GI results obtained by varying the mean and sigma energy of the Gaussian electron beam for dose distributions. Considering Figure 5 and Table 5, it was observed that dose values increased by an average of 5% with an increase in average energy from 5 to 6 MeV. The most significant relative dose differences were noted in the electronic equilibrium region for water depths less than or equal to 0.5 cm, attributed to scattered electrons constituting the primary component of the input dose.
The input dose comprises secondary electrons generated through interactions between high-energy photons and components of the accelerator head, alongside secondary electrons produced by interactions in low-energy air between the exit of the accelerator head and the entry point of the water phantom. Discrepancies in dose values arise due to contamination electrons, influenced by inaccuracies in modeled secondary collimation, and measurement uncertainties surrounding the highest dose within the electronic equilibrium region [49]. These uncertainties are exacerbated by high dose gradients and the dimensions of the ionization chamber.
The PDD exhibits an increase with the rise in average electron energy at depths beyond
As indicated by Table 5, Gamma index values for a tolerance of 2% in terms of energy and 2 mm in terms of distance suggest that average energies of 5.6 and 5.8 MeV for TOPAS, and 5.8 and 6.0 MeV for GATE, better fulfill these criteria. This preference is underscored by a calculation time difference of 2 h favoring 5.8 MeV for TOPAS, and 3 h favoring 6.0 MeV for GATE.
3.3 Spot size
The electron beam originating from a LINAC initially displays both radial and angular intensity distributions, influenced by the bending magnet, direction coils, and focusing coils within the electron transport system. We made the assumption that the electron distribution follows a Gaussian pattern [50], and defined the distributions of the initial electrons responsible for generating bremsstrahlung photons within the target. The electron angles varied within a range of 0.06–0.3° during the initial transport of the electron beam, which we considered negligible. Consequently, we presumed the beam to be parallel to the beam axis and modified only the total width at a half-height width (FWHM) of the radial distribution (ranging from 1.0 to 1.5 mm). This was done while maintaining an average energy of 6.0 MeV and a standard deviation of 0.168 MeV, corresponding to 3% of the average energy for GATE and 5.8 MeV for TOPAS [28, 51, 52].
All profiles have been normalized to the value of
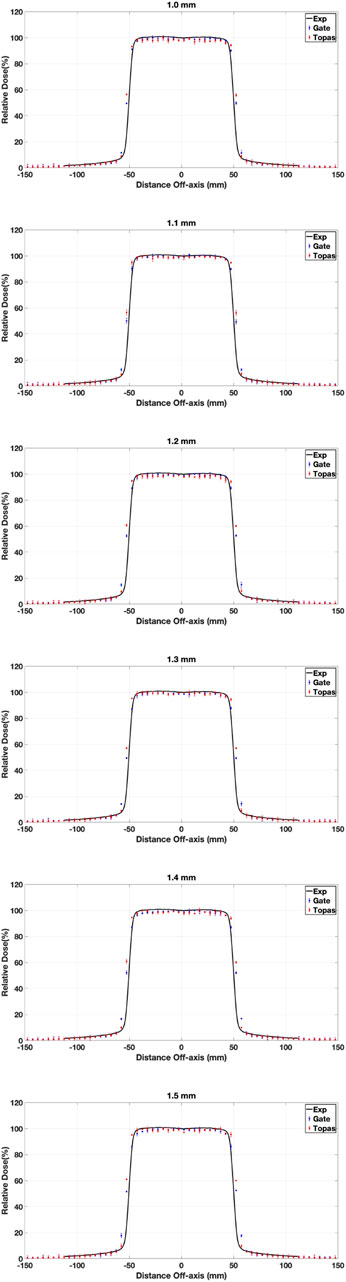
Figure 6. DP for
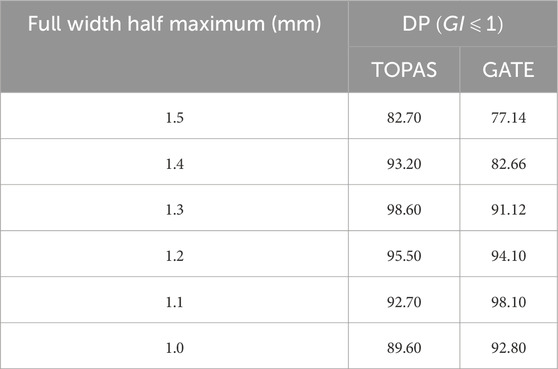
Table 6. GI results of applying different FWHM values.
The discrepancies in energy values between GATE and TOPAS, despite both utilizing the same GEant4 version, stem from their respective standard model choices. The greater range of standard model options in TOPAS, four compared to GATE’s three, signifies an enhanced capacity for finer adjustments and potentially more precise simulations. TOPAS offering an additional standard model choice suggests the potential for greater accuracy and specificity in modeling particle interactions compared to GATE’s available options. This is evidenced in the Gamma Index (GI) values, where TOPAS consistently displays higher values than GATE across all selected mean energy and FWHM values in our study. This signifies a trend toward greater fidelity in TOPAS simulations, likely due to its wider array of standard model options.
It is important to note that the gamma passing criteria
3.3.1 Physics models
Various simulations were performed using the configured electron source, and the relative dose difference method was used to compare calculated and measured dose distributions to validate our choice of physical model in our work (PDD and DP). The optimal model for our application was one that had a small relative difference and a short calculation time. Figures 7–9 show the PDDs and DPs of the three EM models simulated by GATE for different field sizes, and the percentage of MC data points that passed the gamma evaluation criteria is given for each measurement based on the 2%/2 mm criteria. These results are presented in Tables 7, 8.
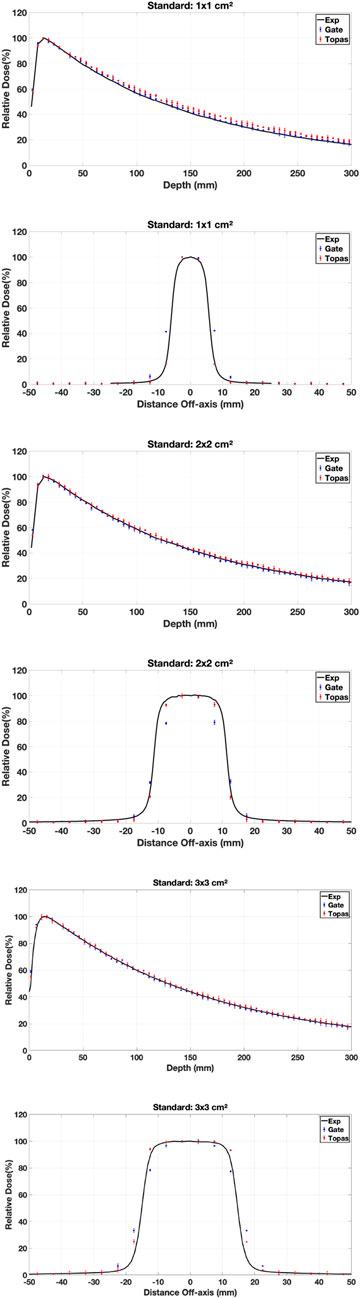
Figure 7. PDD and DP for
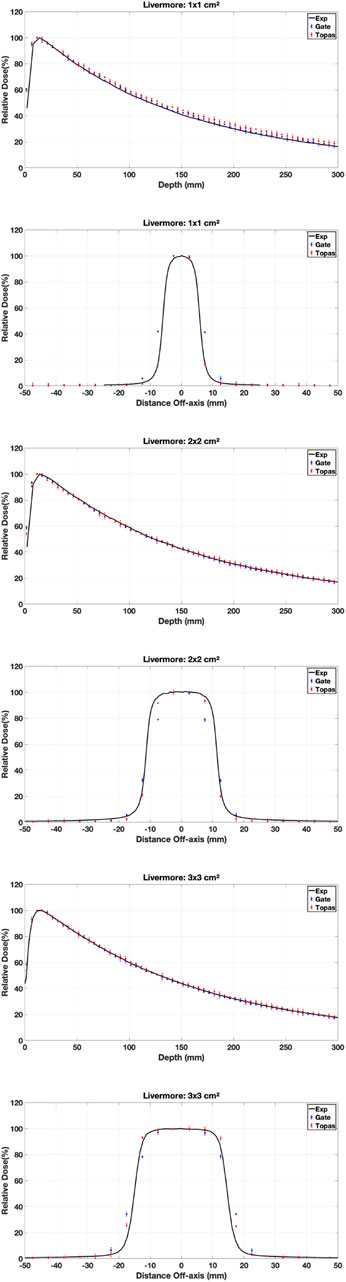
Figure 8. PDD and DP for
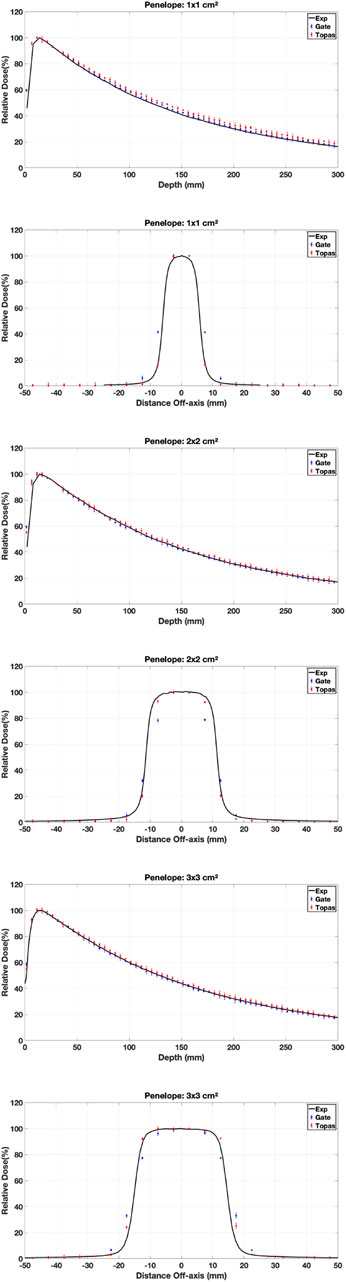
Figure 9. PDD and DP for
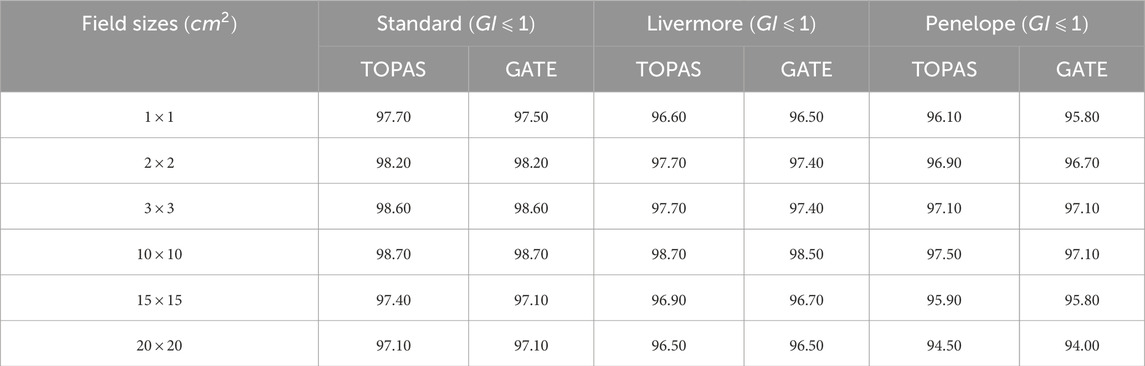
Table 7. PDD comparison between experimental data and TOPAS and GATE by applying the Gamma Index with 2% for dose-difference and 2 mm for distance-to-agreement.
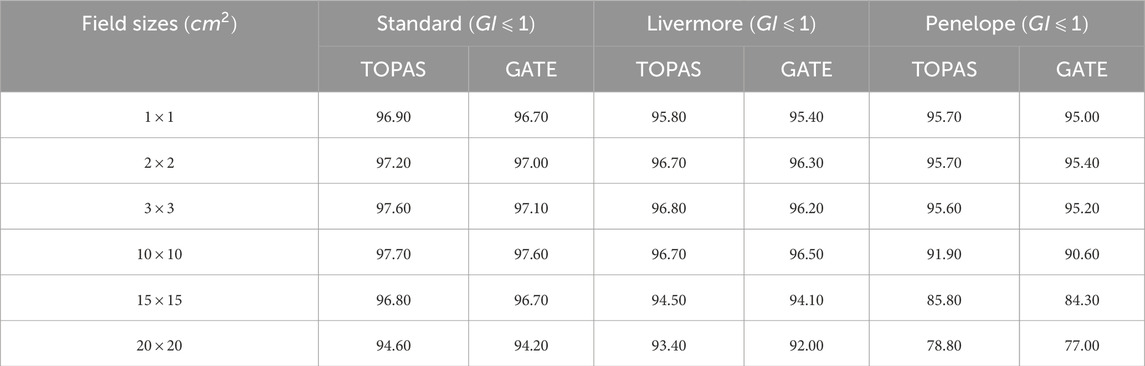
Table 8. DP comparison between experimental data and TOPAS and GATE by applying the Gamma Index with 2% for dose-difference and 2 mm for distance-to-agreement.
The results obtained from using different physical models show that the standard model agrees well with the measured data when using the GI criteria of 2%/2 mm, compared to the other models. In terms of timing, the standard model is faster than the Livermore and Penelope models due to its simpler transport algorithm [53]. Additionally, we observed that the standard model provides better agreement with the measured data than the Livermore and Penelope models. However, the Penelope model underestimates the dose in the region of electronic equilibrium. This is due to its higher average energy near the central axis, which causes a deeper penetration and a shift to the right in the PDD curve. Furthermore, the primary electron beam’s energy spectrum and radial distribution affect dose profiles, and this effect decreases with depth [42, 54]. Since Penelope’s model has a higher average energy than the others, it reduces dose deposition by increasing the distance from the center axis, implying that higher doses should be deposited closer to the center axis.
While the Standard EM model produced the best agreement in our water-phantom benchmarks and was fastest, it does not include Rayleigh scattering or detailed atomic relaxation. For simulations involving bone, lung heterogeneities Ait Elcadi et al. [55] or high-Z implants, Livermore or Penelope models may better capture low-energy processes and atomic effects; therefore we recommend platform users validate physics choices on simple heterogeneous phantoms (e.g., slab lung/bone) before clinical adoption. In addition, because physics lists, cross-section libraries and default model choices can change between Geant4/TOPAS/GATE releases, users should (re)run a short set of the provided benchmark cases whenever a major software upgrade occurs.
3.3.2 Future work
The benchmarking methodology and observed differences between gate and topas, while demonstrated for a
1. Electron Beam Therapy: Accurate modeling of scattering and dosimetry in heterogeneous media is paramount. The performance gap between the platforms, especially regarding low-energy electron transport and the efficiency of simulating scattered particle showers necessitates dedicated study.
2. High-Energy Photon Beams
As a result, future work will expand this benchmarking to electron and high-energy photon beams, delivering a comprehensive guide for simulation platform selection across external beam radiotherapy.
Finally, we note the potential for cross-disciplinary computational strategies to inform next-generation acceleration of Monte Carlo. For example, digital quantum simulators and hybrid PD-DEM methods Tang et al. [56], Walayat et al. [57] illustrate alternate paradigms and multi-scale approaches that could be fruitful to explore in future acceleration pipelines for high-fidelity radiotherapy simulation.
4 Conclusion
The optimization techniques employed in Monte Carlo simulations can significantly reduce computation time while ensuring the accuracy of the results. In this study, we utilized various optimization techniques, including parallelization, PhS techniques, production threshold optimization, and variance reduction techniques, to reduce the computation time of a radiotherapy simulation task.
The results of our study showed that utilizing the maximum number of nodes available to the user and parallelizing the simulation into 200 tasks resulted in a 25% CPU optimization when compared to the use of a single node. Furthermore, by utilizing PhS techniques to divide the geometry into two parts and considering only the dependent part, the simulation time of the two modules was reduced by 65% compared to the simulation of the entire accelerator head. We also investigated the impact of production threshold optimization on the simulation results and found that a production threshold of 0.1 mm in the water phantom would have a negligible impact on the dose.
Additionally, we explored variance reduction techniques, including division factors, energy slices, step functions, cut-off energies, and thread numbers, to optimize the computation time of the simulations. Overall, the use of these optimization techniques can significantly reduce the computation time required for Monte Carlo simulations, allowing for more efficient and accurate simulations in the field of radiotherapy. Simulations were performed using GATE and TOPAS to determine the electron parameters for a medical linear accelerator by creating various configurations with different average energies and measuring the dose distributions. The simulations showed that increasing the average electron energy resulted in increased dose values, with greater differences observed in deeper positions.
The study also compared different physical models and concluded that the standard model was the most efficient and produced the best agreement with measured data. The final electron parameters determined were an average energy of 5.8 MeV and 6.0 MeV and a focal spot size of 1.3 mm and 1.1 mm for TOPAS and GATE, respectively. Overall, the study showed the importance of accurate determination of electron parameters in medical linear accelerators to ensure effective treatment. In addition to the advancements achieved through the optimization techniques employed in this study, future research can explore various avenues to further enhance the efficiency and effectiveness of Monte Carlo simulations in radiotherapy. One potential direction is the integration of machine learning algorithms to dynamically adjust simulation parameters based on real-time feedback, potentially leading to adaptive optimization strategies. Furthermore, investigating the applicability of emerging hardware architectures, such as GPUs or quantum computing, could offer substantial improvements in simulation performance. Additionally, expanding the scope of the study to encompass a wider range of treatment scenarios and clinical settings would provide valuable insights into the generalizability and robustness of the optimization techniques proposed. By addressing these areas, future research can continue to advance the field of Monte Carlo simulations in radiotherapy, ultimately facilitating more precise and efficient treatment planning processes.
The methodological insights and benchmarking framework presented in this work retain enduring relevance, despite the continuous evolution of the simulation platforms (GATE v9.1, TOPAS v3.9). While future updates may adjust specific optimal parameters (e.g., electron mean energy, focal spot size) due to refined cross-sections or improved algorithms, the comparative strengths identified—such as TOPAS’s superior deep-dose agreement and GATE’s efficacy with advanced variance-reduction techniques (e.g., KillActor)—are grounded in fundamental architectural differences rather than version-specific details. The systematic framework for performance evaluation, employing phased optimization and dosimetric validation, thus provides a robust template for characterizing future software iterations.
Data availability statement
The raw data supporting the conclusions of this article will be made available by the authors, without undue reservation.
Author contributions
ZE: Writing – review and editing, Methodology, Software, Validation, Writing – original draft, Visualization. YT: Writing – review and editing, Visualization, Methodology. TT: Methodology, Writing – review and editing, Visualization. RS: Writing – review and editing, Methodology, Investigation, Visualization. RH: Writing – review and editing. NA-H: Writing – review and editing. OB: Resources, Writing – original draft, Funding acquisition, Supervision, Writing – review and editing.
Funding
The author(s) declare that financial support was received for the research and/or publication of this article. This work was supported by an internal grant from Texas A&M University at Qatar (RRSG2022). The simulation was conducted using the high performance computing infrastructure at the same university.
Conflict of interest
The authors declare that the research was conducted in the absence of any commercial or financial relationships that could be construed as a potential conflict of interest.
Generative AI statement
The author(s) declare that no Generative AI was used in the creation of this manuscript.
Any alternative text (alt text) provided alongside figures in this article has been generated by Frontiers with the support of artificial intelligence and reasonable efforts have been made to ensure accuracy, including review by the authors wherever possible. If you identify any issues, please contact us.
Publisher’s note
All claims expressed in this article are solely those of the authors and do not necessarily represent those of their affiliated organizations, or those of the publisher, the editors and the reviewers. Any product that may be evaluated in this article, or claim that may be made by its manufacturer, is not guaranteed or endorsed by the publisher.
References
1. Kawrakow I, Walters BRB. Efficient photon beam dose calculations using DOSXYZnrc with BEAMnrc. Med Phys (2006) 33:3046–56. doi:10.1118/1.2219778
2. Battistoni G, Bauer J, Boehlen TT, Cerutti F, Chin MPW, Augusto RDS, et al. The FLUKA code: an accurate simulation tool for particle therapy. Front Oncol (2016) 6:116–24. doi:10.3389/fonc.2016.00116
3. Schwarz R, Carter LL, Schwarz A. Modification to the monte carlo N-Particle (MCNP) visual editor (MCNPVised) to read in computer aided design (CAD) files (2005). doi:10.2172/843024
4. Bramoulle C, Husson F, Manens J. Monte Carlo (PENELOPE code) study of the x-ray beams from Sl linacs (Elekta). Physica Med (2000) 16:107–15.
5. Allison J, Amako K, Apostolakis J, Araujo H, Dubois PA, Asai M, et al. Geant4 developments and applications. IEEE Trans Nucl Sci (2006) 53:270–8. doi:10.1109/TNS.2006.869826
6. Augusto R, Bauer J, Bouhali O, Cuccagna C, Gianoli C, KozÅ‚owska W, et al. An overview of recent developments in FLUKA PET tools. Physica Med (2018) 54:189–99. doi:10.1016/j.ejmp.2018.06.636
7. Henzen D, Manser P, Frei D, Volken W, Neuenschwander H, Born EJ, et al. Monte Carlo based beam model using a photon MLC for modulated electron radiotherapy. Med Phys (2014) 41:021714. doi:10.1118/1.4861711
8. Sheikh-Bagheri D, Rogers DWO. Monte Carlo calculation of nine megavoltage photon beam spectra using the BEAM code. Med Phys (2002b) 29:391–402. doi:10.1118/1.1445413
9. Turian J, Smith B, Bernard D, Griem K, Chu J. Monte Carlo calculations of output factors for clinically shaped electron fields. J Appl Clin Med Phys (2004) 5:42–63. doi:10.1120/jacmp.v5i2.1976
10. Ali OA, Willemse CA, Shaw W, O’Reilly FHJ, Plessis FCP. Monte Carlo electron source model validation for an Elekta precise linac. Med Phys (2011) 38:2366–73. doi:10.1118/1.3570579
11. Khaledi N, Arbabi A, Sardari D, Mahdavi S, Aslian H, Dabaghi M, et al. Monte Carlo investigation of the effect of small cutouts on beam profile parameters of 12 and 14 mev electron beams. Radiat Measurements (2013) 51-52:48–54. doi:10.1016/j.radmeas.2013.01.019
12. Khaledi N, Arbabi A, Sardari D, Mohammadi M, Ameri A. Simultaneous production of mixed electron-photon beam in a medical LINAC: a feasibility study. Physica Med (2015) 31:391–7. doi:10.1016/j.ejmp.2015.02.014
13. Aitelcadi Z, Toufique Y, Kharrim AE, Elmadani S, Hilali A, Bouhali O. Validation of the GATE Monte Carlo code for radiation therapy: varian Clinac2300c/d. In: 2018 4th International Conference on Optimization and Applications (ICOA) (2018). p. 1–4. doi:10.1109/ICOA.2018.8370602
14. Sarrut D, Bardiès M, Boussion N, Freud N, Jan S, Letang J-M, et al. A review of the use and potential of the gate Monte Carlo simulation code for radiation therapy and dosimetry applications. Med Phys (2014) 41:064301. doi:10.1118/1.4871617
15. Papadimitroulas P. Dosimetry applications in Gate Monte Carlo toolkit. Physica Med (2017) 41:136–40. doi:10.1016/j.ejmp.2017.02.005
16. Arce P, Lagares JI. CPU time optimization and precise adjustment of the Geant4 physics parameters for a VARIAN 2100 C/D gamma radiotherapy linear accelerator simulation using GAMOS. Phys Med Biol (2018) 63:035007. doi:10.1088/1361-6560/aaa2b0
17. Park Hyojun KJ-I, Choi HJ, Hee MC. Analysis of dose distribution according to the initial electron beam of the linear accelerator: a monte carlo study. J Radiat Prot Res (2018) 43:10–9. doi:10.14407/jrpr.2018.43.1.10
18. Jung H, Shin J, Chung K, Han Y, Kim J, Choi DH. Feasibility of using Geant4 Monte Carlo simulation for IMRT dose calculations for the Novalis Tx with a HD-120 multi-leaf collimator. J Korean Phys Soc (2015) 66:1489–94. doi:10.3938/jkps.66.1489
19. Gholami S, Longo F, Nedaie HA, Berti A, Mousavi M, Meigooni AS. Application of Geant4 Monte Carlo simulation in dose calculations for small radiosurgical fields. Med Dosimetry (2018) 43:214–23. doi:10.1016/j.meddos.2017.08.007
20. Yani S, Rhani M, Soh R, Haryanto F, Arif I. Monte Carlo simulation of varian clinac iX 10 MV photon beam for small field dosimetry. Int J Radiat Res (2017) 15. doi:10.18869/ACADPUB.IJRR.15.3.275
21. Onizuka R, Araki F, Ohno T. Monte Carlo dose verification of VMAT treatment plans using Elekta agility 160-leaf MLC. Physica Med (2018) 51:22–31. doi:10.1016/j.ejmp.2018.06.003
22. OpenGATE Collaboration. GATE Documentation (2025). Available online at: https://opengate.readthedocs.io/en/latest/index.html#.
24. Perl J, Shin J, Schumann J, Faddegon B, Paganetti H. Topas: an innovative proton monte carlo platform for research and clinical applications. Med Phys (2012) 39:6818–37. doi:10.1118/1.4758060
25. Faddegon B, Ramos-Mendez J, Schuemann J, McNamara A, Shin J, Perl J, et al. The topas tool for particle simulation, a Monte Carlo simulation tool for physics, biology and clinical research. Physica Med (2020) 10:1016. doi:10.1016/j.ejmp.2020.03.019
26. Mesbahi A, Fix M, Allahverdi M, Grein E, Garaati H. Monte Carlo calculation of Varian 2300c/d Linac photon beam characteristics: a comparison between MCNP4C, GEANT3 and measurements. Appl Radiat Isot (2005) 62:469–77. doi:10.1016/j.apradiso.2004.07.008
27. Aljarrah K, Sharp GC, Neicu T, Jiang SB. Determination of the initial beam parameters in Monte Carlo linac simulation. Med Phys (2006) 33:850–8. doi:10.1118/1.2168433
28. Fix M, Keall P, Dawson K, Siebers J. Monte Carlo source model for photon beam radiotherapy: photon source characteristics. Med Phys (2004) 31:3106–21. doi:10.1118/1.1803431
29. Pena J, Gonzalez-Castano DM, Gomez F, Sanchez-Doblado F, Hartmann GH. Automatic determination of primary electron beam parameters in Monte Carlo simulation. Med Phys (2007) 34:1076–84. doi:10.1118/1.2514155
30. Bouhali O, Sheharyar A, Mohamed T. Accelerating avalanche simulation in gas based charged particle detectors. Nucl Instr Methods Phys Res Section A: Acc Spectrometers, Detectors Associated Equipment (2018) 901:92–8. doi:10.1016/j.nima.2018.05.061
31. Faddegon B, Ross C, Rogers D. Angular distribution of bremsstrahlung from 15-mev electrons incident on thick targets of be, al and pb. Med Phys (1991) 18:727–39. doi:10.1118/1.596667
32. Mohan R, Chui C, Lidofski L. Energy and angular distributions of photons from medical linear accelerators. Med Phys (1985) 12:592–7. doi:10.1118/1.595680
33. Chaney E, Cullip T, Gabriel T. A Monte Carlo study of accelerator head scatter. Med Phys (1994) 21:1383–90. doi:10.1118/1.597194
34. Nilsson B, Brahme A. Contamination of high-energy photon beams by scattered photons. Strahlentherapie (1981) 157:1181–6.
35. Capote R, Jeraj R, Ma C, Rogers D, Sanchez-Doblado F, Sempau J, et al. Phase-space database for external beam radiotherpy. In: Nuclear data section. Vienna, Austria: International Atomic Energy Agency (2006).
36. Antcheva I, Ballintijn M, Bellenot B, Biskup M, Brun R, Buncic N, et al. ROOT: a C++ framework for petabyte data storage, statistical analysis and visualization. Computer Phys Commun (2009) 180:2499–512. doi:10.1016/j.cpc.2009.08.005
37. Capote R. IAEA nuclear and atomic data for medical applications: phase-space database for external beam radiotherapy nuclear data for heavy charged-particle radiotherapy. Radiother Oncol (2007) 84:S217.
38. Blazy L. Controle qualite des systemes de planification dosimetrique des traitements en radiotherapie externe au moyen du code Monte-Carlo PENELOPE. Ph.D. thesis. Toulouse, France: Paul Sabatier University (2007).
39. Franchisseur E. Modelisation et validation de l’accelerateur PRIMUS de SIEMENS par le code Monte Carlo PENELOPE dans le cadre de la Radiotherapie du Cancer. Ph.D. thesis. Nice, France: Nice-Sophia Antipolis University (2007).
40. Jaffray D, Battista J, Fenster A, Munro P. X-ray sources of medical linear accelerators: focal and extra-focal radiation. Med Phys (1993) 20:1417–27. doi:10.1118/1.597106
41. Anai S, Arimura H, Nakamura K, Araki F, Matsuki T, Yoshikawa H, et al. Estimation of focal and extra-focal radiation profiles based on Gaussian modeling in medical linear accelerators. Radiol Phys Technol (2011) 4:173–9. doi:10.1007/s12194-011-0118-1
42. Verhaegen F, Seuntjens J. Monte carlo modelling of external radiotherapy photon beams. Phys Med (2003) 48:107–64. doi:10.1088/0031-9155/48/21/r01
43. Childress N, Bloch C, White R, Salehpour M, Rosen I. Detection of IMRT delivery errors using a quantitative 2D dosimetric verification system. Med Phys (2005) 32:153–62. doi:10.1118/1.1829171
44. Nelms B, Simon J. A survey on planar IMRT QA analysis. J Appl Clin Med Phys (2007) 8:76–90. doi:10.1120/jacmp.v8i3.2448
45. Esch AV, Bohsung J, Sorvari P, Tenhunen M, Paiusco M, Iori M, et al. Acceptance tests and quality control (QC) procedures for the clinical implementation of intensity modulated radiotherapy (IMRT) using inverse planning and the sliding window technique: experience from five radiotherapy departments. Radiother Oncol J Eur Soc Ther Radiol Oncol (2002) 65:53–70. doi:10.1016/s0167-8140(02)00174-3
46. Salvat F, Fernández-Varea J, Sempau J. PENELOPE-2008: a code system for Monte Carlo simulation of electron and photon transport. Barcelona: NEA Data Bank (2008). p. 4–7.
47. Bergstorm PM, Pratt RH. An overview of the theories used in compton scattering calculations. Radiat Phys Chem (1997) 50:3–29. doi:10.1016/s0969-806x(97)00022-4
48. Cullen DE. A simple model of photon transport. Nucl Instr Methods Phys Res Section B: Beam Interactions Mater Atoms (1995) 101:499–510. doi:10.1016/0168-583x(95)00480-7
49. Poon E, Verhaegen F. Accuracy of the photon and electron physics in GEANT4 for radiotherapy applications. J Med Phys (2005) 32:1696–711. doi:10.1118/1.1895796
50. Keall P, Siebers J, Libby B, Mohan R. Determining the incident electron fluence for Monte Carlo-based photon treatment planning using a standard measured data set. Med Phys (2003) 30:574–82. doi:10.1118/1.1561623
51. DeMarco J, Solberg T, Smathers J. A ct-based monte carlo simulation tool for dosimetry planning and analysis. Med Phys (1998) 25:1–11. doi:10.1118/1.598167
52. Libby B, Siebers J, Mohan R. Validation of monte carlo generated phase-space descriptions of medical linear accelerator. Med Phys (1999) 26:1476–83. doi:10.1118/1.598643
53. Sadoughi H-R, Nasseri S, Momennezhad M, Sadeghi H-R, Bahreyni-Toosi M-H. A comparison between GATE and MCNPX Monte Carlo codes in simulation of medical linear accelerator. J Med signals sensors (2014) 4:10–7. doi:10.4103/2228-7477.128433
54. Sheikh-Bagheri D, Rogers D. Sensitivity of megavoltage photon beam Monte Carlo simulations to electron beam and other parameters. Med Phys (2002a) 29:379–90. doi:10.1118/1.1446109
55. Ait Elcadi Z, El Moussaoui M, Aouadi S, Sukumaran R, Hammoud R, Al-Hammadi N, et al. Gate monte carlo approach to heterogeneity dose distribution in small fields used in radiation therapy. Biomed Phys and Eng Express (2024) 10:035021. doi:10.1088/2057-1976/ad36cd
56. Tang H, Simancas-Garcia JL, Mai J, Cheng M, Iqbal I, Por LY. Overview of digital quantum simulator: applications and comparison with latest methods. SPIN (2024) 15:2440004. doi:10.1142/S2010324724400046
Keywords: Monte Carlo, GATE, TOPAS, GEANT4, varian, radiotherapy
Citation: Elcadi ZA, Toufique Y, Torfeh T, Sukumaran R, Hammoud R, Al-Hammadi N and Bouhali O (2025) Methodological benchmarking of GATE and TOPAS for 6 MV LINAC beam modeling and simulation efficiency. Front. Phys. 13:1671778. doi: 10.3389/fphy.2025.1671778
Received: 23 July 2025; Accepted: 22 September 2025;
Published: 09 October 2025.
Edited by:
Claudia Kuntner, Medical University of Vienna, AustriaReviewed by:
Imran Iqbal, Helmholtz Association of German Research Centres (HZ), GermanyLiang Sun, Soochow University, China
Copyright © 2025 Elcadi, Toufique, Torfeh, Sukumaran, Hammoud, Al-Hammadi and Bouhali. This is an open-access article distributed under the terms of the Creative Commons Attribution License (CC BY). The use, distribution or reproduction in other forums is permitted, provided the original author(s) and the copyright owner(s) are credited and that the original publication in this journal is cited, in accordance with accepted academic practice. No use, distribution or reproduction is permitted which does not comply with these terms.
*Correspondence: Zakaria Ait Elcadi, emFrYXJpYS5haXRfZWxjYWRpQHFhdGFyLnRhbXUuZWR1