 David J. Kelly1*
 Rachael E. Jack2
 Sébastien Miellet2
 Emanuele De Luca2
 Kay Foreman2
 Roberto Caldara3*
- 1 Department of Psychology, Royal Holloway, Egham, UK
- 2 Department of Psychology and Centre for Cognitive Neuroimaging, University of Glasgow, Glasgow, UK
- 3 Department of Psychology, University of Fribourg, Fribourg, Switzerland
Adults from Eastern (e.g., China) and Western (e.g., USA) cultural groups display pronounced differences in a range of visual processing tasks. For example, the eye movement strategies used for information extraction during a variety of face processing tasks (e.g., identification and facial expressions of emotion categorization) differs across cultural groups. Currently, many of the differences reported in previous studies have asserted that culture itself is responsible for shaping the way we process visual information, yet this has never been directly investigated. In the current study, we assessed the relative contribution of genetic and cultural factors by testing face processing in a population of British Born Chinese adults using face recognition and expression classification tasks. Contrary to predictions made by the cultural differences framework, the majority of British Born Chinese adults deployed “Eastern” eye movement strategies, while approximately 25% of participants displayed “Western” strategies. Furthermore, the cultural eye movement strategies used by individuals were consistent across recognition and expression tasks. These findings suggest that “culture” alone cannot straightforwardly account for diversity in eye movement patterns. Instead a more complex understanding of how the environment and individual experiences can influence the mechanisms that govern visual processing is required.
Introduction
It has long been considered that many aspects of human cognition are culture invariant. This assumption arises from the fact that the neural substrates underlying cognitive processes are thought to be principally identical across all people and cultures. However, studies conducted over the past decade have begun to systematically challenge the notion of cognitive universality, forcing reconsideration of long standing beliefs about how humans process information, particularly from their visual world. At the forefront of current literature is the assertion that culture itself is responsible for shaping the way we perceive the world.
As reported by Nisbett and Masuda (2003), adults from collectivist societies in East Asian countries (e.g., China, Japan etc.) process visual information holistically whereas adults from individualist Western countries (e.g., USA, Britain etc.) employ analytical processing strategies, resulting in fundamental differences in thought, behavior, and perception. Adults from Western societies are inclined to focus on focal objects, make causal attributions and group objects based on categorical rules. By contrast, Easterners are more likely to display interest in context, make situational attributions and group objects according to relationships (see Nisbett and Miyatomo, 2005 for a review). It has been argued by Nisbett and Masuda (2003) that these divergent strategies are deep-rooted and have originating from numerous factors such as distinct geography, philosophy, and political ideology. In terms of geographical topography, conditions in the West favored the pursuit of ventures such as hunting and fishing that could be performed by individuals and consequently promoted autonomy and the attainment of personal objectives. By contrast, conditions in the East favored farming, which demanded the cooperative efforts of many individuals, especially where arable land was limited, and therefore promoted social group interactions and the attainment of collective objectives.
The history of farming and food production can be traced back approximately 10000 years in both Greece (Montgomery, 2007) and China (Bray, 1984). Coupled with geographical factors that served to structure fledgling societies are the socio-political ideologies and philosophies that are responsible for shaping thought and action. For example, in ancient Greece, Aristotle focused his explanation of the world on individual objects: a rock sank in water because it had the property of “gravity” and wood floated because it had the property of “levity.” However, the Chinese perceived that actions occurred in a field of forces (i.e., the water), allowing them to understand concepts such as tidal flows and magnetism long before thinkers in the West. While ecological factors may not be identical today to those of the ancient world, such factors were pivotal in shaping social structures that have since been maintained. In short, there is a “causal chain running from social structure to social practice to attention and perception to cognition” (Nisbett and Masuda, 2003).
Culture’s potency for shaping thought and behavior is still acutely evident when visiting foreign countries today. As observed by Swidler (1986), When we notice cultural differences we recognize that people do not go about their business in the same ways; how they approach life is shaped by their culture. Within Europe, for example, every individual country has a long and rich history which has created distinct and varied cultural groups divided only by relatively arbitrary dividing points (i.e., international borders). Cultural differences are even more marked when crossing continental boundaries. Indeed, the differences can be so profound that travelers regularly suffer from what is known as “culture shock”; the feeling of surprise, uncertainty, disorientation, etc., which is felt when people need to function in an unfamiliar cultural environment. While claims of intense cultural diversity are not controversial, linking cognitive processes to the physical environment could be considered somewhat speculative. However, an alternative account of the observed differences has not yet emerged. Furthermore, in addition to the cultural differences found at the behavioral level described above, cultural diversity has also been shown in studies of eye movements.
Adults who have been raised in different cultural backgrounds, namely Western and East Asian, display dissimilar patterns of fixations during face processing tasks (Blais et al., 2008). Consistent with a multitude of prior reports (e.g., Yarbus, 1965; Janik et al., 1978; Groner et al., 1984; Kleinke, 1986; Henderson et al., 2005), Blais et al. (2008) found that Western Caucasian adults primarily fixate the eyes and mouth region during face learning, recognition and race categorization tasks. However, East Asian adults did not display this well documented strategy and instead directed the majority of their fixations toward the central region of the face, which represents the optimal location for the visual system to process information holistically. These divergent strategies are consistent across face race categories (Western Caucasian and East Asian), time (i.e., stimulus presentation duration) and are equally reliable strategies as both populations achieved comparable face recognition and race categorization accuracy. Furthermore, differences in the distribution of fixations persist across non-human face stimuli (sheep) and non-face objects (greebles) and are thus not stimulus specific (Kelly et al., 2010). Together, these data show fundamental differences in visual processing between cultural groups.
Studies using a variety of techniques, such as behavioral (Davies et al., 1977), response classification (Gosselin and Schyns, 2001) and computational modeling (Rowley et al., 1998; Viola and Jones, 2004) have revealed that the critical information required to accurately individuate faces is located in the eye region, but not the nose (see also Caldara et al., 2010). Fixations toward the mouth are functional during communication with conspecifics as they serve to facilitate speech comprehension (Reisberg et al., 1987), making such fixations habitual and likely to account for their occurrence when viewing static images. Strategies similar to those reported in Western Caucasian adults have also been observed in rhesus macaques (Macaca mulatta), emphasizing the biological pertinence of information contained in the eye region for identity recognition (Dahl et al., 2009) and mouth region for facilitating the comprehension of vocalizations (Ghazanfar et al., 2006). When considering these findings collectively, it is puzzling that East Asian adults are able to fixate an essentially redundant facial feature (i.e., the center of the face) in terms of individuation, yet still achieve face recognition accuracy comparable to that of Western Caucasian adults, who fixate information known to be diagnostic for face identification.
Caldara et al. (2010) recently clarified the apparent underuse of eye region information in East Asian observers by using a gaze-contingent moving aperture paradigm. Western Caucasian and East Asian observers explored faces while their extrafoveal vision was dynamically restricted by apertures sized 2°, 5°, and 8° of visual angle, termed “Spotlights.” Critically, in the most restrictive -conditions (i.e., 2° and 5°), the eyes were not visible when fixations landed on the center of the face. By contrast, in the most permissive condition (i.e., 8°of visual angle) the eyes were simultaneously visible during central fixations. In both the 2° and 5° conditions, East Asian observers adapted their usual strategy by fixating the eyes in an identical manner to the Western observers. However, in the 8° condition, when the eyes and mouth were simultaneously visible from the center of the face, East Asian observers reverted to their preferred strategy by directed fixations to the center of the face. These results suggest that although East Asian observers rely on the same facial information (i.e., the eyes) as Western observers, they process this information using extrafoveal vision. When vision is restricted, East Asian observers are forced to modulate their preferred central fixation strategy to one that mirrors the Western fixation pattern in order to access the eye region.
In the current study we directly explored the impact of cultural environment on eye-movement strategies during face learning and recognition. The studies described above support the notion of environmental or cultural influence, but none have directly tested this hypothesis. To address this shortfall, we identified a population of British Born Chinese adults. The British Born Chinese population is genetically Chinese, but were born in a Western country (UK) and have lived their entire lives there. We hypothesized that cultural influences, rather than genetic heritage, are primarily responsible for shaping eye movement strategies. Thus, we predict that the predominance of exposure to Western culture experienced by the British Born Chinese will cause them to display the Western, triangular series of fixations (e.g., Henderson et al., 2005) and not the central fixation strategy displayed by East Asians in previous studies.
Experiment 1
Methods
Participants
Twenty British Born Chinese (14 females) adults (SD mean = 25.23 years) participated in this study. All participants had been born in the UK (Scotland), had spent their entire lives in the UK and were living in Glasgow at the time of testing. We recruited participants through a Chinese Community Development Partnership in Glasgow. All participants had normal or corrected vision and were paid £6/h for their participation. All participants gave written informed consent and the protocol was approved by the the Department of Psychology ethical committee.
Materials
We sourced stimuli from the Karolinska Directed Emotional Faces (KDEF, Lundqvist et al., 1998) database and Asian Face Image Database (AFID, Bang et al., 2001), which consisted of 56 East Asian and 56 Western Caucasian identities with equal numbers of males and females. At 390 × 382 pixels in size, each image subtended 15.6° of visual angle horizontally and 15.3° of visual angle vertically, when viewed at a distance of 70 cm (a natural distance during human interaction; Hall, 1966). Thus, each image represented the size of a real face (approximately 19 cm in height). We cropped all images around the face to remove clothing and hair and were devoid of distinctive features (e.g., scarf, jewelry, facial hair etc.). The faces used were aligned on eye and mouth positions and luminance normalized for all images. We presented images on gray background on a 19′′ Dell P1130 CRT monitor with a refresh rate of 170 Hz and a screen resolution of 800 × 600 pixels and used a chin/forehead rest to maintain a constant viewing distance. We controlled stimulus presentation using MATLAB™ (The MathWorks, MA, USA).
Eye-tracking
We recorded eye movements using an SR Research Desktop-Mount EyeLink 2K eyetracker with a sampling rate of 1000 Hz and average gaze position error of approximately 0.25° visual angle, a spatial resolution of 0.01° visual angle and a linear output over the range of the monitor used. Only the dominant eye of each participant was tracked although viewing was binocular. We used MATLAB™ (R2006a) in conjunction with Psychophysics toolbox (PTB-3) and EyeLink Toolbox extensions (Brainard, 1997; Cornelissen et al., 2002) to execute the experiment. Prior to testing, we performed calibration using a nine-point fixation procedure as implemented in the EyeLink API (see EyeLink Manual) followed by validation with the EyeLink software. We repeated this procedure when necessary and until the optimal calibration criterion was reached. At the beginning of each trial, participants fixated a dot at the center of the screen to calculate drift correction. If the drift correction exceeded 1° of visual angle, we launched a new calibration procedure to insure an optimal recording quality.
Procedure
Participants were informed that they would be presented with a series of faces to learn and subsequently recognize, which would be conducted during two separate sessions (East Asian and Western Caucasian) with each face race session containing two blocks. In each block, observers learned 14 face identities (seven females) each displaying either neutral, happy or disgusted facial expressions (presented in random order). After a 30-s pause, observers were presented with a series of 28 faces (14 faces from the learning phase – 14 new faces; seven females), indicating whether each face was familiar or not. Participants were instructed to respond as quickly and as accurately as possible by pressing pre-allocated keys on the keyboard with the index fingers of their left and right hands. Faces of the two races were presented in separate blocks, with the order of presentation for same- and other-race blocks counterbalanced across observers. Response buttons were counterbalanced across participants.
Each trial started with the presentation of a central fixation cross, followed by a series of four crosses presented in each of the four quadrants of the monitor. This procedure allowed the experimenter to check the accuracy of the previous calibration procedure, thus validating the calibration between each trial. Finally, a central fixation cross that served as a drift correction measure was displayed, followed by a face presented in a random location on the monitor to prevent anticipatory strategies, all images were presented in random locations on the computer screen. Faces were displayed in a white frame for 5-s duration in the learning phase and until the observer responded in the recognition phase. Each face was subsequently followed by the six fixation crosses which preceded the next face stimulus.
Data Analyses
The data was analyzed with iMap (Caldara and Miellet, 2011). Only correct trials were analyzed. Fixation distribution maps were extracted individually for British Born Chinese participants for each face race and for the learning and recognition tasks separately. The fixation maps were computed by summing, across all correct trials (72% total trials), the fixation location coordinates (x, y) across time. Since more than one pixel is processed during a fixation, we smoothed the resulting fixation distributions with a Gaussian kernel with a sigma of 10 pixels. Then, the fixation maps of all the observers were summed together separately for each face condition to produce group fixation maps.
To produce group fixation maps, we summed the fixation maps of all the individual observers for each face condition. We then Z-scored the resulting group fixation maps for learning and recognition phases and for both sets of face stimuli separately. Finally, we pooled the fixation distributions of observers, using the mean and SD for Western Caucasian and East Asian faces to normalize the data separately. To test for any differences in eye movements across face conditions, we subtracted the values for East Asian faces from Western Caucasian faces, producing difference maps computed separately for both learning and recognition conditions. To establish significance, we used a robust statistical approach correcting for multiple comparisons in the fixation map space. We applied a two-tailed Pixel test (Chauvin et al., 2005; Zcrit > 4.38; p < 0.05) on the difference maps and a one-tailed Pixel test on the group fixation maps.
Results
Accuracy
A one-way ANOVA conducted on participant’s accuracy (d′) showed that participant’s recognition accuracy did not differ between stimulus categories [F(1,19) = 0.76, p = 0.783]. A further one-way ANOVA revealed no differences in reaction time [F(1,19) = 2.674, p = 0.102], indicating that participants responded with equal speed to both sets of faces (see Figure 1).
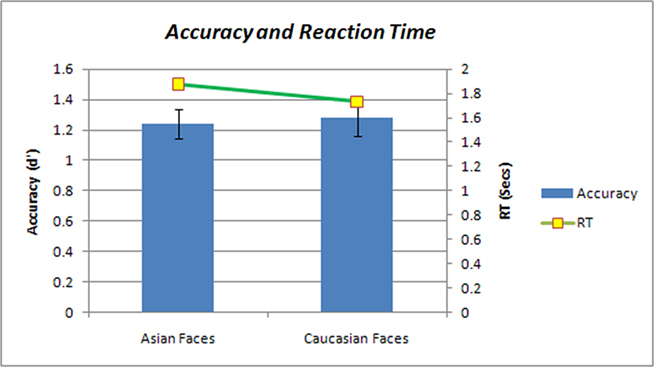
Figure 1. British Born Chinese participant’s recognition accuracy and reaction time for East Asian and Western Caucasian faces.
Number of Fixations
A 2 (Race of Face: East Asian or Western Caucasian) × 2 (Phase: Learning or Recognition) ANOVA conducted on the number of fixations yielded a main effect of Phase only [F(1,19) = 196.021, p < 0.001,  ] with more fixations made during the learning than recognition phase. Participants made equal numbers of fixations for both East Asian and Western Caucasian faces in both conditions (Number of fixations are show in Table 1).

Table 1. Average number of fixations (SD in parentheses) made during learning and recognition phases for Western Caucasian and East Asian faces.
Eye Movements
The two-tailed Pixel test conducted on the race of face differences map yielded no significant differences in eye movements across East Asian and Western Caucasian face conditions. The one-tailed Pixel test (Zcrit > 3.96; p < 0.05) applied to the group fixation maps produced large areas of significance with fixations clustered around the nose region and spreading up toward the eyes for learning and recognition and both face categories (see Figure 2).
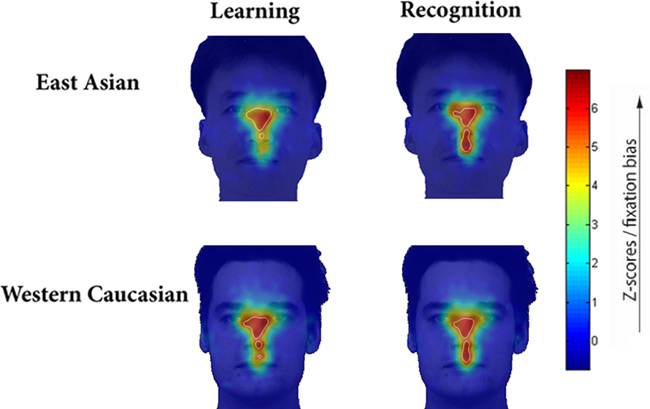
Figure 2. Group fixation maps. Significantly fixated areas delimited by white lines.
Individual Participant Analysis
Following this initial analyses, we turned our attention to the eye movement strategies used by individual participants. The group maps shown in Figure 2 appear closer to the East Asian strategies reported in previous studies (e.g., Blais et al., 2008), but with significantly fixated areas falling closer to the eye region. A visual inspection of each participant’s fixation maps showed that some individuals employed strategies that looked similar to those reported in East Asian adults, while others showed strategies more like those observed in Western Caucasian adults. In order to robustly and objectively categorize each participant’s fixation map as being closest to an “Eastern” or “Western” strategy, we developed a data-driven classification procedure. We used the Z-scored East Asian and Western Caucasian group fixation maps from Blais et al. (2008) as “Eastern” and “Western” templates (see Figure 3) and subsequently compared every individual’s fixation map with each of the templates. The purpose of the procedure was not to definitively categorize individual participants as possessing an “Eastern” or “Western” processing style, but instead to measure which template they most closely matched. Critically, the materials and methods used by Blais et al. (2008) were identical to the current study making the data templates perfectly suited for comparison with the British Born Chinese results. Five comparisons were computed separately for each individual participant. These comprised the learning and recognition phases for each race of face (i.e., East Asian and Western Caucasian faces), plus a comparison with fixation maps collapsed across all phases. We then computed a correlation coefficient for each comparison to determine whether each participant’s strategy was closer to those previously observed in Eastern and Western adults. Since correlation coefficients are not additive, they were then Z-normalized (Chung et al., 2005), before performing statistical analyses. We thus normalized the obtained correlation coefficient by using Fisher’s transform  . Then, to estimate the average correlation coefficients for template comparisons, an inverse of Fisher’s transform was applied on the mean of Z values (Zmean) using the following formula: raverage = tanh(Zmean), in which tanh stands for the hyperbolic tangent.
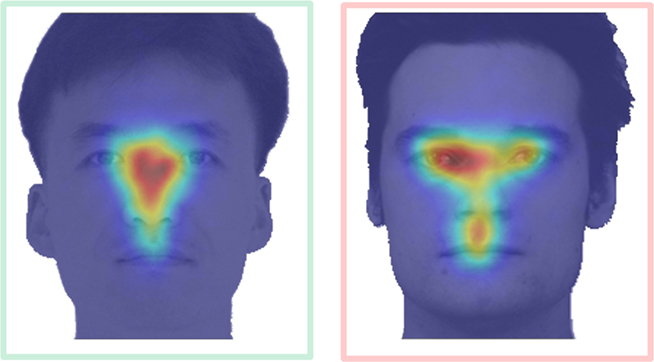
Figure 3. Classifier templates. “Eastern” templates marked by green box. “Western” template marked by red box.
The classifying method produced two main findings. First, strategies displayed by individual participants were consistent across all learning and recognition conditions. Second, the procedure classified 14 eye movement strategies as Eastern and only 6 as Western (see Figure 4; Table 2). We subsequently collapsed data across conditions, to produce two values for each individual: a similarity measure with East Asian strategies and a second measure with Western Caucasian strategies. A paired samples t-test conducted on these values confirmed that as a group [t(19) = 2.306, p < 0.033], the British Born Chinese participants’ eye movement strategies more closely resembled Eastern templates.
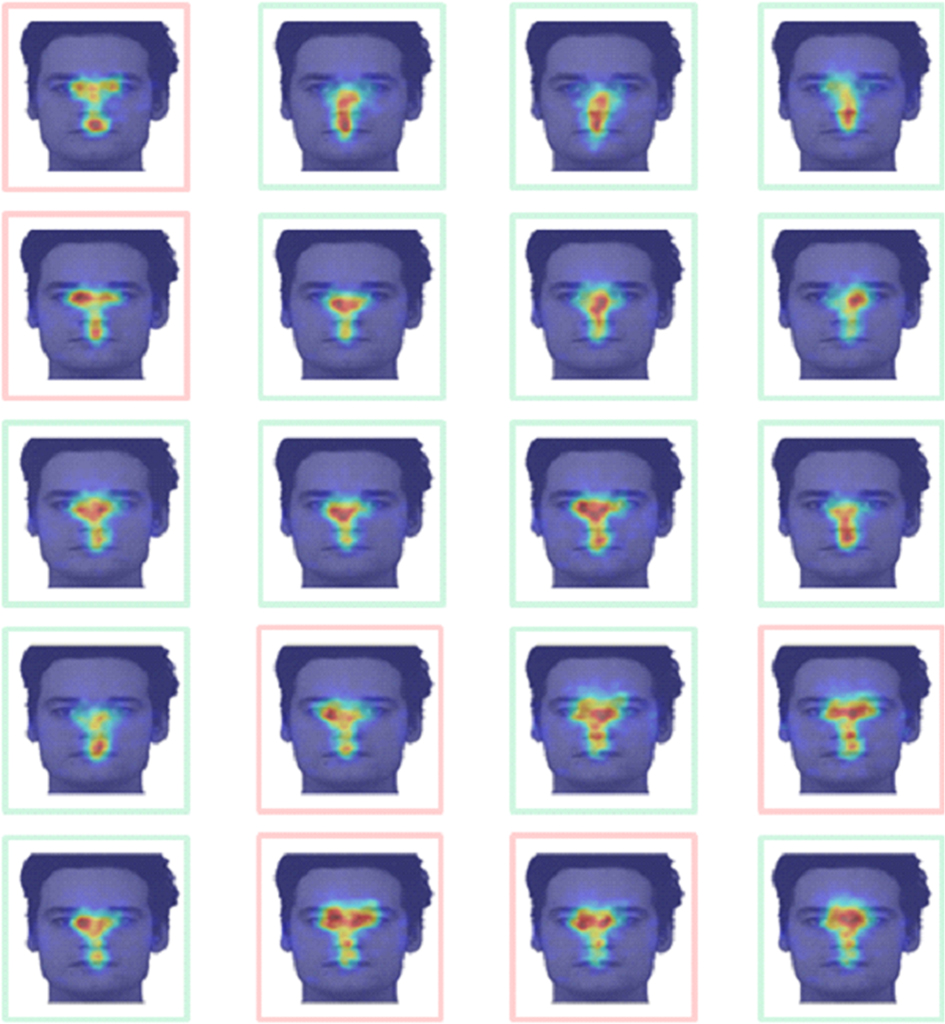
Figure 4. Experiment 1: Individual participant’s fixation maps and results from classification procedure. “Eastern” strategies marked by green boxes. “Western” strategies marked by red boxes.
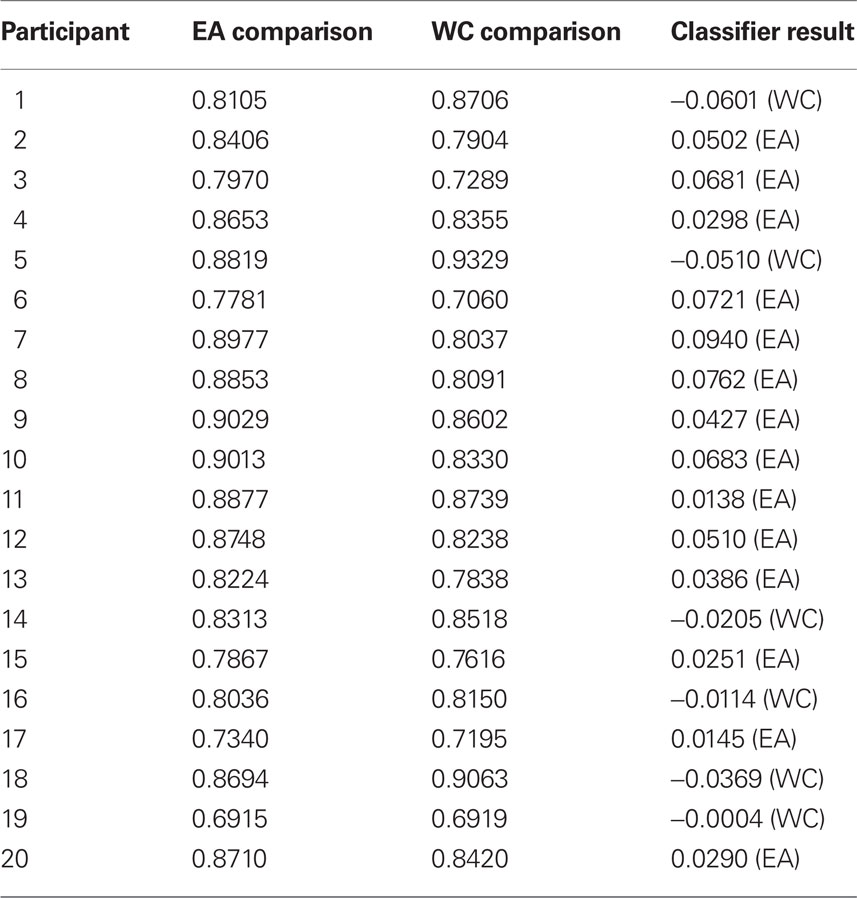
Table 2. Experiment 1: Correlation results from the classification procedure.
Discussion
The typical pattern of eye movements displayed by the British Born Chinese population was unequivocally more “Eastern” with fixations principally clustered around the center of the face. However, inspection of fixation strategies at the individual level revealed greater within-group variance than previously reported in Western Caucasian and East Asian populations (Blais et al., 2008; Kelly et al., 2010). According to our classification procedure, 70% of individual strategies are Eastern and 30% Western, which renders us unable to fully accept or reject our original hypothesis. Nonetheless, given the variability of the fixation strategies found within the British Born Chinese group, it is possible that this reflects the influence of both cultures upon these biological mechanisms, which presents a more complex picture than accounts that advocate the governance of a single, predominant cultural influence.
Numerous studies have tested Asian American participants, who are analogous to the British Born Chinese population as both groups are likely to be able to access multiple cultural perspectives (Hong and Mallorie, 2003). For example, Norenzayan et al. (2002) examined cultural differences in categorical perception. Participants were presented with a target object (e.g., a flower) and two groups/families, with each containing four unique members. The task was to decide to which group the target object most appropriately belonged. Critically, one group/family objectively possessed more features overall with the target, whereas the other group/family shared fewer features. However, all members of the group/family shared one common feature that was also found on the target object. As predicted, European Americans made more judgments according to the rule (i.e., all objects share a common feature) while Asian American participants typically placed the target object in the group that bore a greater family resemblance (i.e., more features in general). However, the judgments of the Asian American participants were distributed approximately evenly between “Eastern” and “Western” styles of categorization, with a slight inclination to categorize according to family resemblance (i.e., “Eastern” style). Interestingly, these findings are line with the current study, which replicates the distribution of “Eastern” and “Western” styles. In both instances, a genetically East Asian population born and raised in a Western environment displayed perceptual strategies that do not entirely resemble the strategies reported in European/American or East Asian adults, but represent both cultures, with a leaning toward East Asian styles. It is notable that other studies that have tested Asian populations who have temporarily relocated for study, typically display the same strategies that would be expected of people tested in Eastern countries (Cohen and Gunz, 2002). This -suggests that the cultural perspective one develops throughout early development is not easily replaced when moving to a different cultural climate.
Hong et al. (2000) demonstrated that priming bicultural adults (Westernized Chinese students living in Hong Kong) with sets of Chinese or American cultural icons is sufficient to produce corresponding “Eastern” or “Western” attribution judgments. Furthermore, Oyserman and Lee (2008) have argued that individualism and collectivism do indeed influence judgments, attributions, and cognition. However, they also suggest that broad, cross-national cultural differences are not static, but are instead dynamically altered by situational primes. In others words, both studies support the view that individuals have access to multiple processing strategies that can be adopted in response to the situational salience of individualism or collectivism.
After consideration of the findings, further examination of the British Born Chinese population yielded information that could account for the distribution of styles between Eastern and Western. The vast majority of British Born Chinese participants attended the same activity/youth center where they engaged in activities such as Mandarin lessons, calligraphy, and cookery lessons etc. to continue to engage with Eastern cultural pursuits. In short, the British Born Chinese population represents a community that actively engages with its Chinese heritage. Following these reflections, we considered that the majority of the British Born Chinese population grew up in a home environment where Eastern culture was prominent or at least well represented. In addition to explicit engagement with Eastern cultural activities, it is clear that this population had also been exposed to Western culture within their schools and more general in their day-to-day lives outside of the home. Therefore, we conducted a second experiment in which we explored the consistency of individual’s eye movement strategies across tasks.
Experiment 2
In order to help clarify the results from experiment 1, we conducted a second face processing task: the classification of facial expressions of emotion. Facial expressions of emotion are central to human communication and represent the physical manifestation of an individual’s internal emotional state. Following e.g., Ekman (1994), it was generally accepted that facial expressions are universally produced and interpreted. However, Jack et al. (2009) recently showed that cultural differences in eye movements also extend to the categorization of emotionally expressive faces. In summary, Jack and colleagues reported that Western adults distributed fixations across the entire face allowing them to extract critical diagnostic information required to facilitate accurate categorical judgments. By contrast, Eastern adults primarily fixated the eye region across all facial expressions – a strategy inadequate to dependably distinguish between certain facial expressions, such as “fear” and “surprise,” for example. These results question the universality of facial expressions, suggesting cultural diversity in the transmission of facial expression signals. The purpose of experiment 2 was to explore whether individual participants displayed “Eastern” or “Western” expression strategies and more pertinently, whether each individual’s strategy was consistent across tasks (i.e., recognition, experiment 1; and expression tasks).
Participants
We contacted the same 20 British Born Chinese participants who took part in experiment 1 to enquire as to whether they would be willing to complete a further experiment. Nine of the 20 British Born Chinese group returned and participated in experiment 2. The final sample comprised six females and three males with an average age of 24.4 years.
Materials
Stimuli consisted of 56 images displaying six Facial Action Coding System (FACS)-coded facial expressions of emotion (“Happy,” “Surprise,” “Fear,” “Disgust,” “Anger,” and “Sadness”) plus “Neutral” (Matsumoto and Ekman, 1988). Gender and race (East Asian and Western Caucasian) of faces was equally distributed across expressions. Images were cropped using Adobe™ Photoshop CS™ and aligned the eye and mouth positions using Psychomorph software. Images (280 × 380 pixels) were viewed on a 800 × 600 pixel white background using a 21′′ Iiyama HM204DTA monitor (refresh rate of 170 Hz) at a distance of 60 cm, and thus subtended 10° (horizontally) × 14° (vertically) of visual angle.
Eye-Tracking
We followed the same procedures as in experiment 1 above.
Procedure
Participants performed a seven-AFC facial expression categorization task using the following categorical labels: “Happy,” “Surprise,” “Fear,” “Disgust,” “Anger,” and “Sadness,” plus “Neutral.” Each participant completed 336 trials (48 trials per expression), divided into six blocks each containing 56 trials. As in experiment 1, we presented images in random locations on the monitor and each image remained visible until participants responded. Participants provided verbal responses to eliminate eye movements toward response keys and were recorded by the experimenter. Prior to testing, we established participants’ familiarity with the categorical labels by asking each participant to provide correct descriptions and synonyms of each emotion.
Data Analyses
As in experiment 1, we analyzed only correct trials. Similar to Jack et al. (2009), the patterns of fixations displayed by individual British Born Chinese participants were consistent across all seven facial expressions. Owing to the lack of variability between fixation maps for individual expressions and our primary interest being the general strategy used by individual participants for classifying expressions, we collapsed the fixation maps from correct trials (88% total trials) across expressions for analysis.
Results
Accuracy
A 2 (Race of faces) × 7 (Expression) repeated measures ANOVA conducted on accuracy revealed a main effect of expression [F(1,6) = 4.227, p < 0.001,  ]. Post hoc Bonferroni -corrected comparisons revealed the following significant differences: Happy vs. Neutral (p < 0.017), Happy vs. Fear (p < 0.006), and Happy vs. Anger (p < 0.022). Inspection of the mean accuracy for individual expressions reveals that these significant differences are due to the near ceiling accuracy shown for Happy, as opposed to a deficit for other expressions.
As shown in Figure 5, behavioral performance for individual expressions suggests that British Born Chinese participants do not share the same deficit for fear and disgust that been previously reported by Jack et al. (2009). Using the data from Jack et al. (2009), a one-way ANOVA conducted on mean categorization accuracy revealed a significant difference between groups of participants [F(2) = 11.282, p < 0.001]. Post hoc Bonferroni corrected comparisons verified that behavioral performance of British Born Chinese participants performed significantly more accurately than East Asian observers [t(62) = 2.232, p < 0.029], and comparably with Western Caucasian observers [t(62) = 1.390, p = 0.169].
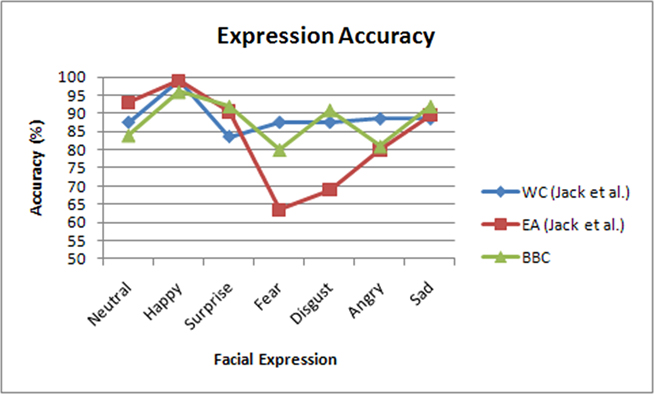
Figure 5. Expression classification accuracy results from British Born Chinese, East Asian and Western Caucasian populations (data for East Asian and Western Caucasian populations taken from Jack et al., 2009).
Eye Movements and Number of Fixations
We conducted a 2 (Race of Face) × 7(Expression) repeated measures ANOVA on the total number of fixations used by observers to correctly categorize each facial expression. Results showed a main effect of Expression only [F(1,6) = 5.442, p < 0.001] with post hoc Bonferroni corrected comparisons revealing significant differences between the following contrasts: Happy (7.81) vs. Anger (11.00), Happy vs. Sad (11.56), and Surprise (6.87) vs. Sad.
Eye Movements: Individual Analysis
Given the findings from experiment 1, we did not perform a group analysis, but instead analyzed each participant’s data separately. Using the data from Jack et al. (2009) as “Eastern” and “Western” templates, we compared each individual British Born Chinese participant’s fixation map (collapsed across expressions) against both templates using the same procedure as described in experiment 1. The materials and methods used by Jack et al. (2009) were identical to the current study again making the templates ideally suited for making this comparison. The classifying procedure revealed that seven out of nine British Born Chinese participants more closely matched the Eastern template (see Table 3 and Figure 6). Then, looking at the consistency of individual participant strategies across the two experiments, we found that the seven participants who completed both experiments displayed consistent “Eastern” or “Western” strategies across tasks. Of these seven participants, six showed “Eastern” strategies in both tasks and one showed a consistent “Western” strategy.
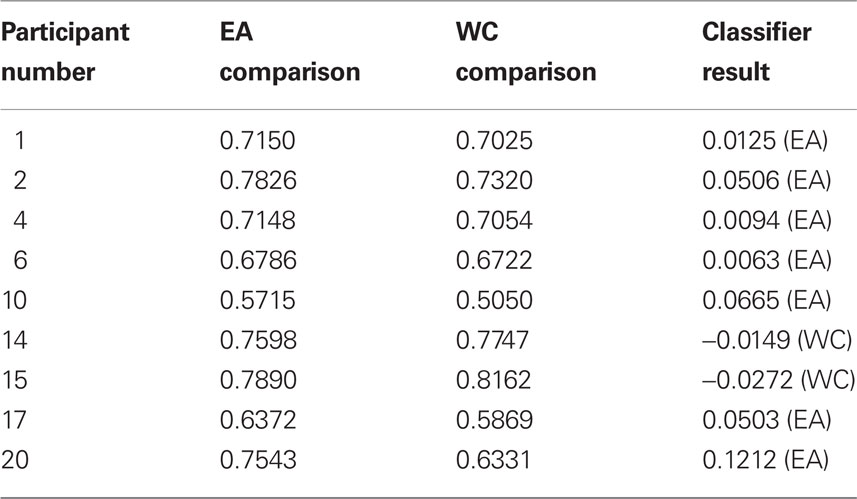
Table 3. Experiment 2: Correlation results from the classification procedure.
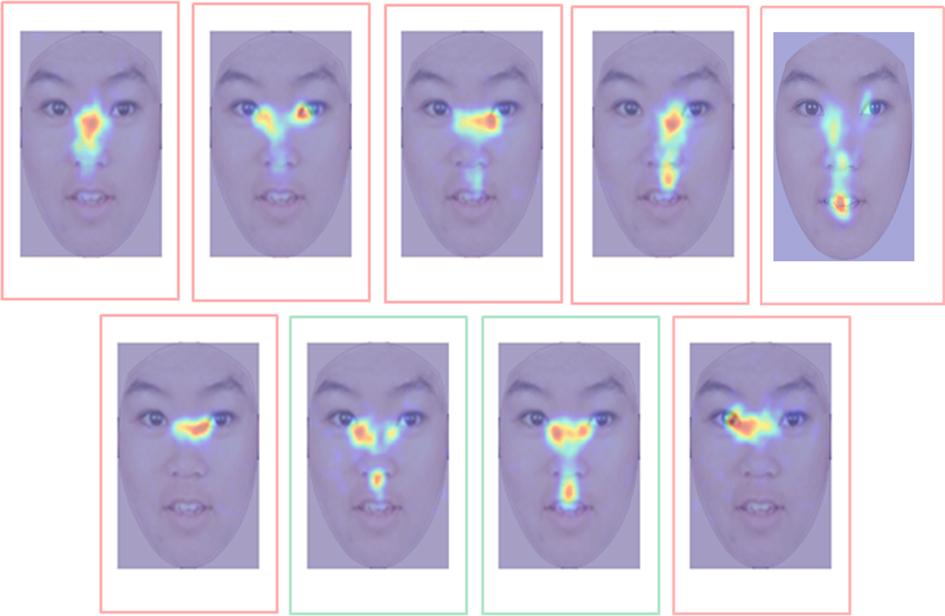
Figure 6. Experiment 2: Individual participant’s expression fixation maps and results from the classification procedure. “Eastern” strategies marked by green boxes. “Western” strategies marked by red boxes.
Discussion
Similar to East Asian adults (Jack et al., 2009), the majority of British Born Chinese participants displayed “Eastern-style” strategies with the majority of fixations clustered around the eye region. Strikingly, despite not directing fixations to the bottom half of the face like Western Caucasian observers, their behavioral performance was not impaired unlike the East Asian participants in Jack et al. In their paper, Jack et al. (2009) provided two explanations for the behavioral deficit displayed by their East Asian participants. First, they showed that the overuse of the eye region prohibits reliable discrimination of certain expressions (e.g., fear vs. surprise), as demonstrated by the use of a model observer built to simulate the performance of the East Asian group. Second, they argued that FACS-coded faces may represent expressions that are based on Western norms and subsequently East Asian participants struggle to accurately classify certain facial expressions, most notably fear and disgust. The results from the current study are not consistent with the first of these explanations as the British Born Chinese participants performed as competently as Western Caucasian adults despite deploying the same strategy as East Asian adults. However, the current results are consistent with their second account. As described above, the British Born Chinese population were born in the UK and have spent their entire lives there. Consequently, they are familiar with the transmission of “Western facial expressions” and might have developed with experience effective representations allowing them to avoid a significant recognition decoding deficit.
Questionnaires
Although the consistency of strategies across tasks within the British Born Chinese group suggests that eye movements displayed in one task might be a good predictor of strategy in a second task, it is evident that the cultural strategy deployed by an individual cannot be simply predicted by the organization of society (i.e., individualist or collectivistic) in which they reside. We then considered the possibility that each individual’s cultural outlook and behavior could be dynamically modulated by their environment. For example, in the case of the British Born Chinese participants, we reasoned that their life at home with their parents was likely to be quite “Eastern,” whereas at school or work the environment will inevitably be more “Western.” In order to formally investigate this hypothesis, we administered an abbreviated version of the -individualism–-collectivism scale (INDCOL) questionnaire (Hui, 1988; see appendices for full copy of the questionnaire).
Participants
The 20 British Born Chinese participants tested in experiment 1 all competed questionnaires. In addition, 10 Western Caucasian adults (5 male, 5 female; mean age = 25.8 years) also competed the questionnaires for comparison with the British Born Chinese participants. The Western Caucasian participants had all spent their entire lives in European nations and were only informed about the eye-tracking experiments after completing the questionnaire.
Materials
The INDCOL questionnaire we administered measures the collectivist vs. individualist tendencies of a person in three different social settings (with parents, friends or others) and a general measure of individualist tendencies. The full version of the INDCOL includes further subscales (spouse, kin, and neighbor) that were not used in our version as they were deemed less relevant. We also administered a further series of questions pertaining to the proficiency of each participant’s Chinese language skills. We asked whether they were able to speak, read, and/or write Chinese and if so, how frequently they did this.
Results
The questionnaire produced a number of significant results. A 2 (culture of participant) × 4 (subscale) ANOVA was conducted on the questionnaire responses, which yielded a significant result of culture × subscale [F(1,3) = 5.181, p < 0.003]. Post hoc t-test revealed significant between-group differences for all three collectivist subscales, but not for individualist scores. Inspection of the t-test results revealed that the British Born Chinese population’s collectivist tendencies were significantly higher than the European adults in the family subscale only [t(9) = 3.724, p < 0.005]. By contrast, the European adults scored higher than the British Born Chinese population in both the friends [t(9) = −2.777, p < 0.02] and others [t(9) = −3.076, p < 0.01] subscales. Differences between the groups measured by the individualist subscale did not reach significance, although it should be noted that the British Born Chinese group scored higher on this subscale than the European adults. We then divided the British Born Chinese participants into two groups based on the results from the eye movement classification procedure. Eye movement scores were correlated with each of the four INDCOL subscales. We found a stronger correlation between British Born Chinese adults with a “Western” eye movement strategy and individualist scores (r = 0.700) than adults with an “Eastern” strategy and (r = 0.213), but this was not significant. We also found a stronger correlation between British Born Chinese adults with an “Eastern” strategy compared with adults with a “Western” strategy and scores on the collectivist “Friends” (r = 0.636 vs. r = 0.036) and “Others” (r = 0.600 vs. 0.231) subscales, but once again these results were not significant.
Finally, we investigated whether Chinese language proficiency in speaking and writing or any other aspect of their everyday lives was correlated with the fixation strategy deployed by the British Born Chinese observers. However, again we failed to identify an explanatory relationship, with Chinese speakers no more likely to display an Eastern strategy than a “Western” strategy (e.g., British Born Chinese participants with very poor Chinese speaking skills and no Chinese writing skills deploying an East Asian fixation pattern). As a final point on the INDCOL questionnaire, it is very important to note that, like most questionnaires, a large sample is typically required in order to generate meaningful results. Thus, it remains possible that we would have produced clearer results with a larger sample.
General Discussion
Contrary to our initial expectations, the eye movement strategies displayed by the British Born Chinese population in experiment 1 closely resembled Eastern Asian’s fixation maps as reported by Blais et al. (2008). Furthermore, the strategies used in experiment 2 closely matched those reported in East Asian adults by Jack et al. (2009). However, inspection of fixation strategies at the individual level revealed that averaging across the population masked within-group variability, which was not observed previously within Western Caucasian or East Asian populations. While the majority of participants used “Eastern” eye movement strategies when completing identity and expression tasks, approximately 25–30% of the British Born Chinese population employed a “Western” strategy. In addition, the type of strategy used by each individual (i.e., “Eastern” or “Western”) was largely consistent across tasks. Despite variability in eye movement patterns, behavioral performance was comparable across individuals in both tasks. It appears that in terms of eye movements, there is more than one way to achieve successful face recognition and expression classification. Although the underlying reasons for such diversity are not fully apparent, when the results from the current study are considered collectively with previous findings, a clearer picture is beginning to emerge.
As described in the introduction, an ever growing body of literature is revealing profound differences in the way people from Eastern and Western cultures reason and process information in their visual world (Nisbett and Miyatomo, 2005). At the center of this literature is the notion that culture itself plays a pivotal role in shaping the minds of the individuals it encompasses. Nonetheless, the suggestion that differing societal organization shape could play a role in shaping eye movements and cognitive processing is still provocative. Yet, the similarities between the observations made in the perceptual literature and those that we have reported here are difficult to dismiss out of hand. Furthermore, evidence for culturally modulated cortical activation as measured by fMRI is gradually building, with differences in active brain regions found for object processing (Gutchess et al., 2006) arithmetic processing (Tang et al., 2006), self-representation (Zhu et al., 2007), emotion processing (Chiao et al., 2008) and perceptual judgments (Hedden et al., 2008). Moreover, a recent study has provided evidence that the same gene can produce different behavioral outcomes as a function of cultural modulation. Kim et al. (2010) studied the serotonin (5-HT) system in Korean and European American adults, as it is known to be associated with attentional focus and cognitive flexibility. In particular, they explored the role of the C(-1019)G 5-HTR1A gene, which inhibits 5-HT release. The G allele of 5-HTR1A is associated with reduced cognitive flexibility whereas the C allele is not. The authors predicted that individuals (of both cultural groups) homozygous with the G allele would have a reduced ability to adapt cognitively and would therefore display their cultural mode of reasoning more robustly relative to those homozygous with the C allele. The mode of participant’s reasoning was measured by the Analysis-Holism scale (Choi et al., 2007) and genotyping assessed from saliva or cheek swabs. The author’s predictions were fully supported, with both Koreans and European Americans homozygous for the G allele showing strong tendencies for their culture’s mode of thought (i.e., Holistic for Korean and Analytical for Americans). By contrast, participants homozygous for the C allele did lean toward their cultural mode of thinking, but not to the same extent as the G allele group. This demonstration of a gene by culture interaction reveals social forces can shape the phenotypic expression (at least of some genes), which ultimately led to different cognitive processing styles.
Our data also suggest that cultural perceptual differences might be shaped by the early ontogenetic and social experience. It has been shown that Western and Eastern mothers are different in the way they interact with their children while playing (Bornstein et al., 1990; Fernald and Morikawa, 1993). Western mothers tend to label toys (e.g., “look at the rabbit”) and focus the attention of their children toward attributes (e.g., the rabbit is white, has long ears etc.), whereas Eastern mothers emphasize the relationship of objects within a context (e.g., the rabbit eats carrots, jumps on the grass, etc.) and rely more on verbs than nouns (Tardif et al., 1997, 1999). From the interviews we performed after the experiments, it is apparent that the British Born Chinese population we have tested was not confronted with a Western culture before attending compulsory school classes. This observation supports the view that very early life experiences are a critical factor in forging cultural perceptual biases.
An auxiliary finding from experiment 1 is that the British Born Chinese population did not display any evidence of the “other-race effect” (ORE). The ORE is a well documented phenomenon whereby people are typically more accurate at recognizing faces from their own-race relative to faces from other-races (see Hancock and Rhodes, 2008 for a review). The ORE is considered to be a highly robust effect, although it is typically stronger in Caucasian relative to East Asian populations (Meissner and Brigham, 2001). The results from our study support the commonly help belief that the ORE arises from a lack of experience or exposure to other-race faces; this is known as the “contact hypothesis” (Brigham and Malpass, 1985). Although support for the contact hypothesis has been mixed (see Meissner and Brigham, 2001 for a review), there is general consensus that experience with other-race faces facilitates accurate individuation. The British Born Chinese population has been heavily exposed to both Chinese and Caucasian individuals and confronted with the recognition of faces of both races at the individual level on a day-to-day basis. Therefore, their equal proficiency for face recognition with both categories of faces is not surprising.
As described above, previous studies have reported that “Westernized” Asians, who are akin to the British Born Chinese population, do not display a clear analytical or holistic processing style, but instead fall in between these two strategies (Norenzayan et al., 2002). Furthermore, this population is capable of accessing different processing styles that can be elicited by environmental cues or primes (Hong et al., 2000). The initial group analysis conducted in the current study revealed a similar ambiguous pattern of results, similar to those of Norenzayan et al. (2002), but individual participant analysis showed that in fact two distinct strategies existed within the population. This raises the possibility that when previous studies have only reported group effects for Asian American participants and found a “middle-ground” processing style; they may have inadvertently amalgamated two distinct strategies. Although this is not certain, the results from the current study invite caution when working with different cultural groups and highlight the importance of individual participant analysis, especially when working with particular populations, such as the British Born Chinese. A second possibility is that the British Born Chinese population can also access different processing strategies and could have been inadvertently primed to behave in a certain way. Although this is speculative, given the results of Hong et al. (2000), the role of priming should be considered more fully in future studies.
It is critical to understand the relationship between eye movements and the underlying cognitive processes involved in identity and expression recognition. More importantly, the variance in eye movements reported in the current and previous studies coupled with near identical behavioral performance between- and within-populations demonstrates that there is more than one way to extract the required diagnostic facial information without detrimentally impacting upon accuracy. Numerous authors have reported that unlike objects, faces are processed holistically (e.g., Young et al., 1987; Tanaka and Farah, 1993; Hole, 1994; Le Grand et al., 2004). In other words, rather than processing facial features independently, the face is perceived and processed as a whole unit or Gestalt. However, it has also been argued that other-race faces may be processed more analytically (i.e., by attending to individual features; Tanaka and Farah, 1993). It is critical to note that the eye movements we report are consistent with the general differences in processing strategies as defined in the cultural literature, but they do not inform us about with holistic or featural face processing. However, a related study has shown that the divergent cultural eye movement strategies seen for human faces also extend to sheep faces and greebles, suggesting that there is no straightforward relationship between eye movements and the underlying cognitive processes involved in human face processing (Kelly et al., 2010).
Conclusion
Thought, behavior, eye movement, and cognitive processes can be shaped by cultural forces. Future work will need to focus on how culture exerts its influence across ontogeny, but evidence from developmental studies and populations such as adoptees will bring us close to understanding this intriguing interaction.
Conflict of Interest Statement
The authors declare that the research was conducted in the absence of any commercial or financial relationships that could be construed as a potential conflict of interest.
Acknowledgments
David J. Kelly was supported by The Economic and Social Research Council (RES-000-22-3338); Sébastien Miellet was supported by The Economic and Social Research Council and Medical Research Council (ESRC/RES-060-25-0010); Roberto Caldara by both funding bodies.
References
Bang, S., Kim, D., and Choi, S. (2001). Asian Face Image Database PF01. Intelligent Multimedia Lab, Pohang University of Science and Technology. Available at: http://nova.postech.ac.kr/
Blais, C., Jack, R. E., Scheepers, C., Fiset, D., and Caldara, R. (2008). Culture shapes how we look at faces. PLoS ONE 3, e3022. doi: 10.1371/journal.pone.0003022
Bornstein, M. H., Toda, S., Azuma, A., Tamis-LeMonda, C., and Ogino, M. (1990). Mother and infant activity and interaction in Japan and in the United States II: a comparative microanalysis of naturalistic exchanges focused on the organization of infant attention. Int. J. Behav. Dev. 13, 289–308.
Bray, F. (1984). “Agriculture,” in Science and Civilization in China, Vol. 6, Part 2, ed. J. Needham (Cambridge: Cambridge University Press), 507–508.
Brigham, J. C., and Malpass, R. S. (1985). The role of experience and contact in the recognition of faces of own- and other-race persons. J. Soc. Issues 41, 415–424.
Caldara, R., and Miellet, S. (2011). iMap: a novel method for statistical fixation mapping of eye movement data. Behav. Res. Methods, doi: 10.3758/s13428-011-0092-x
Caldara, R., Zhou, X., and Miellet, S. (2010). Putting culture under the ‘spotlight’ reveals universal information use for face recognition. PLoS ONE 5, e9708. doi: 10.1371/journal.pone.0009708
Chauvin, A., Worsley, K. J., Schyns, P. G., Arguin, M., and Gosselin, F. (2005). Accurate statistical tests for smooth classification images. J. Vis. 5, 659–667.
Chiao, J. Y., Iidaka, T., Gordon, H. L., Nogawa, J., Bar, M., Aminoff, E., Sadato, N., and Ambady, N. (2008). Cultural specificity in amygdala response to fear faces. J. Cogn. Neurosci. 20, 2167–2174.
Choi, I., Koo, M., and Choi, J. A. (2007). Individual differences in analytic versus holistic thinking. Pers. Soc. Psychol. Bull. 33, 691–705.
Chung, M. K., Kim, D. M., Kelley, D. J., Robbins, S., Evans, A. C., and Davidson, R. J. (2005). Partial Correlation Mapping of Anatomical and Behavioral Measures and its Application to Autism. Madison: University of Wisconsin-Madison.
Cohen, D., and Gunz, A. (2002). As seen by the other…: Perspectives on the self in the memories and emotional perceptions of Easterners and Westerners. Psychol. Sci. 13, 55–59.
Cornelissen, F. W., Peters, E. M., and Palmer, J. (2002). The Eyelink toolbox: eye tracking with MATLAB and the psychophysics toolbox. Behav. Res. Meth. Instrum. Comput. 34, 613–617.
Dahl, C. D., Wallraven, C., Bülthoff, H. H., and Logothetis, N. K. (2009). Humans and macaques employ similar face-processing strategies. Curr. Biol. 19, 509–513.
Davies, G., Ellis, H., and Shepherd, J. (1977). Cue saliency in faces as assessed by the ‘Photofit’ technique. Perception 6, 263–269.
Ekman, P. (1994). Strong evidence for universals in facial expressions: a reply to Russell’s mistaken critique. Psychol. Bull. 115, 268–287.
Fernald, A., and Morikawa, H. (1993). Common themes and cultural variations in Japanese and American mothers’ speech to infants. Child Dev. 64, 637–656.
Ghazanfar, A. A., Nielsen, K., and Logothetis, N. K. (2006). Eye movements of monkey observers viewing vocalizing conspecifics. Cognition 101, 515–529.
Gosselin, F., and Schyns, P. G. (2001). Bubbles: a technique to reveal the use of information in recognition tasks. Cognition 41, 2261–2271.
Groner, R., Walder, F., and Groner, M. (1984). “Looking at faces: local and global aspects of scanpaths,” in Theoretical and Applied Aspects of Eye Movements Research, eds A. G. Gale and F. Johnson (Amsterdam: Elsevier), 523–533.
Gutchess, A. H., Welsh, R. C., Boduroglu, A., and Park, D. C. (2006). Cultural differences in neural function associated with object processing. Cogn. Affect. Behav. Neurosci. 6, 102–109.
Hancock, K., and Rhodes, G. (2008). Contact, inversion and the other-race effect in face recognition. Br. J. Psychol. 99, 45–56.
Hedden, T., Ketay, S., Aron, A., Markus, H. R., and Gabrieli, J. D. E. (2008). Cultural influences on neural substrates of attentional control. Psychol. Sci. 19, 12–17.
Henderson, J. M., Williams, C. C., and Falk, R. J. (2005). Eye movements are functional during face learning. Mem. Cognit. 33, 98–106.
Hong, Y.-Y., and Mallorie, L. M. (2003). A dynamic constructivist approach to culture: lessons learned from personality psychology. J. Res. Pers. 38, 59–67.
Hong, Y.-Y., Morris, M. W., Chiu, C.-Y., and Benet-Martinez, V. (2000). Multicultural minds: a dynamic constructivist approach to culture and cognition. Am. Psychol. 55, 709–720.
Jack, R. E., Blais, C., Scheepers, C., Schyns, P. G., and Caldara, R. (2009). Cultural confusions show facial expressions are mot universal. Curr. Biol. 19, 1543–1548.
Janik, S. W., Wellens, A. R., Goldberg, M. L., and Dell’Osso, L. F. (1978). Eyes as the center of focus in the visual examination of human faces. Percept. Mot. Skills 47, 857–858.
Kelly, D. J., Miellet, S., and Caldara, R. (2010). Culture shapes eye movements for visually homogeneous objects. Front. Percept. Sci. 1. doi: 10.3389/fpsyg.2010.00006
Kim, H. S., Sherman, D. K., Taylor, S. E., Sasaki, J. Y., Chu, T. Q., Ryu, C., Eunkook, M. S., and Xu, J. (2010). Culture, serotonin receptor polymorphism (5-HTR1A) and locus of attention. Soc. Cogn. Affect. Neurosci. 5, 212–218.
Le Grand, R., Mondloch, C. J., Maurer, D., and Brent, H. P. (2004). Impairment in holistic face processing following early visual deprivation. Psychol. Sci. 15, 762–769.
Lundqvist, D., Flykt, A., and Öhman, A. (1998). The Karolinska Directed Emotional Faces. Stockholm, Sweden: K. Institute.
Matsumoto, D., and Ekman, P. (1988). Japanese and Caucasian facial expressions of emotion [Slides]. San Francisco, CA: San Francisco State University.
Meissner, C. A., and Brigham, J. C. (2001). Thirty years of investigating the -own-race bias memory for faces: a meta-analytic review. Psychol. Publ. Pol. Law 7, 3–35.
Montgomery, D. R. (2007). Dirt: The Erosion of Civilizations. Los Angeles: University of California Press.
Nisbett, R. E., and Masuda, T. (2003). Culture and point of view. Proc. Natl. Acad. Sci. U.S.A. 100, 11163–11175.
Nisbett, R. E., and Miyatomo, Y. (2005). The influence of culture: holistic versus analytic perception. Trends Cogn. Sci. 9, 467–473.
Norenzayan, A., Smith, E. E., Kim, B. J., and Nisbett, R. E. (2002). Cultural preferences for formal versus intuitive reasoning. Cogn. Sci. 26, 653–684.
Oyserman, D., and Lee, S. W. S. (2008). Does culture influence what and how we think? Effects of priming individualism and collectivism. Psychol. Bull. 134, 311–342.
Reisberg, D., McLean, J., and Goldfield, A. (1987). “Easy to hear but hard to understand: a lip-reading advantage with intact auditory stimuli,” in Hearing by Eye: The Psychology of Lip-Reading, eds R. Campbell and B. Dodd (Hillsdale, NJ: Erlbaum Associates), 97–114.
Rowley, H. A., Baluja, S., and Kanade, T. (1998). Rotation invariant neural network-based face detection. Comput. Vis. Pattern Recogn. 963, 38–44.
Tanaka, J. W., and Farah, M. J. (1993). Parts and wholes in face recognition. Q. J. Exp. Psychol. 46, 225–245.
Tang, Y., Zhang, W., Chen, K., Feng, S., Ji, Y., Shen, J., Reiman, E. M., and Liu, Y. (2006). Arithmetic processing in the brain is shaped by cultures. Proc. Natl. Acad. Sci. U.S.A. 103, 10775–10780.
Tardif, T., Gelman, S. A., and Xu, F. (1999). Putting the ‘noun bias’ in context: a comparison of English and Mandarin. Child Dev. 70, 620–635.
Tardif, T., Shatz, M., and Naigles, L. (1997). Caregiver speech and children’s use of nouns versus verbs: a comparison of English, Italian, and Mandarin. J. Child Lang. 24, 535–565.
Viola, P. A., and Jones, M. J. (2004). Robust real-time face detection. Int. J. Comput. Vis. 57, 137–154.
Young, A. W., Hellaway, D., and Hay, D. (1987). Configural information in face perception. Perception 16, 747–759.
Keywords: culture, eye movements, face processing, individual differences
Citation: Kelly DJ, Jack RE, Miellet S, De Luca E, Foreman K and Caldara R (2011) Social experience does not abolish cultural diversity in eye movements. Front. Psychology 2:95. doi: 10.3389/fpsyg.2011.00095
Received: 21 September 2010; Accepted: 29 April 2011;
Published online: 18 May 2011.
Edited by:
Mutsumi Imai, Keio University, JapanCopyright: © 2011 Kelly, Jack, Miellet, De Luca, Foreman and Caldara. This is an open-access article subject to a non-exclusive license between the authors and Frontiers Media SA, which permits use, distribution and reproduction in other forums, provided the original authors and source are credited and other Frontiers conditions are complied with.
*Correspondence: David J. Kelly, Royal Holloway, University of London, Egham Hill, Egham, Surrey TW20 0EX, UK. e-mail:ZGF2aWQua2VsbHlAcmh1bC5hYy51aw==; Roberto Caldara, Department of Psychology, University of Fribourg, Fribourg, Switzerland.e-mail:cm9iZXJ0by5jYWxkYXJhQHVuaWZyLmNo