 Irene Eunyoung Lee
 Charles-Francois V. Latchoumane
 Jaeseung Jeong
- 1Communicative Interaction Lab, Graduate School of Culture Technology, Korea Advanced Institute of Science and Technology, Daejeon, South Korea
- 2Beat Connectome Lab, Sonic Arts & Culture, Yongin, South Korea
- 3Center for Cognition and Sociality, Institute for Basic Science, Daejeon, South Korea
- 4Department of Bio and Brain Engineering, Korea Advanced Institute of Science and Technology, Daejeon, South Korea
Emotional visual music is a promising tool for the study of aesthetic perception in human psychology; however, the production of such stimuli and the mechanisms of auditory-visual emotion perception remain poorly understood. In Experiment 1, we suggested a literature-based, directive approach to emotional visual music design, and inspected the emotional meanings thereof using the self-rated psychometric and electroencephalographic (EEG) responses of the viewers. A two-dimensional (2D) approach to the assessment of emotion (the valence-arousal plane) with frontal alpha power asymmetry EEG (as a proposed index of valence) validated our visual music as an emotional stimulus. In Experiment 2, we used our synthetic stimuli to investigate possible underlying mechanisms of affective evaluation mechanisms in relation to audio and visual integration conditions between modalities (namely congruent, complementation, or incongruent combinations). In this experiment, we found that, when arousal information between auditory and visual modalities was contradictory [for example, active (+) on the audio channel but passive (−) on the video channel], the perceived emotion of cross-modal perception (visual music) followed the channel conveying the stronger arousal. Moreover, we found that an enhancement effect (heightened and compacted in subjects' emotional responses) in the aesthetic perception of visual music might occur when the two channels contained contradictory arousal information and positive congruency in valence and texture/control. To the best of our knowledge, this work is the first to propose a literature-based directive production of emotional visual music prototypes and the validations thereof for the study of cross-modally evoked aesthetic experiences in human subjects.
Introduction
Previous psychological studies have revealed that movies are effective emotion inducers (Gross and Levenson, 1995; Rottenberg et al., 2007), and several studies have used films as emotional stimuli to investigate the biological substrates of affective styles (Wheeler et al., 1993; Krause et al., 2000). In addition, modern neuroimaging and neurophysiological techniques commonly use representational pictures (such as attractive foods, smiling faces, landscapes, and so on) from the International Affective Picture System (IAPS) as visual sources, and excerpts of classical music as auditory sources (Baumgartner et al., 2006a,b, 2007). Several studies have examined the combined influence of pictures and music but, to our knowledge, researchers have not used specifically composed, emotion-targeting cross-media content to elicit human emotion. It has been proposed that composing syncretistic artwork involves more complex types of practice by exploiting the added values, specific audio-visual responses that arise due to the synthesis of sounds and images, that occur as the result of naturally explicit A/V cues (Chion, 1994; Grierson, 2005). Hence, the practice of visual music, which composes abstract animations that simulate the aesthetic purity of music (Brougher et al., 2005), is naturally intermedia and has a synergy with modern digital auditory-visual (A/V) media. Thus, the affective value of visual music can embody important interactions between perceptual and cognitive aspects of the dual channels. Therefore, using abstract visual music to study emotion remains a promising but uninvestigated tool in human psychology.
To understand the underlying mechanisms of the audio-visual aesthetic experience, we focused on the assessment of intrinsic structural and contextual aspects of stimuli, and the perceived aesthetic evaluations to formalize the process whereby visual music can suggest target emotions. Although we consider it premature to discuss the mechanism of the entire aesthetic experience within our study, we proposed a model of Continuous Auditory-Visual Modulation Integration Perception (Figure 1) to aid in the explanation of our research question. Our model is derived from the Information Integration Theory (Anderson, 1981), the Functional Measurement Diagram (Somsaman, 2004), and the Information-Processing Model of Aesthetic Experience (Leder et al., 2004), and describes how A/V integration might affect the overall aesthetic experience of visual music (Figure 1). Briefly explaining the three theories, the essential hypothesis of information integration theory requires three functions when a task involves certain responses from multiple stimuli: valuation (represented psychological values of multiple stimuli), integration (being combined into single psychological values), and response (being converted into an observable response) functions. The functional measurement diagram describes the perception of emotions in multimedia in the context of audio and visual information in relation to the information integration theory. And, the information-processing model of aesthetic experience describes how aesthetic experiences are involved with cognitive and affective processing and the formation of aesthetic judgments in a number of stages.
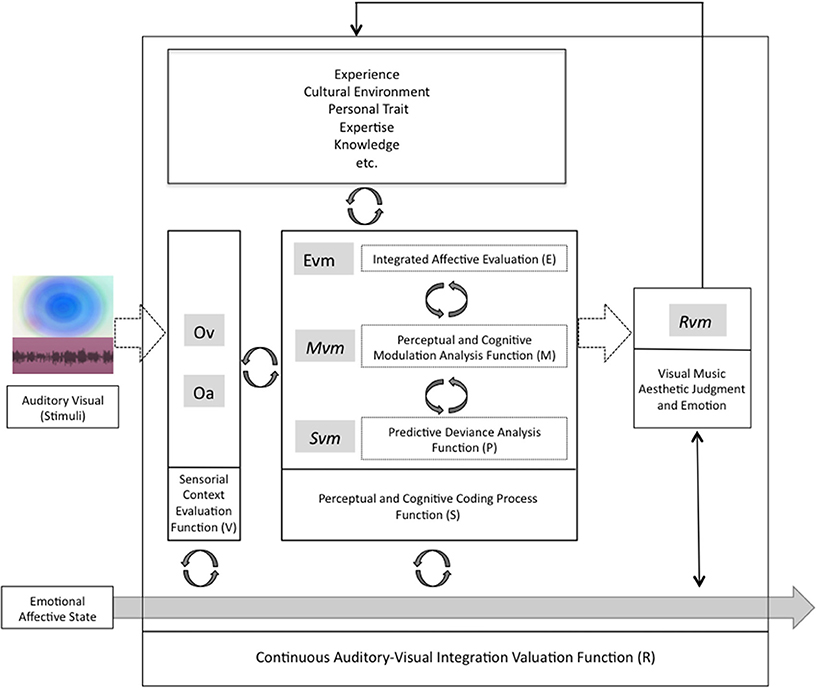
Figure 1. A model of continuous auditory-visual modulation integration perception. The diagram begins with the auditory-visual stimuli that are presented to the individual organisms and processed by evaluation functions (V) into their psychological values of (Ov) and (Oa). These psychological stimuli combine with continuous internal integration functions (S) through the modulation values (Mvm) and predictive deviation values (Pvm) into tentative implicit synthesizing responses (Evm). And the multisensory aesthetic evaluation function (R) transports them to elicit the immanent, holistic aesthetic emotion of the visual music (Rvm).
To investigate the perception of emotion via visual music stimuli, we started by examining the association of information-integration conditions (conformance, complementation, and contest) between two modalities (audio and video) and aesthetic perception (for details about integration conditions, see Cook, 1998, p. 98–106; Somsaman, 2004, p. 42–43). It is known that music/sound alters the meaning of particular aspects of a movie/visual stimulus (Marshall and Cohen, 1988; Repp and Penel, 2002), and that the ability of music to focus attention on a visual object stems from structural and semantic congruencies (Boltz et al., 1991; Bolivar et al., 1994). As researchers have recently emphasized that the semantic congruency between pairs of auditory and visual stimuli to enhance behavioral performance (Laurienti et al., 2004; Taylor et al., 2006), we hypothesized that the enhancement effect of visual music, by way of added value, might rely on the congruency of emotional information between unimodal channels (such as comparable valence and arousal information between auditory and visual channels). Therefore, our null hypothesis anticipates to see an enhancement effect of behavioral responses on the perception of emotion in the conformance combination condition of visual music due to the added value from the congruent emotional information provided by cross-modality. Accordingly, such a hypothesis might provide an indication of possible cases in which added values result in an enhancement effect via a cross-modal modulation evaluation process of the dual unimodal channel interplays as a functional-information-integration apparatus.
Our aim in this study, as a principled research paradigm, is a careful investigation of the aesthetic experience of auditory-visual stimuli in relation to the dual-channel combination conditions and the enhancement effect approaches from auditory-visual integrations by using emotional visual music prototypes. To examine our hypothesis, we conducted two different experiments, namely:
(1) The creation of emotional visual music stimuli and the assessment of perceived emotional meanings of the stimuli according to modalities, and
(2) The investigation of our hypothesis regarding the enhancement effect in relation to the integration conditions.
For Experiment 1, we first designed three positive emotional visual music stimuli by producing audio and video content in accordance with literature-based formal property directions to evoke target-emotions. We then presented our compositions as unimodal (audio only or visual only) or cross-modal (visual music) stimuli to subject groups and surveyed psychometric affective responses (self-rating of emotion), from which three indices were derived (evaluation, activity, and potency, which are equivalent to valence, arousal, and texture/control, respectively). In this experiment, we focused on a two-dimensional (2D) representation (valence and arousal) to validate the affective meaning of our visual music in accordance with the circumplex model of affect (Posner et al., 2005). Finally, we examined electroencephalography (EEG) responses as physiological internal representations of valence (in other words, as represented by frontal alpha asymmetry) to the representation of visual music as a partial emotional validation of visual music. In our main experiment (Experiment 2), we investigated the auditory-visual aesthetic experience, with a particular focus on added-value effects that result in affective enhancement as a functional-information-integration apparatus. To investigate this, we included two additional visual music compositions (negative in valence) created by a solo media artist to our visual music stimuli. We separated the unimodal stimuli from the five original visual music stimuli into independent audio-only and visual-only channel information (named A1–A5 and V1–V5, respectively), and assessed the affective emotion thereof via our subjects' self-ratings (as in Experiment 1). Finally, we cross-matched the unimodal information of altered visual music, forming three combination conditions (conformance, complementation, and contest) of multimedia combinations (Figure S1), and compared the aesthetic affective responses of viewers (self-rated) to investigate our enhancement effect hypothesis using the nine visual music stimuli (five original visual music stimuli and four altered visual music stimuli).
Experiment 1: Emotional Visual Music Design and Validation
In this experiment, we explained the scheme for the construction of each modality of the three visual music stimuli, and we assessed the subjects' perceptions of our target emotion via a 2D representation (valence vs. arousal using indices constructed from the self-ratings). We also assessed the electrophysiological response of the participants relative to valence perception (positive vs. negative) and EEG frontal alpha asymmetry to validate perceived and potential emotion elicitation. The aim of this first experiment was to validate the construction paradigm and the emotion-targeting properties of our abstract visual music movies.
Methods
Participants
For the preliminary experiment, we recruited 16 people from the Graduate School of Culture Technology (GSCT) in the Korean Advanced Institute of Science and Technology (KAIST) and from Chungnam University, Daejeon, South Korea. Advertisements to recruit aesthetic questionnaire participants for two different groups were posted on the bulletin boards to collect native Korean-language speakers with no special training or expertise in the visual arts or in music (people who could not play any musical instruments or who only played instruments as a hobby and had < 3 years' of lessons). The two groups were the unimodal behavioral survey group and the cross-modal survey with EEG recording group. The unimodal survey group subjects [mean age = 26.12, sex (m:f) = 4:4, minimum age = 24, maximum age = 29] attended individual survey sessions at an allocated time. Each subject attended the experimental session for about 20 min, and had the option to enter a draw to win an on-line shopping voucher worth $20 in return for their participation. All participants completed a questionnaire detailing their college major, age, gender, and musical or visual background. The participants had various kinds of degrees, such as broadcasting, computational engineering, bio-neuro science, and business management, while no subject was a musician or an art major. The cross-modal survey group subjects [mean age = 22.5, sex (m:f) = 4:4, minimum age = 20, maximum age = 26] attended the experimental session in the morning and spent about 60 min including preparation, recording the EEG and the behavioral survey session, and after experiment debriefing. The subjects were given $30 per hour as compensation. All participants were certified as not suffering from any mental disorder, not having a history of drug abuse of any sort, and provided a signed consent form after receiving an explanation about the purpose of and procedure for the experiment. In our cross-modal group, no subject was a music or an art major. The study was approved by the Institutional Review Board of KAIST.
Stimuli Composition
The notion of the existence of some universal criteria for beauty (Etcoff, 2011), together with the consideration of formalist (aesthetic experience relies on the intrinsic sensual/perceptual beauty of art) and contextual (aesthetic experience depends on the intention/concept of the artist and the circumstances of display) theories (for reviews, see Shimamura, 2012; Redies, 2015) makes it possible to create the intrinsic positive valence of auditory-visual stimuli based on an automatic evaluation of esthetic qualities. Hence, we constructed abstract animations synchronized with music that could convey jointly equivalent positive emotional connotations to assess positive emotion-inducing visual music. In comparison to existing visual music, the new stimuli with a directive design could be advantageous for conducting emotion-inducing empirical research because they allow for the inspection of structural and contextual components, and provide information about production to a certain extent. They can also balance production quality differences among stimuli more easily than when using existing artworks. Furthermore, they remove the familiarity effect that seems to be a critical factor in the listener's emotional engagement with music (Pereira et al., 2011).
To conceptualize the target emotion and to discriminate among the perceived affective responses to the stimuli, we took a dimensional approach, which identifies emotions based on the placement on a small number of dimensions and allows a dimensional structure to be derived from the response data (for a review of the prominent approaches to conceptualizing emotion, see Sloboda and Juslin, 2001, p. 76–81). We chose and characterized three “positive target-emotions” (happy, relaxed, and vigorous) that can be distinctly differentiated from each other when placed on a 2D plane similar to the circumplex model (Posner et al., 2005). Please see Figure S2.
i) Happy: high-positive valence and neutral-active arousal.
ii) Relaxed: mid-positive valence and mid-passive arousal.
iii) Vigorous: neutral-positive valence and high-active arousal.
We then focused on previously published empirical studies that examined the iconic relationships between the separate structural properties of visual stimuli and emotion (Takahashi, 1995; Somsaman, 2004) and auditory stimuli and emotion (Gabrielsson and Lindstrom, 2001; Sloboda and Juslin, 2001) to customize our directive production guidelines for our team of creative artists. By considering constructivist theory (Mandler, 1975, 1984), we assembled important structural components that matched the targeted emotional expressions via a broad but non-exhaustive review of previous research on the correlation of emotional elicitation in auditory (Table 1) and visual (Table 2) cues. Based on the idea that not only the formal properties of stimuli but also the intention of the artist and the circumstances can affect aesthetic experience to a large extent (see Redies, 2015), we further briefed our creative artists about the use of stimuli in the experiment. The creative artists cooperated fully to create visual music content conveying targeted emotions to the viewers by complying with the directive guidelines to output them as positive affection-inducing stimuli.
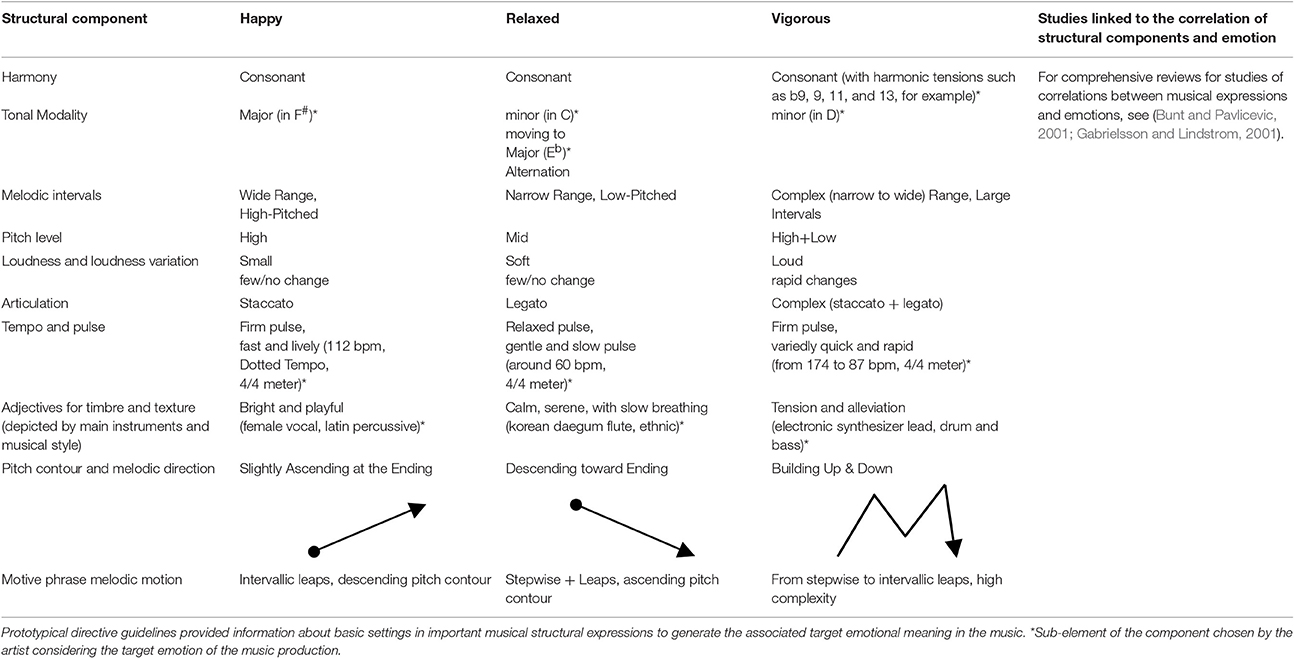
Table 1. Summary of musical design structural guidelines selected from reviewed studies and artists' decisions.
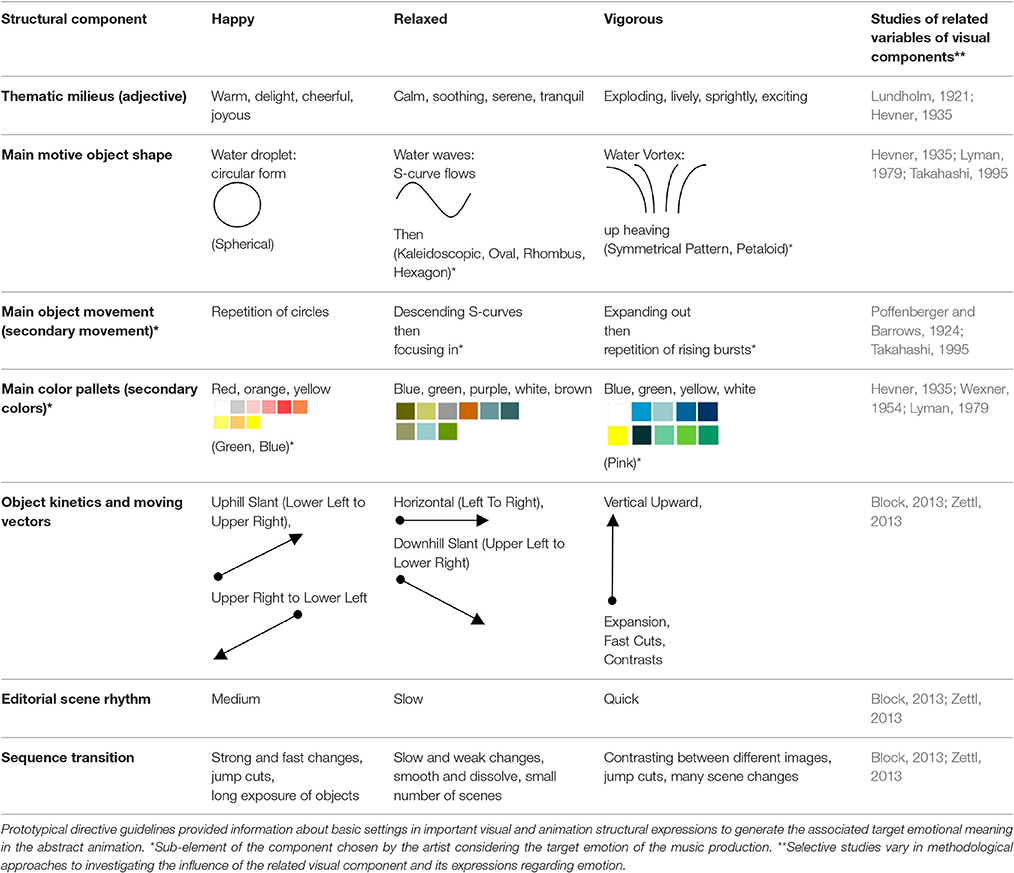
Table 2. Summary of visual design structural guidelines selected from reviewed studies and artists' decisions.
Audio-only stimuli production
Three 60-s, non-lyrical (containing no semantic words), and consonant music pieces were created by a music producer based on the directive design guidelines (Table 1). Basic literature-based information for musical structure properties, such as harmony, modality, melody, metrical articulation, intensity, rhythm, instrument, and tempo, were suggested (for reviews, see Bunt and Pavlicevic, 2001; Gabrielsson and Lindstrom, 2001). However, the artist appointed to create emotion-inducing music noted particular details regarding the decisions. For example, the research team suggested modality directions based on reviewed studies (such as “Major” for “happy”), and the artist chose the tonic center of the key (F#), which can be a basic sub-element of the modality. All the music was created in a digital audio workstation that was equipped with hardware sound modules, such as a Kurzweil K2000, Roland JV-2080, and Korg TR-Rack, and music recording/sequencing programs, such as Digidesign's Pro Tools, Motu's Digital Performer, and Propellerhead's Reason, as well as other audio digital signal processing (DSP) plug-ins, such as Waves Gold Bundle. The final outputs were exported as digitized sound files (44.1 k sampling rate, 16-bit stereo).
Video-only stimuli production
Three colored, full-motion, and abstract animations that included forms (shapes), movement directions, rhythm, colors, thematic milieus, scene-changing velocities, and animation characteristic directions were created based on the guidelines (Table 2). The collaborative team consisted of two visual artists, one of whom designed the image layout and illustration with shapes and colors, while the other created the animated motion graphics for it. As with the audio stimuli, we suggested directive guidelines for the overall important structural factors to the artists, and they noted detailed sub-elements. To create the animations, the artists used a digital workstation equipped with Adobe Photoshop, Premier, Max/MSP with Jitter, After Effects, and a Sony DCR-HC1000. The final visual stimuli consisted of QuickTime movie (.mov) files that were encoded using Sorenson Video 3 (400 × 300, NTSC, 29.97 non-drop fps).
Visual music integration
For each visual music integration, the motion graphic artist arranged the synchronization of visual animations to its comparable music (for example, happy visual animation synchronized to happy music) while taking the directive motion guidelines (Table 2) into account. In other words, the movements of the visual animation components, sequence changes, kinetics, and scene-change speed evolved over time in accordance with the directive guidelines while incorporating a good accompaniment to the compatible formal and contextual changes in the music (such as accents in rhythms, climax/high points, the start of a new section, and so on). An illustrative overview of the three visual music stimuli is provided in Figure 2, and the content is available online at https://vimeo.com/user32830202.
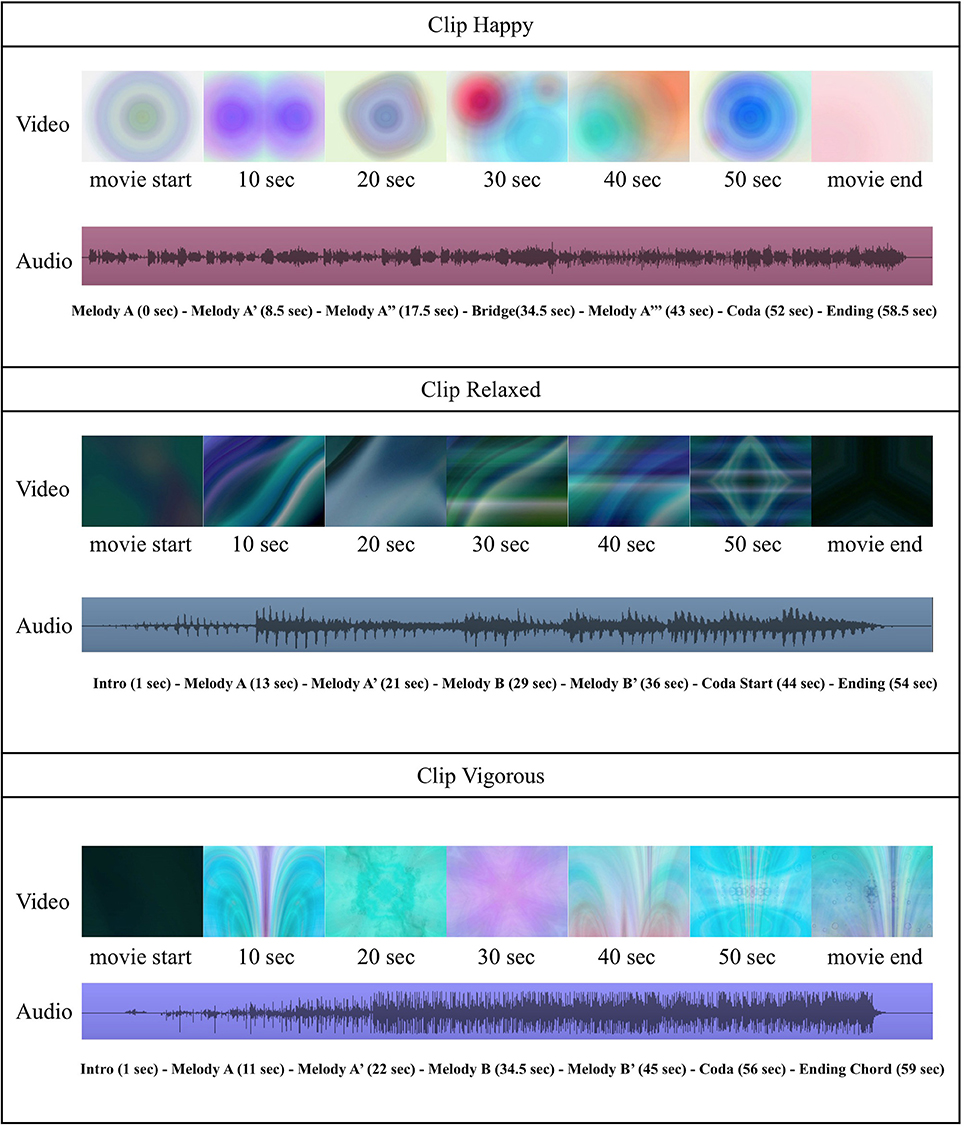
Figure 2. Snapshot information about the visual channel, the auditory channel, and structural variations in the temporal streams of our three positive emotion visual music stimuli.
Procedure
Prior to each experiment, regardless of the modalities, all participants were fully informed that they were participating in a survey for a study investigating aesthetic perception for a scientific research project in both written and verbal forms. We distributed a survey kit, which included information about the purpose of the survey, questions to be answered by the participants regarding demographic information, major subjects, and music/art educational backgrounds (if they played any instruments, how long they had experienced musical/visual art training), and an affective questionnaire form for each presentation. Our affective questionnaire consisted of 13 pairs of scales that were generated by referencing a previous study (Brauchli et al., 1995) that used nine-point scale ratings for bipolar sensorial adjectives to categorize the emotional meanings of the perceived temporal affective stimuli (Figure S3). We also explained verbally to our participants how to respond to the emotion-rating tasks on the bipolar scales. The consent of all subjects was obtained before taking part in the study, and the data were analyzed anonymously. All our survey studies, irrespective of modal conditions, were exempt from the provisions of the Common Rule because any disclosure of identifiable information outside of the research setting would not place the subjects at risk of criminal or civil liability or be damaging to the subjects' financial standing, employability, or reputation.
Unimodal presentation
For the unimodal group, we conducted 20-min experimental sessions with each individual participant in the morning (10–11 a.m.), afternoon (4–5 p.m.), or evening (10–11 p.m.) time slots, depending on the subject's availability. A session consisted of a rest period (5 s) followed by the stimuli presentation (60 s), repeated in sequence for all stimuli. Three audio-only and three visual-only stimuli were shown to subjects via a 19-inch LCD monitor (Hewlett Packard LE1911) with a set of headphones (Sony MDR-7506). The stimuli presentation was in pseudo-random order by altering the play order of modality blocks (audio only or video only) and by varying individual stimuli sequences within each block to obtain the emotional responses of subjects for all unimodal stimuli while avoiding an unnecessary modality difference effect; for example, V1-V3-V2-A1-A2-A3 for subject 1, A2-A1-A3-V2-V1-V3 for subject 2, V3-V2-V1-A3-A2-A1 for subject 3, and so on. The audio-only stimuli accompanied simple black screens, and the video-only stimuli had no sound on the audio channels. Each subject completed the questionnaire while watching or listening to the stimulus (see Figure S4a). Subjects were not given a break until the completion of the final questionnaire in an effort to preserve the mood generated and to avoid unexpected mood changes caused by the external environment.
Cross-modal presentation and EEG recordings
The cross-modal tests were performed in the morning (9–12 a.m.) and, excluding the preparation and debriefing, the EEG recording and behavioral response survey procedures took ~15–20 min per subject. During each session, participants (n = 8) were seated in a comfortable chair with their heads positioned in custom-made head holders placed on a table in front of the chair (Hard PVC support with a soft cushion to reduce head movement and to maintain a normal head position facing the screen). Each participant was presented with the visual music, had their heads facing the computer screen (the head to screen distance was 60 cm from a 19-inch LCD monitor; Hewlett Packard LE1911), and was given a set of headphones (Sony MDR-7506). Three visual music stimuli were shown in pseudo-random order to avoid sequencing effects. Resting EEGs were recorded for 20 s as a baseline before each watching session to allow for a short break before the subjects moved on to the next stimulus, thus avoiding excessive stress and providing a baseline time calculation for the resting alpha frequency peak (see Section Data Analysis, EEG analysis). The subjects answered the survey relating to emotion after completing the EEG recording of watching the visual music stimulus (Figure S4b) to allow for complete focus on the presentation of the stimuli and to avoid unnecessary noise artifacts in the EEG recordings. EEG recordings were digitalized at a frequency of 1,000 Hz over 17 electrodes (Ag/AgCl, Neuroscan Compumedics) that were attached according to the 10–20 international system with reference and ground at left and right earlobes (impedance < 10 k ohms), respectively. Artifacts resulting from eye movements and blinking were eliminated based on the recording of eye movements and eye blinking (HEO, VEO), using the Independent Component Analysis (ICA) in the EEGLAB Toolbox®(Delorme and Makeig, 2004). Independent components with high amplitude, high kurtosis and spatial distribution in the frontal region (obtained through the weight topography of ICA components) were visually inspected and removed when identified as eye movement/blinking contaminations. Other muscle artifacts related to head movements were identified via temporal and posterior distribution of ICA weights, as well as via a high-frequency range (70–500 Hz). The EEG recordings were filtered using a zero-phase IIR Butterworth bandpass filter (1–35 Hz). All of the computer analyses and EEG processing were performed using MATLAB® (Mathworks, Inc.).
Data Analysis
Emotion index and validity
Although the 13 pairs of bipolar ratings from the survey could provide useful information about the stimuli independently of each other, there was a need to divide them into smaller dimensions to identify emotions based on their position in a small number of dimensions. While the circumplex model is known to capture fundamental aspects of emotional responses, in order to avoid losing important aspects of the emotional process as a result of dividing them into too many dimensions, we indentified three indices of evaluation, activity, and potency. We referred to the Semantic Differential Technique (Osgood et al., 1957), and extracted the three indices by calculating mean values of the ratings of four pairs per index from the original 13 pairs used in our surveys. Specifically, the evaluation index assimilates “valence,” and its value was obtained from the mean ratings of the happy-sad, peaceful-irritated, comfortable-uncomfortable, and interested-bored scales. The activity factor represents “arousal,” and is the average of the tired-lively, relaxed-tense, dull-energetic, and exhausted-fresh scales. The potency factor reflects “control-related,” and was derived from the unsafe-safe, unbalanced-balanced, not confident-confident, and light-heavy scales. We did not include the calm-restless scale in the activity index because we found (after completion of the surveys) that there was a discrepancy in the Korean translation, which showed “unmatched” for the bipolarity pairing. The final indices (evaluation, activity, and potency) were rescaled from the nine-point scales to a range of [−1, 1], as shown in Figure S5.
EEG analysis
For the EEG, we adopted a narrow-band approach based on the Individual Alpha Frequency (IAF; Klimesch et al., 1998; Sammler et al., 2007) rather than a fixed-band approach (for example, a fixed alpha band of 8–13 Hz). This approach is known to reduce inter-subject variability by correcting the true range of a narrow-band based on an individual resting alpha frequency peak. In other words, prior to watching each clip (subjects resting for 20 s with their eyes focused on a cross [+]), the baseline IAF peak of each subject was calculated (clip 1: 10.7 ± 1.5 Hz; clip 2: 10.1 ± 0.8 Hz; clip 3: 10.1 ± 1.3 Hz). The spectral power of the EEG was calculated using a fast-Fourier transform (FFT) method for consecutive and non-overlapping epochs of 10 s (for each clip, independent baseline and clip presentation). In order to reduce inter-individual differences, the narrow band ranges were corrected using the IAF that was estimated prior to each clip according to the following formulas: Theta ([0.4–0.6] × IAF Hz), lowAlpha1 ([0.6–0.8] × IAF Hz), lowerAlpha2 ([0.8–1.0] × IAF Hz), upperAlpha band ([1.0–1.2] × IAF Hz) and Beta ([1.2–2] × IAF Hz). From the power spectral density, the total power in each band was calculated and then log transformed (10log10, results in dB) in order to reduce skewness (Schmidt and Trainor, 2001). The frontal alpha power asymmetry was used as a valence indicator (Coan and Allen, 2004), and was calculated for the first 10 seconds of recording (10log10) to monitor emotional responses during the early perception of the visual music (Bachorik et al., 2009) and the delayed activation of the EEGs (also associated with a delayed autonomic response; Sammler et al., 2007). For the overall topographic maps over time (considering all 17 channels; EEGLAB topoplot), the average power in each band divided by the average baseline power in the same band was plotted for each 10 s epoch from the baseline to the end of the presentation (subject-wise average of 10log10(P/Pbase), where P is the power and Pbase is the baseline power in the band; see Figure 4 and Figure S6). All statistical analyses were performed on the log-transformed average power estimates.
Statistical analysis
To inspect the perceived emotional meanings of each unimodal presentation, we compared the means of the evaluation, activity, and potency indices (three factors of “affection” as dependent variables) across the audio only and across the video only. We performed a multivariate analysis of variance (two-way repeated measure MANOVA) using two categories as between subject factors (independent variables), “modality” (two levels: audio only and visual only) and “target-emotion” (three levels: happy, relaxed, and vigorous). This analysis examines three different null hypotheses:
(1) “Modality” will have no significant effect on “emotional assessment” (evaluation, activity, and potency),
(2) “Target-emotion” will have no significant effect on “emotional assessment,” and
(3) The interaction of “modality” and “emotion” will have no significant effect on “emotional assessment.”
We then performed follow-up one-way repeated measure analysis of variance (one-way repeated measure ANOVA) tests for the three indices combined with the same within-subject factor “target-emotion” for each modality. We checked typical assumptions of a MANOVA, such as normality, equality of variance, multivariate outliers, linearity, multicollinearity, and equality of covariance matrices and, unless stated otherwise, the test results met the required assumptions. ANOVAs that did not comply with the sphericity test (Mauchly's test of sphericity) were reported using the Hyunh-Feldt correction. Post-hoc multiple comparisons for the repeated measure factor “clip” were performed using a paired t-test with a Bonferroni correction.
To inspect the perceived emotional meanings of the visual music stimuli, we conducted a one-way ANOVA to examine the means of evaluation, activity, and potency indices (three factors of “affection” as dependent variables) for each “target-emotion” clip. Considering the mixed subject groups (identical subjects in audio only and video only, but different subjects in the visual music group), we then conducted non-parametric Kruskal-Wallis H-tests (K–W test) to see if “modality” would have an effect on “emotional assessment” (evaluation, activity, and potency) in the same “target-emotion” group (“happy” target-emotion stimuli: A1, V1, and A1V1), and to examine whether the interaction of “modality” and “emotion” would have an effect on “emotional assessment.”
For the frontal asymmetry study of the EEGs, we used a symmetrical electrode pair, F3 and F4, for upperAlpha band powers (see EEG Analysis Section for a definition of upperAlpha band from IAF estimation) to calculate lateral-asymmetry indices by power subtraction (power of F4 upperAlpha—power of F3 upperAlpha). We performed a Pearson's correlation between the valence index (evaluation) and the frontal upperAlpha asymmetry in order to validate our index representation of valence through electrophysiology. For each clip, we performed a paired t-test between F4 and F3 upperAlpha values to quantify the frontal alpha asymmetry.
All statistical tests were performed using the Statistical Package for Social Science (SPSS) version 23.0.
Results
Unimodal Stimuli
Audio only
We obtained the affective characteristic ratings of each auditory-only stimulus, as shown in Table 3 and Figure 3. A one-way ANOVA was conducted to compare the effect of the presentations on the three indices. The result showed that the effect of the clips on the levels of all three indices was significant; evaluation [F(2, 21) = 7.360, p = 0.004, η2 = 0.412], activity [F(2, 21) = 39.170, p = 0.000, η2 = 0.789], and potency [F(2, 21) = 14.948, p = 0.000, η2 = 0.571]. We found that clip 1 received a significantly higher rating in the evaluation index than did clip 3 (p = 0.003). The clip 2 received a significantly lower rating in the activity index than did clip 1 (p = 0.000), and clip 3 (p = 0.000). Clip 3 received a significantly higher rating in the activity index (p = 0.045) and a lower rating in the potency index (p = 0.001) than did clip 1, and a significantly higher rating in the activity index (p = 0.000) and lower indexing in the potency index (p = 0.000) than did clip 2. The results indicate that the valence level (evaluation value) of all three auditory stimuli was perceived as positive, with the clip 1 “happy” showing the highest positive level of valence. The variations in the activity index showed “relaxed” as the lowest (mean = −0.06, neutral-passive) and “vigorous” as the highest (mean = 0.81, high-active) arousal levels, respectively.
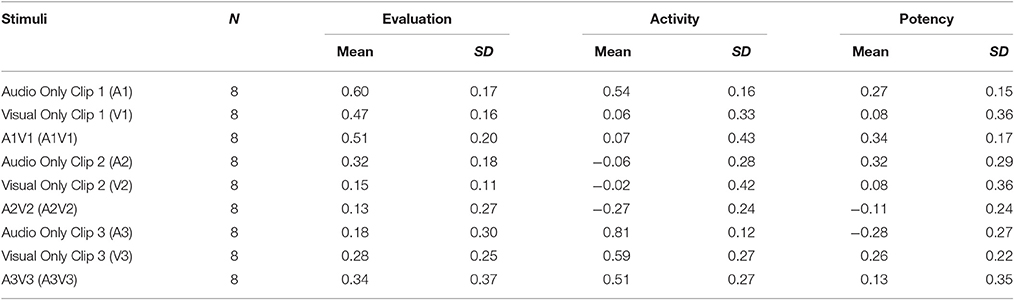
Table 3. Mean and standard deviation comparison for evaluation, activity, and potency indices of all three stimuli in three different modalities.
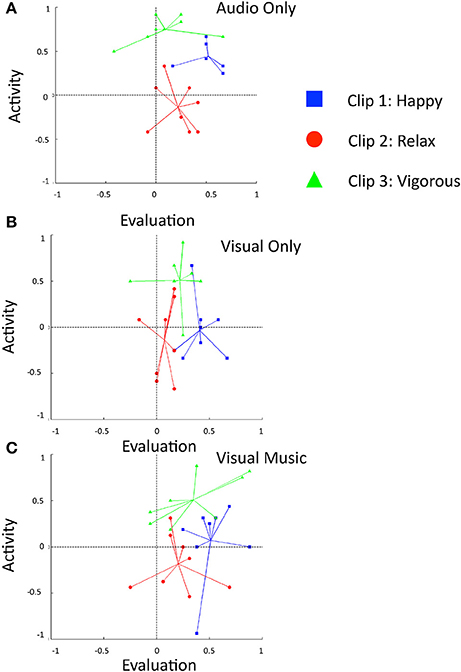
Figure 3. Comparison of connotative meanings of three clip stimuli using the evaluation and activity indices into 2D planes. Subjects' responses are shown for the conditions (A) audio only, (B) visual only, and (C) visual music (combined auditory and visual stimuli).
Video only
For the visual-only content, we obtained the mean values as shown in Table 3 and Figure 3. A One-way ANOVA test showed that the effect of the clips on the levels of the three indices was significant in the evaluation [F(2, 21) = 6.262, p = 0.007, η2 = 0.373] and activity indices [F(2, 21) = 7.488, p = 0.004, η2 = 0.416]. The evaluation index of clip 1 obtained a significantly higher rating than did clip 2 (p = 0.006). The activity index showed clip 3 received a significantly highest rating than did clip 1 (p = 0.017) and clip 2 (p = 0.005). No significantly different effect of the clips was reported for the potency index. The results indicate that all visual-only animations were perceived positively at valence level; however, there were no clear distinctions of the perceived emotional information (evaluation, activity, and potency) among the three animations (V1~V3), as was partially shown in the audio clips (A1~A3). The animation “vigorous” showed the highest activity (mean = 0.59, high-active) rating, while both the animations “happy” and “relaxed” showed activity ratings that indicated low-level arousal experienced by the subjects for these two animations (mean = 0.06, neutral-passive and mean = −0.02, neutral-passive, respectively).
We conducted two-way repeated measure MANOVA tests with the three indices and two between-subject factors (“modality” and “target-emotion”), and Mauchly's test indicated that the assumption of sphericity had been violated, = 14.244, p = 0.001; therefore, degrees of freedom were corrected using Huynh-Feldt estimates of sphericity (ε = 0.77), and the results are shown in Table 4. The results of the 2 × 3 MANOVA with modality (audio only, visual only) and target-emotion (happy, relaxed, vigorous) as between-subject factors show a main effect of emotion, [F(3.57, 74.98) = 17.80, p = 0.000, = 0.459], and an interaction between modality and emotion [F(3.57, 74.98) = 3.548, p = 0.013, = 0.145]. The results indicate that “target-emotion” and the interaction of “modality and target-emotion” have significantly different effects on evaluation, activity, and potency levels.
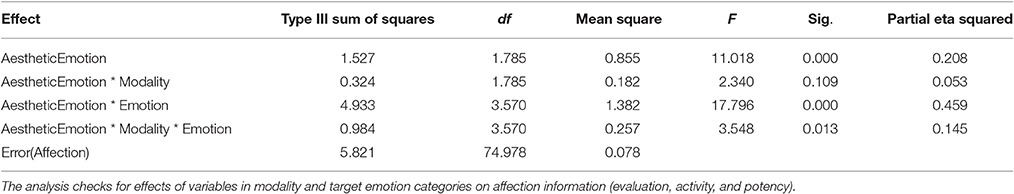
Table 4. Results of Two-Way Repeated Measure MANOVA using the Huynh-Feldt Correction following a violation in the assumption of sphericity.
Cross-Modal Stimuli
Behavioral response
The ratings for the cross-modal subjects were obtained, and were distributed as shown in Table 5 and Figure 3. The simple placement of evaluation and activity values on the 2D plane illustrates the characteristics of our stimuli at a glance, and we can see that they indicate positive in emotional valence (mean evaluation index ≥ 0), irrespective of the modality of the presentation (Figure 3). Clip 1, “happy,” targeted a high-positive valence and neutral-active arousal emotion, and indicated the comparable perception of the subjects (evaluation: 0.51 ± 0.20; activity: 0.07 ± 0.43); clip, 2 “relaxed,” a mid-positive valence and mid-passive arousal, displayed a tendency similar to the viewers' responses (evaluation: 0.13 ± 0.32; activity: −0.27 ± 0.24), while clip 3, “vigorous,” showed a neutral-positive valence and high-active arousal (evaluation: 0.34 ± 0.37; activity: 0.51 ± 0.27).
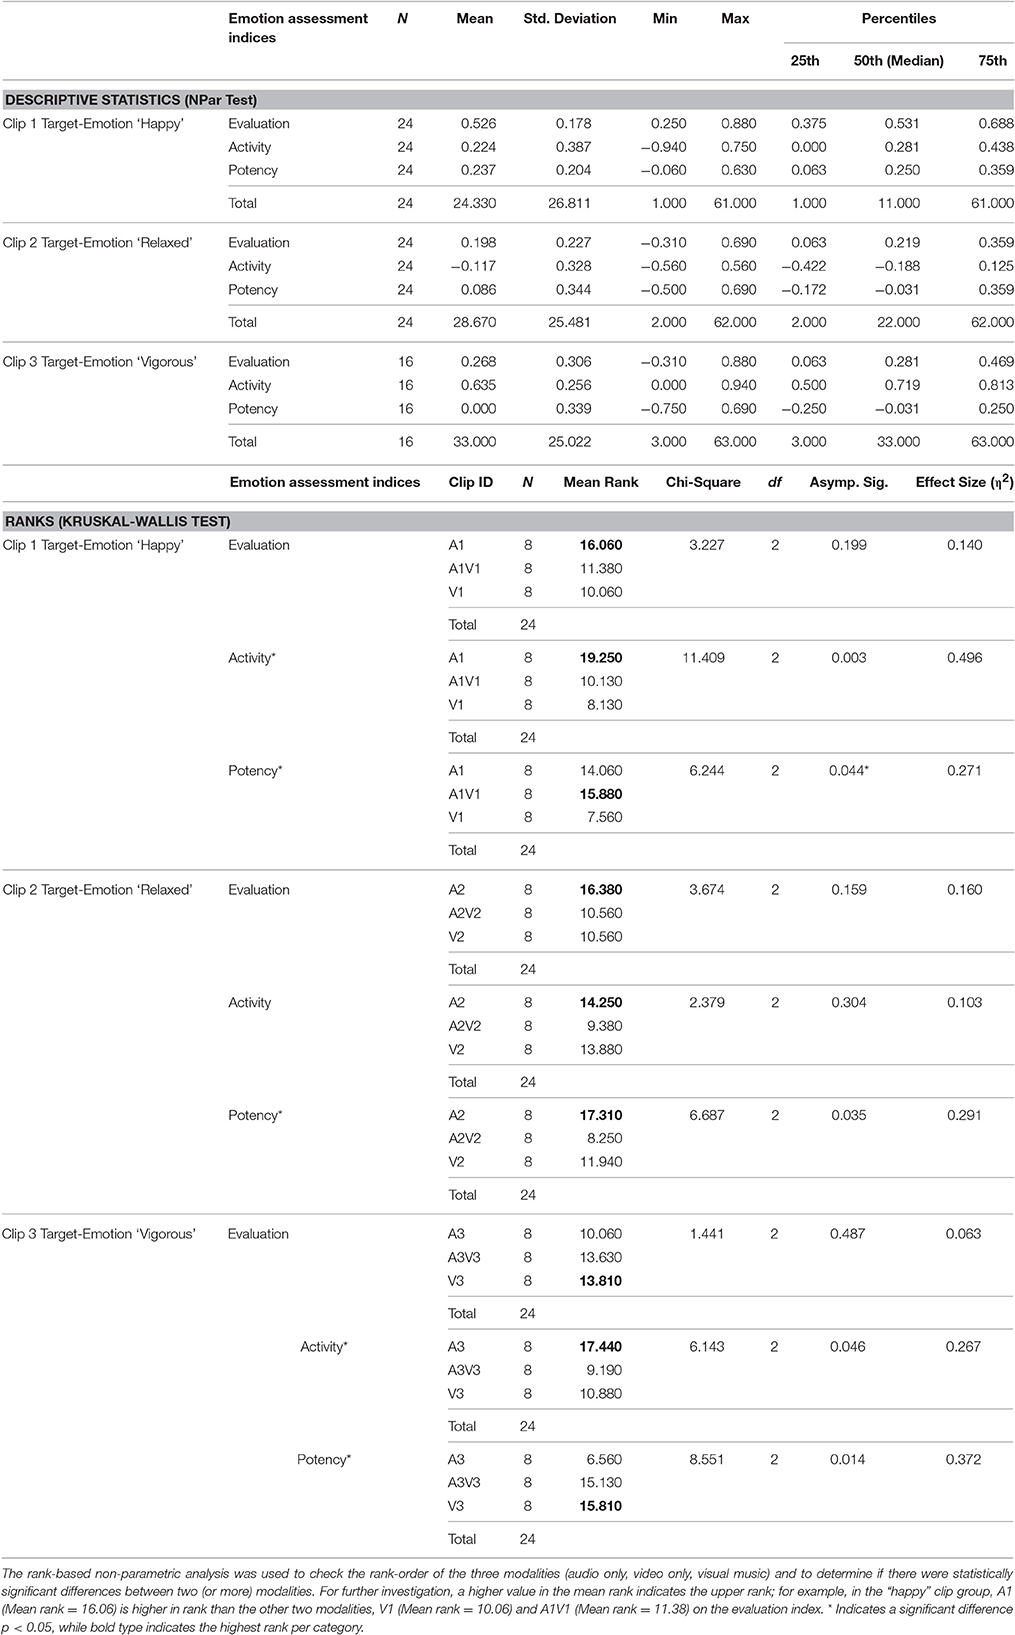
Table 5. Results of the Kruskal-Wallis Test comparing the effect of our designed emotional stimuli on the three perceived emotion assessment indices (evaluation, activity, and potency).
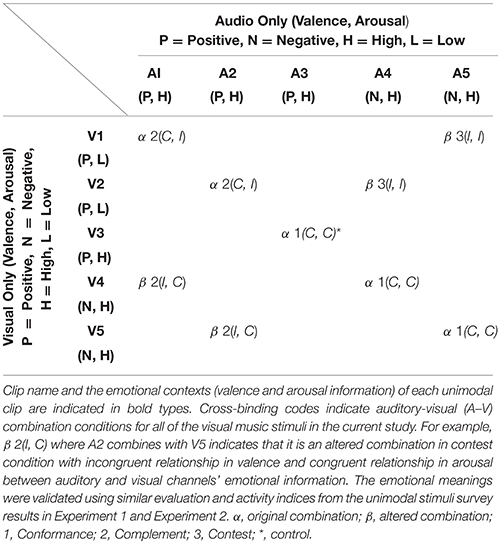
Table 6. Visual music stimuli combination conditions information in the current study.
We performed a multivariate analysis of variance using a category as the independent variable “target-emotion” (three levels: happy, relaxed, and vigorous), with evaluation, activity, and potency indices as dependent variable. The test showed a statistically significant main effect of the clip (target-emotion) on the activity index [F(2, 23) = 11.285, p = 0.000, = 0.518] and on the potency index [F(2, 23) = 6.499, p = 0.006, = 0.382]. A post-hoc test indicated that clip 3, “vigorous,” showed significantly higher activity rating values than did clip 1 “happy” (p = 0.042) and clip 2 “relaxed” (p = 0.000). Clip 1, “happy,” showed significantly higher potency values than did clip 2, “relaxed” (p = 0.005). The means of the evaluation index shows that the clip “happy” had the highest evaluation value (M = 0.51, high-positive level), and the clip “relaxed” had the lowest (M = 0.12, mid-positive). The activity index in the visual music showed that the clip “vigorous” had the highest activity value (M = 0.51, high-active in arousal).
Further inspection of the perceived emotional information (evaluation, activity, and potency) on the interactions of “target emotion” and “modality” was conducted via a K–W test. The test results showed that there was no statistically significant difference among the three different modalities on the evaluation index. However, there were statistically significant differences on activity scores for the “happy” stimuli among the different modalities, = 11.409, p = 0.003, with a mean rank index score of 19.250 for A1, 10.130 for A1V1, and 8.130 for V1, and for the “vigorous” stimuli, χ2(2) = 6.143, p = 0.046, with a mean rank index score of 17.440 for A3, 9.190 for A3V3, and 10.880 for V3. Three statistically significant differences in potency scores were reported. The “happy” stimuli in different modalities showed = 6.244, p = 0.044, with a mean rank index score of 14.060 for A1, 15.880 for A1V1, and 7.560 for V1; the “relaxed” stimuli, = 6.687, p = 0.035, had a mean rank index score of 17.310 for A2, 8.250 for A2V2 and 11.940 for V2, while the “vigorous” stimuli showed = 8.551, p = 0.014, with a mean rank index of 6.560 for A3, 15.130 for A2V2, and 15.810 for V2 (Table 5).
EEG response
The temporal dynamic of visual music creates complex responses in EEGs, with spatial, spectral, and temporal dependency for each clip (Figure S6). In order to remain within the scope of this study, we focused on a well-known EEG-based index of valence. It has been proposed that the frontal alpha asymmetry (EEG) could show close association with perceived valence in the early stage of the presentation of stimuli (Kline et al., 2000; Schmidt and Trainor, 2001; van Honk and Schutter, 2006; Winkler et al., 2010). We used the known neural correlates of emotion (frontal asymmetry in alpha power) to assess the internal responses of our subjects and to provide a partial physiological validation of our targeted-emotion elicitation from watching visual music. We found statistically significant correlations between evaluation and the frontal upperAlpha difference (evaluation-upperAlpha Subtraction: r(24) = 0.505, p = 0.012; Figure 4). We also found a significant difference between F4 and F3 upperAlpha power [t(7) = 5.2805; p = 0.001; paired t-test] for clip 1, the visual music stimulus showing the most positive response in valence. Clips 2 and 3 did not show significant differences in the frontal upperAlpha band power (Figure 5A).
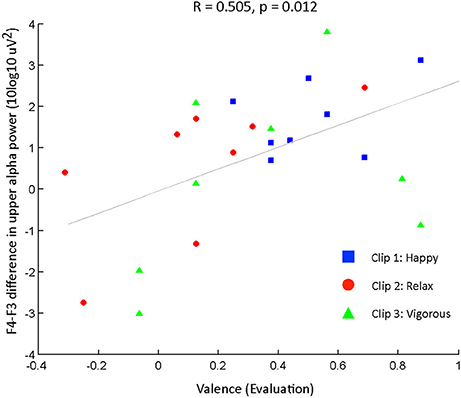
Figure 4. Scatter plot and correlation between evaluation rating (valence) and upperAlpha frontal asymmetry. Upper Alpha power was estimated for the early presentation of clips (10 s), and was log transformed (10log10 uV2). Frontal asymmetry was estimated as the difference of F3-F4 of log transform of upperAlpha band power [10log10(P)]. Pearson's correlation was used (N = 8 subjects).
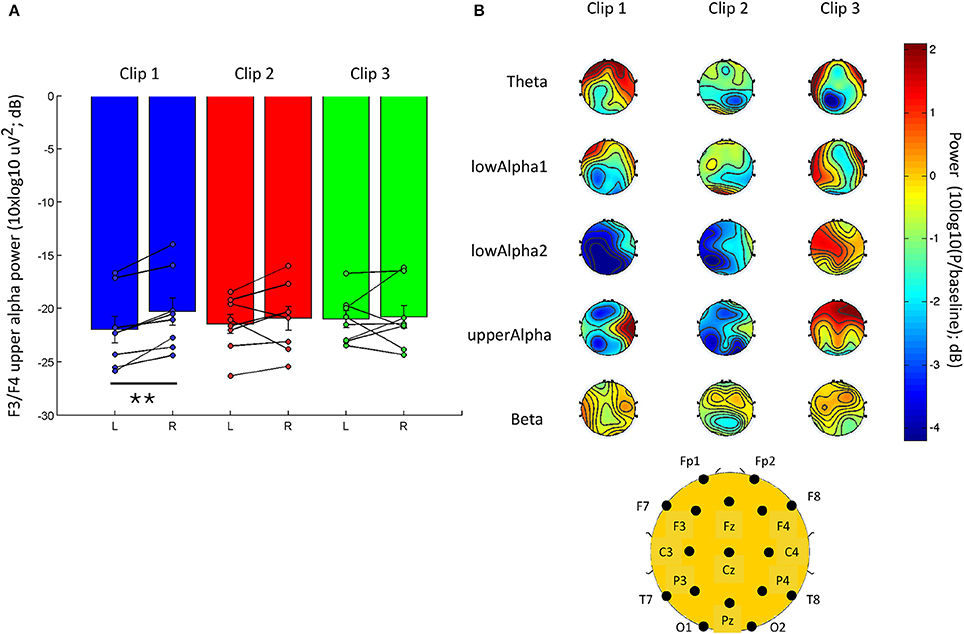
Figure 5. EEG responses to each clip presentation. (A) F3 and F4 frontal upper Alpha power (10log10 uV2) for the first 10 s of clip presentation for clip 1 (happy), clip 2 (relaxed), and clip 3 (vigorous). (B) The overall topographic EEG changes from the baseline for the early presentation of each clip (first 10 s). The power is normalized to the baseline (division) and log transformed (10*log10) to provide the baseline change in dB. See Figure S6 the full temporal dynamics of the EEG response to each clip. Data are presented on a scatter plot and mean ± s.e.m; ** indicates a p ≤ 0.001.
In addition to the frontal asymmetry, we noted a qualitative average increase in frontal theta power and a decrease in power for lowAlpha2, compared to the baseline in the early presentation phase of clip 1 (first 10 s; Figure 5B). Subjects' responses during the early presentation of clip 2 (relaxed) exhibited a more symmetrical activity in the lower frequency bands (theta and lowAlpha1), as well as in beta power. Clip 3 (vigorous) elicited a stronger average increase in power. Notably, clip 3 showed more remarkable increase in frontal upperAlpha and lowAlpha2 power, compared to baseline recording.
Discussion
In this experiment, we plotted the valence and arousal information of our designed clips on a well-known 2D plane with the means of the extracted evaluation and activity indices from psychometric self-rated subject surveys. The statistical analysis result indicates that our directive design of visual music delivered positive emotional meanings to the viewers with somewhat different valence, arousal, and texture information when compared to each other. The 2D plane illustration indicated that our constructed emotional visual music videos delivered positive emotional meanings to viewers that were similar to the intended target emotions. Comparisons of same target-emotional stimuli between modalities indicated that the likelihood of assessing valence (evaluation) information was similar for all three modality groups, while assessing the arousal (activity) and texture/control (potency) information was not similar. In other words, the target-emotion designs of audio, video, and visual music were likely to have similar information on valence levels with differences on arousal and texture/control levels. In addition, the frontal EEG asymmetry response during the early phase (first 10 s) of the visual music presentation correlated with the perceived valence index, which supports a possible relationship between valence ratings and the physiological response to positive emotion elicitation in our subjects. In our view, this preliminary experiment might provide a basis for the composition of synthetically integrated abstract visual music as unitary structural emotional stimuli that can elicit autonomic sensorial-perception brain processing; hence, we propose visual music as prototypic emotional stimuli for a cross-modal aesthetic perception study. The result of this experiment suggests the possibility of authenticating the continued investigation of aesthetic experiences using affective visual music stimuli as functions of information integration. However, the addition of negative emotional elements in experiment 2 seemed necessary to investigate how the auditory-visual integration condition might affect the overall aesthetic experience of visual music and the affective information interplay among modalities.
Experiment 2: Audio-Visual Integration Experiment
To conduct the experiment, we first included two additional visual music stimuli created by a solo multimedia artist (who did not participate in the design of Experiment 1) within the negative spectrum of valence. We then confirmed the perceived emotional responses of participants watching our emotional visual music, and divided them into three indices, namely evaluation (valence), activity (arousal), and potency (texture/control). Lastly, we studied the audio-visual integration effect by cross-linking unimodal information from the original visual music to retain stimuli for all three integration conditions: conformance, complementation and contest (Section Stimuli Construction), and to investigate the enhancement effect of perceived emotion by synthetic cross-modal stimuli.
Methods
To examine the association of different information-integration conditions between two modalities (audio and video) on aesthetic perception and the enhancement effect (to test our hypothesis regarding the integration enhancement effect), we conducted surveys involving audio-only, video-only, original visual music, and altered visual music stimuli. By using an analogous method in Experiment 1, we conducted psychometrical surveys of participants and assessed the evaluation, activity and potency factors across unimodal and cross-modal stimuli. We then compared the emotional information in unimodal channels and visual music, and checked for the presence of added values resulting from the A/V integration.
Participants
We recruited participants from the Dongah Institute of Media and Arts (DIMA) in Anseong, Korea, and Konyang University in Nonsan, South Korea for the four subject groups in our audio-visual integration experiment. Students from the DIMA enrolled in Home Recording Production or Video Production classes served as subjects in exchange for extra credit. Students from Konyang University enrolled in general education classes in Thought and Expression or Meditation Tourism served as voluntary subjects. Voluntary participants from Konyang University had the option of entering a draw to win a coffee voucher worth $10 in return for their participation. The groups were composed as follows:
(a) Audio-only group of 33 video production majoring students [mean age = 22.33, sex (m:f) = 10:23, minimum age = 21, maximum age = 25];
(b) Visual-only subjects of 27 students majoring in music [mean age = 25.15, sex (m:f) = 14:13, minimum = 21, maximum age = 28];
(c) The original visual music group was composed of 42 students majoring in cultural events and tourism [mean age = 22.50, sex (m:f) = 22:20, minimum age = 21, maximum age = 29], and
(d) The altered visual music group was composed of 53 students who were studying majors that included fashion, optometry, tourism, business, computer engineering, economics, psychology, and the like [mean age = 22.32, sex (m:f) = 24:29, minimum age = 20, maximum age = 27].
Considering that our directive design stimuli were based on the concept of universal beauty in art, but that the survey subjects did not include participants form different cultures, the difference in the number of subjects in the groups was not critical (n ≥ 27 in all four groups). The survey kits and questionnaires were identical to the ones used in Experiment 1, except for the addition of a pleasant-unpleasant pair as a simple positive-negative affect response (see Figure S2). As in Experiment 1, subjects were fully informed, in both written and verbal forms, that they were participating in a survey for a study investigating aesthetic perception for scientific purposes. The consent of all subjects was obtained orally before taking part in the study, and the data were analyzed anonymously. Most of the visual music subjects (including both original and altered groups) were not taking majors related to music or visual art, with the exception of nine students (one digital content, one fashion design, two visual design, one cultural video production, and four interior design).
Stimuli Construction
As briefly explained previously, we extracted the unimodal stimuli from five original visual music videos to divide them into independent audio-only and visual-only channel information (named A1–A5 and V1–V5, respectively). Based on the evaluated emotion from the unimodal information, we them cross-linked the clips to create altered visual music. This method was inspired by the three basic models of multimedia which is postulated by Cook (1998) and combinations of visual and audio information based on the two-dimensional (2D) model by Somsaman (2004). The result was nine cross-modal stimuli (five original and four altered clips) in three combinations of conditions: conformance (agreement between valence and arousal information from the video and audio channels), complementation (partial agreement between valence and arousal information from the video and audio channels) and contest (conflict between valence and arousal information from the video and audio channels) to use in our experiment (Figure S1).
Procedure
Unimodal
Surveys for the audio-only and visual-only groups were conducted on the same day at 11 a.m. and 1 p.m., and all the subjects in each group sat together in a large, rectangular audio studio classroom (~6 × 6.5 m) that was equipped with a wall-mounted screen (122 × 92 cm) A/V system and a pair of Mackie HRmk2 active monitor speakers. The audio-only group heard sound clips (60 s each) individually with a 20-s rest between presentations, ordered A2–A3–A4–A1–A5, and the visual-only group watched video clips (60 s each) that were ordered V2–V4–V3–V1–V5, with a 20-s rest between each presentation. Each student evaluated the emotional qualities of each stimulus by answering the questionnaires while listening to or watching the stimuli, and each session lasted ~10 min.
Cross-modal
We performed the psychometric rating experiments in the afternoon for each group at 1 and 3 p.m., and five visual music clips were played in each survey. All the subjects sat together in a general classroom (approximate room size 7 × 12 m) that was equipped with a wall-mounted, large-screen (305 × 229 cm) projection A/V system and a pair of Mackie SRM450 speakers. For the original visual music group, we played the stimuli in the order A4V4–A2V2–A5V5–A1V1–A3V3. For the altered visual music group, we played the stimuli in the order A5V1–A4V2–A1V4–A2V5–A3V3 (the control clip was the same as A3V3). Taking into account the temporal contextual changes that occur during the presentation of clips, the students responded the self-assessment questionnaires after watching each clip.
Data Analysis
Reliability and competency tests of the indices
Before investigating the added value (enhancement effect) of cross-modal perception via visual music, we checked the reliability of our three emotional aspect factors (evaluation, activity, and potency) by using the data from all conditions in the experiment. The result showed a fairly high reliability value for the three indices (Cronbach's α = 0.728, N = 775), and the test indicated the omission of the activity index could lead to a higher Cronbach's alpha value (α = 0.915). The inter-relation correlation matrix values among the indices were evaluation-activity (0.295114), evaluation-potency (0.843460), and activity-potency (0.223417). A Pearson's correlation test indicated that three emotional indices were strongly associated: [evaluation-activity: r(775) = 0.295, p < 0.000, evaluation-potency: r(775) = 0.843, p < 0.000, and activity-potency: r(775) = 0.223, p < 0.000]. An independent-sample t-test of three indices was conducted to compare the unimodal group and the cross-modal group in the evaluation, activity, and potency level conditions. The result indicated no significant differences between unimodal (n = 300) and cross-modal groups (n = 475), except in the activity values of unimodal (0.216 ± 0.313) and cross-modal (0.139 ± 0.279) conditions; t(773) = 3.587, p = 0.000, d = 0.260. The results indicated higher mean activity values for audio only (0.342 ± 0.219) than for visual only (0.062 ± 0.341); t(219, 71) = 8.267, p = 0.000, d = 0.975. In addition, we found higher mean activity values for the original group (0.189 ± 0.230) than for the altered group [0.099 ± 0.306); t(473) = 3.528, p = 0.000, d = 0.333]. To further check the competency of the activity indices, we checked the responses to our control clip (A3V3) of the original (n = 42) and altered cross-modal (n = 53) survey groups. As Levene's test for equality of variances also revealed no significant differences in the two groups' assessments of the control clip, this provides some evidence that the equal variance assumption is satisfied on the univariate level. We found no statistically significant differences among groups of the three indices, as determined by a one-way ANOVA: evaluation [F(1, 93) = 0.051, p = 0.822, d = 0.047], activity [F(1, 93) = 0.061, p = 0.806, d = 0.045], and potency [F(1, 93) = 0.942, p = 0.336, d = 0.199]. The descriptive statistical results are shown in Table 7 and Table S1.
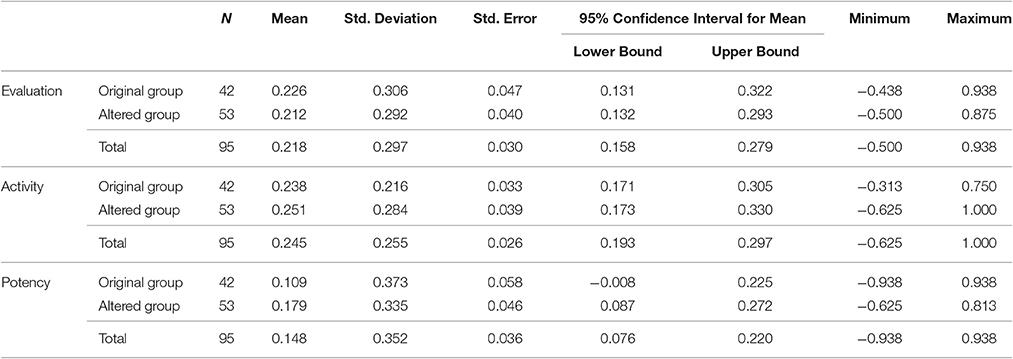
Table 7. Mean and Standard Deviation Comparison between Original and Altered Groups for Evaluation, Activity, and Potency Indices of the Control Clip (A3V3).
Statistical analysis
To investigate the perception of emotion in the information-integration conditions (conformance, complementation, and contest) between two modalities (audio and video), we performed a separate one-way ANOVA analysis for each survey group (five audio only, five video only, five original video music, and five altered visual music). Post-hoc multiple comparisons of significant ANOVA results were then performed using the Bonferroni correction. Levene's test results for equality of variances were recorded when violated. All statistical tests were performed using the Statistical Package for Social Science (SPSS) version 23.0. The silhouette-clustering index was used as a measure of clustering. A score close to 1 indicates a compact and well-separated cluster, while a score close to −1 indicates a cluster with a large spread and/or poor separability. The silhouette analysis was performed using MATLAB® (Mathworks, Inc.).
Results
Emotional Meanings of Clips
Tests of normality, sphericity (Mauchly's test of sphericity), equality of covariance matrices (Box's M), and multicollinearity (Pearson's correlation) for the three indices indicated that our data have violations in assumptions check for skewness, kurtosis, sphericity, equality of covariance, and correlations to validate the use of parametric ANOVA or MANOVA tests across three modalities (audio only, video only, and audio-visual). Hence, for comparisons across modalities, we opted for the non-parametric alternative, K–W test. In order to focus on the investigation of “information-integration conditions,” we report only critical results related to cross-modal stimuli in the manuscript, and other detailed investigations of multiple K–W tests and one-way MANOVA tests using three indices (evaluation, activity, potency) as dependent variables. “Modality' (audio only, video only, and cross modal), “clip” (A1, A2, V1, V2, A3V3, A5V1, and so on), “synchronization” (original vs. altered), or any interactions (of modality, clip, and synchronization) as independent variables will be provided separately (Table S2).
Table 8 shows the indices' values (evaluation, activity, and potency) for each mode of presentation, namely unimodal stimuli and the auditory-visual integrated stimuli. The valence values for each clip were found to have similar values to those of auditory stimuli in the original groups (A1V1, A2V2, and A3V3 had positive valence; in other words, the evaluation index > 0; A4V4 and A5V5 had negative valence, as the evaluation index < 0 with small difference in variance; A1V1 (0.66 ± 0.20), A2V2 (0.43 ± 0.27), A3V3 (0.23 ± 0.31), A4V4 (−0.42 ± 0.28), and A5V5 (−0.20 ± 0.33).
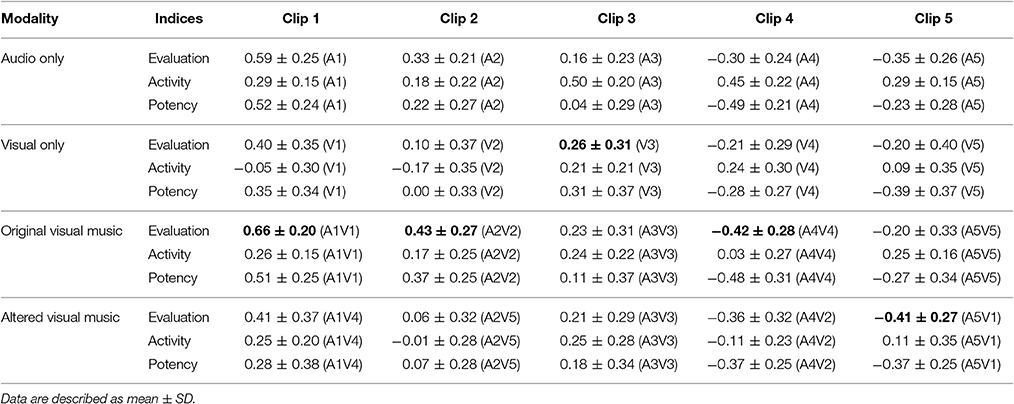
Table 8. Means and STDs of three indices describing the emotional meanings of each clip stimulus in statistics: the highest absolute value in valence (evaluation) is indicated in bold type.
To inspect perceived emotional information (evaluation, activity, and potency) in interactions of “synchronization” (original vs. altered), “modality” (audio only, visual only, and cross modal), and “clip” (A1 ~ A5V1), we conducted several K–W tests. The test results showed that there were statistically significant differences among the conditions caused by different synchronization, modalities, and clips on evaluation, activity, and potency indices (all p ≤ 0.001, except p < 0.05 for clip 3 (for potency), clip 4 (for evaluation and potency), and clip 5 for evaluation and activity), except clip 3 for evaluation (p = 0.389) and clip 5 for potency (p = 0.069), as shown in Table 9.
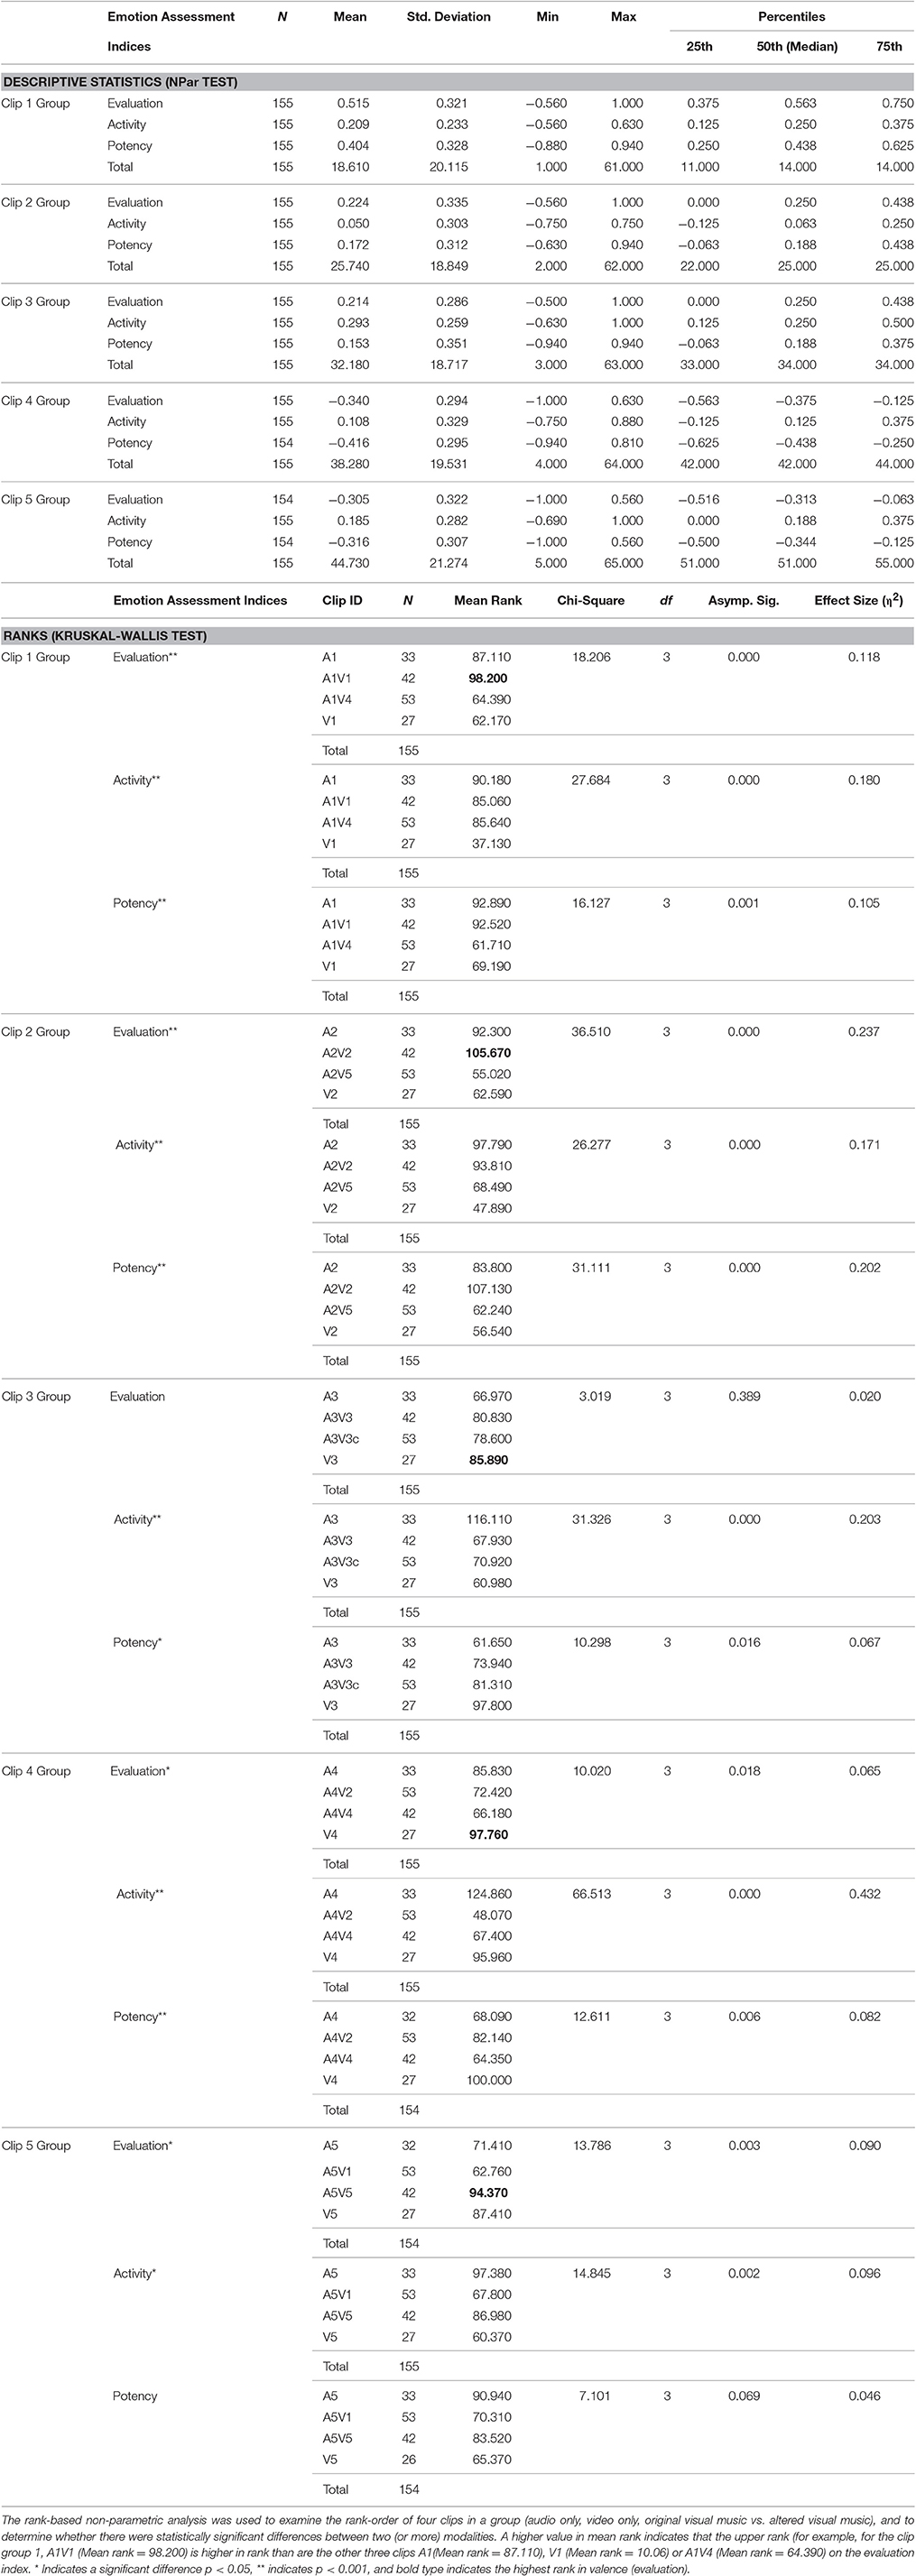
Table 9. Results of the Kruskal-Wallis Test comparing the effect of clips with similar emotional meanings across modalities and synchronizations of the three perceived emotion assessment indices (evaluation, activity, and potency).
To further investigate the significant differences shown in Table 9, we conducted several other K–W tests among different modalities in the same clip groups (for example, A1 vs. V1, A1 vs. A1V1, A1 vs. A1V4, A1V1 vs. A1V4, and so on) However, in order to focus on investigating the added-value effects that result in affective enhancement, we only report the results of the comparison between a high-responsive unimodal (audio only) vs. original visual music (Table 10), and unimodal (audio only) vs. altered visual music (Table 11). The comparison between auditory-channel only and the original synchronization cross-modal stimuli results indicated a statistically significant difference in potency scores between A2 and A2V2, = 6.173, p = 0.013, with a mean rank index score of 30.970 for A1 and 43.520 for A1V1. The A3 and A3V3 comparison showed a significant difference in the activity index, = 23.984, p = 0.000, with a mean rank index score of 51.850 for A3 and 27.120 for A3V3. The A4 and A4V4 comparison showed a significant difference in the activity index, = 33.707, p = 0.000, with a mean rank index score of 54.440 for A4 and 25.080 for A4V4, while the A5 vs. A5V5 comparison indicated a significant difference in the evaluation index, = 5.791, p = 0.016, with a mean rank index score of 30.630 for A5 and 42.740 for A5V5. No statistically different effect of clips (A1 or A1V1) on any of three indices (evaluation, activity, and potency) was shown. In four out of five comparison cases, the cross-modal stimuli showed a higher mean rank over audio-only in the same group in the evaluation index; A1V1 (mean rank = 40.420) vs. A1 (mean rank = 34.920), A2V2 (mean rank = 41.850) vs. A2 (mean rank = 33.110), A3V3 (mean rank = 41.200) vs. A3 (mean rank = 33.920), and A5V5 (mean rank = 42.740) vs. A5 (mean rank = 30.630).
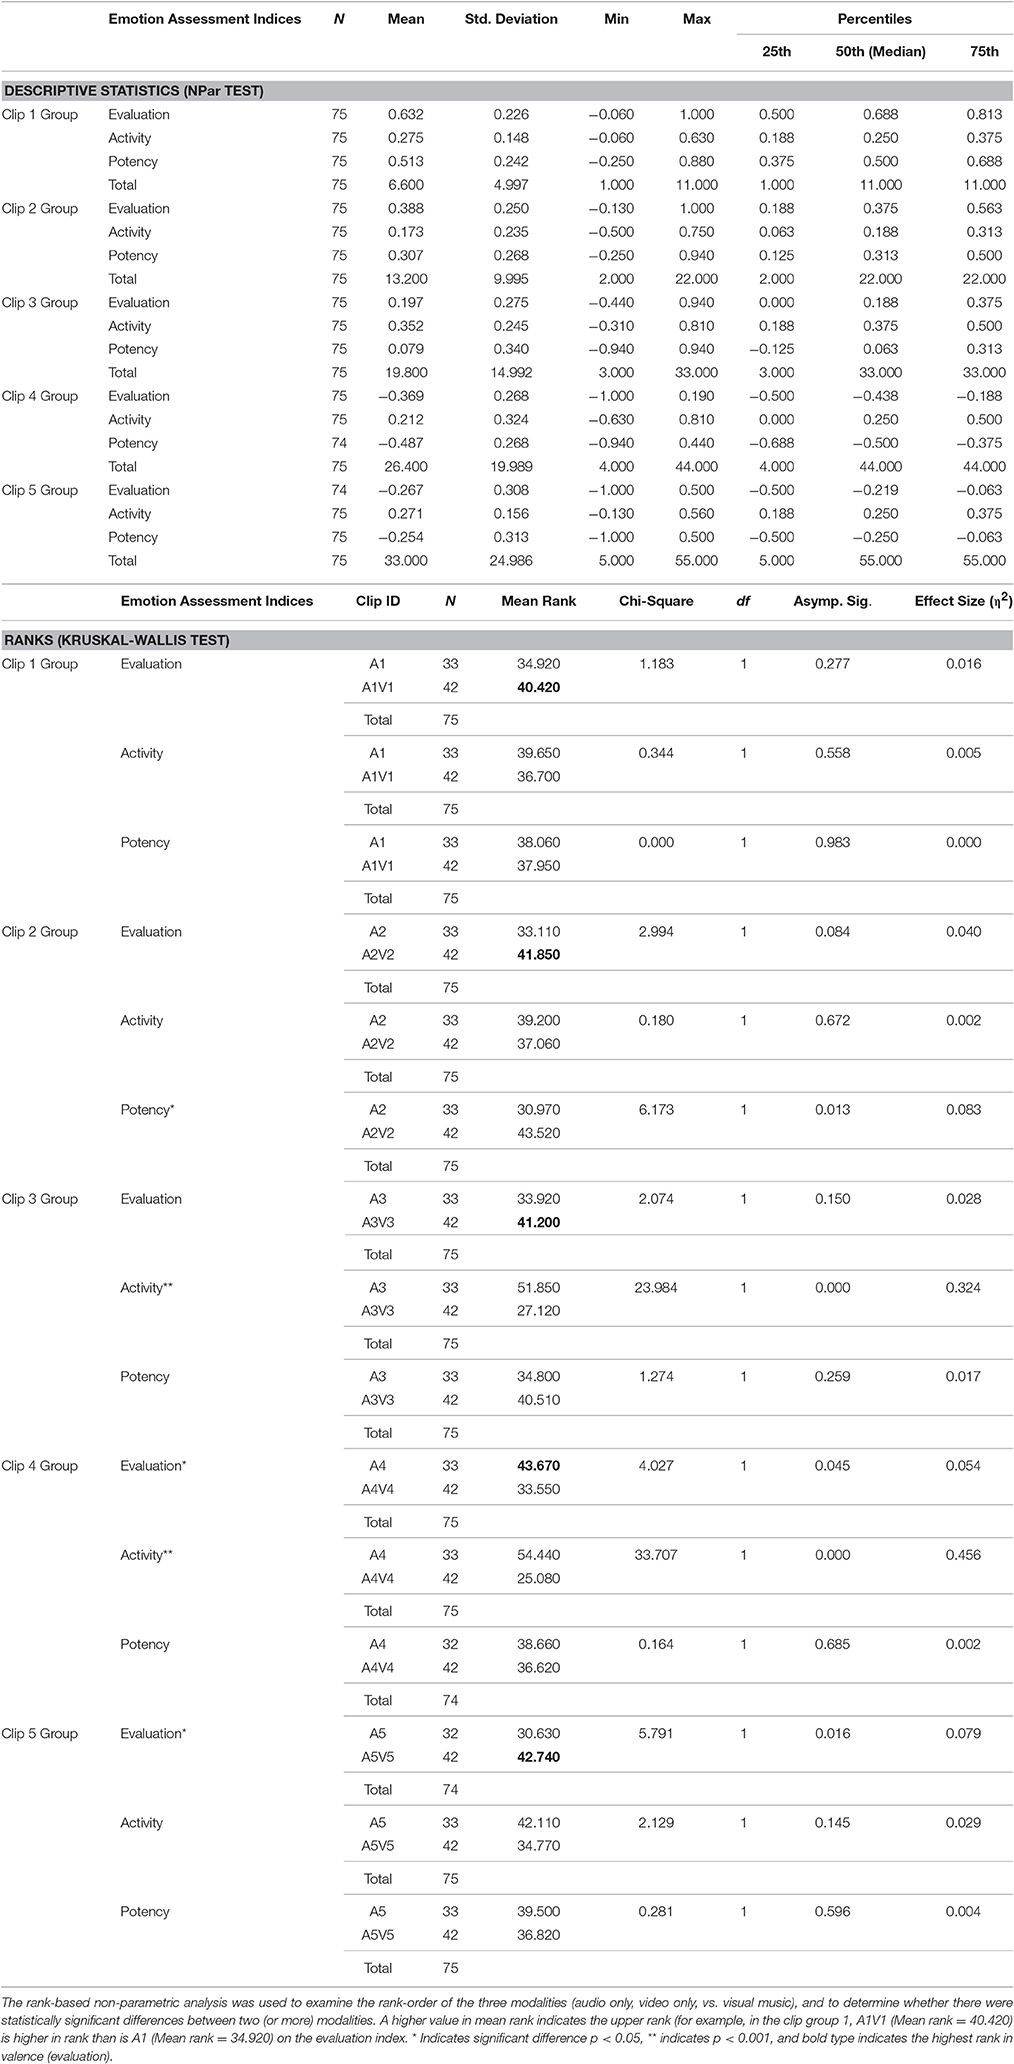
Table 10. Results of a Kruskal-Wallis Test comparing the effect of the emotional meaning of clips between the auditory modality and the cross-modality (original synchronization) on the three perceived emotion assessment indices (evaluation, activity, and potency).
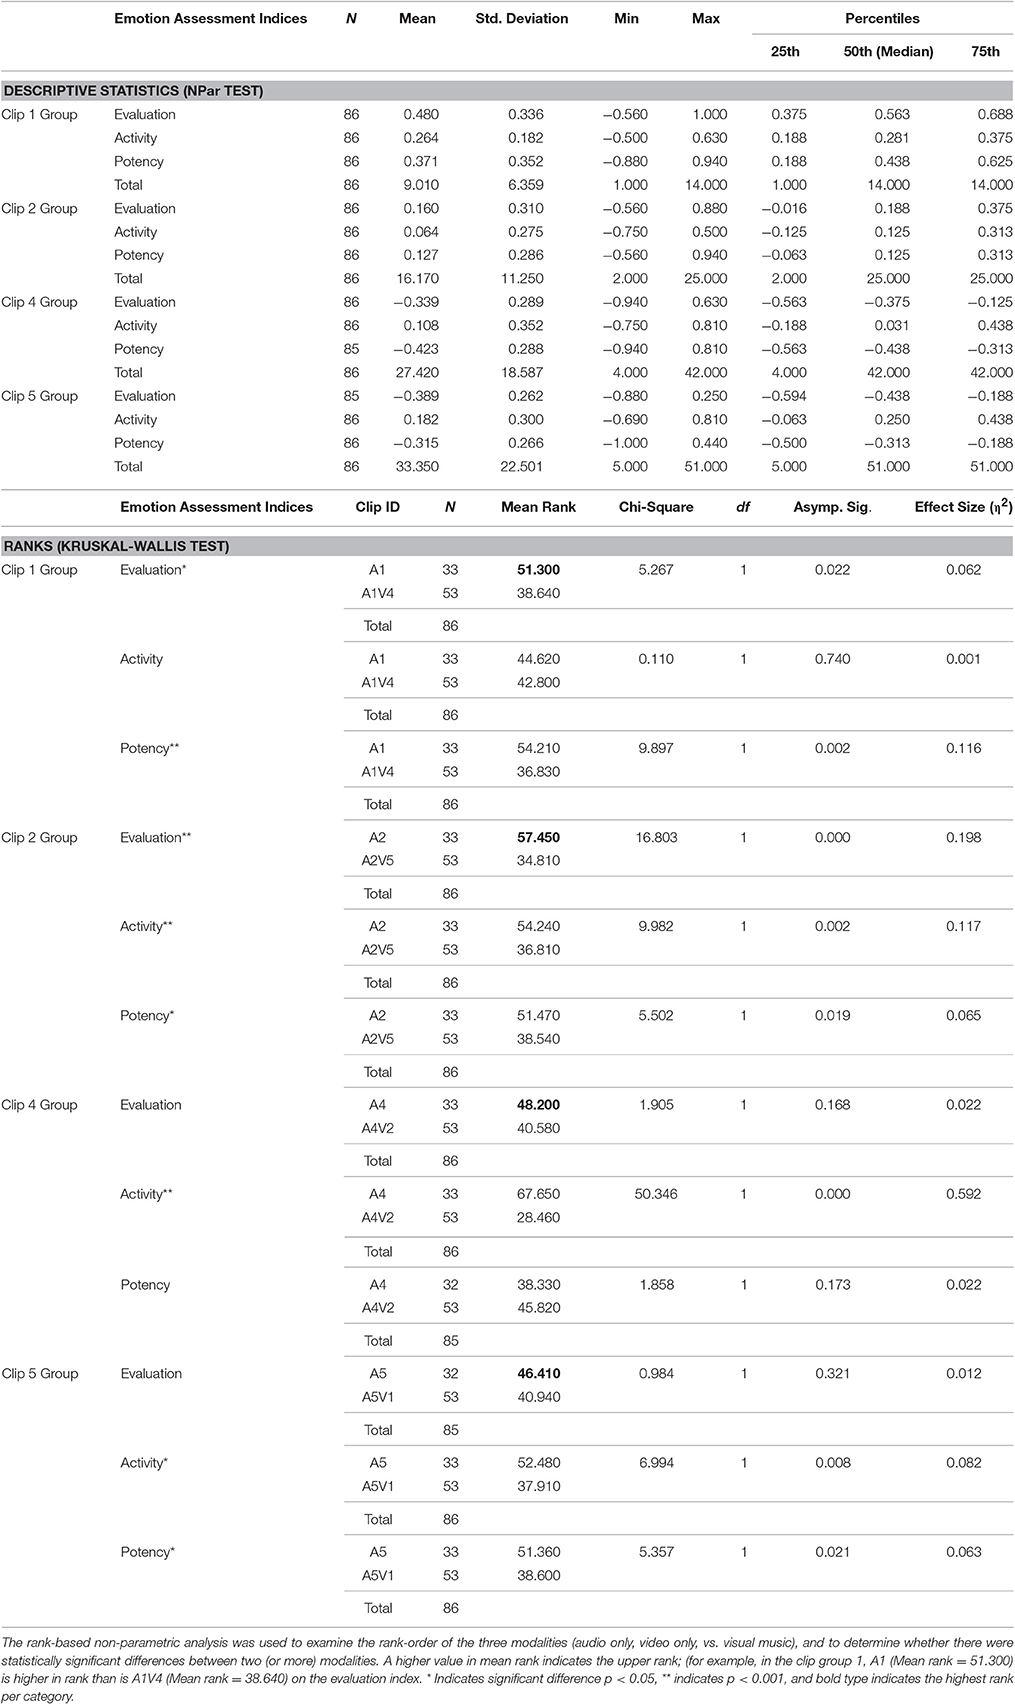
Table 11. Results of the Kruskal-Wallis Test comparing the effect of the emotional meaning of clips between auditory modality and cross-modality (altered synchronization) on the three perceived emotion assessment indices (evaluation, activity, and potency).
The results of the comparison between auditory-channel only and altered (cross-binding) synchronization cross-modal stimuli revealed eight (out of 12) cases of statistically significant differences on the evaluation, activity, and potency indices (Table 11). In all clip groups, the cross-modal stimuli showed a lower mean rank than audio-only in the same group on the evaluation index. A more detailed investigation of the effects of the individual clips on three indices was conducted via a one-way ANOVA, and the result thereof will be provided separately (Table S3).
Similarly to Figure 3, the scatter plot representation of the original five visual music clips in 2D quadrants (valence and arousal dimensions) per modality (visual only, audio only, and visual music) is shown in Figure 6 as a simple representation of the overall emotion information derived from the clips. Emotional meaning aspects of each stimuli using the evaluation, activity and potency indices, and following the three media combination conditions (congruence, complementation, contest), are illustrated as bar graphs in Figure 7.
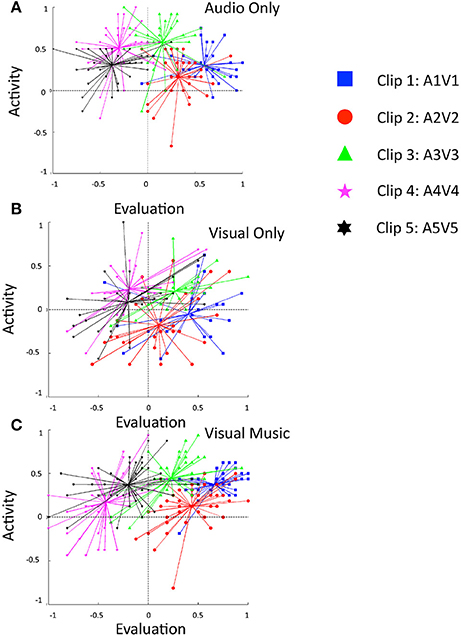
Figure 6. Comparisons of immanent emotions in the three clip stimuli using the evaluation and activity indices (circumplex method) for the modalities. (A) audio-only, (B) visual-only, and (C) visual music (cross-modal stimuli), represented by blue square (happy, clip 1), red disk (relaxed, clip 2) green triangle (vigorous, clip 3), pink star (clip 4, no target emotion), and black six-pointed star (clip 5, no target emotion). The symbols show the subjects' evaluations and activity index values for each clip.
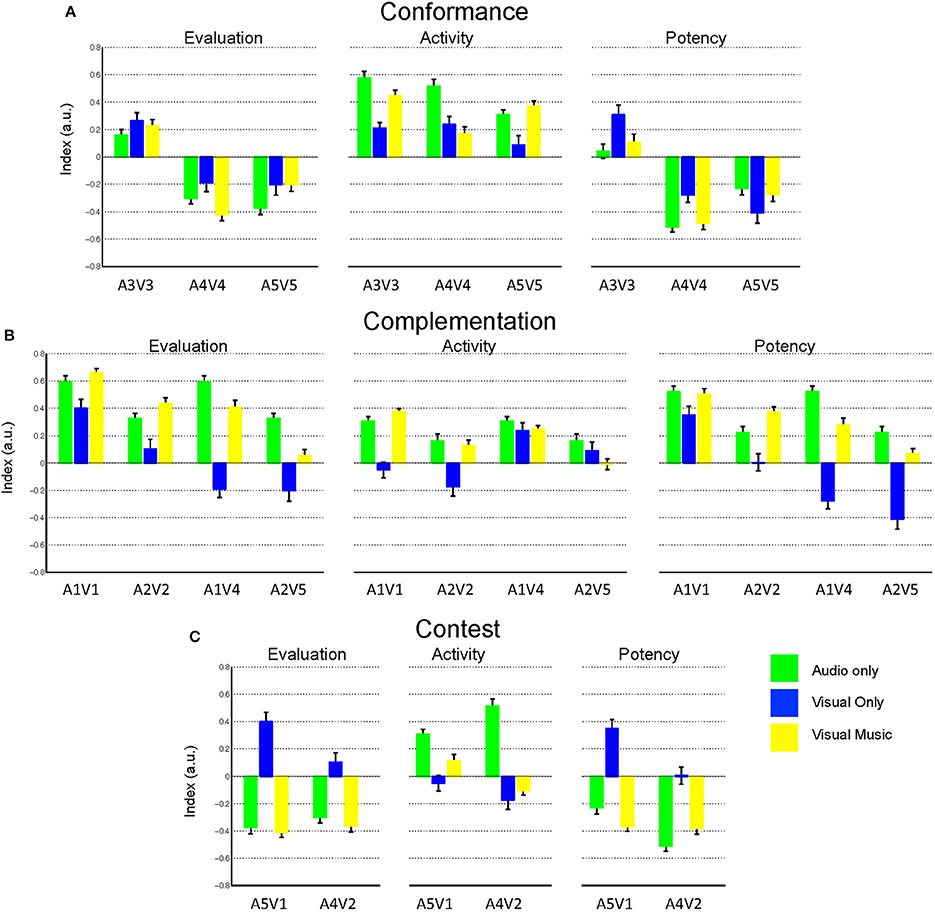
Figure 7. Bar graph summary of the immanent emotion for the nine visual music stimuli using evaluation, activity, and potency for the combination conditions of (A) conformance, (B) complementation and (C) contest. Data are shown as mean ± s.e.m. The mean increase of evaluation index was observed for clips A1V1 and A2V2 compared to their respective unimodal responses.
Compactness Check
We used the silhouette index to quantify the quality of clustering for each mode of presentation within the 2D plane (Figure 6). For each clip, the silhouette value was obtained from each subject's response by using the evaluation and activity indices (Table 9), and returned a value representing the compactness (cohesion in emotional rating) and separation (differentiation from other clip responses) of the subjects' responses for different modality or different spatio-temporal combinations (such as separating original auditory-visual synchronizations into altered combinations) for each clip per modality.
The clustering analysis shown in Table 12 indicates that the audio only category (sil = 0.085) and original visual music category (sil = 0.045) were better clustered overall compared to the visual only category (sil = −0.076) and the altered visual music category (sil = −0.066). In particular, clip 1 showed the best clustering score of all the clips for the audio-only and visual music categories, indicating that its emotional connotation was best recognized by the subjects.
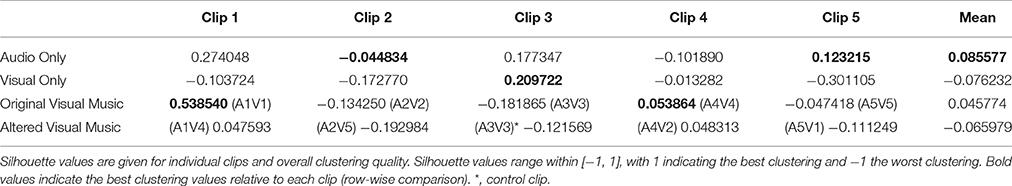
Table 12. Silhouette clustering index values using 2D factors (evaluation and activity) rating indices for the data presented in Figure 6.
We then checked the compactness of each clip based on the average distances between the mean rating of each clip (centroid) and the subject rating using Euclidean distance and the indices evaluation, activity, and potency as dimensions; this estimation was performed for each clip and for each modality. The A1V1 and A2V2 visual music integrations were revealed to be the most compact scores (clustering and average distribution) in all other modal categories.
Discussion
Enhancement Effect Hypothesis Verification
We used three major indices (evaluation, activity, and potency) to thoroughly quantify the aesthetic/emotional meanings of abstract synthetic visual music clips in this study. To identify any proof of the enhancement effect, we looked for heightened mean or median scores for auditory-visual compared to other comparable unimodal scores for subjects' responses on the evaluation index because it is valence factor, which indicates the “likeness” characteristic of emotion. We also considered compactness via a clustering analysis and an average distance assessment to inspect the enhancement effect in relation to congruency in valence and arousal information by inspecting media combination conditions (congruence, complementation, and contest).
In our study, three clips were categorized in the congruence condition (A3V3, A4V4, and A5V5), four clips in complementation, and two clips in the contest condition (see Table 6, Figure 7, and Figure S1). These three clips exhibited no indication of higher emotional perceptive responses in both mean and median comparisons in the valence level (Tables 8, 10). However, with regard to the median rank, A3V3 and A5V5 showed higher mean ranks than did the other modalities (Table 10, bold type). With regard to clustering, only A4V4 had a higher score compared to other modalities (Table 12), and none of them showed good compactness (Table 13). None of these three clips ranked higher than did the other modalities for more than two of the four different assumptions (mean comparison, median rank comparison, clustering score, and compactness score) to check an enhancement effect. Therefore, our result seems to contradict our original hypothesis that the enhancement effect would be reliant on the congruent media combination condition in valence and arousal throughout our experiment results.
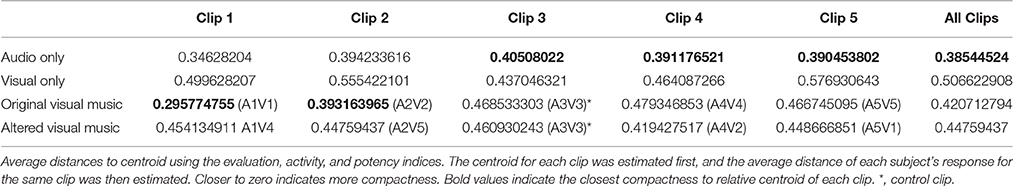
Table 13. Compactness of response.
However, in this study, we found a great likelihood of valence and texture/control (evaluation and potency) information assessments of the visual music linked to the polarity of the auditory channel information in the contest conditions (Figure 7). Although the means and median ranks of evaluation, activity, and potency of visual music fluctuated between the corresponding indices' values of the two unimodal channels in most cases (Tables 8, 9, and Figure 7), we observed a few possible heightened emotional perception cases (for example, positive-augmentation or negative-diminishment on emotional aspect factors). “A1V1” showed a positively augmented mean value in the evaluation (valence), the highest median rank in the evaluation (valence), and the strongest compactness (both clustering and average distance) compared to its comparable unimodal clips (Tables 8, 9, 12, 13); “A2V2” showed a positively augmented mean value for evaluation, the highest media rank in the evaluation, and the smallest average distance (highest compactness) compared to unimodal stimuli. “A1V1” and “A2V2” both belong to the complementation combination condition with congruency in valence (positive) and incongruency in arousal [active (+) in audio and passive (−) in visual]. “A4V4,” in the conformance condition, showed more negative values in evaluation, and the highest clustering density (Tables 8, 9). “A5V1,” in a contest condition, showed more increased negative values in the evaluation and potency indices, but its clustering density and general mean-distance results indicated that perceived emotions were widespread compared to corresponding dual unimodal sources. For all of the other integrations, the visual music emotional perception evaluation rate showed various degrees in levels of integration formations (Figure 7). Overall, these results indicate that synchronizing audio and video information in the complementation combination condition could show instances of heightened perceptive emotion (enhancement effect) of multimodal perception in our study.
Cross-Modal Interplays
In our investigations, we observed a few notable results: First, we observed an auditory dominant polarization tendency, consistent with a few previous studies demonstrating auditory dominance over abstract vision in the temporal and perceptual processing of multimodalities (Marshall and Cohen, 1988; Repp and Penel, 2002; Somsaman, 2004). Since visual music is an abstract animation representing the purity of music by nature, it may be imperative for visual music to have audio channel information conveying stronger affective meanings (evaluation, activity, and potency values) via visual channel information. Nonetheless, the differences in emotional information on arousal (activity index) between the auditory and visual modalities left the auditory channel emotion information with a higher arousal value, hence dominating the visual channel and transferring affective meaning toward the overall emotional perception of cross-modal perception (the absolute mean value of activity for the auditory channel always showed a greater level than did the visual channel in all nine visual music presentations, and the mean rank of audio only was always higher than was visual only, as seen in Tables 8, 9).
Second, from the compactness response and silhouette analysis, we found that the overall perceptual grouping of “gestalt” (whole beauty) or “schema” (conceptual frameworks for expectations) in auditory-visual domains showed disperse responses as a result of the altered, cross-matched stimuli compared to the original integrations. This indicates the interplay of semantic and structural congruency (sharing temporal accent patterns) between auditory and visual information in forming the focus of attention in cross-modal perception as cognitive psychologists implied good gestalt principles (see Cohen, 2001, p. 260). In our finding, the spatiotemporal information in the arbitrary cross-matching could not assemble into good synchronous groupings in structural and semantic features with temporal cues and movements (e.g., tempo, directions, dynamic); hence, it impeded creating better interplay focus of attention compared to the original stimuli. In particular, the arbitrary integration by cross-matching audio and video channel information from different sources created semantic and structural asynchronous distraction in multisensory perceptional grouping thus resulting in “worse” aesthetic emotion (e.g., A5V1).
Finally, we found two cases of the positive enhancement effect in aesthetic perception resulting from the functions of information integration (auditory and visual) in this experiment, namely A1V1 and A2V2. They had contrary polarity for activity values [audio only activity (+) vs. visual only activity (−)], but evaluation (and potency) exhibited congruency in their polarity [all positive (+)]. This suggests that positive congruency in valence (and texture/control) information with uncompetitive discrepancy in arousal levels between the visual and audio channels might trigger the enhancement effect in aesthetic emotion appraisals (see Figure 8). This finding possibly relates to the art rewarding hypothesis which a state of uncertainty recovers into predictable patterns resulting to rewarding effect of increased expectedness (Van de Cruys and Wagemans, 2011). The congruency in valence and texture/control aspects in our A1V1 and A2V2 might, for example, implicitly stabilize the conjoint gestalt or schema that people use to form expectations or predictions whereas the substantial differences in the arousal aspect between the two modalities might implicitly emphasize elements that alter the continuous coding of predictive errors and recovering to predictable patterns. In other words, we assume that violations of prediction (predictive error) resulted from differences in any part where the two channels information return to a state of rewarding due to the formation of stable gestalt/schema. Other three original visual music stimuli did not indicate a strong enhancement effect in mean valence levels or median ranks although some showed improved compactness in silhouette index compared to its comparable unimodal stimuli (e.g., A4V4).
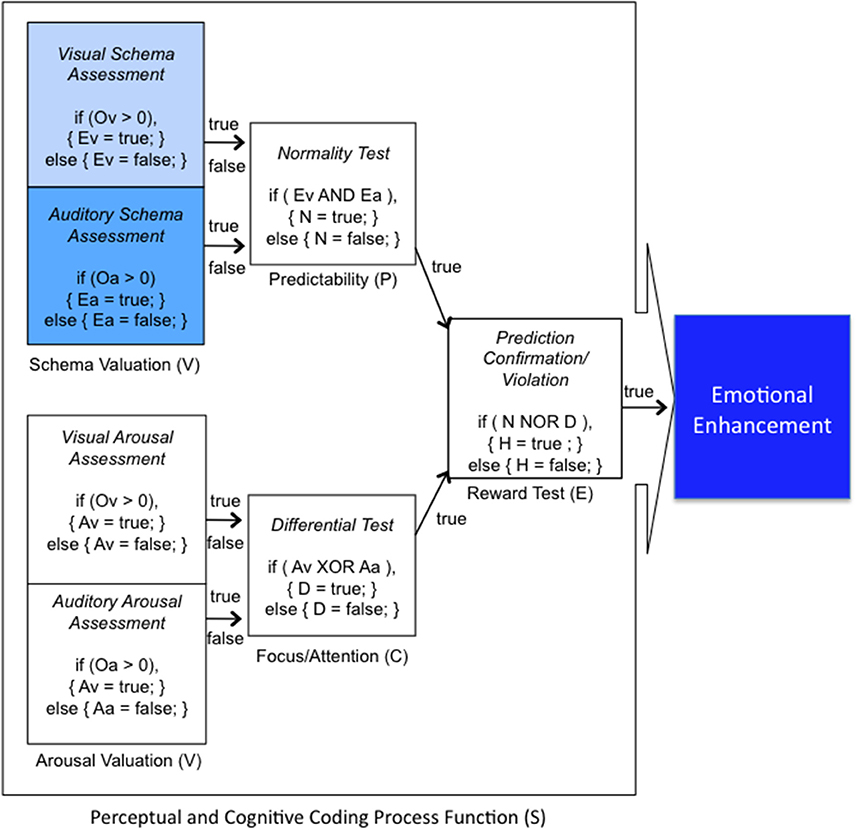
Figure 8. Hypothesized conditional enhancement effects as added values in visual music. The congruency in valence and texture/control aspects might stabilize the conjoint gestalt or schema to form good predictability (P) whereas the substantial differences in the arousal aspect between the dual modalities might emphasize focus/attention (C) that alter the continuous coding of predictive errors and recovering to predictable patterns for rewarding (E).
General Discussion
Our study inspected the two unimodal channel interplays as a functional-information-integration apparatus by examining an enhancement effect in cross-modal evaluation processes of emotional visual music experience. During the two experiments, we could see that visual music can embody various structural variables that may cause important interactions between perceptual and cognitive aspects of the dual channels. The directive design guidelines we used to create target emotional stimuli in Experiment 1 (Tables 1, 2) indicate numerous parameters that can be used when creating visual music. The use of three extracted indices (evaluation, activity, and potency) to appraise ambiguous emotional meanings was effective to assess both the artwork and the subjects' responses in the study. It was also encouraging that we found a positive correlation between the evaluation index and the lateral frontal upperAlpha power differences in this study. Despite the small number of subjects in the study, the promising results from the frontal alpha asymmetry and its correlation with valence might encourage the inclusion of a wider range of physiological measurements to study the complex interactions between the external sensorial/perceptional context and the internal cognitive modulation/coding mechanism of aesthetic experience (see Figure 9 for an illustration of the partial potential interactions of sensorial context and cognitive coding, and Figure S5 for the temporal dynamics of spectral and spatial activation in EEG).
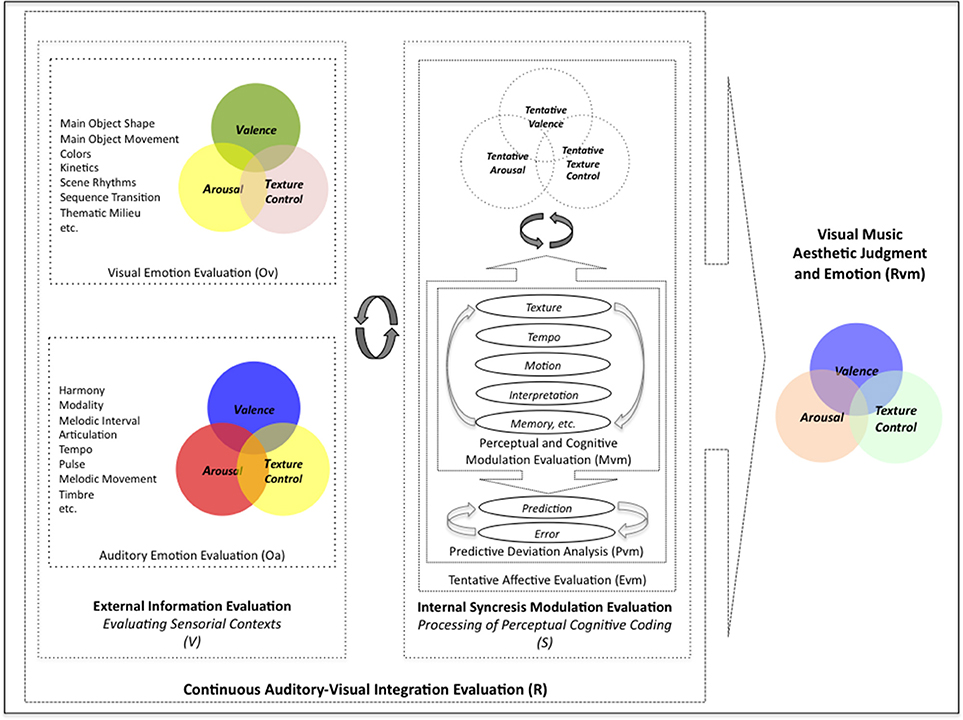
Figure 9. A hypothesized functional-information-integration process within our model of continuous auditory-visual modulation integration perception. Visual Music aesthetic experience requires multi-sensory perceptual, cognitive judgment, and processing that involve a number of continuous processing stages such as affective analysis (in valence, activity, and potency), perceptual and cognitive modulation analysis, and predictive deviation analysis.
Our findings demonstrated the role of and interplays between the valence and arousal information in emotional evaluation of the auditory-visual aesthetic experience. The common effects of congruent positive valence between auditory and visual domains refer to good quality in gestalt/schema formation. Stronger arousal level of auditory channel information not only outweighed the visual channel information in making affective (valence and texture) judgments of visual music, but also ensued uncompetitive focus/attention to result increased states of positively predictable patterns. Hence, arousal levels and conditions hold a key role in modulating the excitement of affective emotion perception in visual music experience. Consequently, taking both dimensions of emotion (valence and arousal) into account is necessary to determine whether abstract auditory-visual stimuli carry strong, distinctive emotional meanings in particular.
As suggested by scholars in the field of aesthetic judgment and perception, emotion studies using works of art require particular insightful appraisal tools that should differ from depictive or prepositional expressions, such as pictures or languages (Takahashi, 1995). Hence, to infer emotional meanings from and to inspect the aesthetic perceptions of visual music as affective visual music, a careful choice of assessment factors for aesthetic perceptions of abstract visual music stimuli is crucial. More efforts to design refined and uncomplicated assessment apparatus for visual music perception would be challenging, yet worthy. The limitation of our mono-cultural background (college students in South Korea) makes it unable to generalize our findings as a truly representative universal aesthetic perception rule. Therefore, considering the findings in conjunction with all possible media integration conditions (Figure S1) will help to identify universal principles in visual music aesthetic perception. In addition, further investigations of how the interaction of three aspects of emotional meaning (valence, arousal, and texture/control) affect aesthetic emotion whilst considering temporal factors of visual music may also expand the understanding of the perceptual process in aesthetic experiences.
Conclusion
There has been a significant development in theories and experiments that explain the process of aesthetic perception and experience during the past decade (for a review, see Leder and Nadal, 2014; nonetheless, research studies on emotion elicitation have long relied on inflexible, static, or non-intentionally designed uni/cross-modal stimuli. Due to the lack of sufficient research evidence, aesthetic researchers have been calling for more sophisticated investigations of the interplay of perceptual and cognitive challenges with using novel, complex, and multidimensional stimuli (Leder et al., 2004; Redies, 2015). The need for new empirical approaches in aesthetic science requires an extensive amount of principled research effort to study the numerous components of emotion and competencies via several measurements, as Scherer and Zentner (2001) explained. The investigations of the process whereby art evokes emotion using a novel attempt in cross-modal aesthetic studies hence necessitate extensive research efforts with certain measurement competencies as important aspects.
Our empirical study of audio-visual aesthetic perception has a cross-disciplinary approach including music, visual aspects, aesthetics, neuroscience, and psychology and takes more of a holistic than an elementary approach; this is unconventional in several ways when compared to classical, disciplined paradigms. Initially, strong demands from commercial industries for practical psychotherapeutic contents cued our research team to bring artistic issues into the science laboratory. It inspired us to create artwork with verified, literature-based correlations with positive emotions, and to find ways to validate the ambiguous nature of visual music via the observable assessment of suitable measurements to translate it into psychological and cognitive science investigations. The aesthetic experience is known to have three components (artist, artwork, and beholder), and our study involved all three aspects; however, psychological aesthetic studies have historically been related to how art evokes an emotional response from viewers instead of exploring the factors that motivate individuals to produce art (see Shimamura, 2012, p. 24). When we demonstrated a basis for the directive production of emotional visual music to our artists, they understandably complied with the intention of the emotional stimuli production (creating target-emotion eliciting visual music), and took the directive settings of the structural/formal components of visual stimuli and music (see Tables 2, 3) into account in their artistic activity (which involves well-developed and highly complex cognitive processes). Hence, we can claim that our emotional visual music stimuli constitute at least three predominant approaches in experimental aesthetic theories—expressionist, contextual, and formalist. Several theories have suggested models that explain human aesthetic perception and judgment processes (Leder et al., 2004; Chatterjee and Vartanian, 2014; Leder and Nadal, 2014; Redies, 2015), calling for more diverse empirical investigations that adopt various kinds of approaches. However, using real artwork in empirical research has generated disappointing results, although it is an interesting topic for artists and psychologists, and there is a need to extend previous approaches in emotional aesthetics to understand hedonic properties, cognitive operations, and greater compositional potential (for a review, see Leder et al., 2004). However, through our study, we believe that we have determined that the composition of abstract visual clips with directive design could cover a range of emotions, which can be assessed by evaluation, activity, and potency indices, and has the potential to be used as stimuli for more complex continuous response measures. Hence, we posit that properly controlled, well-designed visual music stimuli may be useful for future psychological and cognitive research studying the continuous reciprocal links between affective experience and cognitive processing, and specifically to understand how collective abstract expressions stimulate a holistic experience for audiences. In particular, because visual music has temporal narratives, it could be useful for future research to inspect the temporal dynamics of brain activity, skin conductance responses, changes in respiration or skin temperature as objective (autonomic) measures of emotional experiences in holistic information processing of the subject's state in relation to auditory and visual perception property controls. If possible, constructing a database of visual music with emotional meanings that provides a standardized set of abstractive auditory visual stimuli with accessible controls of various contextual parameters might be beneficial for future aesthetic emotion and aesthetic appreciation studies. The use of validated holistic stimuli and structural property controls may allow for investigations of integration synthesizing functions with semantic and syntax processing in auditory-visual aesthetic evaluation mechanisms.
To the best of our knowledge, our study is the first to propose a paradigm for the composition of abstract visual music with emotional validation at the unimodal, cross-modal, psychological and neurophysiological levels. Based on the findings of this study, we suggest that controlled, affective visual music can be a useful tool for investigating cognitive processing in affective aesthetic appraisals.
Ethics Statement
The study was approved by the Institutional Review Board of Korea Advanced Institute of Science and Technology. All our subjects were fully informed that they were participating in a survey for a study investigating aesthetic perception for a scientific research in both written and verbal forms. All participants signed a written informed consent form prior to engaging in the experiment.
Author Contributions
The conception or design of the work: IL, CL, and JJ. The acquisition, analysis, or interpretation of data for the work: IL and CL. Drafting the work: IL. Revising it critically for important intellectual content: IL and CL. Final approval of the version to be published: IL, CL, and JJ. Supervising the work overall: JJ. Agreement to be accountable for all aspects of the work in ensuring that questions related to the accuracy or integrity of any part of the work are appropriately investigated and resolved: IL, CL, and JJ.
Funding
The research and creation of the abstract visual music (positive) contents used in this study were financed by the company Amore Pacific Corporation, 181 Hanggangro-2-ga, Yongsan-gu, Seoul, South Korea. The financial support included the research staff's remuneration, artists' remuneration, other technical facilities for the creation of multimedia contents and electrophysiological recordings subjects remuneration.
Conflict of Interest Statement
The authors declare that the research was conducted in the absence of any commercial or financial relationships that could be construed as a potential conflict of interest.
Acknowledgments
The authors would like to thank Jangsub Lee and Hyosub Lee (visual animation artists for “V1,” “V2,” and “V3”), aRing (audio artist for “A1,” “A2,” and “A3”), Jinwon Lee (a.k.a. Gajaebal, visual music artist for “A4V4” and “A5V5”), and Jiyun Shin, Soyun Song, and Seongmin for assisting with the researching the production guidelines for visual music content. We would also like to thank Jaewon Lee, Dongil Chung, and Mookyung Han for assisting with the EEG data recording and analysis. The abstract visual music contents (A1V1, A2V2, and A3V3) were used for a marketing campaign comprising a series of on-line (Internet) advertisements for a cosmetic skin product from Amore Pacific Corporation; however, our research on the newly created abstract visual music was not on the orders of Amore Pacific. The campaign using our three positive visual music productions was an outstanding marketing success in South Korea, with over 250,000 people viewing the advertisements and over 20,000 people downloading the content (Sekyung Choi and Yoon, 2008).
Supplementary Material
The Supplementary Material for this article can be found online at: http://journal.frontiersin.org/article/10.3389/fpsyg.2017.00440/full#supplementary-material
Figure S1. Possible situations in three (conformance, complementation, and contest) conditions of cross-modal combination.
Figure S2. Target emotion characteristics on the 2D (valence and arousal) plane illustration.
Figure S3. Survey questionnaire with 13 pairs of bipolar sensorial adjectives. The questionnaire was initially designed in US English and was presented to the participants in the Korean language. The unpleasant-pleasant pair was only additional in experiment 2 surveys.
Figure S4. Experiment design for stimuli clip presentation and rating.
Figure S5. Composition of the three emotional aspect indices (evaluation, activity, and potency) and the method of rating conversion. A total of 12 pairs of bipolar ratings were used to extract the evaluation, activity, and potency indices. The indices were rescaled from the nine-point scales to a range of [−1, 1] as shown.
Figure S6. Temporal and topographic responses to visual music presentations. Average normalized power for 10-s non-overlapping epochs during the presentation of clip 1(a), clip 2(b), and clip 3(c)'s visual music. EEG power is estimated using a FFT method for each 10-s non-overlapping periods from baseline to end of clip presentation. The two first epochs (20 s) are averaged to provide a baseline power for each frequency range (theta, lowApha1, lowAlpha2, UpperAlpha, and Beta); all power values are then normalized according to baseline power and 10log10 transform (dB). The topographic positioning of EEG leads is shown in the inset (bottom right corner). Time (bottom label) indicates the center of the 10-s epoch. The dashed line represents the start of the clip presentation after baseline resting.
Table S1. Independent T-test result of two groups' responses to the control clip.
Table S2. Unreported results of K-W test across modalities results.
Table S3. One-way ANOVA analysis results for comparing clips within the same modality.
References
Anderson, N. H. (1981). Foundations of Information Integration Theory. San Diego, CA: Academic Press.
Bachorik, J. P., Bangert, M., Loui, P., Larke, K., Berger, J., Rowe, R., et al. (2009). Emotion in motion: investigating the time-course of emotional judgments of musical stimuli. Music Percept. Interdisc. J. 26, 355–364. doi: 10.1525/mp.2009.26.4.355
Baumgartner, T., Esslen, M., and Jäncke, L. (2006a). From emotion perception to emotion experience: emotions evoked by pictures and classical music. Int. J. Psychophysiol. 60, 34–43. doi: 10.1016/j.ijpsycho.2005.04.007
Baumgartner, T., Lutz, K., Schmidt, C. F., and Jäncke, L. (2006b). The emotional power of music: how music enhances the feeling of affective pictures. Brain Res. 1075, 151–164. doi: 10.1016/j.brainres.2005.12.065
Baumgartner, T., Willi, M., and Jäncke, L. (2007). Modulation of corticospinal activity by strong emotions evoked by pictures and classical music: a transcranial magnetic stimulation study. Neuroreport 18:261. doi: 10.1097/WNR.0b013e328012272e
Block, B. (2013). The Visual Story: Creating the Visual Structure of Film, TV and Digital Media. Burlington, MA: CRC Press.
Bolivar, V. J., Cohen, A. J., and Fentress, J. C. (1994). Semantic and formal congruency in music and motion pictures: effects on the interpretation of visual action. Psychomusicology 13:28.
Boltz, M., Schulkind, M., and Kantra, S. (1991). Effects of background music on the remembering of filmed events. Mem. Cogn. 19, 593–606. doi: 10.3758/BF03197154
Brauchli, P., Michel, C. M., and Zeier, H. (1995). Electrocortical, autonomic, and subjective responses to rhythmic audio-visual stimulation. Int. J. Psychophysiol. 19, 53–66. doi: 10.1016/0167-8760(94)00074-O
Brougher, K., Strick, J., Wiseman, A., Zilczer, J., and Mattis, O. (2005). Visual Music: Synaesthesia in Art and Music Since 1900. London: Thames & Hudson.
Bunt, L., and Pavlicevic, M. (2001). Music and Emotion: Perspectives from Music Therapy. New York, NY: Oxford University Press.
Chatterjee, A., and Vartanian, O. (2014). Neuroaesthetics. Trends Cogn. Sci. 18, 370–375. doi: 10.1016/j.tics.2014.03.003
Coan, J. A., and Allen, J. J. (2004). Frontal EEG asymmetry as a moderator and mediator of emotion. Biol. Psychol. 67, 7–50. doi: 10.1016/j.biopsycho.2004.03.002
Cohen, A. J. (2001). “Music as a source of emotion in film,” in Music and Emotion: Theory and Research, eds P. N. Juslin and J. A. Sloboda (New York, NY: Oxford University Press), 249–272.
Delorme, A., and Makeig, S. (2004). EEGLAB: an open source toolbox for analysis of single-trial EEG dynamics including independent component analysis. J. Neurosci. Methods 134, 9–21. doi: 10.1016/j.jneumeth.2003.10.009
Gabrielsson, A., and Lindstrom, E. (2001). “The influence of musical structure on emotional expression,” in Music and Emotion: Theory and Research, eds P. N. Juslin and J. A. Sloboda (New York, NY: Oxford University Press), 223–248.
Gross, J. J., and Levenson, R. W. (1995). Emotion elicitation using films. Cogn. Emot. 9, 87–108. doi: 10.1080/02699939508408966
Hevner, K. (1935). Experimental studies of the affective value of colors and lines. J. Appl. Psychol. 19:385. doi: 10.1037/h0055538
Klimesch, W., Doppelmayr, M., Russegger, H., Pachinger, T., and Schwaiger, J. (1998). Induced alpha band power changes in the human EEG and attention. Neurosci. Lett. 244, 73–76. doi: 10.1016/S0304-3940(98)00122-0
Kline, J. P., Blackhart, G. C., Woodward, K. M., Williams, S. R., and Schwartz, G. E. (2000). Anterior electroencephalographic asymmetry changes in elderly women in response to a pleasant and an unpleasant odor. Biol. Psychol. 52, 241–250. doi: 10.1016/S0301-0511(99)00046-0
Krause, C. M., Viemerö, V., Rosenqvist, A., Sillanmäki, L., and Aström, T. (2000). Relative electroencephalographic desynchronization and synchronization in humans to emotional film content: an analysis of the 4-6, 6-8, 8-10 and 10-12 Hz frequency bands. Neurosci. Lett. 286, 9–12. doi: 10.1016/S0304-3940(00)01092-2
Laurienti, P. J., Kraft, R. A., Maldjian, J. A., Burdette, J. H., and Wallace, M. T. (2004). Semantic congruence is a critical factor in multisensory behavioral performance. Exp. Brain Res. 158, 405–414. doi: 10.1007/s00221-004-1913-2
Leder, H., and Nadal, M. (2014). Ten years of a model of aesthetic appreciation and aesthetic judgments: the aesthetic episode–developments and challenges in empirical aesthetics. Brit. J. Psychol. 105, 443–464. doi: 10.1111/bjop.12084
Leder, H., Belke, B., Oeberst, A., and Augustin, D. (2004). A model of aesthetic appreciation and aesthetic judgments. Brit. J. Psychol. 95, 489–508. doi: 10.1348/0007126042369811
Lundholm, H. (1921). The affective tone of lines: experimental researches. Psychol. Rev. 28, 43. doi: 10.1037/h0072647
Lyman, B. (1979). Representation of complex emotional and abstract meanings by simple forms. Percept. Mot. Skills 49, 839–842. doi: 10.2466/pms.1979.49.3.839
Marshall, S. K., and Cohen, A. J. (1988). Effects of musical soundtracks on attitudes toward animated geometric figures. Music Percept. 6, 95–112. doi: 10.2307/40285417
Osgood, C. E., Suci, G. J., and Tannenbaum, P. H. (1957). The Measurement of Meaning. Urbana, IL: University of Illinois Press.
Pereira, C. S., Teixeira, J., Figueiredo, P., Xavier, J., Castro, S. L., and Brattico, E. (2011). Music and emotions in the brain: familiarity matters. PLoS ONE 6:e27241. doi: 10.1371/journal.pone.0027241
Poffenberger, A. T., and Barrows, B. (1924). The feeling value of lines. J. Appl. Psychol. 8:187. doi: 10.1037/h0073513
Posner, J., Russell, J. A., and Peterson, B. S. (2005). The circumplex model of affect: an integrative approach to affective neuroscience, cognitive development, and psychopathology. Dev. Psychopathol. 17, 715–734. doi: 10.1017/S0954579405050340
Redies, C. (2015). Combining universal beauty and cultural context in a unifying model of visual aesthetic experience. Front. Hum. Neurosci. 9:218. doi: 10.3389/fnhum.2015.00218
Repp, B. H., and Penel, A. (2002). Auditory dominance in temporal processing: new evidence from synchronization with simultaneous visual and auditory sequences. J. Exp. Psychol. Hum. Percept. Perform. 28, 1085–1099. doi: 10.1037/0096-1523.28.5.1085
Rottenberg, J., Ray, R. R., and Gross, J. J. (2007). “Emotion elicitation using films,” in The Handbook of Emotion Elicitation and Assessment, eds J. A. Coan and J. J. B. Allen (New York, NY: Oxford University Press), 9–28.
Sammler, D., Grigutsch, M., Fritz, T., and Koelsch, S. (2007). Music and emotion: electrophysiological correlates of the processing of pleasant and unpleasant music. Psychophysiology 44, 293–304. doi: 10.1111/j.1469-8986.2007.00497.x
Scherer, K. R., and Zentner, M. R. (2001). “Emotional effects of music: production rules,” in Music and Emotion: Theory and Research, eds P. N. Juslin and J. A. Sloboda (New York, NY: Oxford University Press), 361–392.
Schmidt, L. A., and Trainor, L. J. (2001). Frontal brain electrical activity (EEG) distinguishes valence and intensity of musical emotions. Cogn. Emot. 15, 487–500. doi: 10.1080/02699930126048
Sekyung Choi, S. L., and Yoon, E. (2008). “Research of analysis on future outlook and labor demands in new media advertising industry in Korea,” in KBI Research, ed J. Park (Seoul: Korea Creative Content Agency).
Shimamura, A. P. (2012). “Toward a science of aesthetics: issues and ideas,” in Aesthetic Science: Connecting Minds, Brains, and Experience, eds A. P. Shimamura and S. E. Palmer (New York, NY: Oxford University Press), 3–28.
Sloboda, J. A., and Juslin, P. N. (2001). “Psychological perspectives on music and emotion,” in Music and Emotion: Theory and Research, eds P. N. Juslin and J. A. Sloboda (New York, NY: Oxford University Press), 71–104.
Somsaman, K. (2004). The Perception of Emotions in Multimedia: An Empirical Test of Three Models of Conformance and Contest. Doctoral Thesis, Case Western Reserve University.
Takahashi, S. (1995). Aesthetic properties of pictorial perception. Psychol. Rev. 102, 671–683. doi: 10.1037/0033-295X.102.4.671
Taylor, K. I., Moss, H. E., Stamatakis, E. A., and Tyler, L. K. (2006). Binding crossmodal object features in perirhinal cortex. Proc. Natl. Acad. Sci. U.S.A. 103, 8239–8244. doi: 10.1073/pnas.0509704103
Van de Cruys, S., and Wagemans, J. (2011). Putting reward in art: a tentative prediction error account of visual art. Iperception 2, 1035–1062. doi: 10.1068/i0466aap
van Honk, J., and Schutter, D. J. (2006). From affective valence to motivational direction. The frontal asymmetry of emotion revised. Psychol. Sci. 17, 963–965. doi: 10.1111/j.1467-9280.2006.01813.x
Wexner, L. B. (1954). The degree to which colors (hues) are associated with mood-tones. J. Appl. Psychol. 38:432. doi: 10.1037/h0062181
Wheeler, R. E., Davidson, R. J., and Tomarken, A. J. (1993). Frontal brain asymmetry and emotional reactivity: a biological substrate of affective style. Psychophysiology 30, 82–89. doi: 10.1111/j.1469-8986.1993.tb03207.x
Winkler, I., Jäger, M., Mihajlovic, V., and Tsoneva, T (2010). Frontal EEG asymmetry based classification of emotional valence using common spatial patterns. World Acad. Sci. Eng. Technol. Available online at: https://www.researchgate.net/publication/265654104_Frontal_EEG_Asymmetry_Based_Classification_of_Emotional_Valence_using_Common_Spatial_Patterns
Keywords: visual music and emotion, aesthetic experience, auditory-visual perception, art and emotion, aesthetic perception, cross-modal integration, auditory-visual integration, music and emotion
Citation: Lee IE, Latchoumane C-FV and Jeong J (2017) Arousal Rules: An Empirical Investigation into the Aesthetic Experience of Cross-Modal Perception with Emotional Visual Music. Front. Psychol. 8:440. doi: 10.3389/fpsyg.2017.00440
Received: 14 October 2016; Accepted: 09 March 2017;
Published: 04 April 2017.
Edited by:
Mark Reybrouck, KU Leuven, BelgiumCopyright © 2017 Lee, Latchoumane and Jeong. This is an open-access article distributed under the terms of the Creative Commons Attribution License (CC BY). The use, distribution or reproduction in other forums is permitted, provided the original author(s) or licensor are credited and that the original publication in this journal is cited, in accordance with accepted academic practice. No use, distribution or reproduction is permitted which does not comply with these terms.
*Correspondence: Irene Eunyoung Lee, aXJlbmVsZWVAc29uaWNhcnQuY28=
Jaeseung Jeong, anNqZW9uZ0BrYWlzdC5hYy5rcg==