 Valtteri Hongisto
 Johanna Varjo3
 Annu Haapakangas
 Evan Benway
- 1Finnish Institute of Occupational Health, Turku, Finland
- 2Turku University of Applied Sciences, Turku, Finland
- 3Independent Researcher, Turku, Finland
- 4Plantronics, Inc., Santa Cruz, CA, United States
A certain level of masking sound is necessary to control the disturbance caused by speech sounds in open-plan offices. The sound is usually provided with evenly distributed loudspeakers. Pseudo-random noise is often used as a source of artificial sound masking (PRMS). A recent laboratory experiment suggested that water-based masking sound (WBMS) could be more favorable than PRMS. The purpose of our study was to determine how the employees perceived different WBMSs compared to PRMS. The experiment was conducted in an open-plan office of 77 employees who had been accustomed to work under PRMS (44 dB LAeq). The experiment consisted of five masking conditions: the original PRMS, four different WBMSs and return to the original PRMS. The exposure time of each condition was 3 weeks. The noise level was nearly equal between the conditions (43–45 dB LAeq) but the spectra and the nature of the sounds were very different. A questionnaire was completed at the end of each condition. Acoustic satisfaction was worse during the WBMSs than during the PRMS. The disturbance caused by three out of four WBMSs was larger than that of PRMS. Several attributes describing the sound quality itself were in favor of PRMS. Colleagues' speech sounds disturbed more during WBMSs. None of the WBMSs produced better subjective ratings than PRMS. Although the first WBMS was equal with the PRMS for several variables, the overall results cannot be seen to support the use of WBMSs in office workplaces. Because the experiment suffered from some methodological weaknesses, conclusions about the adequacy of WBMSs cannot yet be drawn.
Introduction
Noise and lack of acoustic privacy are typically the most adverse factors of work environment in open-plan offices (Pejtersen et al., 2006; Haapakangas et al., 2008; Bodin Danielsson and Bodin, 2009; Frontczak et al., 2012). Coworkers' speech is usually the most annoying noise source (e.g., Banbury and Berry, 2005; Kaarlela-Tuomaala et al., 2009; Pierrette et al., 2015; Hongisto et al., 2016a).
Evidence from experimental psychology suggests that irrelevant speech, i.e., background speech that is not useful to the performed task, has detrimental effects on cognitive performance (e.g., Martin et al., 1988; Salamé and Baddeley, 1989; Hongisto, 2005; Schlittmeier et al., 2008; Haka et al., 2009). The effects are not related to the sound pressure level (SPL) of speech but to the speech intelligibility (Colle, 1980; Ellermeier and Hellbrück, 1998; Hongisto, 2005; Schlittmeier et al., 2008; Hongisto et al., 2016b). Therefore, the room acoustic design of open-plan offices should aim at reducing intelligibility of speech beyond the distance where normal conversations are carried out (Hongisto et al., 2004; Virjonen et al., 2009; Keränen and Hongisto, 2013).
Speech intelligibility can be objectively estimated in offices by the Speech Transmission Index, STI, which can have values from 0.00 (no intelligibility) to 1.00 (perfect intelligibility). The measurement of STI has become an international practice instead of reverberation time in open-plan offices after 2012 (ISO 3382-3, 2012). Hongisto (2005) has suggested that STI values below 0.20 might be low enough to avoid the negative effects of background speech on cognitive performance. Various experiments have supported or partially supported this view (Haka et al., 2009; Jahncke et al., 2013; Haapakangas et al., 2014; Keus van de Poll et al., 2014; Ebissou et al., 2015; Schlittmeier and Liebl, 2015; Hongisto et al., 2016b).
A recent study including 21 offices provides evidence that noise disturbance is lower in offices where the distraction distance is smaller (Haapakangas et al., 2017). Distraction distance is an objective single-number quantity which describes the room acoustic quality of an open-plan office. It is measured according to ISO 3382-3 (2012). It expresses the distance, in meters, from a speaker where the STI falls below 0.50. The smaller the distraction distance is, the smaller is the floor area that a single speaker disturbs in the office space. The finding is very important because it provides strong evidence that investing in room acoustic quality can be profitable in a wide perspective. Because individual workplaces differ strongly in activity noise levels and work tasks, a causal link between distraction distance and noise disturbance may be difficult to find.
The reduction of STI and distraction distance can be achieved in open-plan offices by the simultaneous application of strong room absorption, adequate level and spectrum of sound masking (Virjonen et al., 2009; Keränen and Hongisto, 2013) and high screens surrounding the workstations. Based on abovementioned references, it is relatively easy to conclude and demonstrate that the increment of sound masking level is the easiest way of reducing the STI. Furthermore, Haapakangas et al. (2017) found that noise disturbance was lower in offices where the background noise level was higher. Their study involved background noise levels between 29 and 45 dB LAeq, where LAeq is the A-weighted equivalent sound pressure level. A-weighting is a standard method of expressing the sound level of sound using a single number. It takes the human hearing sensitivity for frequencies 20–20,000 Hz into account. It should be noted that masking levels above 45 dB are not recommended because they can lead to raised speech effort and do not increase the desired benefit of masking sound (Veitch et al., 2002; Bradley, 2003).
The positive effects of steady-state sound masking on cognitive performance and the disturbance of background speech have been observed in several laboratory experiments (see a short review of Hongisto et al., 2016b). These experiments involved nearly similar sound masking spectra, which had a slope of −5 dB per octave doubling within 125 and 8,000 Hz (curve REF in Figure 1A). There are also some field studies where the effects of room acoustic refurbishments, such as sound masking, on employees' perceptions were investigated before and after the refurbishment (Warnock, 1973; Keighley and Parkin, 1979; Lewis et al., 2003; Helenius and Hongisto, 2004; Hongisto, 2008; Hongisto et al., 2012; Vassie and Richardson, 2017). These studies give quite contradicting impression on the perception of sound masking. The main reasons are the differences in research methodology, type of masking sounds (spectra, levels), playback (headphones or loudspeakers) and control over the level. The refurbishments described by Helenius and Hongisto (2004), Hongisto (2008) and Hongisto et al. (2012) were followed by some positive changes in subjective outcomes, such as the disturbance caused by colleagues' speech. However, these studies lacked a control group so the causal effect of sound masking on subjective outcomes could not be suggested.
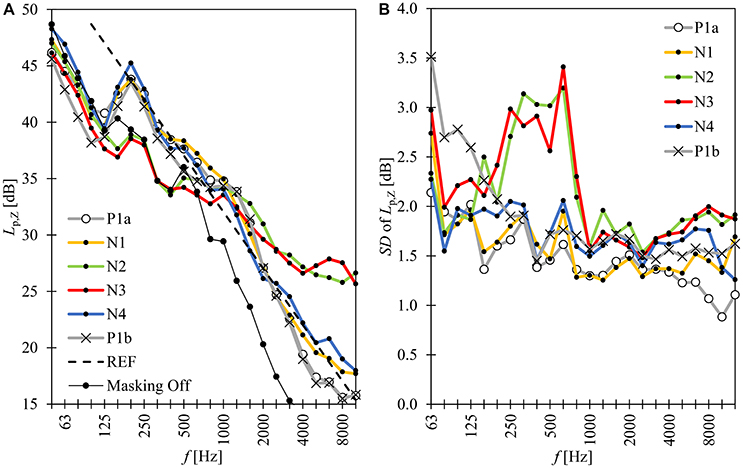
Figure 1. The measured spectra of the masking sounds over the 54 workstations. (A) Mean value and (B) standard deviation (SD). REF represents the slope −5 dB per octave doubling at a level of 44 dB LAeq. Masking Off corresponds to ventilation noise.
Sound masking is increasingly used in open-plan offices, and also in meeting and smaller office rooms, to reduce the distractions caused by irrelevant speech and to improve the speech privacy of confidential communication. Filtered pseudo-random noise, such as brown noise, is commonly applied as the sound masking signal because it is cheap to produce (royalty free) and it resembles ventilation noise. The steady-state nature of brown noise facilitates the habituation to the sound. Such a sound masking spectrum has been investigated in field conditions by, e.g., Helenius and Hongisto (2004), Hongisto (2008) and Hongisto et al. (2012). A laboratory study of Hongisto et al. (2015) showed that the subjects preferred a pseudo-random noise with a slope of −7 dB per octave doubling to a slope of −5 dB per octave doubling. Their study showed that the spectrum is an important basic feature of sound masking that should be carefully reported when the perception of sound masking is investigated.
The masking sound does not need to originate from a pseudo-random noise generator. Desirable masking spectra can be produced by various sound sources, such as music or natural sources. Employees' preferences for these alternative masking sound sources, which are not based on pseudo-random noise, have been very little investigated because few employers accept experimental studies in their workplaces. Haapakangas et al. (2011) found that a pouring water sound was a better speech masker with respect to acoustic satisfaction and cognitive performance than vocal music, instrumental music, pseudo-random noise or ventilation, although all of these sounds had exactly the same equivalent A-weighted SPL (45 dB) and spectrum slope (−5 dB per octave doubling). The cognitive and subjective benefits of a water sound have since been supported by Keus van de Poll et al. (2015).
Commercial sound masking systems use mainly pseudo-random noise, such as brown noise. Pseudo-random noise is very monotonous and free from noticeable temporal fluctuations. The spectrum can be shaped to resemble a typical ventilation noise and, thus, the sound may be easily accepted in buildings already involving a mechanical ventilation system. Water sounds of various kinds have been found to be favorable maskers of, e.g., road traffic noise in urban environments (Watts et al., 2009; Jeon et al., 2010, 2012; You et al., 2010). Water-based sound masking might be more preferable than pseudo-random noise in office workplaces where natural elements, such as photos of nature, plants, views to the nature and natural colors, are often used to improve environmental satisfaction. Natural elements have also been found to improve restoration after office work (Jahncke et al., 2011). Haapakangas et al. (2011) suggested that field research should be conducted to confirm their finding regarding the preference of water-based sound masking. To our knowledge, such field studies have not been published.
The purpose of our study was to determine how employees perceive different water-based masking sounds (WBMSs) compared to pseudo-random masking sound.
Materials and Methods
Study Design
An experiment involving a predefined order of experimental conditions was conducted at a single workplace. The independent variable is the condition. Five conditions (Table 1) involved the manipulation of the masking sound in the whole office. The duration of each condition was 3 weeks (Figure 2). Dependent variables are the subjective responses obtained by questionnaires during each condition. All employees of the workplace were invited to participate in the study. The first was repeated in the end of the experiment so that the last condition could be regarded as a control. The experiment was executed from 2 September 2013 to 24 January 2014.
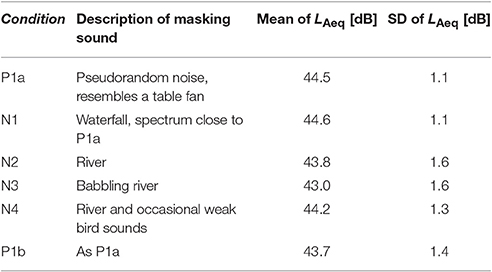
Table 1. The descriptions of the sound conditions and the mean and the standard deviation (SD) of equivalent A-weighted sound pressure level, LAeq, 15s, based on measurements in 54 workstations.
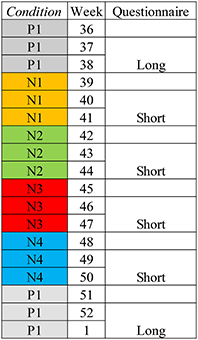
Figure 2. The duration of the experiment was 18 weeks. The length of the questionnaire for each condition is indicated.
Information Given to the Employees
The employees were not involved with the experimental design. The employees were orally informed 2 weeks before the first questionnaire about the forthcoming changes in the sound masking and about the related questionnaire surveys. The purpose of the study was explained as follows: “The purpose of the study is to understand how comfortable you are with the level of noise in the office and to understand how office noise affects your performance and well-being at work. The results will be used in Plantronics to understand how office noise considerations can be incorporated into product offerings.”
Ethical Considerations
The study was carried out in accordance with the guidelines of the national ethical principles (National Advisory Board on Research Ethics, 2009).
The Office
The study was conducted at Plantronics Ltd., Royal Wootton Bassett, Swindon, Great Britain. The dimensions of the open-plan office were 19 × 50 m, altogether 930 m2. The office involved 54 fixed workstations. The office was occupied by 77 workers. Twenty-five of them were either traveling most of the time or worked part-time and did not have fixed workstations. The departments were: administration, IT, Quality, Sales and Marketing. The workstation areas were supported by several pods for private and communicative tasks, open meeting lounges and three large meeting rooms (Figures 3, 4).
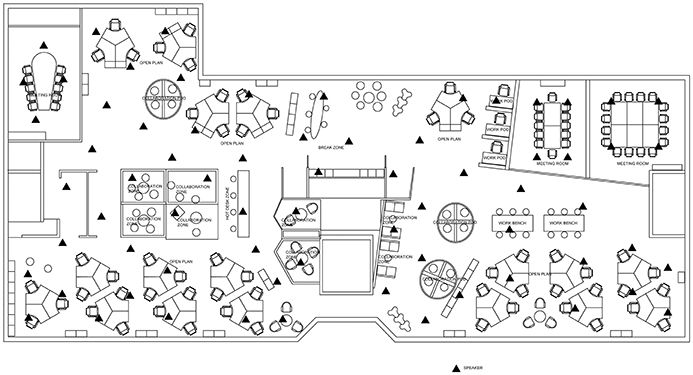
Figure 3. The layout of the studied open-plan office. The office involves 54 fixed workstations (18 trefoils) and more than 30 seats in collaboration zones and pods. Triangles indicate the position of masking loudspeakers.
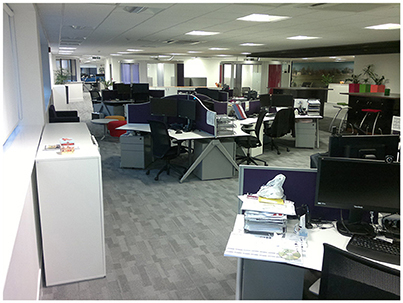
Figure 4. A photograph of the open-plan office. The photo was taken from the right-hand bottom corner of Figure 3.
The office had been occupied for 2 years during which PRMS (condition P1a) had been applied. We were told that the employees were satisfied with PRMS so a condition without any artificial masking sound was not considered realistic to test. Lack of masking was expected to increase the disturbance caused by colleagues' speech, which was not the purpose of the study.
The office was not randomly assigned but it was suggested by the funder to be a place of the experiment. The researchers found the office adequate for the study because of sufficient number of employees, existence of a sound masking system and employees' prior experience on sound masking.
Room Acoustic Characterization
The room height was 3.4 m. A suspended ceiling at 2.4 m height involved sound absorbing boards (600 × 600 mm, class A, ISO 11654, 1997) in an area of 80% of the ceiling. The rest of the ceiling area involved luminaires and ventilation supplies sizing 600 × 600 mm. The floor was covered with textile carpet so walking noises were minimized and acoustic absorption area was also increased. Large wall absorber fields were installed close to the walls of break room areas. The screens between fixed workstations were standing on the tables being 1.25 m high from the floor. There was good visibility over the whole office area (Figure 4).
The room acoustic measurements were conducted according to ISO 3382-3 (2012) in the baseline condition (P1a). The standard describes three main quantities to be reported from the measurements: distraction distance, rD [m], the spatial decay rate of A-weighted speech, D2,S [dB], and the A-weighted speech level at a distance of 4 m, LA, S, 4m [dB]. The quantity rD expresses the distance within which a normal effort speech of a single speaker in the office remains fully intelligible and is expected to elicit full disturbance. The smaller the value is, the better is the speech privacy. Typical values lie within 3 and 18 m (Hongisto et al., 2012; Keränen and Hongisto, 2013). The distraction distance, rD, was defined in the Introduction. The quantity D2,S expresses how many decibels the A-weighted level of speech reduces when the distance to the speaker is doubled. The larger the value is, the stronger is the attenuation of speech. Typical values are within 4 and 12 dB (Keränen and Hongisto, 2013). The quantity LA, S, 4m describes the interpolated A-weighted level of normal effort speech at a nominal distance of 4 m from the speaker. The smaller the value is, the stronger is the attenuation of sound close to the speaker. Typical values lie within 44 and 56 dB (Keränen and Hongisto, 2013).
Sound masking (P1a) was on and the space was unoccupied during the room acoustic measurements. In the baseline condition (P1a), the values of the three quantities were rD = 4 m, D2,S = 7.0 dB and LA, S, 4m = 45.3 dB. The speech privacy was very good from the objective point of view, because the value of rD was under 5 m: the result fulfills the best class A of a Finnish guideline (RIL 243-3, 2008). The reason was adequate sound masking level, large amount of room absorbers and large room width which reduces proportion of horizontal reflections.
Masking Sounds and Sound Measurements
The experiment consisted of five conditions described in Table 1 and Figure 1. The baseline condition was repeated in the end.
The employees were accustomed to work with sound masking for the 2 years preceding the experiment. The baseline conditions P1a and P1b represent this original sound masking. It was produced by a pseudo-random noise generator being steady-state and broad-band. The WBMSs N1–N4 used in the actual experiment in the open-plan office were chosen after a headphone-based listening test involving altogether 16 water-based sounds. In each of them, the water flow had a very constant nature so that temporal variations were negligible. The sounds were obtained from the internet. Ten experts from the authors' organizations participated in the test via the internet. Each sound was followed by nine questions assessing the nine attributes of sound masking which were also used in the actual field experiment (Table 2). The criteria for the selection of N1–N4 were that they were sufficiently different from each other (type of water flow) and that the sounds received high satisfaction ratings in the listening test. In addition, one of the WBMSs, N4, was the same sound as in the study of Haapakangas et al. (2011). N4 involved also occasional silent bird sounds but the water sound was dominating being responsible for speech masking.
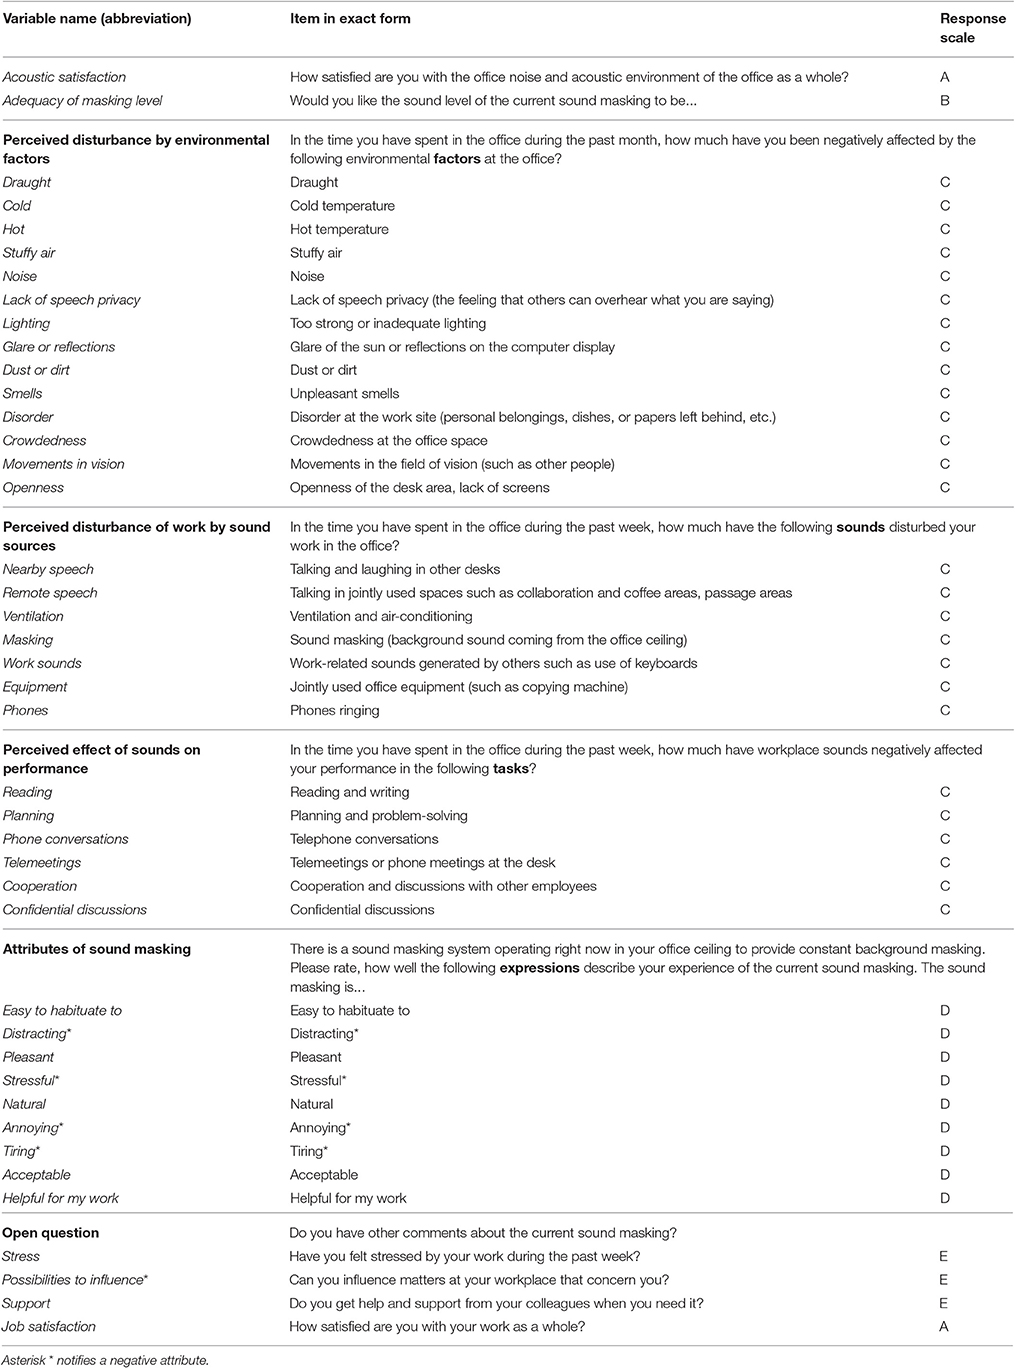
Table 2. Subjective measures.
All masking sounds were produced by the masking system installed at the office (Figure 1). Seventy loudspeakers were placed above the suspended sound-absorbing ceiling, thus being hidden from the employees. Each masking loudspeaker served a floor area of approximately 14 m2. The effect of the transmission chain from the input signal, fed to the pre-amplifier of sound masking system, to the SPL measured in workstation area was determined by feeding pink noise to the masking system and by measuring the SPL in the workstation area. It was expected that the transmission chain was not linear because of loudspeakers' frequency response, transmission loss through the ceiling and office reverberation had complicated frequency behaviors. The measurement revealed that the speakers were unable to reproduce sounds under 125 Hz and that the transmission chain involved strong reduction of sound level at high frequencies. Therefore, the sound files N1–N4 were pre-filtered to counter-eliminate the above-mentioned transmission function.
Every time a new condition was launched, the adequacy of the pre-filtering (correct level and spectrum) was checked by precision measurement of SPL (BandK 2144 analyzer, BandK 4165 microphone) in a small office desk area (1/3-octaves from 50 to 10,000 Hz). After the final level adjustment, the spectra were measured with the same apparatus in all 54 fixed workstations and 22 other positions after which the condition was launched. The measurement time was 15 s per position. The launching was made during weekends when the employees were absent.
The background noise of the ventilation system (masking was off) produced a constant background noise of 40 dB LAeq (Figure 1). The third-octave band levels were at least 3 dB under the masking sound within 160–10,000 Hz. The ventilation noise was the dominating sound below 160 Hz. However, the ventilation noise levels were under 50 dB below 160 Hz. They were nearly inaudible, when the masking sound was turned on.
Questionnaire
The employees were invited to respond to six questionnaires. The first and the last questionnaires were slightly longer than the questionnaires used in conditions N1–N4. The variables and response scales of the short questionnaire are reported in Tables 2, 3, respectively. The longer questionnaire included background information which needed not to be repeated after every condition, such as the use of the office space, nature of work, job satisfaction, stress, and education. The questionnaire was filled between the 7th and 15th day of exposure so that most employees had at least some experience on working under the current masking sound.
Table 3. Response scales of Table 2.
Respondents
The questionnaire was sent six times to 77 employees and managers who worked at the studied office. The number of respondents was 47, 37, 33, 30, 28, and 28 in conditions P1a, N1, N2, N3, N4, and P1b, respectively. The response rates were 61, 48, 43, 39, 36, and 36%. Most of the respondents worked at the office daily. The mean age of eighteen employees (18) who responded in all conditions was 38 years. The standard deviation was 11 years. The percentage of female respondents was 56. The mean age of non-respondents was 45 years (13% female). Thus, the core group of 18 employees was slightly over-represented by young female persons. The analyses were conducted on this group only (within-subjects design) so each of them acted as his/her own control. This gives more reliable results than the other alternative where all responded employees are taken into account (between-groups analysis). Similar approach was also applied in a recent field experiment (Hongisto et al., 2016a).
Statistical Methods
The analyses were conducted using IBM SPSS Statistics version 23 (Armonk, NY: IBM Corp). The differences in the measured SPLs between conditions were tested using t-test for independent samples (two-tailed). The analyses of the subjective responses between conditions P1a–N4 (five conditions) were made using repeated measures ANOVA with the condition as a within-subject variable. When a main effect was found, paired comparisons between conditions were performed using t-tests. An alpha level of 0.05 was used in all analyses. Whenever needed, the homogeneity of variance was estimated with Mauchly's test of sphericity. When the test indicated a violation of sphericity, the Greenhouse-Geisser correction was applied and the corresponding p-values are reported. It should be noted that the number of employees was not 18 for all tests because every employee did not necessarily respond in all questions in all six conditions. The Benjamini-Hochberg procedure (Benjamini and Hochberg, 1995) was used for alpha-error adjustment in paired comparisons. The difference between conditions P1a and P1b was tested using paired samples t-test (two-tailed). Effect size describes the strength of the difference between two conditions 1 and 2. The effect size is large if d > 0.8, medium if d > 0.50 and small if d > 0.20. Effect size was determined by Cohen's d according to Lakens (2013)
where Mi and si are the mean and the standard deviation of condition i, respectively.
Results
Quantitative Results
The measured sound pressure levels of the masking sounds in each condition are shown in Table 1 and Figure 1. The A-weighted levels of the conditions differed significantly from each other (p < 0.001). The SPL of every third octave frequency band differed significantly from each other (all p's under 0.001). However, the difference is negligible from subjective point of view (see Discussion).
Perceived disturbance caused by various environmental factors varied strongly between conditions P1a–N4 (Table 4). The largest changes were observed in noise (see the definitions of variables in Table 2). There was a significant main effect of condition (P1a–N4) on noise (F4,56 = 5.65, p < 0.001, η2 = 0.29). Paired comparisons showed significant differences between conditions P1a and N3 (p < 0.001, d = 1.50), conditions P1a and N4 (p < 0.001, d = 1.34), conditions N1 and N3 (p < 0.05, d = 0.61), and conditions N1 and N4 (p < 0.05, d = 0.50). Disturbance by noise was also higher in the condition P1b than in P1a [t(17) = −3.37, p < 0.01, d = 0.72]. A significant main effect of condition (P1a–N4) was also found for lack of speech privacy [F(4, 68) = 3.19, p < 0.05, η2 = 0.19] and movements in vision [F(4, 64) = 2.58, p < 0.05, η2 = 0.14]. The paired comparisons did not reveal differences between individual conditions. Comparison between conditions P1a and P1b revealed also significant differences between cold [t(17) = 2.38, p < 0.05, d = 0.59] and crowdedness [t(17) = −2.47, p < 0.05, d = 1.17].
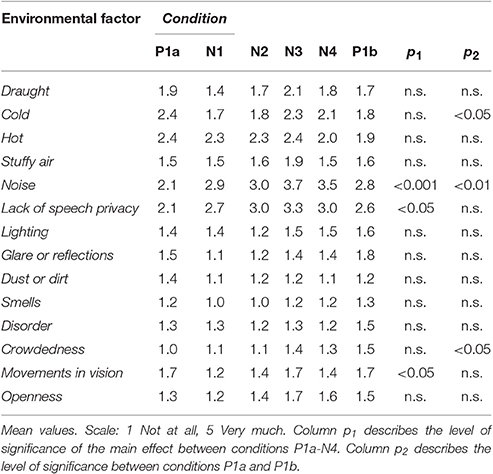
Table 4. Perceived disturbance by various environmental factors.
The condition (P1a–N4) affected the acoustic satisfaction [F(4, 68) = 12.94, p < 0.001, η2 = 0.43]. Paired comparison indicated that acoustic satisfaction reduced systematically when a new condition was presented (Figure 5). The condition P1a was rated as the best condition followed by N1. Conditions P1a and P1b did not differ from each other suggesting that acoustic satisfaction normalized when the original masking sound was re-introduced.
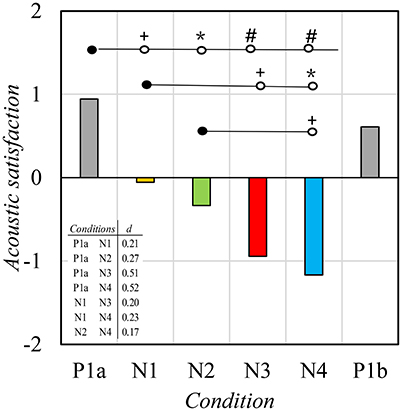
Figure 5. The mean satisfaction with the noise and acoustic environment of the office as a whole. Scale: −2 very dissatisfied; +2 very satisfied. Levels of statistical significance: +p < 0.05, *p < 0.01, #p < 0.001.
Perceived disturbance caused by various sound sources varied strongly between conditions (Table 5). A significant main effect of condition (P1a–N4) was found for most of the sound sources. Significant differences were not observed for any sound source between conditions P1a and P1b. Paired comparisons are reported below for three relevant sound sources. Differences were statistically significant for nearby speech [main effect: F(4, 68) = 3.94, p < 0.05, η2 = 0.19] between conditions P1a and N3 (p < 0.05, d = 1.16) and between conditions N1 and N3 (p < 0.05, d = 0.54). Differences were statistically significant for remote speech [main effect: F(4, 68) = 4.80, p < 0.01, η2 = 0.22] between conditions P1a and N3 (p < 0.05, d = 1.16), conditions P1a and N4 (p < 0.05, d = 1.05) and conditions N1 and N3 (p < 0.05, d = 0.58). Differences were statistically significant also for masking [main effect: F(4, 68) = 14.48, p < 0.001, η2 = 0.46]. All possible paired comparisons between conditions P1a–N4 for masking are shown in Figure 6.
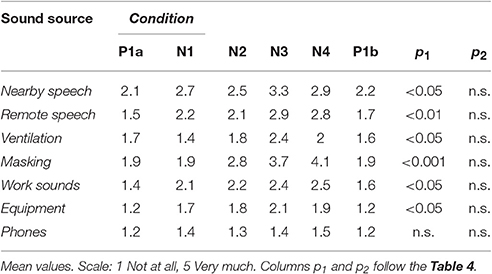
Table 5. The perceived disturbance of work by different sound sources.
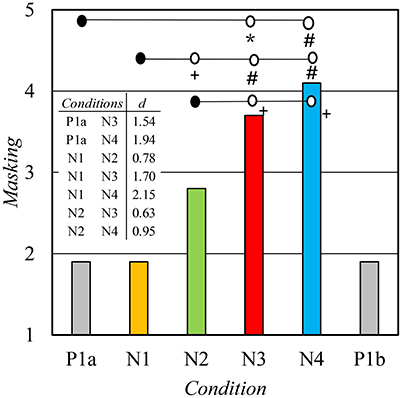
Figure 6. The mean disturbance of work caused by sound masking. Scale: 1 Not at all, 5 Very much. Levels of statistical significance: +p < 0.05, *p < 0.01, #p < 0.001.
The perceived effects of office sounds on performance varied significantly between conditions P1a–N4 (Table 6). Paired comparisons showed that conditions N3 and N4 differed significantly from condition P1a for all types of work (p's below 0.01 or below 0.05, d's between 1.01 and 1.39). Significant difference was also found between conditions P1a and N1 (cooperation, p < 0.05, d = 0.59), and conditions P1a and N2 (telephone conversations, p < 0.05, d = 0.41).
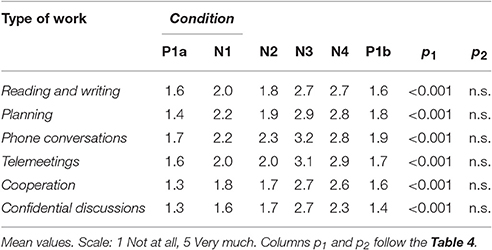
Table 6. The perceived effect of sounds on performance in different tasks.
The sound quality of masking was inquired by the same nine attributes which were used in the listening test prior to this experiment. A significant main effect of the condition (P1a–N4) on all sound quality attributes was found (Table 7). Paired comparisons showed a large number of differences between the conditions. We were content to report the differences between condition P1a and other conditions.
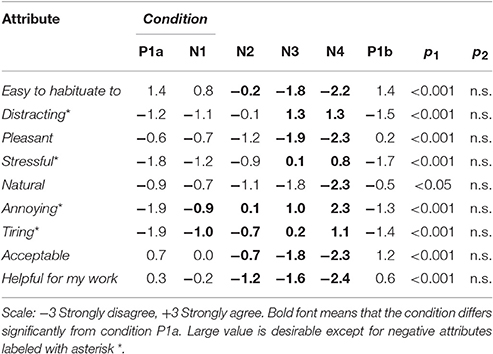
Table 7. Mean values of the attributes describing the quality of sound masking.
The perception of the adequacy of masking level varied between conditions P1a–N4 [F(4, 68) = 3.23, p < 0.05, η2 = 0.16]. The level of masking sound was rated the most adequate in conditions P1a and N1. However, paired comparisons did not show significant differences between conditions.
A main effect of condition was also observed on job satisfaction [F(4, 68) = 3.98, p < 0.05, η2 = 0.19]. A significant and almost permanent decrement in job satisfaction was observed after the condition P1a (Figure 7). Interestingly, job satisfaction did not return to the baseline level (P1a) after the experiment even though the other perceptions generally did. Condition did not have a significant main effect on stress: the mean values varied between 2.33 and 2.83 without any clear trend. Possibilities to influence [t(16) = 2.73, p < 0.05, d = 0.14] was significantly lower in condition P1b (mean 2.8) than in condition P1a (mean 3.3). Social support did not change significantly from P1a to P1b.
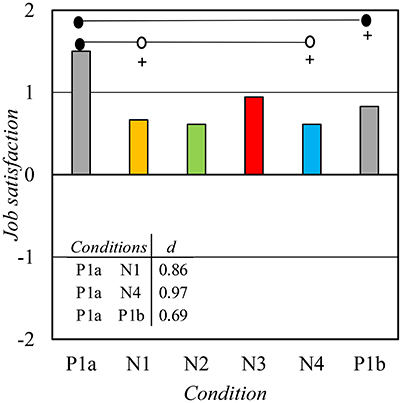
Figure 7. The mean satisfaction with work as a whole. Scale as in Figure 4. Symbol + means that the condition differs significantly from P1a (p < 0.05).
Qualitative Results
Responses to the open question (see Table 2) are summarized below. The information can be used to complement the quantitative results. Overall, sound masking was desired to be adaptive to the changes in the sound level of the office. In addition, some respondents desired the sound masking to be adapted to varied work requirements in different teams.
During condition P1a, both positive and negative opinions were given. Condition P1a was described to sound like an aircraft or air-conditioning. During condition N1, many comments reported that others' conversations could be heard. Some respondents told they were working at home or other spaces because of the noisy environment. During condition N2, sound masking was described as distracting and unpleasant/awful and conversations could be heard. Sound was described as, e.g., public toilet, fan and running water. Condition N3 was described as distracting, unpleasant/awful and some felt more stressed. Sound masking was not perceived to mask sounds and conversations could be heard. Sound was described as “problem with a ventilation system” and “toilet is constantly running.” Condition N4 was described as annoying and distracting and some respondents told they were working at home or other spaces because of the noisy environment. In addition, sound masking was not perceived to mask sounds and conversations could be heard. Sound was described as “a fish tank,” “bath running upstairs,” and “raining on a tin roof.” Condition P1b was found less distracting than conditions N1–N4 and better than sounds during past few months. However, some respondents found that sound masking level was too low. Only one respondent mentioned that this sound was equal with the first sound.
Discussion
Sound Pressure Levels
The A-weighted SPL, LAeq, of masking sound varied significantly between the conditions although large effort was made to achieve identical levels. The mean values varied between 43.0 and 44.6 dB. Fortunately, humans are usually not able to detect A-weighted level differences less than 1.0 dB. For example, Oliva et al. (unpublished) found that the difference in the loudness, or the annoyance, of two spectrally identical wide-band sounds can reach statistical significance if the level difference is 2 dB or larger. It should also be noted that conditions P1a and P1b differed by 0.8 dB with respect to LAeq although the electronic settings of the sound masking system were equal. Differences appeared only at certain frequency bands (see Figure 1) and we cannot explain them. This finding suggests that the measurement uncertainty of LAeq for each condition can be up to 1 dB. Therefore, we can relatively safely conclude that the A-weighted levels of the conditions were nearly equal and that the differences in LAeq hardly explain the differences in subjective ratings between the conditions.
Environmental Perception
The results suggest that the type of masking sound can have an influence on subjective outcomes; conventional pseudo-random masking sound, i.e., the conditions P1a and P1b, produced the best perceived working conditions. This conclusion is supported by the following chain of findings:
• Perceived disturbance by noise and the disturbance of work caused by main sound sources (nearby speech, remote speech, masking) suggests that conditions N1 and N2 were nearly similar with P1a but conditions N3–N4 were not.
• Acoustic satisfaction suggested that conditions N1–N4 were worse than P1a.
• Perceived effects of sounds on performance suggested that conditions N3 and N4 were worse than P1a.
• Conditions N2–N4 were worse than condition P1a because more than half of the attributes of sound masking differed significantly from condition P1a to the adverse direction.
• Taking all subjective variables into account, none of WBMSs were ever better than the pseudo-random masking sound (P1a or P1b).
The overall picture supports the view that the employees were much more satisfied with their original masking sound P1a than the WBMSs N1–N4. It is notable that the condition N1 was similar to P1a in terms of several subjective measures. This may be explained by the fact that the N1 spectrum did not differ very much from P1a. Therefore, future research attempting to find an adequate WBMS is justified.
The WBMSs N1–N4 differed significantly from each other with respect to spectrum (Figure 1) and the type of water flow (Table 1). Therefore, it cannot be ruled out that the masking sounds itself produced the significant differences in the subjective ratings between conditions. This is supported by the finding of Galbrun and Ali (2013): the sound quality of water flow, which depends on various physical factors (such as flow rate, height, and width of water flow), had a strong influence on objective sound quality (overall level, spectrum, roughness, sharpness, pitch strength), and on the subjective perception (peaceful, relaxing) of water sounds, when played together with road traffic noise with varying signal-to-noise ratios.
The WBMSs N1–N4 were selected from a listening test using stereo recordings and stereo headphones. The sounds were pleasant and natural and based on stereo recordings. Stereo recordings are usually made by using two microphones (Left and Right) separated by 20 cm. As a consequence of this, the two signals (Left and Right) differ slightly with respect to phase and spectrum. However, the sound masking system installed in the office could only play monophonic signals. When the first water sound was launched, we observed that the sound was much less spacious than during headphone listening because all loudspeakers played exactly the same signal without a phase difference, contrary to stereo headphone listening. A similar difference in spatial sensation can be experienced by changing stereo playback to mono playback using stereo loudspeakers or headphones. In addition, the frequency response of the loudspeakers, i.e., the output level in different frequencies, was less flat than the response of headphones used in the listening test. These factors biased the water-based masking signals making them to sound a clearly different compared to sensation during headphone listening.
Some new commercial sound masking systems allow the playback of two-channel signals (stereo) so that the two channels (Left and Right) are fed by independent signals with a small phase difference between them. The two channels are distributed evenly in the masking loudspeakers of the office and the sound environment gets more spacious because of the phase differences from nearby loudspeakers. Future research is welcome to find out whether the playback mode (Mono or Stereo) affects the perception of sound masking.
The employees reported that hot and cold had the largest disturbing effect on working during condition P1a. Noise and lack of speech privacy are usually more disturbing factors of work environment in open-plan offices (Pejtersen et al., 2006; Haapakangas et al., 2008; Bodin Danielsson and Bodin, 2009; Frontczak et al., 2012). It seems that that the perceived acoustic conditions were not especially bad in the workplace prior to the experiment. This finding gives indirect support for the use of pseudo-random masking sound, i.e., conditions P1a and P1b. Instead, perceived noise was significantly higher in condition P1b than in P1a. Unlike many other sound-related variables, perceived noise did not return to the baseline level after the experiment. There may be several explanations for this. The increased noise in P1b may suggest that the respondents reacted negatively to the experiment which had lasted over 3 months when the responses for P1b were gathered. It is also possible that the activity in the office, and the related activity noise levels, was higher during condition P1b (winter) than during condition P1a (early fall). We did not measure the activity noise levels because the office was large: reliable monitoring of office noise would have required at least 10 measurement points. Such a large investment was beyond the resources of the research project. The findings demonstrate how difficult it is to control complicated environmental factors, such as office noise, in long-term field experiments.
The results can also be interpreted from another perspective. Because all conditions had nearly equal A-weighted SPL, 43.0–44.6 LAeq, the results suggest that the A-weighted SPL of masking is not the only objective descriptor that defines the masking efficiency and subjective perception. This is in line with the laboratory experiment of Haapakangas et al. (2011) which showed that the type of masking sound had an effect on cognitive performance and acoustic satisfaction even though the A-weighted SPL was constant. Additionally, Hongisto et al. (2015) found that the spectrum alone explained the acoustic satisfaction of pseudo-random noises. Our study supports the findings of these previous studies but we cannot say which is more important: the spectrum or the type of sound.
It is possible that the perception of water sounds could be explained to some extent by more sophisticated sound quality descriptors, which take, e.g., the temporal variation or spectral envelope into account. For example, Jeon et al. (2010) found that sharpness, which describes the spectral envelope of sound, affected the perception (preference and semantic differential test) of water sounds while played together with road traffic noise. Although their study was beyond the context of our study for many reasons (design, study environment, primary sound, dependent variables, sound levels), it may be useful to take these parameters into account while designing future experiments. In our study, conditions N2 and N3 had a stronger high frequency content than the other conditions, thus representing larger sharpness. These features are expected to reduce preference according to Jeon et al. (2010) and acoustic satisfaction according to Hongisto et al. (2015). However, the subjective ratings of our study did not support abovementioned expectations based on laboratory experiments. Our research question was not designed to enable a systematic analysis between subjective responses and sound quality descriptors, such as sharpness, loudness or fluctuation strength (Jeon et al., 2010). In addition, field studies are sensitive to several non-acoustic factors which are not present in laboratory experiments. Therefore, our field study cannot provide any conclusions regarding the role of sound quality descriptors.
It should be noted that water-based sound contain more information than pseudo-random noise because of the temporal variation and the inevitable association to water flow which is not physically present. The changing state hypothesis (Jones et al., 1992) suggests that the automatic processing of temporally varying sounds activates the same processes that are required in maintaining order information in short-term memory. WBMSs can attract bottom-up attention more easily and as such distract from the task at hand. This can result in lower appreciation of the water sound.
Unpublished information obtained from a case study in another open-plan office suggests that employees were satisfied with WBMS in an open-plan office where visual cues of water were strongly present (Benway, unpublished). Masking was presented at a level of 45–48 dB LAeq via loudspeakers in remote parts of the office where the direct sound from the waterfall could not reach. The office involved a waterfall and visual cues of the waterfall were present also in other areas of the office. A laboratory study by Haga et al. (2016) has shown that the subjective effects of an ambiguous water-like sound do not depend on the stimulus-features per se but on the interpretation of the sound. Water sound may have been too artificial in our experiment because the environment around the building did not involve water elements. Thus, the water sound may have rather evoked negative interpretations, such as a running toilet, as shown by the open responses.
It may be useful to mention the laboratory experiment of Jeon et al. (2010) where road traffic noise at 55 dB LAeq was masked with very different water sounds at 55 dB while different pictures were shown to the participants. They found that the percentage of water features in the pictures was significantly correlated with improvements in the preference score between audio-only and audio-visual sessions. Because Haapakangas et al. (2011) and Keus van de Poll et al. (2015) supported WBMSs and the condition N1 involving a WBMS did not differ from condition P1a (pseudo-random masking sound) for every variable, it would be useful to investigate how the visual cues affect the perception of water sounds compared to the absence of visual cues.
Job Satisfaction
Job satisfaction reduced after the first condition and it did not return to the baseline level at the end in the same way as several subjective variables related to the acoustic environment did. Job satisfaction measures the overall satisfaction with work being a significantly broader variable than any other subjective variable of this study. Our experiment involved a strong and an obvious manipulation of the work environment. It is possible that job satisfaction was reduced because of negative changes in acoustic satisfaction and several other related variables. Prior to the experimental conditions (P1a), lack of privacy and noise were the most adverse factors of the work environment. Negative changes in them were observed right after the first water-based masking condition N1. This change might be sufficient to trigger a reduction in job satisfaction.
The experiment itself, and its management, could be another reason for the reduction in job satisfaction. Hongisto et al. (2016a) showed that job satisfaction improved in an open-plan office after a holistic refurbishment of indoor environment. Significant positive changes were found in almost all factors related to the perception of the physical work environment. The authors suspected that a user-oriented, appropriate design of the refurbishment, strong demand for environmental improvements by the employees and professional change management contributed to the positive findings. Our experiment did not include the effects of user-involvement. The lack of control over acoustic changes may have contributed to the dissatisfaction with the new water-based sounds. It is possible that the employees did not find the experiment useful because they already had a sound masking system.
Earlier research has shown that increased perception of control over the work environment is associated with higher environmental satisfaction (O'Neill, 1994; Veitch and Gifford, 1996; Huang et al., 2004; Lee and Brand, 2010). In laboratory experiments, which usually do not last more than a couple of hours, subjects may accept the experimental conditions more easily than at workplaces. In addition, employees may be engaged with the workplace and many of them wish to influence matters that concern their daily environment. In our study, employees did not have a chance to affect the conditions, which probably reduced the perceived control of work environment. This is also supported by the finding that possibilities to influence was perceived lower after the experiment. It seems that the employees did not find personal or other benefit from this study and they felt that the study only interfered their work.
It is also possible that other negative changes occurred in the workplace during the experimental period which explained the results.
Method
The methodological strengths of our field study were that the experimental conditions, i.e., the sound masking spectra and level, were reported in detail and carefully realized and measured. Second, we returned to the condition P1a in the end of the experiment so that we could better compare the WBMSs to pseudo-random masking sound. Third, the employees were accustomed to work under artificial masking sound prior to the experiment so that the perceptions of sound masking were probably more reliable than in an opposite situation.
The methodological weaknesses of our study include the lack of a control group, the predefined order of conditions, the large number of experimental conditions (length of the experiment), the drop-out rate of respondents with time, lack of “masking off” condition, and bias toward the original masking sound of condition P1a.
The lack of a control group could be seen as a methodological weakness which prevents the inference of causality. However, using a control group was not possible in this case because all office employees were subject to the experiment. Choosing a control group from another unit or company would not have been meaningful because the group would not have been comparable in terms of the work environment, especially sound masking, or working style. A long-term survey may also create expectations of problem abatement in the control group, and may exacerbate the perceived problems when the survey is repeated six times without any sign of benefiting from it. Thus, a control group might not work as an intended neutral point of comparison in this kind of complicated experimental research. For the same reason, it is difficult to establish good co-operation with the manager of a control group which would be vital for sufficient response rates. It should be noted that conditions P1a and P1b acted as neutral points of comparison and the differences between them were mainly insignificant, what comes to the perception of sound masking.
The order of conditions is usually completely randomized between subjects in laboratory experiments following repeated measures design. Unfortunately, random assignment to conditions may be impossible to realize in field settings where all employees are exposed to the same conditions. Future workplace experiments should probably contain fewer subsequent sound conditions to avoid order effects and the related reduction of motivation and response rate. The control condition, here P1, could follow each experimental condition N, e.g., P1-N1-P1 and P1-N2-P1 and not P1-N1-N2-P1. Alternatively, a cross-over design might be applied where the employees are divided into two groups exposed to different orders: P1-N1-N2-P1 and P1-N2-N1-P1. A smart cross-over design was applied by, e.g., Seddigh et al. (2015). In addition, the selected masking sounds should be based on careful listening tests in laboratory conditions before submitting to a workplace. In our case, the listening experiment was conducted via the internet without controlling the type of headphones or listening levels so that we did not report the results in detail.
A masking off condition was excluded because the employees had been used to the sound masking of condition P1a. The managers did not find it adequate to turn the sound masking off because they believed it would reduce work performance and environmental satisfaction. The problem with masking off condition is also that it is not well-defined in scientific terms. In the office of our study, masking off condition would mean a level of 40 dB LAeq (ventilation of Figure 1) which is much higher than the masking off conditions in prior field studies (Helenius and Hongisto, 2004; Hongisto, 2008; Hongisto et al., 2012), or the silent conditions of laboratory experiments (Venetjoki et al., 2006; Haka et al., 2009; Haapakangas et al., 2011, 2014). Therefore, the inclusion of masking off condition with a level of 40 dB might have led to misleading results.
It should be noted that the employees were very familiar with the original sound masking prior to the experiment (conditions P1a and P1b). The high familiarity could explain the strong preference of them. It may take much more than 3 weeks to get accustomed with a new masking sound. Unfortunately, we cannot recommend a time after which the familiarization has reached a sufficient level.
Finally, our experiment was conducted at an individual workplace. Different results might emerge from another workplace. Therefore, our results cannot be generalized but can, merely, be used as a reference for designing future investigations.
Further research in this field is important because a recent field study showed that noise disturbance is higher in offices where the distraction distance is large (Haapakangas et al., 2017). It was also found that the background noise level of the office (noise level of masking and ventilation) was associated with noise disturbance: the lower the background noise level was, the higher was the perceived noise disturbance. The best way of producing adequate background noise level is artificial sound masking because dense grid of loudspeakers allows the minimization of spatial differences in sound level. Modern systems can also adapt according to the ambient office noise. Therefore, further research on adequate and user-oriented sound masking technologies (sound types, playback systems, sound levels, spectra and control over the level) are strongly supported.
Comparison to Other Field Studies
Our study is unique because careful field studies in this research area have not been published very much. A couple of field studies have investigated the change from the office without sound masking to an office with pseudo-random masking sound, such as P1a, using before-after design (Helenius and Hongisto, 2004; Hongisto, 2008; Hongisto et al., 2012). These studies gave some support for the use of pseudo-random masking sound when the SPL was approximately 43 dB LAeq and the spectrum was close to −5 dB per octave doubling (see Figure 1).
Conclusions
We tested how four different WBMSs were perceived in an open-plan office compared with conventional pseudo-random masking sound. The employees were used to the pseudo-random masking 2 years prior to the experiment so the experiment was not influenced by the unfamiliarity of sound masking concept. All masking sounds were presented nearly at the same equivalent sound pressure level, 43–45 dB LAeq but the spectrum and the type of water flow differed. The results were not in favor of WBMSs: none of the WBMS produced better outcomes than pseudo-random noise in any investigated subjective variable. The study had some methodological and audio-technical shortcomings so we cannot conclude that water-based sounds would not be adequate masking sounds at workplaces. Some subjective variables showed that the first WBMS, which had exactly the same spectrum as the pseudo-random masking sound, was perceived to be equal with the pseudo-random masking sound. The results give space for further research in this topic especially because the use of sound masking is one of the most efficient ways to reduce the distraction caused by colleagues' speech.
Author Contributions
VH has written the manuscript entirely. JV has conducted the questionnaires and statistical analyses. DO has conducted the measurements and sound preparations. EB has managed the project together with VH. All authors have given valuable comments on the manuscript. VH has written the revised manuscript. JV and AH have adviced in the revised manuscript regarding statistical analyses.
Conflict of Interest Statement
EB is affiliated with a commercial company, Plantronics Inc., USA.
The other authors declare that the research was conducted in the absence of any commercial or financial relationships that could be construed as a potential conflict of interest.
Acknowledgments
The research phase was funded by Plantronics Ltd., and Finnish Institute of Occupational Health. The writing phase was funded by Turku University of Applied Sciences. Thank you for Mr. Jarkko Hakala for re-drawing the office layout. We present our warmest thanks to Steven, who launched each sound masking condition and conducted the noise measurements perfectly according to our wishes, and George, who coordinated the experiment on site.
References
Banbury, S. P., and Berry, D. C. (2005). Office noise and employee concentration: identifying causes of disruption and potential improvements. Ergonomics 48, 25–37. doi: 10.1080/00140130412331311390
Benjamini, Y., and Hochberg, Y. (1995). Controlling the false discovery rate: a practical and powerful approach to multiple testing. J. R. Stat. Soc. B 57, 289–300. doi: 10.2307/2346101
Bodin Danielsson, C., and Bodin, L. (2009). Differences in satisfaction with office environment among employees in different office types. J. Archit. Plann. Res. 26, 241–257.
Bradley, J. S. (2003). The acoustical design of conventional open plan offices. Can. Acoustics. 31, 23–31.
Colle, H. A. (1980). Auditory encoding in visual short-term recall: effects of noise intensity and spatial location. J. Verbal Learn. Verbal Behav. 19, 722–735. doi: 10.1016/S0022-5371(80)90403-X
Ebissou, A., Parizet, E., and Chevret, P. (2015). Use of the speech transmission index for the assessment of sound annoyance in open-plan offices. Appl. Acoust. 88, 90–95. doi: 10.1016/j.apacoust.2014.07.012
Ellermeier, W., and Hellbrück, J. (1998). Is level irrelevant in “irrelevant speech”? J. Exp. Psychol. Hum. Percept. Perform. 24, 1406–1414.
Frontczak, M., Schiavon, S., Goins, J., Arens, E., Zhang, H., and Wargocki, P. (2012). Quantitative relationships between occupant satisfaction aspects of indoor environmental quality and building design. Indoor Air 22, 119–131. doi: 10.1111/j.1600-0668.2011.00745.x
Galbrun, L., and Ali, T. T. (2013). Acoustical and perceptual assessment of water sounds and their use over road traffic noise. J. Acoust. Soc. Am. 133, 227–237. doi: 10.1121/1.4770242
Haapakangas, A., Helenius, R., Keskinen, E., and Hongisto, V. (2008). “Perceived acoustic environment, work performance and well-being – survey results from Finnish offices,” in Proceeding of the 9th International Congress on Noise as a Public Health Problem (ICHBEN) 2008 (Mashantucket, CT), 434–441.
Haapakangas, A., Hongisto, V., Eerola, M., and Kuusisto, T. (2017). Distraction distance and disturbance by noise – an analysis of 21 open-plan offices. J. Acoust. Soc. Am. 141, 127–136. doi: 10.1121/1.4973690
Haapakangas, A., Hongisto, V., Hyönä, J., Kokko, J., and Keränen, J. (2014). Effects of irrelevant speech on performance and subjective distraction: the role of acoustic design in open-plan offices. Appl. Acoust. 86, 1–16. doi: 10.1016/j.apacoust.2014.04.018
Haapakangas, A., Kankkunen, E., Hongisto, V., Virjonen, P., Oliva, D., and Keskinen, E. (2011). Effects of five speech masking sounds on performance and acoustic satisfaction - implications for open-plan offices. Acta Acust. Unit. Acust. 97, 641–655. doi: 10.3813/AAA.918444
Haga, A., Halin, N., Holmgren, M., and Sörqvist, P. (2016). Psychological restoration can depend on stimulus-source attribution: a challenge for the evolutionary account. Front. Psychol. 7:1831. doi: 10.3389/fpsyg.2016.01831
Haka, M., Haapakangas, A., Keränen, J., Hakala, J., Keskinen, E., and Hongisto, V. (2009). Performance effects and subjective disturbance of speech in acoustically different office types—a laboratory experiment. Indoor Air 19, 454–467. doi: 10.1111/j.1600-0668.2009.00608.x
Helenius, R., and Hongisto, V. (2004). “The effect of acoustical improvement of an open-plan office on workers,” in Proceedings of Inter-Noise 2004, paper 674, Aug 21–25, 2004 (Prague).
Hongisto, V. (2005). A model predicting the effect of speech of varying intelligibility on work performance. Indoor Air 15, 458–468. doi: 10.1111/j.1600-0668.2005.00391.x
Hongisto, V. (2008). “Effects of sound masking on workers - a case study in a landscaped office,” in 9th International Congress on Noise as a Public Health Problem (ICBEN) 2008, 442–449, July 21–25 (Mashantucket, CT).
Hongisto, V., Haapakangas, A., Helenius, R., Keränen, J., and Oliva, D. (2012). “Acoustic satisfaction in an open-plan office before and after the renovation,” in Proceedings of Euronoise 2012, June 10–13, 654–659 (Prague).
Hongisto, V., Haapakangas, A., Varjo, J., Helenius, R., and Koskela, H. (2016a). Refurbishment of an open-plan office–environmental and job satisfaction. J. Environ. Psychol. 45, 176–191. doi: 10.1016/j.jenvp.2015.12.004
Hongisto, V., Keränen, J., and Larm, P. (2004). Simple model for the acoustical design of open-plan offices. Acta Acust. Unit. Acust. 90, 481–495.
Hongisto, V., Oliva, D., and Rekola, L. (2015). Subjective and objective rating of spectrally different pseudorandom noises—Implications for speech masking design. J. Acoust. Soc. Am. 137, 1344–1355. doi: 10.1121/1.4913273
Hongisto, V., Varjo, J., Leppämäki, H., Oliva, D., and Hyönä, J. (2016b). Work performance in private office rooms: the effects of sound insulation and sound masking. Build. Environ. 104, 263–274. doi: 10.1016/j.buildenv.2016.04.022
Huang, Y.-H., Robertson, M. M., and Chang, K.-I. (2004). The role of environmental control on environmental satisfaction, communication, and psychological stress - effects of office ergonomics training. Environ. Behav. 36, 617–637. doi: 10.1177/0013916503262543
ISO 11654 (1997). Acoustics – Sound Absorbers for Use in Buildings – Rating of Sound Absorption. Geneva: International Organization for Standardization.
ISO 3382-3 (2012). Acoustics - Measurement of Room Acoustic Parameters. Part 3: Open Plan Offices. Geneva: International Organization for Standardization.
Jahncke, H., Hongisto, V., and Virjonen, P. (2013). Cognitive performance during irrelevant speech: effects of speech intelligibility and semantic difficulty, Applied Acoustics 74, 307–316. doi: 10.1016/j.apacoust.2012.08.007
Jahncke, H., Hygge, S., Halin, N., Green, A. M., and Dimberg, K. (2011). Open-plan office noise: cognitive performance and restoration. J. Environ. Psychol. 31, 373–382. doi: 10.1016/j.jenvp.2011.07.002
Jeon, J. Y., Lee, P. J., and You, J. (2012). Acoustical characteristics of water sounds for soundscape enhancement in urban open spaces. J. Acoust. Soc. Am. 131, 2101–2109. doi: 10.1121/1.3681938
Jeon, J. Y., Lee, P. J., You, J., and Kang, J. (2010). Perceptual assessment of quality of urban soundscapes with combined noise sources and water sounds. J. Acoust. Soc. Am. 127, 1357–1366. doi: 10.1121/1.3298437
Jones, D. M., Madden, C. A., and Miles, C. (1992). Privileged access by irrelevant speech to short-term memory: the role of changing state. Q. J. Exp. Psychol. 44A, 645–669. doi: 10.1080/14640749208401304
Kaarlela-Tuomaala, A., Helenius, R., Keskinen, E., and Hongisto, V. (2009). Effects of acoustic environment on work in private office rooms and open-plan offices—longitudinal study during relocation. Ergonomic 52, 1423–1444. doi: 10.1080/00140130903154579
Keighley, E. C., and Parkin, P. H. (1979). Subjective response to sound conditioning in a landscaped office. J. Sound Vib. 64, 313–323. doi: 10.1016/0022-460X(79)90580-7
Keränen, J., and Hongisto, V. (2013). Prediction of the spatial decay of speech in open-plan offices. App. Acoust. 74, 1315–1325. doi: 10.1016/j.apacoust.2013.05.011
Keus van de Poll, M., Carlsson, J., Marsh, J. E., Ljung, R., Odelius, J., Schlittmeier, S. J., et al. (2015). Unmasking the effects of masking on performance: the potential of multiple-voice masking in the office environment. J. Acoust. Soc. Am. 138, 807–816. doi: 10.1121/1.4926904
Keus van de Poll, M., Ljung, R., Odelius, J., and Sörqvist, P. (2014). Disruption of writing by background speech: the role of speech transmission index. Appl. Acoust. 81, 15–18. doi: 10.1016/j.apacoust.2014.02.005
Lakens, D. (2013). Calculating and reporting effect sizes to facilitate cumulative science: a practical primer for t-tests and ANOVAs. Front. Psychol. 4:863. doi: 10.3389/fpsyg.2013.00863
Lee, S. Y., and Brand, J. L. (2010). Can personal control over the physical environment ease distractions in office workplaces? Ergonomics 53, 324–335. doi: 10.1080/00140130903389019
Lewis, E., Sykes, D., and Lemieux, P. (2003). “Using a web-based test to measure the impact of noise on knowledge workers' productivity,” in Proceedings of the Human Factors and Ergonomics Society FES 47th Annual Meeting (Denver, CO).
Martin, R. C., Wogalter, M. S., and Forlano, J. G. (1988). Reading comprehension in the presence of unattended speech and music. J. Mem. Lang. 27, 382–398. doi: 10.1016/0749-596X(88)90063-0
National Advisory Board on Research Ethics (2009). Ethical Principles of Research in the Humanities and Social and Behavioural Sciences and Proposals for Ethical Review. Helsinki: National Advisory Board on Research Ethics.
O'Neill, M. J. (1994). Work space adjustability, storage, and enclosure as predictors of employee reactions and performance. Environ. Behav. 26, 504–526. doi: 10.1177/001391659402600403
Pejtersen, J., Allermann, L., Kristensen, T. S., and Poulsen, O. M. (2006). Indoor climate, psychosocial work environment and symptoms in open-plan offices. Indoor Air 16, 392–401. doi: 10.1111/j.1600-0668.2006.00444.x
Pierrette, M., Parizet, E., Chevret, P., and Chatillon, J. (2015). Noise effect on comfort in open-space offices: development of an assessment questionnaire. Ergonomics 58, 96–106. doi: 10.1080/00140139.2014.961972
RIL 243-3 (2008). Acoustic Design of Buildings - Offices, (Available Only in Finnish). Helsinki: Finnish Association of Civil Engineers Ass.
Salamé, P., and Baddeley, A. (1989). Effects of background music on phonological short-term memory. Q. J. Exp. Psychol. 41, 107–122. doi: 10.1080/14640748908402355
Schlittmeier, S. J., Hellbrück, J., Thaden, R., and Vorländer, M. (2008). The impact of background speech varying in intelligibility: effects on cognitive performance and perceived disturbance. Ergonomics 51, 719–736. doi: 10.1080/00140130701745925
Schlittmeier, S. J., and Liebl, A. (2015). The effects of intelligible irrelevant background speech in offices—cognitive disturbance, annoyance, and solutions. Facilities 33, 61–75. doi: 10.1108/F-05-2013-0036
Seddigh, A., Berntson, E., Jönsson, F., and Bodin Danielsson, C. (2015). Effect of variation in noise absorption in open-plan office: a field study with a cross-over design. J. Environ. Psychol. 44, 34–44. doi: 10.1016/j.jenvp.2015.08.004
Vassie, K., and Richardson, M. (2017). Effect of self-adjustable masking noise on open-plan office worker's concentration, task performance and attitudes. Appl. Acoust. 119, 119–127. doi: 10.1016/j.apacoust.2016.12.011
Veitch, J. A., and Gifford, R. (1996). Choice, perceived control, and performance decrements in the physical environment. J. Environ. Psychol. 16, 269–276. doi: 10.1006/jevp.1996.0022
Veitch, J., Bradley, J., Legault, L., Norcross, S., and Svec, J. (2002). “Masking speech in open-plan offices with Filtered Pink Noise noise: noise level and spectral composition effects on acoustic satisfaction,” Institute for Research in Construction, Internal Report IRC-846, Ottawa, Canada.
Venetjoki, N., Kaarlela-Tuomaala, A., Keskinen, E., and Hongisto, V. (2006). The effect of speech and speech intelligibility on task performance. Ergonomics 49, 1068–1091. doi: 10.1080/00140130600679142
Virjonen, P., Keränen, J., and Hongisto, V. (2009). Determination of acoustical conditions in open-plan offices - proposal for new measurement method and target values. Acta Acust. Unit. Acust. 95, 279–290. doi: 10.3813/AAA.918150
Warnock, A. C. C. (1973). Acoustical privacy in the landscaped office. J. Acoust. Soc. Am. 53, 1535–1543. doi: 10.1121/1.1913498
Watts, G. R., Pheasant, R. J., Horoshenkov, K. V., and Ragonesi, L. (2009). Measurement and subjective assessment of water generated sounds. Acta Acust. Unit. Acust. 95, 1032–1039. doi: 10.3813/AAA.918235
Keywords: open-plan offices, acoustics, masking, noise, noise annoyance, environmental psychology, environmental satisfaction
Citation: Hongisto V, Varjo J, Oliva D, Haapakangas A and Benway E (2017) Perception of Water-Based Masking Sounds—Long-Term Experiment in an Open-Plan Office. Front. Psychol. 8:1177. doi: 10.3389/fpsyg.2017.01177
Received: 31 March 2017; Accepted: 28 June 2017;
Published: 18 July 2017.
Edited by:
Mats E. Nilsson, Stockholm University, SwedenReviewed by:
Laurent Galbrun, Heriot-Watt University, United KingdomPyoung Jik Lee, University of Liverpool, United Kingdom
Bert De Coensel, Ghent University, Belgium
Copyright © 2017 Hongisto, Varjo, Oliva, Haapakangas and Benway. This is an open-access article distributed under the terms of the Creative Commons Attribution License (CC BY). The use, distribution or reproduction in other forums is permitted, provided the original author(s) or licensor are credited and that the original publication in this journal is cited, in accordance with accepted academic practice. No use, distribution or reproduction is permitted which does not comply with these terms.
*Correspondence: Valtteri Hongisto, dmFsdHRlcmkuaG9uZ2lzdG9AdHVya3VhbWsuZmk=