 Carmen Moret-Tatay
 María José Beneyto-Arrojo2
 Eugenia Gutierrez
 Walter R. Boot
 Neil Charness
- 1Departamento de Metodología, Psicología Básica y Psicología Social, Universidad Católica de Valencia San Vicente Mártir, Valencia, Spain
- 2Departamento de Personalidad, Evaluación e Intervención Terapéutica, Universidad Católica de Valencia San Vicente Mártir, Valencia, Spain
- 3Department of Psychology, Florida State University, Tallahassee, FL, United States
Technology can help support the goal of many older adults to live independently, though cognitive, attitudinal, and other barriers often result in a “digital divide” in which older adults use and adopt new technology at a lower rate compared to younger adults. Due to the many potential benefits of technology it is not surprising that interest in tools that assess technology proficiency among older adults has increased. These tools can help support older adult technology research and training. However, to understand these issues more broadly, especially cross-cultural determinants of technology proficiency, translated, validated, and standardized measures of proficiency are necessary. For example, according to the last Eurobarometer (European Commission, 2015), Spain has experienced the largest increase in technology adoption among European Union nations in the past few years, indicating potential cultural mediation of technology adoption and use. To benefit the investigation of cross-cultural differences and their causes, we adapted the Mobile Device Proficiency Questionnaire (MDPQ) and Computer Proficiency Questionnaire (CPQ) for older adults in Spain, including the full and brief forms of each measure. Consistent with English versions of the questionnaires, the scales and their subscales were found to be reliable and valid measures of mobile device and computer proficiency in Spanish older adults. However, in contrast to earlier studies, the factor structure for both questionnaires simplified into two factors for the population under study. We conclude that the Spanish versions of the MDPQ and CPQ can be employed as useful tools for measuring mobile device and computer proficiency in the Spanish older adult population for research and training purposes.
Introduction
In recent decades we have witnessed a rapid proliferation of information and communication technology (ICT). The use of technology that was once considered science fiction and economically infeasible is now practically a requirement to fully participate in modern society. However, not all groups have adopted some technologies to the same extent or have the same proficiency with respect to their use. In particular, seniors are commonly described as late adopters of technology in comparison to younger adults (Nikou, 2015; Hunsaker and Hargittai, 2018; Mitzner et al., 2018). Older adults have also been described as “digital immigrants” since in a relatively short period of time they had to immigrate from an analog world to a digital one (Yuan et al., 2016; Wang et al., 2019). Not surprisingly, this issue has been addressed from both a theoretical perspective and an applied one, because technology plays an increasingly important role in work, education, communication, and entertainment (e.g., Czaja et al., 2006; Charness and Boot, 2009). It is important to understand barriers to technology use and adoption, and potential facilitators, to ensure that individuals of all ages can reap the benefits of existing and emerging technologies, as described in recent meta-analysis (Scherer et al., 2019).
A variety of factors likely contribute to the observed age-related digital divide. Aging is associated with normative changes in general cognitive abilities (Salthouse, 2010), and cognitive abilities have been linked to the use of ICT (Czaja et al., 2006). Older adults' cognitive abilities shape their speed and accuracy interacting with technologies such as telephone menu systems, health applications, electronic medical records, and automatic teller machines (e.g., Czaja et al., 2010; Vaportzis et al., 2017). In other words, differences in access, use and/or impact of ICT may be driven in part, by declines in cognition with age (Klimova, 2016). In addition to cognition, there are attitudinal obstacles that prevent some older adults from adopting technology (Melenhorst et al., 2006) and problems in the design of these devices for older adults (Stronge et al., 2006). Technology anxiety and self-efficacy play important roles in shaping use and adoption (Czaja et al., 2006). These factors together help contribute to the observed age-related digital divide.
Moreover, as ICT spreads globally, differences among cultures have been observed in several countries (Straub et al., 1997). Some studies have found a strong positive relationship between technology adoption, education, infrastructure, and income that might have repercussions for economic growth (Quibria et al., 2003). More precisely, the use of a smartphone or computer varies considerably by country in Europe. According to the European Eurobarometer (European Commission, 2015), the largest increases have been seen in Spain, Italy, Croatia, and Hungary respectively, while other countries such as UK, Sweden, and Luxembourg that already exhibit a high adoption might be approaching a plateau. Moreover, one should bear in mind that cultural issues have also been related to the concept of digital divide. For this reason, we believe that more sophisticated measures that allow us to examine mobile and computer usage across countries are necessary.
The current study aims to adapt two new measures of the proficiency and use of mobile devices such as smartphones and tablets (Roque et al., 2016) and computers (Boot et al., 2015) for a Spanish population. This might shed light both in theoretical and applied fields, including the adaptation of training procedures based on an individual's current levels of proficiency. Therefore, questions of validity and reliability will be addressed. Internal consistency will be addressed across scales and versions, as well as age-related differences and convergent and divergent validity. The format of administration will be also taken into account. Finally, the factor structure will be re-examined in terms of exploratory factor analysis (EFA). In sum, we expect the new adaptation to be reliable (with a Cronbach's α greater than.80, as the original versions), valid (sensitive to group differences, predictive of variables related to frequency and length of technology use), and similarly structured in terms of factors as the original versions.
Methods
Participants
All participants were recruited from the Valencia community (in Spain) through an incidental sampling procedure. The sample selected consisted of 407 participants that ranged in age from 19 to 93 years (M = 53.07, SD = 23.19), and consisted of 39.5% men and 60.5% women (Table 1). The scoring scheme employed for the CPQ and MDPQ was the same as previously reported (Boot et al., 2015; Roque et al., 2016).
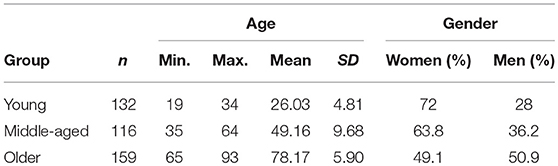
Table 1. Participant demographics in terms of age and gender.
Procedure
Participants completed the questionnaires in a variety of settings either separately or in groups of three or four. In most cases the questionnaires were self-administered under the supervision of trained psychologists. Participants were asked for their preferred method to complete the questionnaire: on their own, and therefore online, or directly supervised and dictated by the psychologist. More precisely, all younger participants completed questionnaires online, while a total of 14.7% of the middle-aged and 62.3% of the older participants completed a dictated version of the questionnaires on paper. Even if the administration of this procedures might influence the response in the older adults, this was the most comfortable scenario for this group. Therefore, this was taken into account for the data analysis.
Measures
For the adaptation of both the CPQ and MDPQ a back-translation process was performed as previously recommended in the literature (Muñiz et al., 2012). All original items were initially translated from English to Spanish by a native Spanish speaker with a fluent command of English, and then back-translated from Spanish to English by another bilingual professional. The result was discussed with native English speakers to identify potentially mistranslated items. For the few items that were identified, an alternative English to Spanish translation was made to preserve the meaning of the item. Both questionnaires employed a number of 5-point scales evaluating six domains for computer use and eight activity domains for mobile device use. Responses (1 = never tried, 2 = not at all, 3 = not very easily, 4 = somewhat easily, 5 = very easily) were averaged across subscales and the proficiency measure was the result of summing all subscales. Furthermore, short forms of the cited questionnaires were also evaluated. The different subscales, consisting of nine items, were comprised of questions related to computer and mobile device basics, participants' proficiency performing Communication tasks, Data and File Storage tasks, Transfer of Information, use of the Internet and Calendar, Entertainment, and Privacy among others (see Supplementary Material).
Finally, as in Roque et al. (2016), a short technology survey was included asking how long participants had been using Computers/Mobile devices, as well as how many hours per week participants used Computers/Mobile devices. These measures were used to help address the validity of the two measures under the assumption that use is correlated with proficiency.
Results
To address basic validity issues we first evaluated age differences. Based on the known digital divide between younger and older adults we predicted that older adults would score significantly lower compared to younger adults. This was confirmed, as depicted in Table 2 for the full versions, and in Table 3 for the shorter versions of the CPQ and MDPQ. In Figures 1, 2, box-and-whisker plot shows how the middle-aged adults presented higher variability.
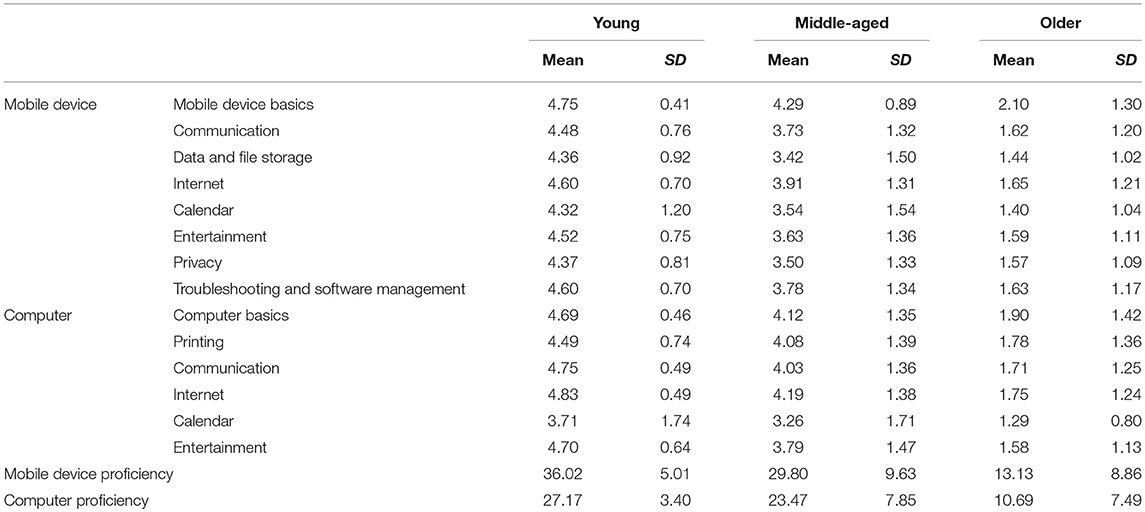
Table 2. Descriptive statistics for both full versions of the MDPQ and CPQ.
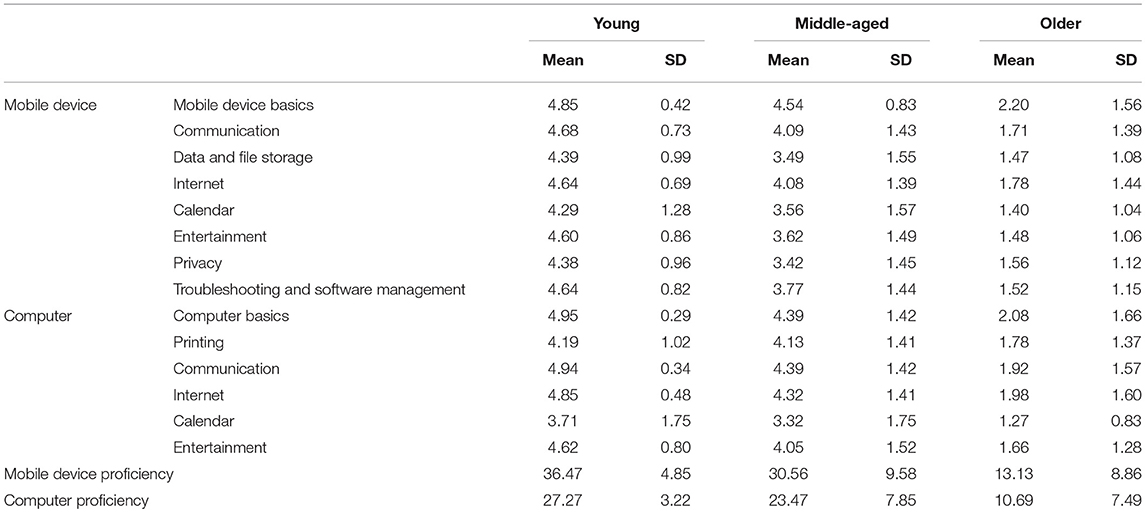
Table 3. Descriptive statistics for both short versions of the MDPQ and CPQ.
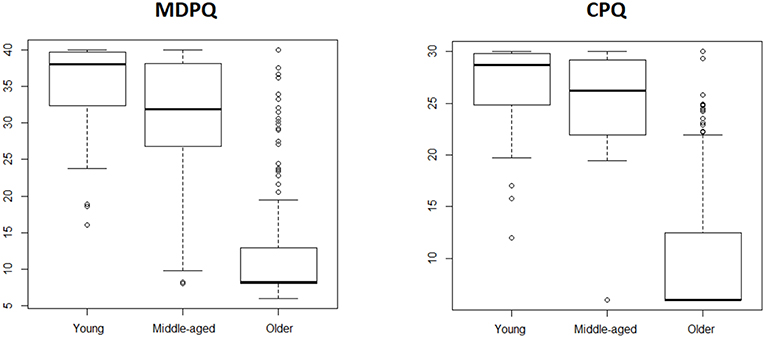
Figure 1. Box-and-whisker plot for the full versions of CPQ and MDPQ across age groups.
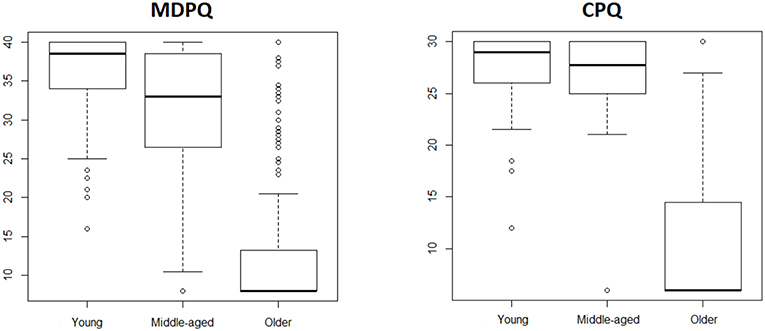
Figure 2. Box-and-whisker plot for the short versions of CPQ and MDPQ across age groups.
Reliability of the CPQ and MDPQ
Cronbach's α was used to assess the reliability of the both MDPQ and CPQ. Overall, the scale demonstrated excellent reliability (Cronbach's α = 0.99 for both questionnaires), with subscale reliabilities ranging from 0.71 to 0.99 for MDPQ, and from 0.51 to 0.98 for CPQ across age groups, see Table 4.
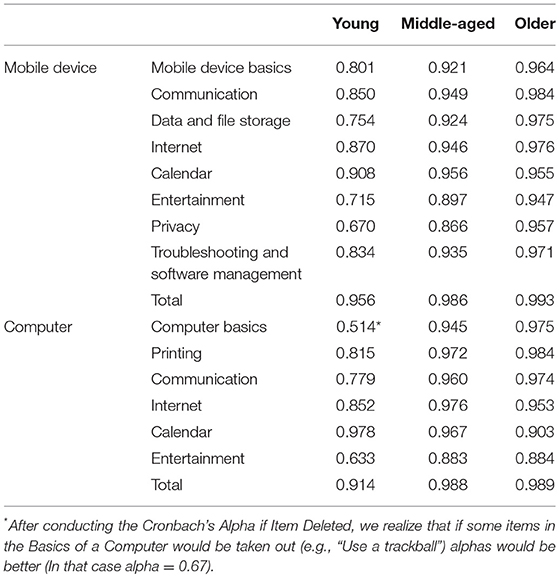
Table 4. Internal consistency for the MDPQ and CPQ.
Validity of the CPQ and MDPQ
In order to examine convergent and divergent validity, Pearson correlation coefficients were computed across questionnaires, and variables of length and frequency of use. Age was also considered in the analysis, being reliably negatively correlated with MDPQ, MDPQ-16, CPQ, and CPQ-12. Table 5 depicts the relationship among variables. As expected, the corresponding full and shorter version of the same questionnaire were more highly correlated than different questionnaires. This result was also similar for the relationship with length and frequency of use, which showed higher validity for the pertinent questionnaire. In contrast to the case for the original American sample, there is less differentiation in prediction (convergent/divergent validity) between the CPQ and the MDPQ and their respective use behaviors. This finding may indicate some combination of cultural differences and factor structure differences.
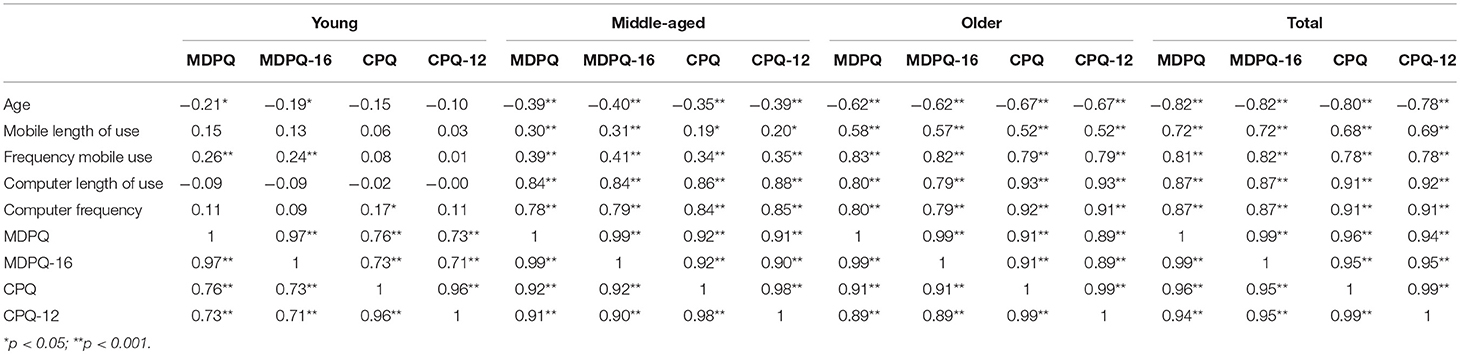
Table 5. Pearson's coefficients among MDPQ, CPQ, MDPQ-16, CPQ-12, Frequency and length of use.
Moreover, the validity in the older group was tested across format of administration: online vs. supervised, or better to say, dictated. As depicted in Figures 3, 4, the online group scored higher than the other group, and these differences were significant for all conditions as indicated by independent samples t-tests (all p < 0.0001).
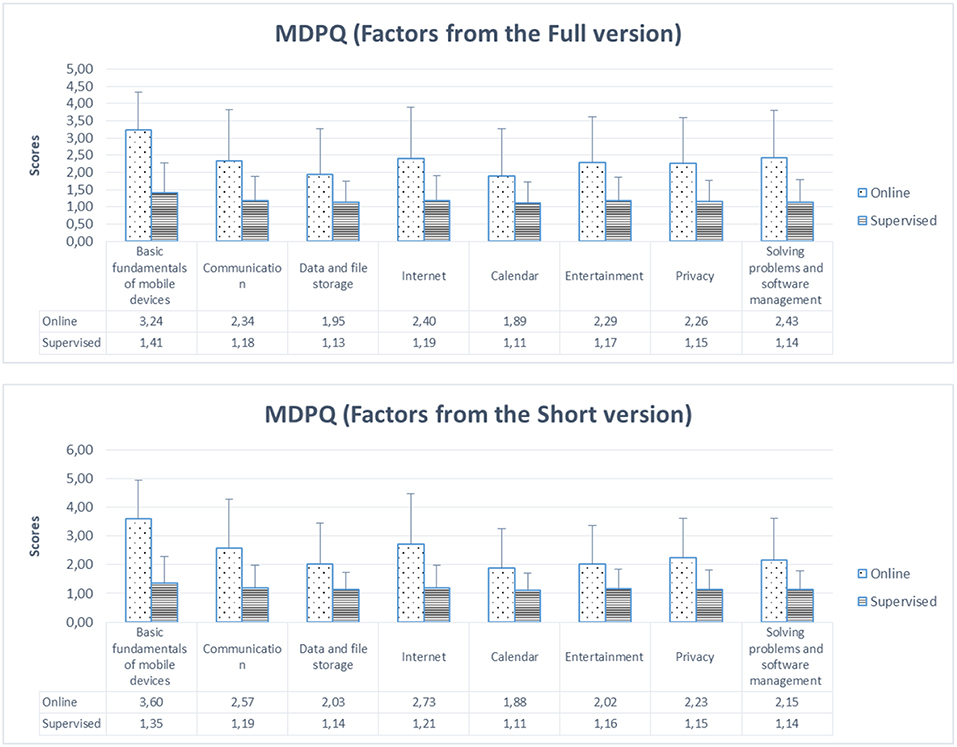
Figure 3. Mean for each MDPQ factor (both full and short versions) and their SD (standard deviation) across format of administration: online vs. supervised (dictated).
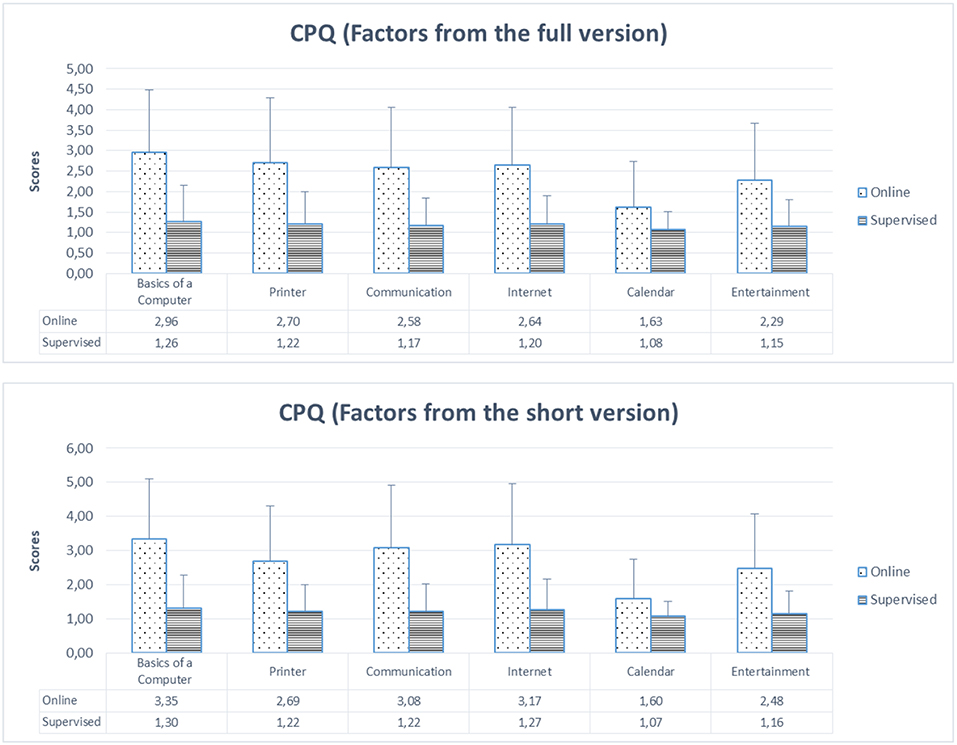
Figure 4. Mean for each CPQ factor (both full and short versions) and their SD (standard deviations) across format of administration: online vs. supervised (dictated).
Factor Structure
As young participants seem to show a ceiling effect as in the previous literature (Roque et al., 2016), and older adults presented low variance, MDPQ and CPQ structures were examined under a factor analysis conducted on older and middle adult data together using Varimax rotation. For the MDPQ, two factors accounted for 88.21% of the variation in the data. A similar structure was found for the CPQ with an explained variance that reached an 84.06%. For the MDPQ, the Bartlett's test of sphericity was p < 0.001, with a value of chi-square 23958.48 (df = 1035), and the sample index value of Kaiser-Meyer-Olkin (KMO) was 0.961. For the CPQ, the Bartlett's test of sphericity was p < 0.001 with a value of chi-square 20488.76 (df = 528) and the sample index value of KMO was 0.964. Finally, the whole database was analyzed together (all groups). Tables 6, 7 depict the factor loading for both the MDPQ and CPQ. Only two factor solution were uncovered for each. For the MDPQ it seems one factor was related to mobile device fundamentals (e.g., turning device on and off, using the touchscreen keyboard, adjusting volume) and the other factor was more related to advanced functions and features (sending emails, using instant messenger, updating software). The CPQ was relatively unidimensional, with one large factor representing most computer functions and features, and the second small dimension relating largely to electronic calendar use. These analyses are unlike those initially reported by Roque et al. (2016) and Boot et al. (2015), which found a factor structure that more closely matched the intended subscales of each measure.
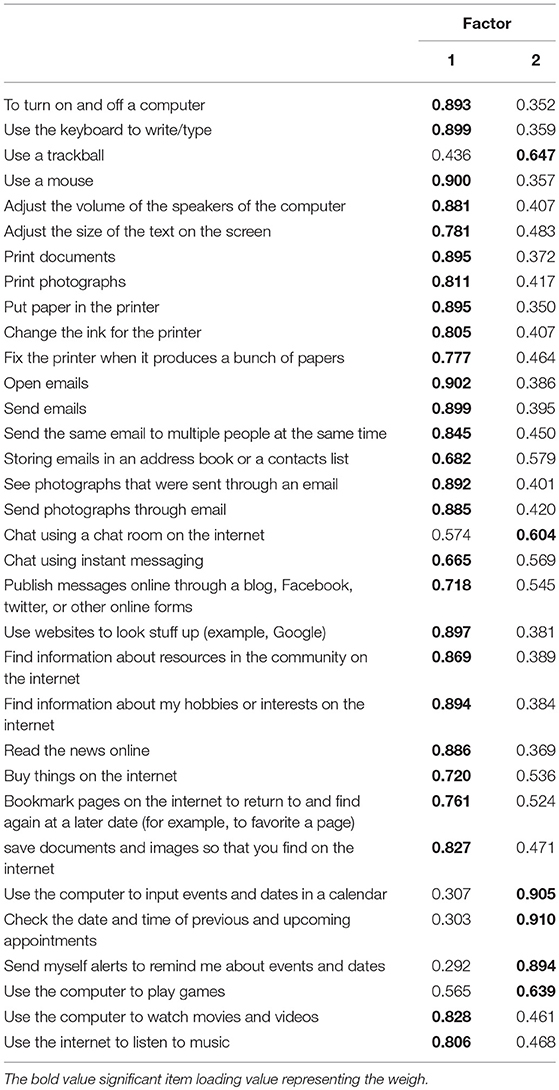
Table 6. Factor loading for the CPQ.
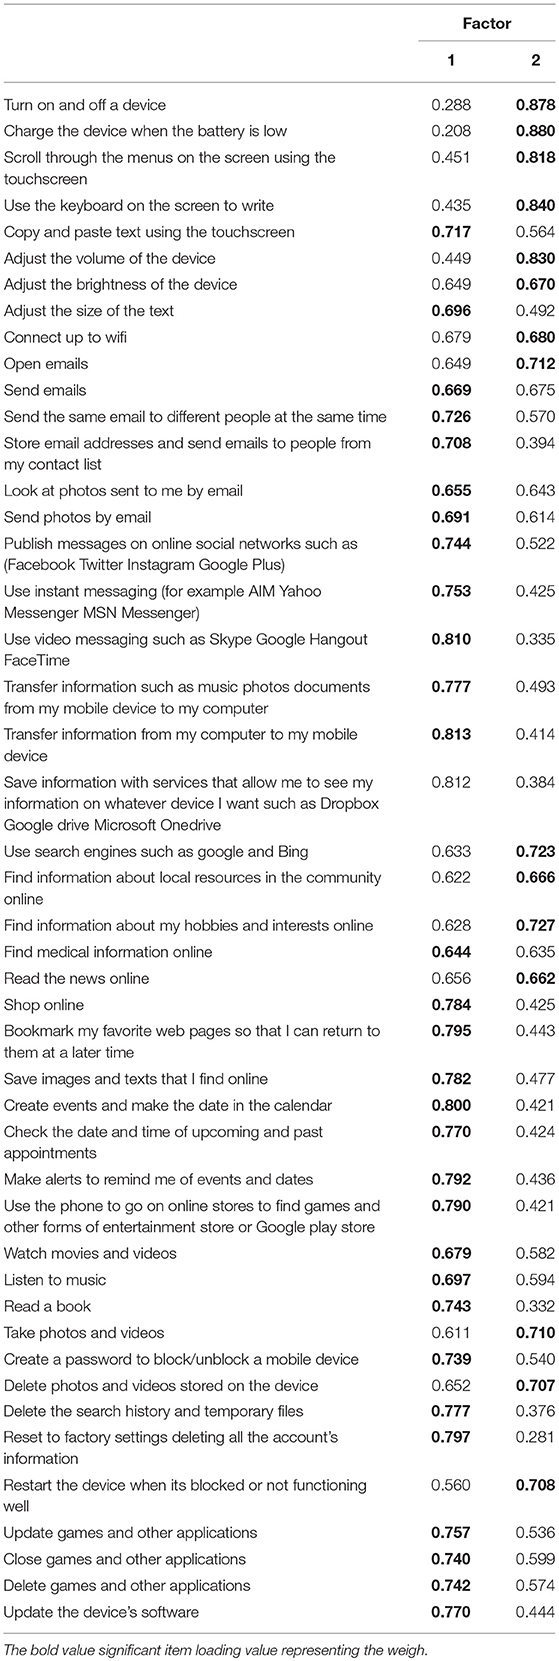
Table 7. Factor loading for the MDPQ.
Discussion and Conclusions
We have recently witnessed a revolution in one particular technological development. Mobile and Computer communication is an emerging technology that has been described as shaping the way that we process information and think (Dufau et al., 2011; Wilmer et al., 2017). Furthermore, age-related differences have been described in this field, relating use of ICT with cognition and maintaining independence (Charness and Boot, 2009). For this reason, measurement tools that might shed light on the adoption of ICT are of interest. In particular, in a population like the Spanish one, where, to our knowledge, if the measures is rather scarce, such tools would be very useful. For this reason, a Spanish adaptation of two of the most widespread questionnaires in this field was proposed.
First, a back-translation was carried out for the MDPQ and CPQ questionnaires. After this step, the questionnaires of interest were administered to different age groups. As expected, older participants exhibited lower scores than the younger ones. However, the scores were even lower than reported in the previous literature carried out in United States. This could indicate cultural differences among populations. Here it is important to bear in mind that Spain, as indicated in the European report has presented a remarkable increase in technology adoption. Nevertheless, a similar tendency on scores was found to Roque et al. (2016), where subscales related to more complex actions such as calendar, managing privacy settings, and files demonstrated greater variability and lower scores.
Both questionnaires presented excellent internal consistency and validity; however, differences in terms of structure were noteworthy. As mentioned before, this might be due to the moment in which the Spanish use of ICT is lower, in comparison with other countries such as the USA. In this way, it seems not surprising that the most popular way to participate in the study, by the older adults, was under dictated supervision, not online. More precisely, a large body of research has hypothesized that the adoption of new technologies would be stronger in more globalized cultures (Zahir et al., 2002). On the other hand, some gender differences occurred, specifically for the older group. Usually, women outnumber men in old age, but, in this sample, older men were overrepresented. Moreover, in a qualitative way, it is possible to state that older men showed more willingness to participle in the study. It also could account for some of the differences in factor structure if technology adoption in older groups follows the path seen early in the USA. Here, men adopted computer technology earlier than women but the digital divide disappeared over time. If older adults in Spain are just now adopting technology there may be a similar divide in competence.
Finally, there are several shortcomings in the present study. First, the participants were selected through non-probability sampling, which can introduce distortions in the results, for instance in male vs. female representation. Secondly, self-report bias may occur through the use of different sources employed in the data collection, online or through paper. This action was employed because of the rejection from most of the older participants on completing the questionnaire online. For this reason, questionnaires on paper for both face-to-face and telephone recruitment were employed. Future lines of research should compare both formats across age groups.
In sum, we present an adaptation of the MDPQ and CPQ for the Spanish population that might be of interest not only for examining the adoption of technologies in the Spanish elderly, but also for cross-cultural studies that allow us to compare different populations. From a theoretical level, the factor structure differences observed across studies contributed to the advancement of research models on aging and associated variables inherent to technology adoption. On a practical level, these translations offer a new tool for empirical studies. In particular, individual difference in proficiency might lead to different technology use patterns. Therefore, these results might reflect reasons of underuse or even inappropriate application of devices for training proposes, as indicated by Roque et al. (2016). In sum, these tools might shed light on participant's skill level before starting training. Moreover, questionnaire scores might be used to organize groups of older adults with similar proficiency, thereby optimizing technology training activity that can promote independence in older adults. Future lines of research could also explore the relationship between technology proficiency and cognitive status including the role of bilingualism and engagement in intellectual activities (Neville et al., 2018).
Ethics Statement
All participants completed a written informed consent and the research was approved by the ethical committee at the Universidad Católica de Valencia, San Vicente Mártir.
Author Contributions
WB and NC conceived of the presented idea. CM-T, WB and NC conceived the back translation and planned the data recruitment. CM-T, MB-A and EG recruited the data. CM-T, WB and NC drafted the manuscript.
Funding
CM-T, MB-A, and EM were supported by the Universidad Católica de Valencia, San Vicente Mártir and in particular, CM-T by the Ministerio de Educación, Cultura y Deporte (beca de estancias de movilidad para profesores e investigadores José Castillejo CAS16-00009, 2016). WB and NC were supported in part by a grant from the National Institute on Aging, under the auspices of the Center for Research and Education on Aging and Technology Enhancement (CREATE; 4 P01 AG‘17211).
Conflict of Interest Statement
The authors declare that the research was conducted in the absence of any commercial or financial relationships that could be construed as a potential conflict of interest.
Supplementary Material
The Supplementary Material for this article can be found online at: https://www.frontiersin.org/articles/10.3389/fpsyg.2019.01165/full#supplementary-material
References
Boot, W. R., Charness, N., Czaja, S. J., Sharit, J., Rogers, W. A., Fisk, A. D., et al. (2015). Computer proficiency questionnaire: assessing low and high computer proficient seniors. Gerontol. 55, 404–411. doi: 10.1093/geront/gnt117
Charness, N., and Boot, W. R. (2009). Aging and information technology use: potential and barriers. Curr. Dir. Psychol. Sci. 18, 253–258. doi: 10.1111/j.1467-8721.2009.01647.x
Czaja, S. J., Charness, N., Fisk, A. D., Hertzog, C., Nair, S. N., Rogers, W. A., et al. (2006). Factors predicting the use of technology: findings from the Center for Research and Education on Aging and Technology Enhancement (CREATE). Psychol. Aging 21:333. doi: 10.1037/0882-7974.21.2.333
Czaja, S. J., Sharit, J., Hernandez, M. A., Nair, S. N., and Loewenstein, D. (2010). Variability among older adults in internet health information-seeking performance. Gerontechnology 9, 46–55. doi: 10.4017/gt.2010.09.01.004.00
Dufau, S., Duñabeitia, J. A., Moret-Tatay, C., McGonigal, A., Peeters, D., Alario, F. X., et al. (2011). Smart phone, smart science: how the use of smartphones can revolutionize research in cognitive science. PLoS ONE 6:e24974. doi: 10.1371/journal.pone.0024974
European Commission (2015). Eurobarometer 423, October February 2015. TNS Opinion & Social. Brussels [Producer]: GESIS Data Archive: EB82.2.
Hunsaker, A., and Hargittai, E. (2018). A review of internet use among older adults. New Media Soc. 20, 3937–3954. doi: 10.1177/1461444818787348
Klimova, B. (2016). Use of the internet as a prevention tool against cognitive decline in normal aging. Clin. Interv. Aging 11, 1231–1237. doi: 10.2147/CIA.S113758
Melenhorst, A. S., Rogers, W. A., and Bouwhuis, D. G. (2006). Older adults' motivated choice for technological innovation: evidence for benefit-driven selectivity. Psychol. Aging 21:190. doi: 10.1037/0882-7974.21.1.190
Mitzner, T. L., Savla, J., Boot, W. R., Sharit, J., Charness, N., Czaja, S. J., et al. (2018). Technology adoption by older adults: findings from the PRISM trial. Gerontol. 59, 34–44. doi: 10.1093/geront/gny113
Muñiz, J., Elosua, P., and Hambleton, R. K. (2012). International test commission guidelines for test translation and adaptation. Psicothema 25, 151–157.
Neville, S., Wright-St Clair, V., Montayre, J., Adams, J., and Larmer, P. (2018). Promoting age-friendly communities: an integrative review of inclusion for older immigrants. J. Cross-Cult. Gerontol. 33, 427–440. doi: 10.1007/s10823-018-9359-3
Nikou, S. (2015). Mobile technology and forgotten consumers: the young-elderly. Int. J. Consum. Studies 39, 294–304. doi: 10.1111/ijcs.12187
Quibria, M. G., Ahmed, S. N., Tschang, T., and Reyes-Macasaquit, M. L. (2003). Digital divide: determinants and policies with special reference to Asia. J. Asian Econ. 13, 811–825. doi: 10.1016/S1049-0078(02)00186-0
Roque, N. A., Wright, T. J., and Boot, W. R. (2016). Do different attention capture paradigms measure different types of capture? Attent. Percept. Psychophys. 78, 2014–2030. doi: 10.3758/s13414-016-1117-4
Salthouse, T. A. (2010). Major Issues in Cognitive Aging. Oxford: Oxford University Press. doi: 10.1093/acprof:oso/9780195372151.001.0001
Scherer, R., Siddiq, F., and Tondeur, J. (2019). The technology acceptance model (TAM): a meta-analytic structural equation modeling approach to explaining teachers' adoption of digital technology in education. Comput. Educ. 128, 13–35. doi: 10.1016/j.compedu.2018.09.009
Straub, D., Keil, M., and Brenner, W. (1997). Testing the technology acceptance model across cultures: a three country study. Inform. Manag. 33, 1–11. doi: 10.1016/S0378-7206(97)00026-8
Stronge, A. J., Rogers, W. A., and Fisk, A. D. (2006). Web-based information search and retrieval: effects of strategy use and age on search success. Hum. Factors J. Hum. Factors Ergon. Soc. 48, 434–446. doi: 10.1518/001872006778606804
Vaportzis, E., Giatsi Clausen, M., and Gow, A. J. (2017). Older adults perceptions of technology and barriers to interacting with tablet computers: a focus group study. Front. Psychol. 8:1687. doi: 10.3389/fpsyg.2017.01687
Wang, H. Y., Sigerson, L., and Cheng, C. (2019). Digital nativity and information technology addiction: age cohort versus individual difference approaches. Comput. Hum. Behav. 90, 1–9. doi: 10.1016/j.chb.2018.08.031
Wilmer, H. H., Sherman, L. E., and Chein, J. M. (2017). Smartphones and cognition: a review of research exploring the links between mobile technology habits and cognitive functioning. Front. Psychol. 8:605. doi: 10.3389/fpsyg.2017.00605
Yuan, S., Hussain, S. A., Hales, K. D., and Cotten, S. R. (2016). What do they like? Communication preferences and patterns of older adults in the United States: the role of technology. Educ. Gerontol. 42, 163–174. doi: 10.1080/03601277.2015.1083392
Keywords: mobile device proficiency, computer proficiency, aging, digitalization, age related differences, digital divide, Spanish translation
Citation: Moret-Tatay C, Beneyto-Arrojo MJ, Gutierrez E, Boot WR and Charness N (2019) A Spanish Adaptation of the Computer and Mobile Device Proficiency Questionnaires (CPQ and MDPQ) for Older Adults. Front. Psychol. 10:1165. doi: 10.3389/fpsyg.2019.01165
Received: 26 October 2018; Accepted: 02 May 2019;
Published: 31 May 2019.
Edited by:
Ana Lucia Pereira, Universidade Estadual de Ponta Grossa, BrazilReviewed by:
Evgueni Borokhovski, Concordia University, CanadaPedro Daniel Ferreira, Universidade do Porto, Portugal
Copyright © 2019 Moret-Tatay, Beneyto-Arrojo, Gutierrez, Boot and Charness. This is an open-access article distributed under the terms of the Creative Commons Attribution License (CC BY). The use, distribution or reproduction in other forums is permitted, provided the original author(s) and the copyright owner(s) are credited and that the original publication in this journal is cited, in accordance with accepted academic practice. No use, distribution or reproduction is permitted which does not comply with these terms.
*Correspondence: Carmen Moret-Tatay, bWFyaWFjYXJtZW4ubW9yZXRAdWN2LmVz