 Kosuke Motoki
 Toshiki Saito
 Rui Nouchi
 Motoaki Sugiura2,4,5
- 1Department of Food Science and Business, Miyagi University, Sendai, Japan
- 2Institute of Development, Aging and Cancer, Tohoku University, Sendai, Japan
- 3Japan Society for the Promotion of Science, Tokyo, Japan
- 4Smart Aging Research Center, Tohoku University, Sendai, Japan
- 5International Research Institute of Disaster Science, Tohoku University, Sendai, Japan
Temperature is an important characteristic of food and drink. In addition to food-intrinsic temperature (i.e., serving temperature), consumers often experience food-extrinsic temperature (e.g., physical warmth). Emerging research on cross-modal correspondence has revealed that people reliably associate temperature with other sensory features. Building on the literature on cross-modal correspondence and sensation transference theory, the present study aimed to reveal mental representations of temperature–taste correspondence and cross-modal mental representations influencing corresponding sensory/hedonic perceptions of beverages, with a focus on manipulating food-extrinsic warmth. To reveal mental representations of temperature–taste correspondence, Experiment 1 investigated whether temperature words (warm, cool) are associated with sensory/hedonic attributes (e.g., sweet, sour, salty, bitter). The results of Experiment 1 demonstrated that warm (vs. cool) was matched more with saltiness, tastiness, healthfulness, and preference (intention to buy), whereas cool (vs. warm) was matched more with sourness and freshness. Experiment 2 assessed whether cross-modal mental representations influence corresponding sensory/hedonic perceptions of beverages. The participants wore hot and cold pads and rated sensory/hedonic attributes of Japanese tea (Experiment 2a) or black coffee (Experiment 2b) before and after tasting it. The results of Experiment 2a demonstrated that physical warmth (vs. coldness) increased healthfulness and the intention to buy Japanese tea. The results of Experiment 2b did not reveal any effects of physical warmth on sensory/hedonic ratings. These findings provide evidence of taste–temperature correspondence and provide preliminary support for the influence of food-extrinsic warmth on taste attributes related to positivity.
Introduction
Temperature and Food
Temperature is an important characteristic of food and drink. Food-intrinsic temperatures (i.e., serving temperature) as well as food-extrinsic temperatures (e.g., physical or ambient room temperatures) influence judgment and behaviors (McBurney et al., 1973; Moskowitz, 1973; Bartoshuk et al., 1982; Green and Frankmann, 1987, 1988; Cruz and Green, 2000; Schiffman et al., 2000; Engelen et al., 2003; Mony et al., 2013; Kim et al., 2015; Stokes et al., 2016; Pramudya and Seo, 2017, 2018). Food-intrinsic temperatures influence consumer acceptance (Cardello and Maller, 1982; Lee and O’Mahony, 2002; Brown and Diller, 2008). Food and drinks are more acceptable when served in the temperature range at which they are usually consumed (Cardello and Maller, 1982). In addition, food-extrinsic temperatures are commonly involved in dining settings. People sometimes warm themselves with a gas/electric heater and/or by wearing warm clothes as well as cool themselves with a ceiling fan and/or by wearing light clothes. Moreover, food-extrinsic temperatures influence consumer preferences (Zwebner et al., 2014; Motoki et al., 2018b). For example, physical warmth increases one’s willingness to pay for food (Zwebner et al., 2014). Taken together, this evidence suggests that temperature, even in the food-extrinsic form, influences consumer preference.
Temperature-Cased Cross-Modal Correspondence
A recent study reviewed temperature-based cross-modal correspondence (Spence, 2020a). Cross-modal correspondence refers to sensory interactions among the senses (Spence, 2011). People map features in one sensory modality onto features in other modalities in a surprisingly consistent manner (e.g., sweet and round shape or high pitch) (e.g., Velasco et al., 2016; Motoki et al., 2019a,c). Previous research has documented correspondence between temperature and the other sensory modalities (Berry, 1961; Wright, 1962; Hardin, 2000; Michael and Rolhion, 2008; Velasco et al., 2013; Ho et al., 2014a,b; Lorentz et al., 2016; Wang and Spence, 2017; Wnuk et al., 2017; Roque et al., 2018; Motoki et al., 2019b). For example, warm (vs. cold) temperatures are perceived to be well matched with visual features, such as a red hue (Ho et al., 2014b) or light color (Motoki et al., 2019b), whereas visual features of coldness (e.g., ice cubes) facilitate categorizing a drink as fresh (Roque et al., 2018). In addition, temperatures are associated with different sound properties (Velasco et al., 2013; Wang and Spence, 2017). Warm (vs. cold) temperatures of beverages are likely to be associated with a lower pitch and a slower tempo (Wang and Spence, 2017). However, most previous research has investigated visual–temperature or sound–temperature correspondence (but see Wnuk et al., 2017). Although temperature is involved in various dining settings (Velasco et al., 2013; Zwebner et al., 2014; Kim et al., 2015; Motoki et al., 2018b), no study has investigated temperature–taste correspondence.
Some research on cross-modal correspondence is based on mental representations without actual experiences of sensory stimuli. Word matching has been used to investigate mental representations of temperature-based or taste-based correspondence (e.g., Velasco et al., 2015; Motoki et al., 2019b) because previous research suggests that cross-modal correspondence may result even when sensing words are used without sensory experiences (Spence et al., 2015; Velasco et al., 2015, 2018b; Saluja and Stevenson, 2018). For example, words related to sweetness/bitterness are well matched with roundness/angularity, and sweet/bitter tastants are similarly well matched with roundness/angularity (Velasco et al., 2015). Our first aim in this study was to reveal mental representations of temperature–taste correspondence and how people associate temperature words with taste attributes.
Sensation Transference Theory
Food-extrinsic temperatures (e.g., positive experiences of physical warmth) can transfer to corresponding sensory/hedonic ratings (e.g., positive evaluations of food products). Sensation transference theory suggests that food-extrinsic somesthetic sensory experiences can be transferred to expectations and experiences around food and drink (Cheskin, 1972). For example, food-extrinsic haptic sensations (e.g., the weight of cutlery) influence corresponding expectations and experiences of food and beverages (e.g., the perceived texture of foods) (Krishna and Morrin, 2008; Mobini et al., 2011; Piqueras-Fiszman and Spence, 2012; Tu et al., 2015; Biggs et al., 2016; Slocombe et al., 2016; Kampfer et al., 2017; Wang and Spence, 2018). In addition, cross-modal mental representations observed in word matching affect the corresponding taste experience. The words sweetness/sourness are well matched with round/angular typefaces, and foods (jelly beans) rated as sweeter and less sour are associated with round (vs. angular) typefaces (Velasco et al., 2018b). Thus, findings of cross-modal mental representations by means of word matching may be reflected in corresponding taste perceptions. The second aim of this study was to reveal whether cross-modal mental representations affect corresponding sensory/hedonic perceptions of beverages, with a focus on manipulating food-extrinsic warmth.
Hypotheses
We established our hypotheses based on the emotion mediation hypothesis of cross-modal correspondence. The emotion mediation hypothesis suggests that people associate sensory attributes with other attributes based on similarity in emotional meaning (Spence, 2020a). For example, roundness and sweet taste are well matched because both have a positive valence relative to angularity and other tastes (Velasco et al., 2015). Previous studies imply that warm temperatures have a positive valence (Stokes et al., 2016; Pramudya and Seo, 2017). For example, coffee and green tea served at higher temperatures are evaluated positively (e.g., happy and satisfied), whereas beverages served at lower temperatures are evaluated negatively (e.g., disgusting and bitter) (Pramudya and Seo, 2017). In addition, experiences of physical warmth induce positive emotions and lead to greater intentions to buy products (Zwebner et al., 2014). Thus, the word warmth (vs. coolness) would be more associated with positive taste terms (e.g., tastiness, healthfulness, buying intention, and sweetness), and experiences of physical warmth (vs. coldness) increase ratings of positive taste attributes (e.g., tastiness, healthfulness, buying intention, and sweetness). By contrast, the word coolness (vs. warmth) is more associated with negativity (e.g., bitterness), and experiences of physical warmth (vs. coldness) increase ratings of negative taste attributes (e.g., bitterness).
H1a: The word warmth (vs. coolness) is more associated with taste terms linked to positivity (e.g., tastiness, healthfulness, buying intention, and sweetness).
H1b: The word coolness (vs. warmth) is more associated with taste terms linked to negativity (e.g., bitterness).
H2a: Physical warmth (vs. coldness) increases ratings of positive taste attributes (e.g., tastiness, healthfulness, buying intention, and sweetness).
H2b: Physical coldness (vs. warmth) increases ratings of negative taste attributes (e.g., bitterness).
The Current Study
Building on the literature on cross-modal correspondence and sensation transference theory, the present study aimed to reveal temperature–taste correspondence. This study investigated mental representations of temperature–taste correspondence and whether cross-modal mental representations influence corresponding sensory/hedonic perceptions of beverages, with a focus on manipulating food-extrinsic warmth. In Experiment 1, participants were asked to determine how much temperature words (warm, cool) are associated with sensory/hedonic attributes (e.g., sweet, sour, salty, bitter). In Experiment 2, participants who physically experienced warm or cold temperatures were asked to rank sensory/hedonic attributes of Japanese tea (Experiment 2a) and black coffee (Experiment 2b) before and after tasting each beverage.
Experiment 1
Materials and Methods
Participants
A total of 103 participants (32 females and 69 males; two participants did not reveal their gender; age: 42.06 ± 9.45 years) gave their online informed consent to take part in the experiment. The sample size was based on recent online research on taste-based correspondence (Velasco et al., 2018a; Motoki et al., 2019d). The participants were recruited on Lancers1 and completed the survey on Qualtrics2. The platforms allowed the participants to receive monetary compensation for completing the study (50 JPY). This research was conducted in September in Japan. All procedures were conducted according to the Declaration of Helsinki. The experimental protocol was approved by the Ethics Committee of Tohoku University School of Medicine.
Procedure
The study used a within-participants design, with sensory/hedonic attribute (tastiness, healthfulness, sweetness, sourness, saltiness, bitterness, freshness, and buying intention) as the dependent variables and temperature (warm, cool) as the independent variable. Participants were informed that this study aimed to investigate how people associate warmth/coolness with taste attributes. Participants were asked to match temperature words (warmth and coolness) with each sensory/hedonic attribute (Figure 1). Buying intention was taken as an indicator of consumer preference. This measure was also used in Experiment 2. In total, there were 16 trials in which participants matched each word with a value on a visual analog scale (VAS) ranging from 0 (not at all) to 100 (very much). The order of the trials and rating attributes were randomized across participants.
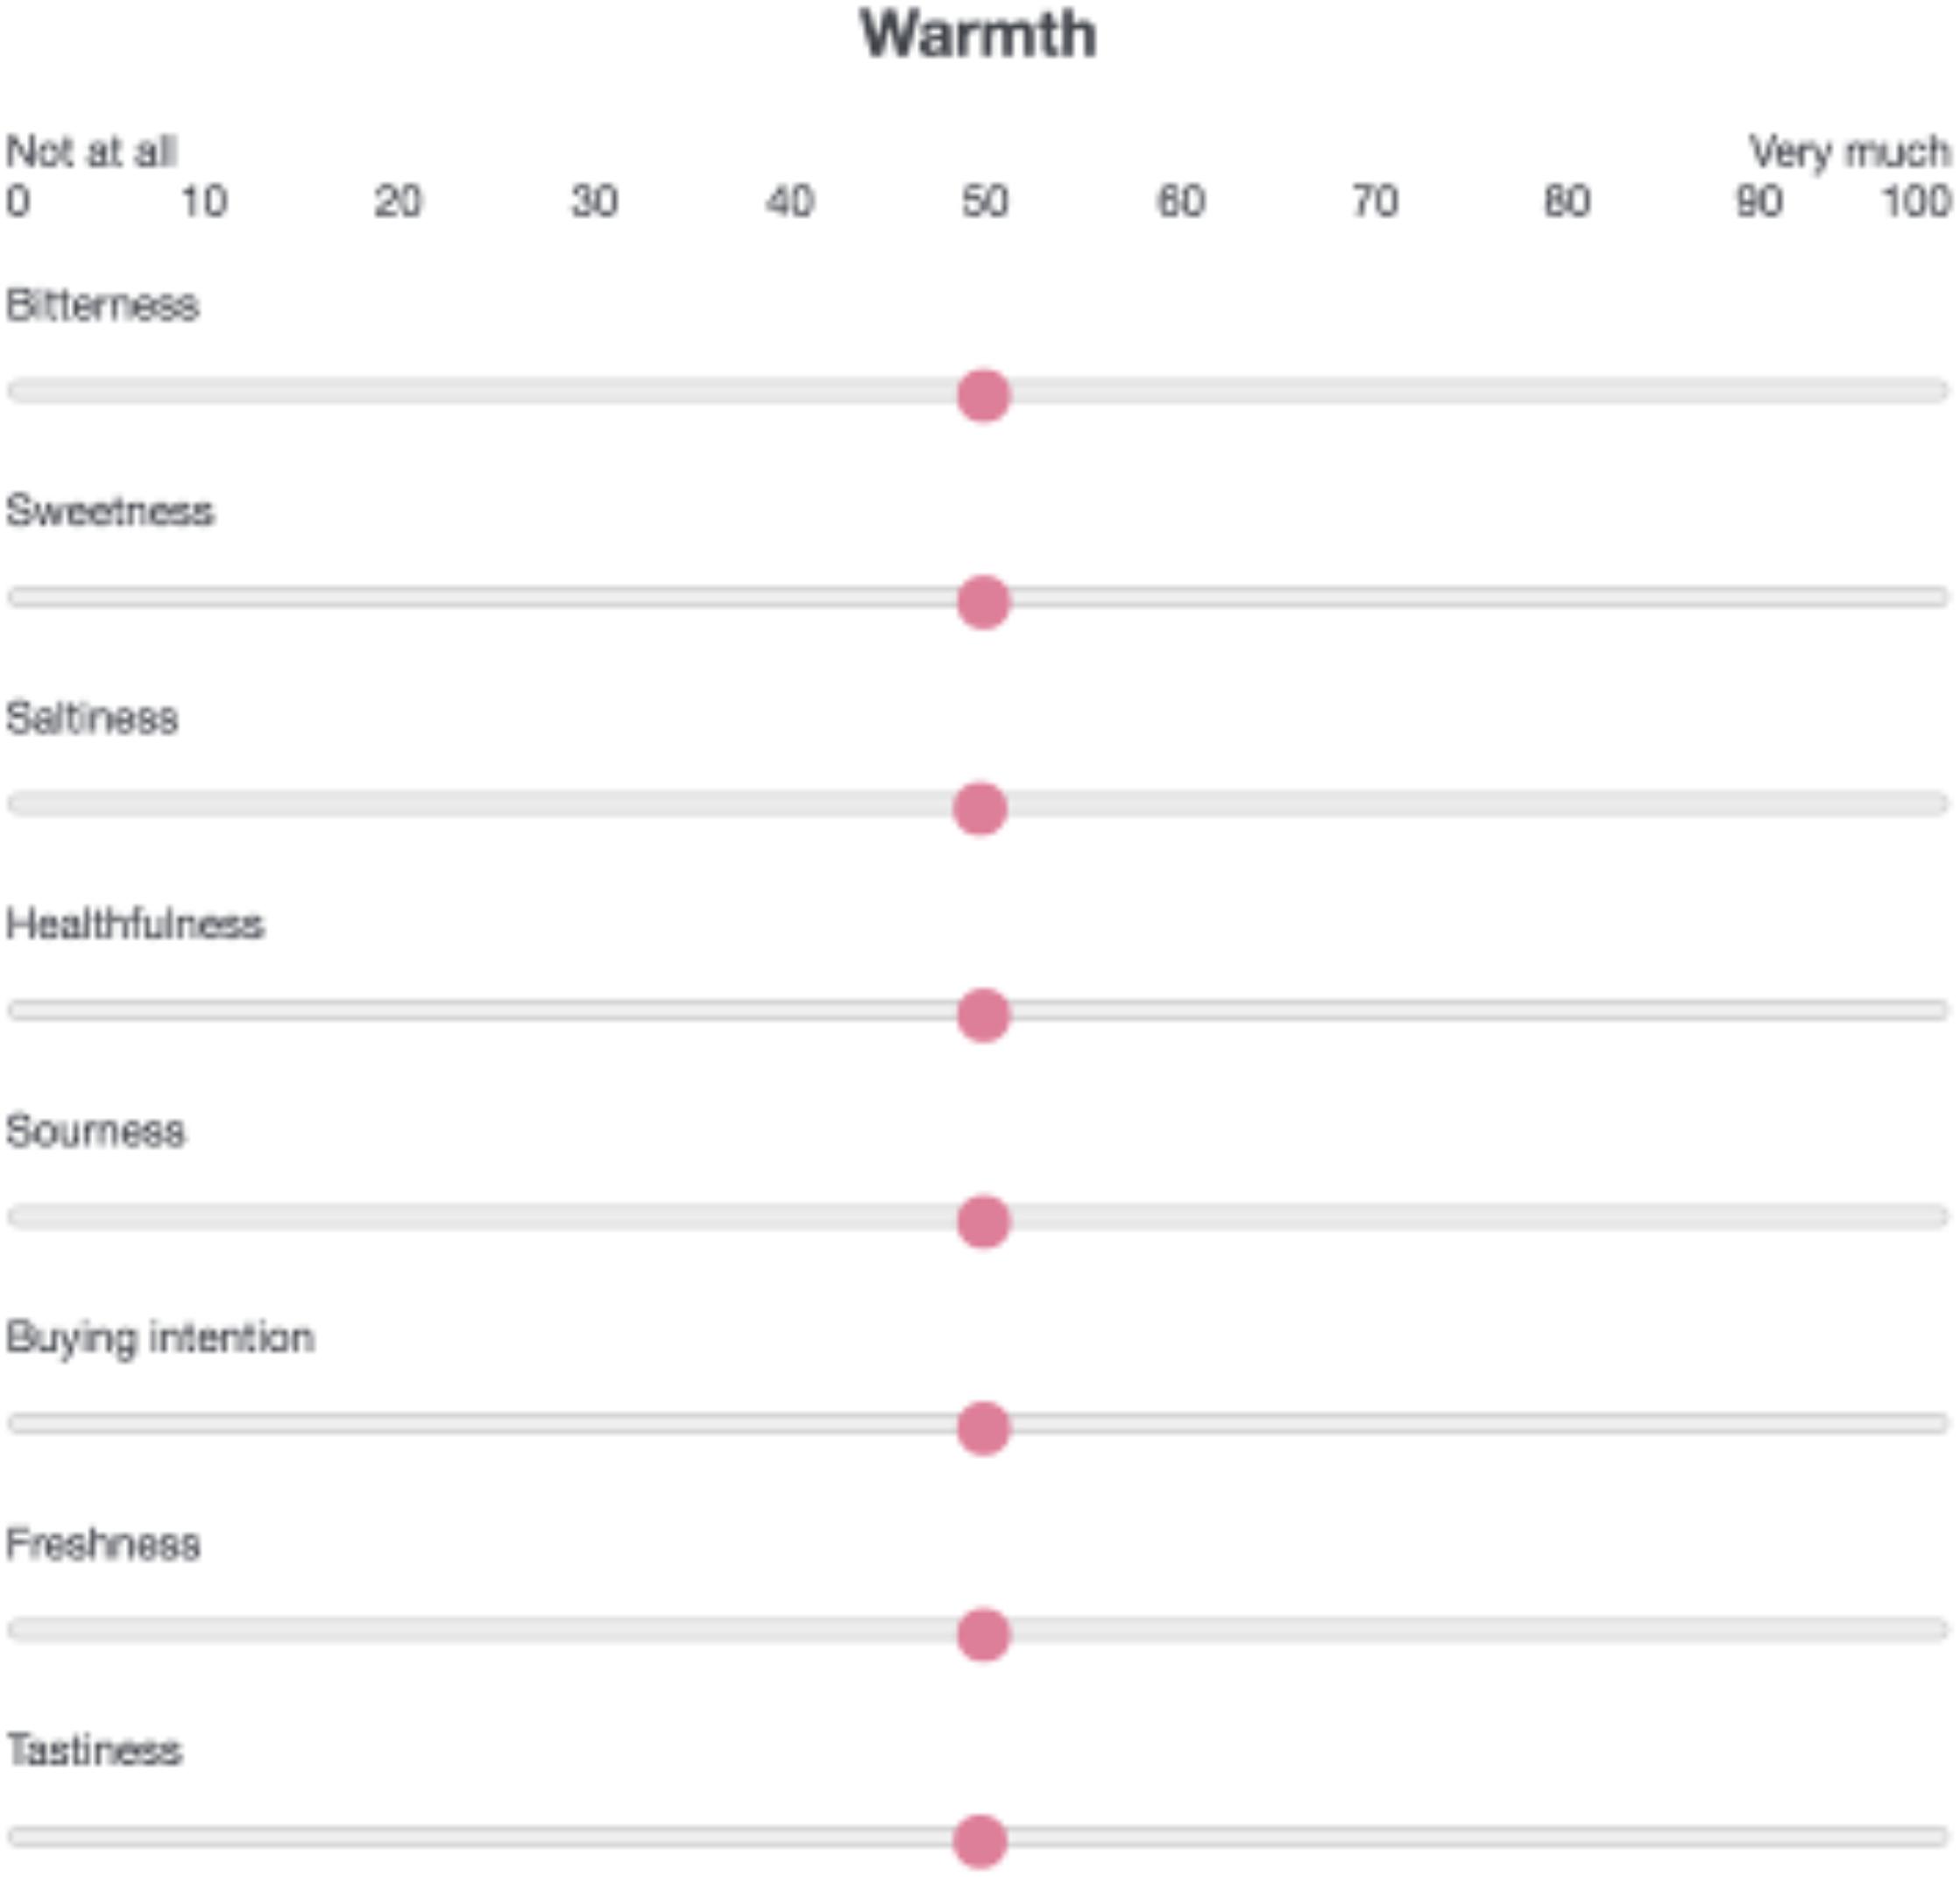
Figure 1. Temperature–taste matching task. Participants were asked to match a temperature word (warmth, coolness) with a sensory/hedonic attribute (tastiness, healthfulness, sweetness, sourness, saltiness, bitterness, freshness, buying intention) using a visual analog scale ranging from 0 (not at all) to 100 (very much).
Statistical Analyses
We calculated the degree to which the warm and cold words were matched with taste attributes using paired t tests. p < 0.006 (0.05/8) was considered significant with the Bonferroni correction. This procedure was similar to that used in a previous study on cross-modal correspondence (Motoki et al., 2019b).
We also conducted multivariate analysis of covariance (MANCOVA) to assess the effects of temperature (warm, cool) on taste ratings (tastiness, healthfulness, sweetness, sourness, saltiness, bitterness, warmth, freshness, and buying intention), with gender as a covariate. Gender was included because a previous study showed gender differences in perceptions of thermal sensation (Karjalainen, 2007). Two participants did not reveal their gender, so those two participants were excluded from analyses. The final sample included 101 participants. Each sensory/hedonic attribute was rated on a scale from 1 to 7. We focused on the interactive effects of temperature and gender. Data were analyzed with SPSS software (version 25.0; SPSS Inc., Chicago, IL, United States).
Results
The word warm was matched more often with saltiness, tastiness, healthfulness, and buying intention than the word cool. By contrast, the word cool was matched more often with sourness and freshness than the word warm (Figure 2). The words warm and cool did not differ in terms of matching with sweetness and bitterness. A statistical summary is shown in Table 1.
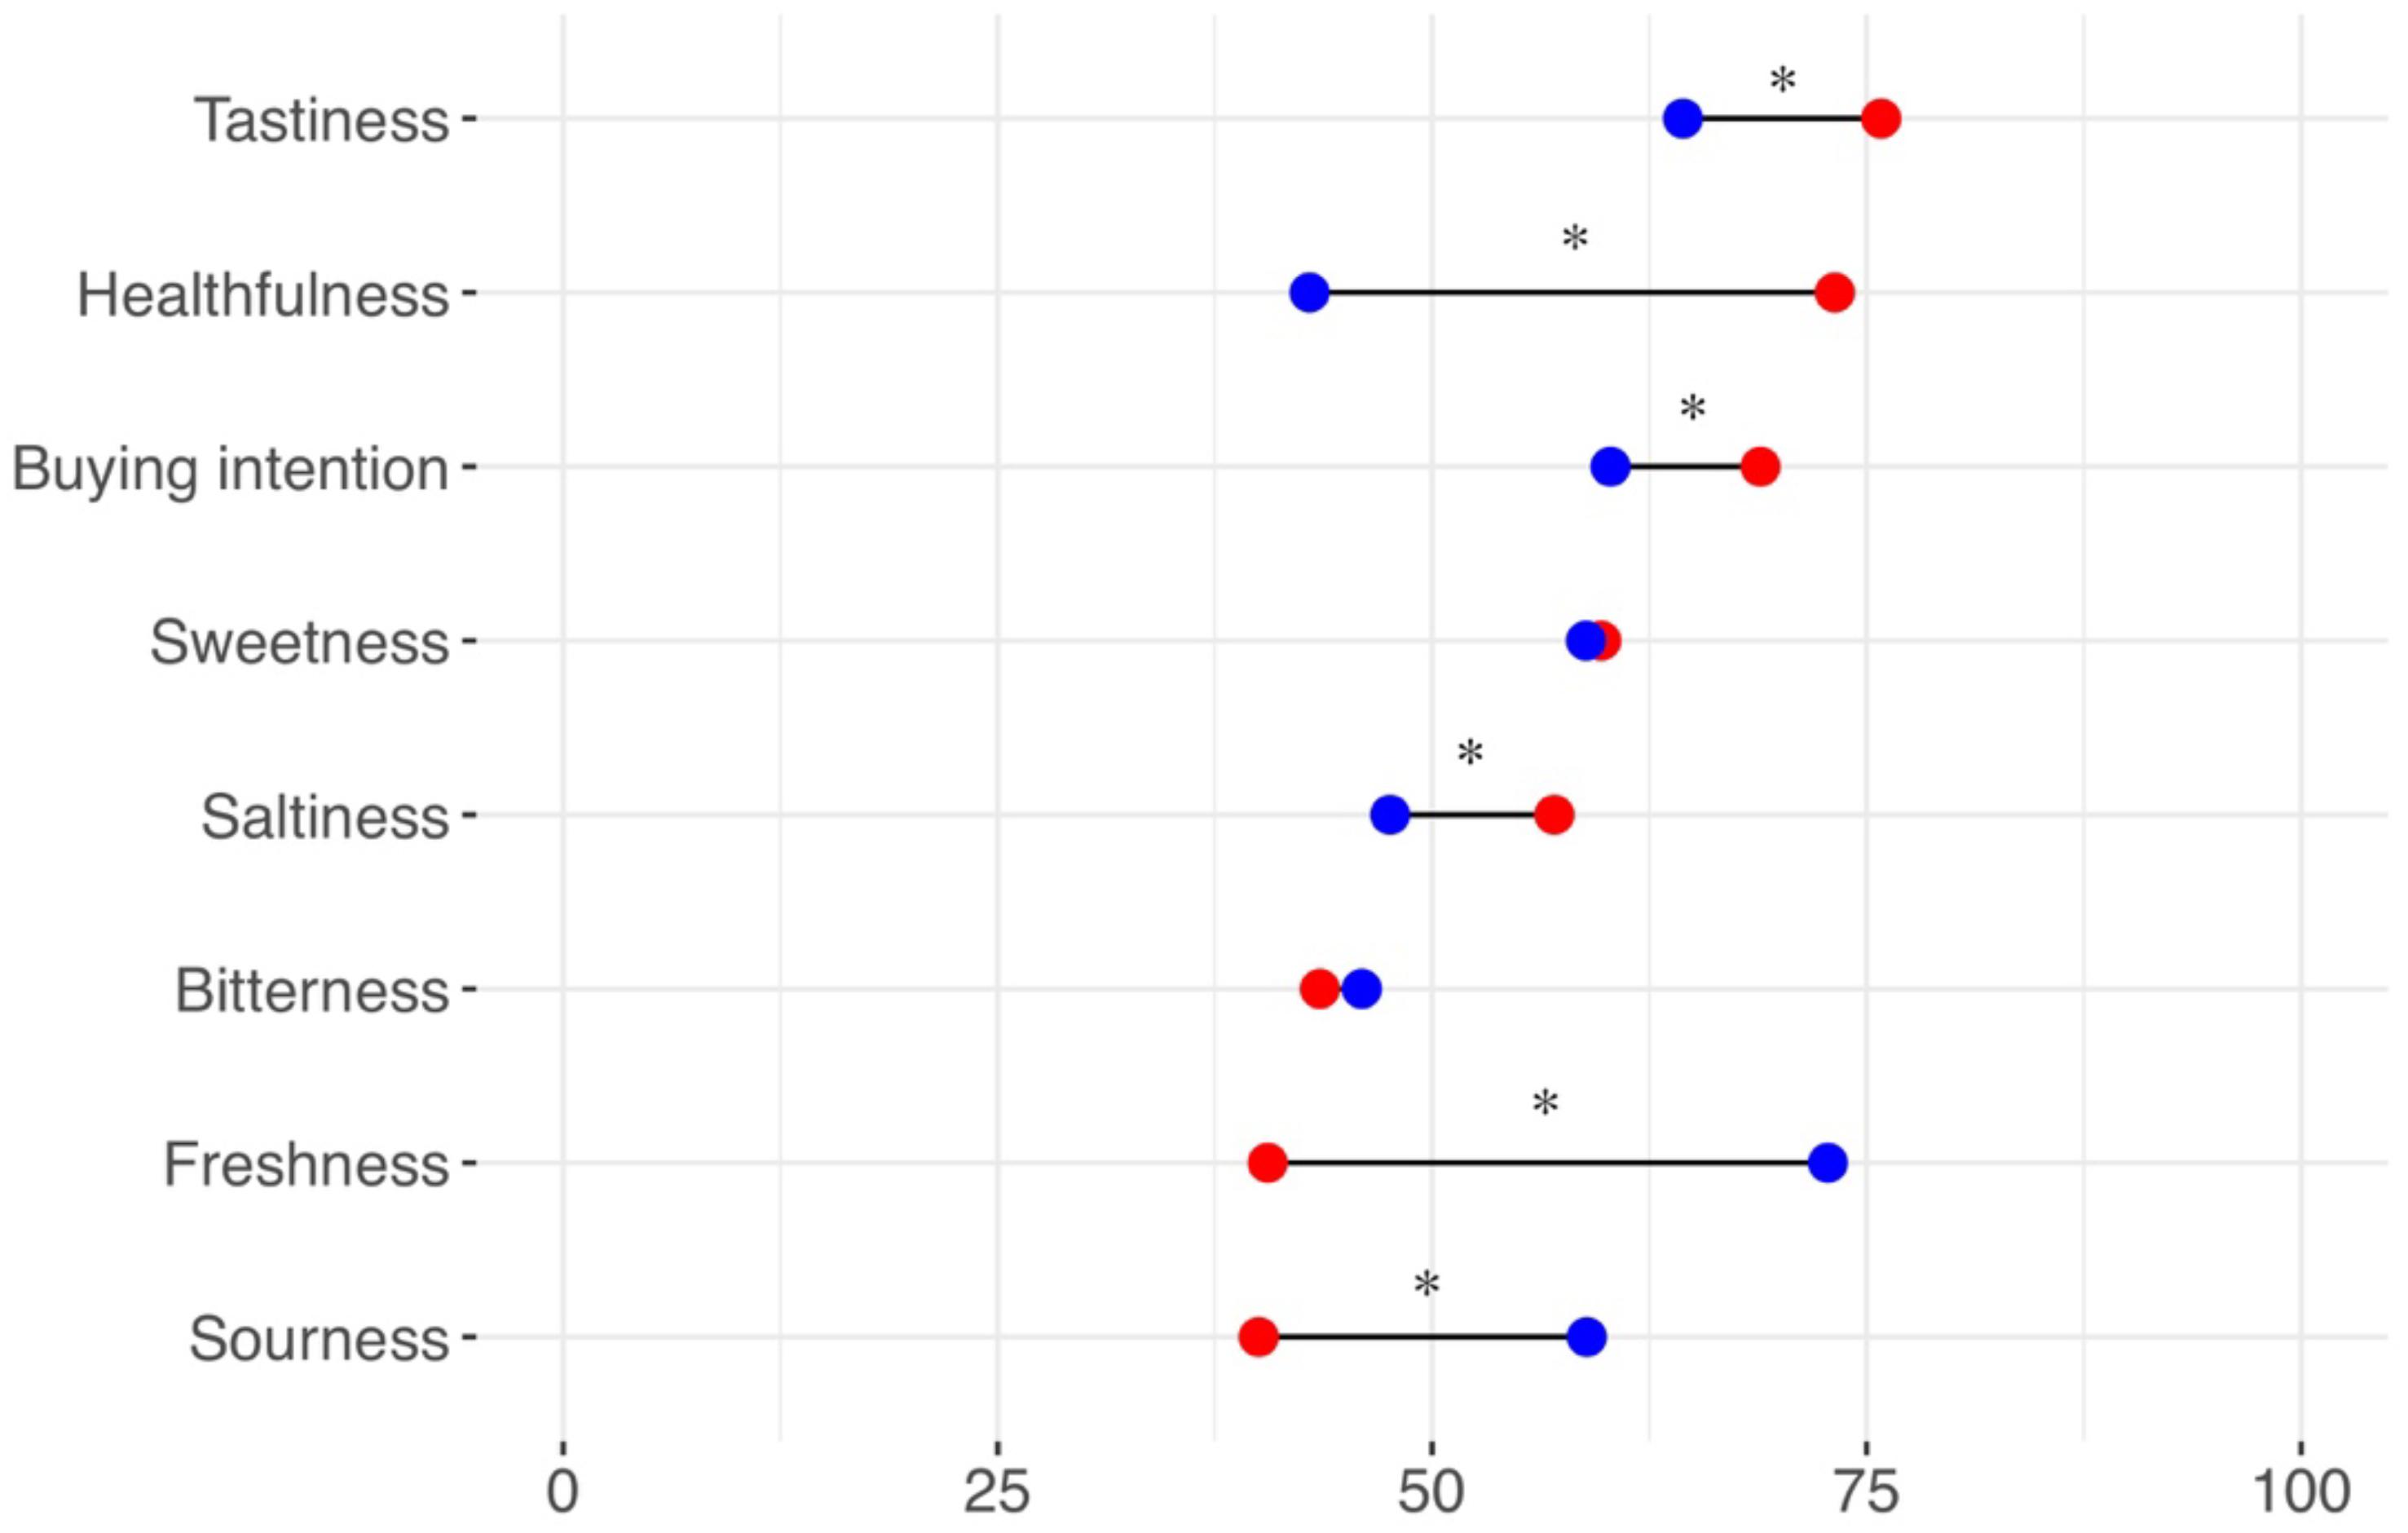
Figure 2. An illustration of temperature–taste attribute matching. The match between temperature words (warmth, coolness) and sensory/hedonic attributes was rated using a scale ranging from 0 (not at all) to 100 (very much). Red circles represent the mean data for warmth. Blue circles represent the mean data for coolness. An asterisk indicates a significant difference at p < 0.006 (0.05/8).
Table 1. Temperature–taste attribute matching.
The MANCOVA results revealed a significant main effect of temperature [F(8, 92) = 28.967, Wilks’ lambda = 0.284, p < 0.001, ηp2 = 0.716] and an interaction effect of temperature and gender [F(8, 92) = 2.395, Wilks’ lambda = 0.828, p = 0.022, ηp2 = 0.172]. No main effect of gender was observed [F(8, 92) = 1.133, Wilks’ lambda = 0.910, p = 0.349, ηp2 = 0.090]. Univariate ANCOVA showed that the word cool matched more frequently with saltiness and freshness than warm. A further univariate ANCOVA revealed significant interactive effects of temperature and gender on sour, healthfulness and buying intention. The matching scores for warmth–healthfulness [F(1, 99) = 6.333, p = 0.014, η2p = 0.060] and warmth–buying intention [F(1, 99) = 5.973, p = 0.016, η2p = 0.057] were higher in females than in males. In contrast, no differences were observed between males and females in coolness–healthfulness [F(1, 99) = 1.503, p = 0.223, η2p = 0.015] or coolness–buying intention [F(1, 99) = 0.670, p = 0.415, η2p = 0.007]. The matching score of coolness–sourness [F(1, 99) = 8.969, p = 0.004, η2p = 0.083] was higher in males than in females. By contrast, no differences were observed between males and females in warmth–sourness [F(1, 99) = 0.561, p = 0.456, η2p = 0.006]. A statistical summary is shown in Table 2.
Table 2. Results of univariate analysis of covariance investigating the effects of temperature and gender on taste ratings.
The results of Experiment 1 revealed that people have specific associations between temperatures and sensory/hedonic attributes. Experiment 2 investigated whether these associations have consequences for taste expectations and experiences.
Experiment 2
The aim of Experiment 2 was to reveal whether cross-modal mental representations (the findings of Experiment 1) affect corresponding sensory/hedonic perceptions of beverages, with a focus on manipulating food-extrinsic warmth. We investigated how physical warmth influences corresponding sensory/hedonic ratings of Japanese tea (Experiment 2a) and black coffee (Experiment 2b). These two beverages were chosen because both are popular beverages in Japan (Pitelka, 2013; Whitelaw, 2014) and therefore might be consumed in situations involving food-extrinsic temperatures.
Materials and Methods
Design and Participants
The experimental design was a 2 (physical warmth: warm, cold) × 2 (time: pretasting, posttasting) design in which all factors were within-participants variables. A total of 69 participants gave their informed consent to take part in one of the two experiments. Data from 35 participants were included in the final analyses for Experiment 2a (seven females; age: 20.77 ± 1.48 years), and data from 34 participants were included in the final analyses for Experiment 2b (15 females; age: 21.41 ± 3.21 years). The relatively small sample sizes were due to time constraints in data collection. The participants were recruited through notices on a university campus and provided written informed consent after receiving an explanation of the experiment. All procedures were conducted according to the Declaration of Helsinki. The experimental protocol was approved by the Ethics Committee of Tohoku University School of Medicine.
Stimuli
We used different beverages in Experiments 2a and 2b to test for the generalizability of the temperature effects on sensory/hedonic perceptions of beverages. In Experiment 2a, Japanese tea (Oi Ocha Roasted rice tea with matcha; Itoen, Tokyo, Japan) was used3. The ingredients of the Japanese tea included roasted rice, tea leaves, matcha, and vitamin C. In Experiment 2b, black coffee (Nescafé Gold blend full-boiled; Nestle, Tokyo, Japan) was used4. The black coffee was decaffeinated and served without sugar. The bottled Japanese tea (Experiment 2a) or black coffee (Experiment 2b) was poured into a white paper cup (about 10 mL per cup) and served to the participants. Both the Japanese tea and black coffee were stored at room temperature, and the serving temperature was not assessed in either experiment. Previous studies used about 10 mL of each solution and confirmed that this was sufficient for participants to perceive different taste qualities (Crisinel and Spence, 2011; Wang et al., 2016). Both Japanese tea and black coffee were stored at room temperature. As in previous studies (Crisinel and Spence, 2011; Wang et al., 2016), the serving temperature was not recorded because both beverages were stored in the same room in the second and third week of March. Thus, it is unlikely that the temperatures of the beverages varied across participants.
Manipulation of Physical Warmth
Participants wore a hot (warm condition) or a cold (cold condition) pad (Figure 3) around their neck. The warm and cold pads were of the same design. The procedure followed that of a previous study featuring the manipulation of physical warmth (Motoki et al., 2019b). It has been shown that this manipulation significantly affects subjective thermal sensations (Motoki et al., 2019b). The hot and cold pads were used following the manufacturer’s instruction and were about 50°C and −5°C, respectively (Motoki et al., 2019b).

Figure 3. Hot/cold pad.
Procedure
Participants (one at a time) were led to a table and sat in a chair. At the start of the experiments, participants were told that they would drink tea (Experiment 2a) or coffee (Experiment 2b) while wearing a hot/cold pad. The timeline of the experimental procedure is shown in Figure 4.
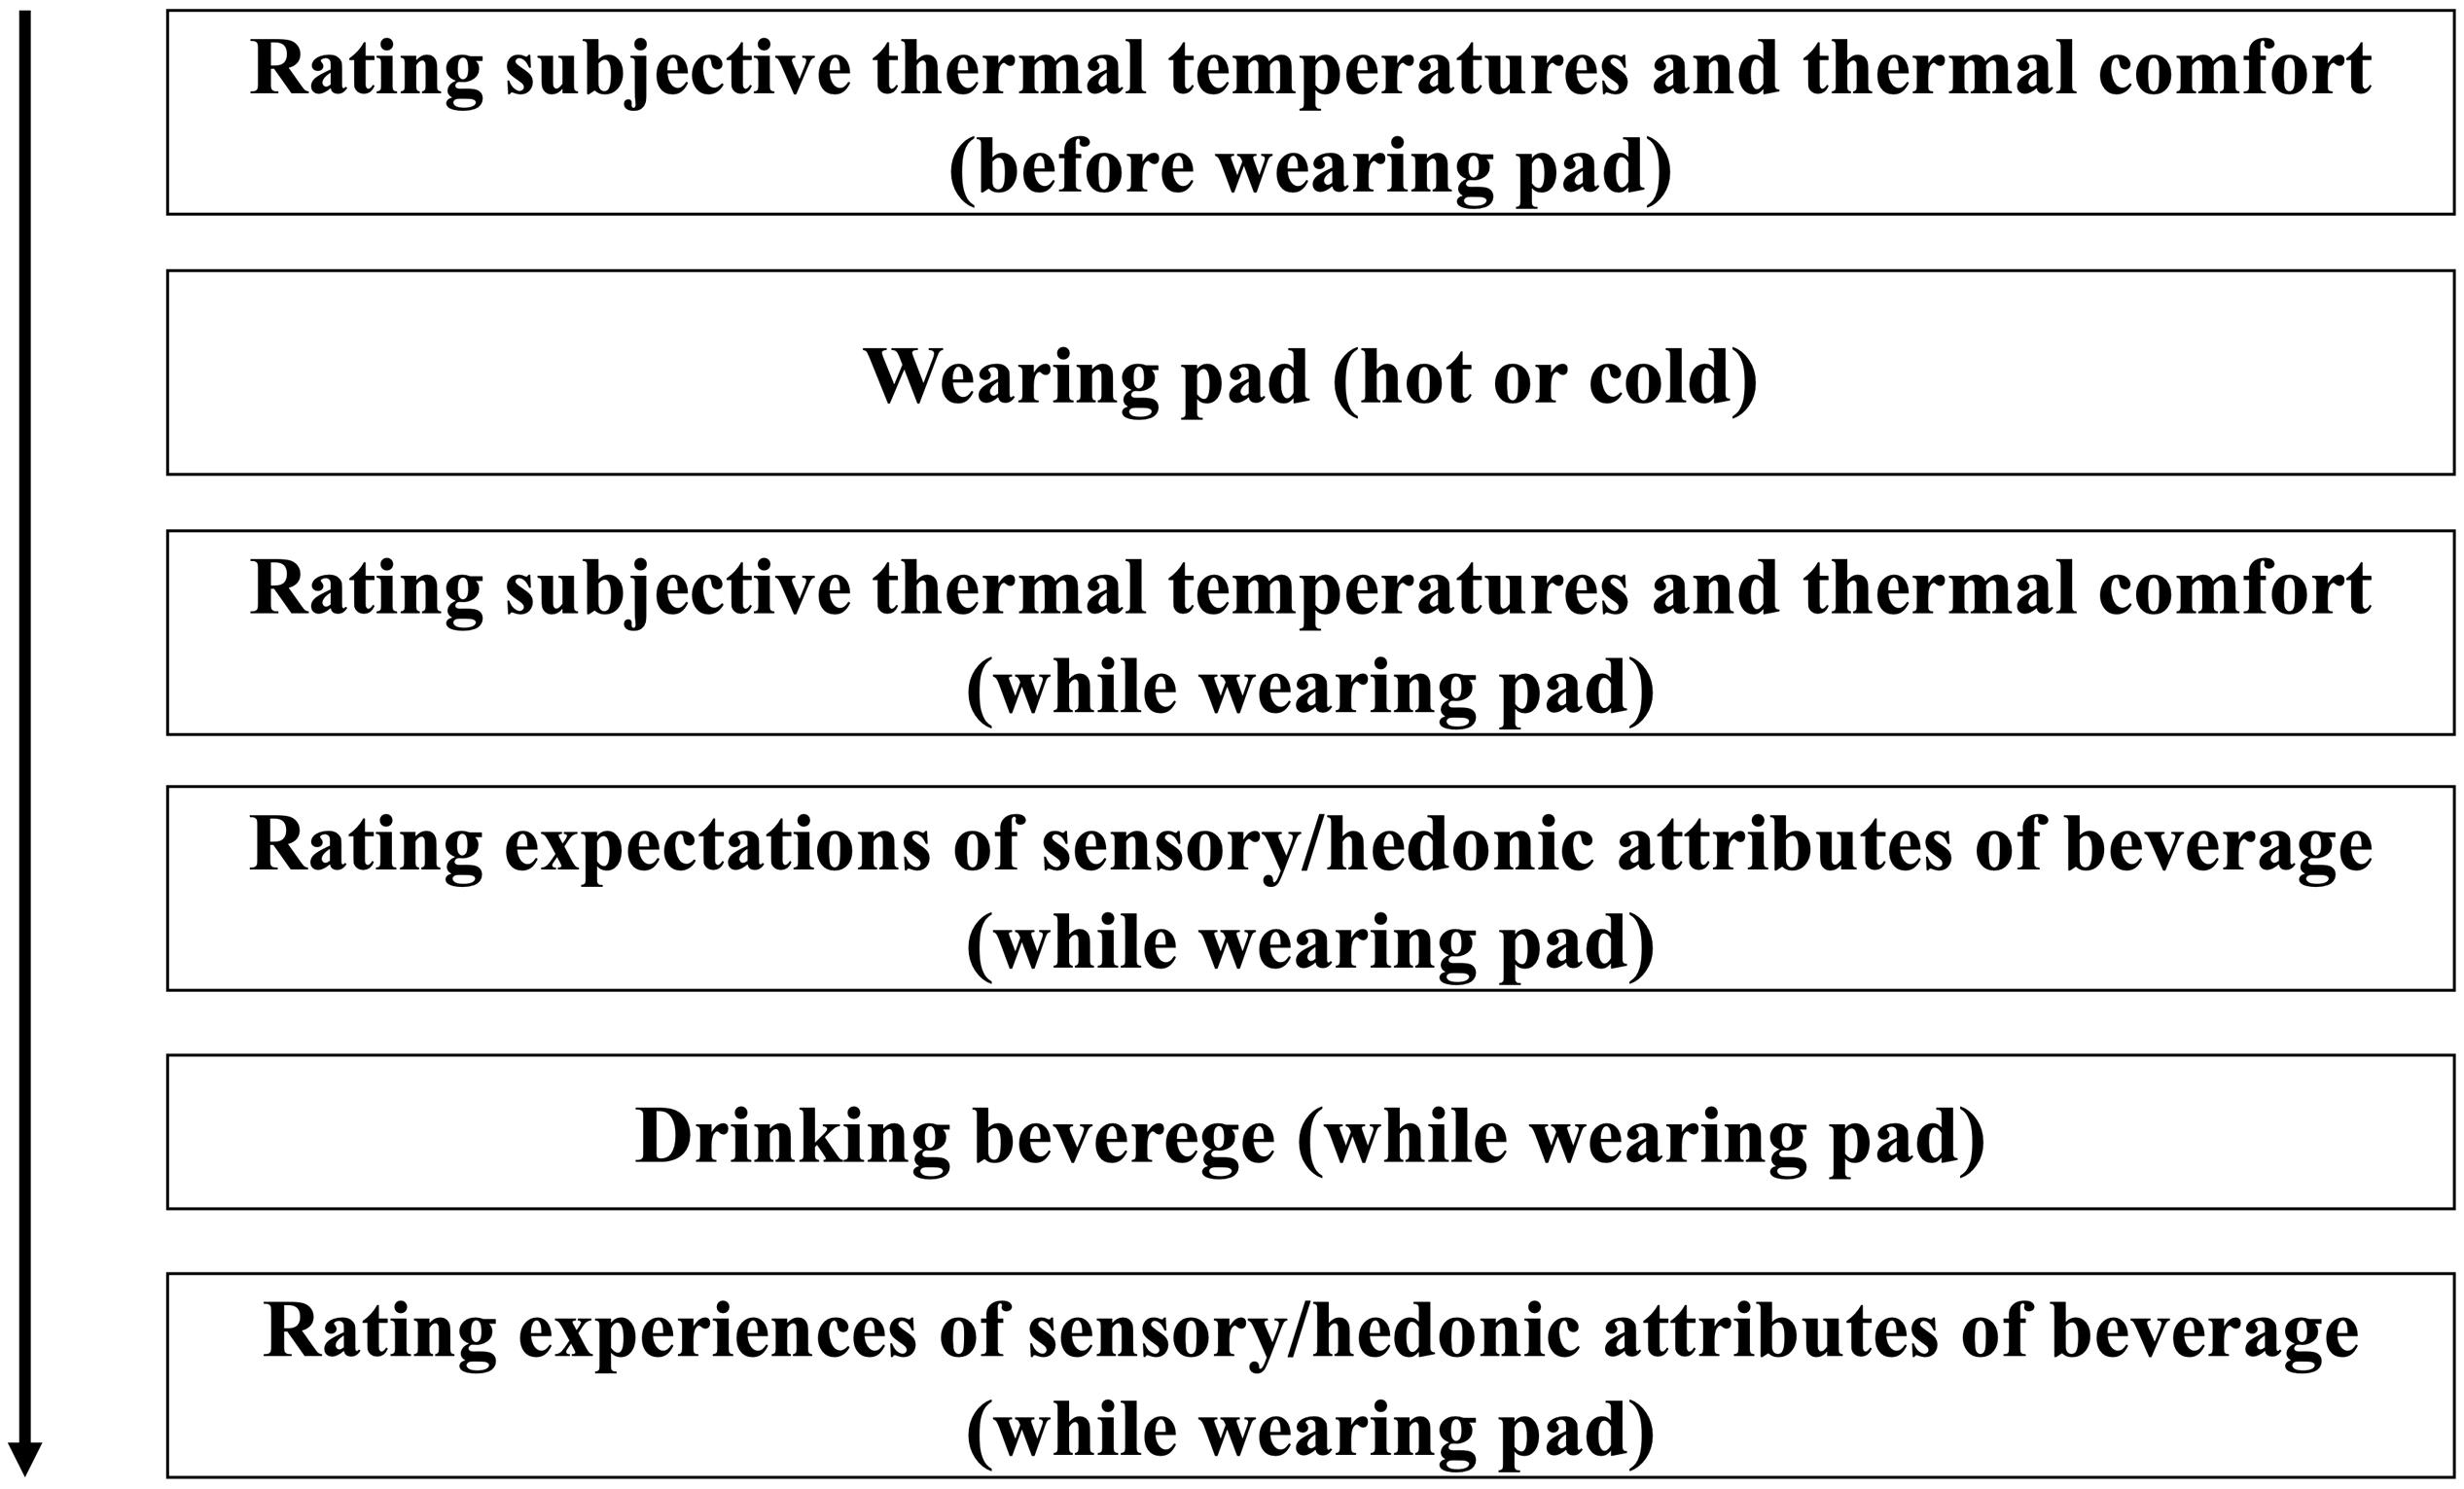
Figure 4. Timeline for the experimental procedure. The procedure was repeated in the other condition (hot or cold), and the order of the conditions was randomly allocated.
The two drinks were served at the same temperature, although we told the participants that both drinks were different. Before they put on the pad (hot or cold), they answered baseline questions on thermal temperature (1: very cold to 7: very hot) and thermal comfort (1: very negative to 7: very positive) using a 7-point Likert scale. After putting on the pad (hot or cold), participants answered the temperature and comfort questions again.
While wearing the pad, participants saw the served drinks (Japanese tea for Experiment 2a and black coffee for Experiment 2b) and gave their expected sensory/hedonic ratings (tastiness, healthfulness, sweetness, sourness, saltiness, bitterness, drink warmth, freshness, buying intention). The rating procedure used a 7-point Likert scale ranging from 1 (not at all) to 7 (very much) for each question. After participants provided their expected ratings, they drank the beverage and provided their experience ratings (tastiness, healthfulness, sweetness, sourness, saltiness, bitterness, drink warmth, freshness, and buying intention). The procedure was repeated in the other condition (hot or cold), and the order of the conditions was randomly allocated. The participants rested for about 1 min between conditions. None of the participants in either of the two experiments were informed about the brand name, origin, taste, temperature, or flavor profile of the drinks that they were served; they only knew that they would drink Japanese tea (Experiment 2a) and coffee (Experiment 2b). To reduce discomfort during wearing the pads, it took a short amount of time (about 30–60 s) to complete the thermal and beverage ratings. The time required to complete the entire procedure was about 5 min.
Statistical Analyses
To verify the influence of physical warmth on thermal sensation and comfort, we conducted paired t-tests on the change in scores (while wearing the hot/cold pad minus before wearing the pad).
For both Experiments 2a and 2b, repeated-measures (RM) ANCOVAs were conducted to assess the effects of physical warmth (warm, cold) and time (pretasting, posttasting) on the taste ratings (tastiness, healthfulness, sweetness, sourness, saltiness, bitterness, warmth, freshness, and buying intention) with gender and thermal comfort as covariates. Gender was included as a covariate because a previous study reported gender differences in perceptions of thermal sensation (Karjalainen, 2007), and the results of Experiment 1 showed gender differences. Each sensory/hedonic attribute rated on a scale from 1 to 7 was a dependent variable in the RM-ANCOVAs. The analyses were conducted with SPSS version 25 (IBM, Chicago, IL, United States).
Results of Manipulating Physical Warmth
The means and SDs of thermal sensation were wearing the hot pad (Experiment 2a: M = 5.600 ± 0.695; Experiment 2b: M = 5.382 ± 0.922), before wearing the hot pad (Experiment 2a: M = 2.914 ± 0.818; Experiment 2b = 3.029 ± 0.797), wearing the cold pad (Experiment 2a: M = 1.714 ± 0.667; Experiment 2b: M = 1.971 ± 0.717), and before wearing the cold pad (Experiment 2a: M = 3.171 ± 0.857; Experiment 2b = 3.353 ± 0.883). The means and SDs of thermal comfort were wearing the hot pad (Experiment 2a: M = 5.551 ± 1.222; Experiment 2b: M = 5.529 ± 1.134), before wearing the hot pad (Experiment 2a: M = 3.543 ± 1.197; Experiment 2b = 4.147 ± 1.282), wearing the cold pad (Experiment 2a: M = 2.686 ± 1.255; Experiment 2b: M = 3.235 ± 1.281), and before wearing the cold pad (Experiment 2a: M = 4.086 ± 1.337; Experiment 2b = 4.588 ± 1.373).
Thermal sensation in the warm condition was rated as warmer than that in the cold condition (Experiment 2a: Mhot pad–before hot pad = 2.686 ± 0.832 vs. M cold pad–before cold pad = –1.457 ± 0.950, t34 = 21.977, p < 0.001; Experiment 2b: Mhot pad–before hot pad = 2.353 ± 1.252 vs. Mcold pad–before cold pad = –1.382 ± 0.817, t33 = 16.930, p < 0.001). Thermal comfort in the warm condition was rated more favorably than that in the cold condition (Experiment 2a: Mhot pad–before hot pad = 1.971 ± 1.689 vs. Mcold pad–before cold pad = –1.400 ± 0.976, t34 = 10.699, p < 0.001; Experiment 2b: Mhot pad–before hot pad = 1.382 ± 1.701 vs. Mcold pad–before cold pad = –1.353 ± 1.276, t33 = 8.958, p < 0.001). Although the thermal sensation manipulations were successful, a difference in thermal comfort was observed between the warm and cold conditions. Thus, we included a thermal comfort score (changed comfort in the warm condition – changed comfort in the cold condition) as a covariate in further analyses.
Results for Japanese Tea (Experiment 2a)
The analyses revealed significant main effects of physical warmth and time. However, no main effects of gender or thermal comfort or any interactive effects were observed (p > 0.05; Table 3). Univariate ANCOVAs showed that the participants in the warm (vs. cold) temperature increased their buying intention and healthfulness ratings (Table 4). Further univariate ANCOVAs showed that posttasting (vs. pretasting) increased the buying intention, tastiness, and healthfulness ratings but decreased ratings of sourness, saltiness, and bitterness (Appendix Table A). The statistics are shown in Table 5. The results are illustrated graphically in Figure 5. Note that the main results were unchanged when we ran ANOVAs without the covariates (gender and thermal comfort).
Table 3. Results of repeated-measures analyses of covariance investigating the effects of temperature (warm and cold) and time (pretasting and posttasting) on taste ratings with gender and thermal comfort as covariates.
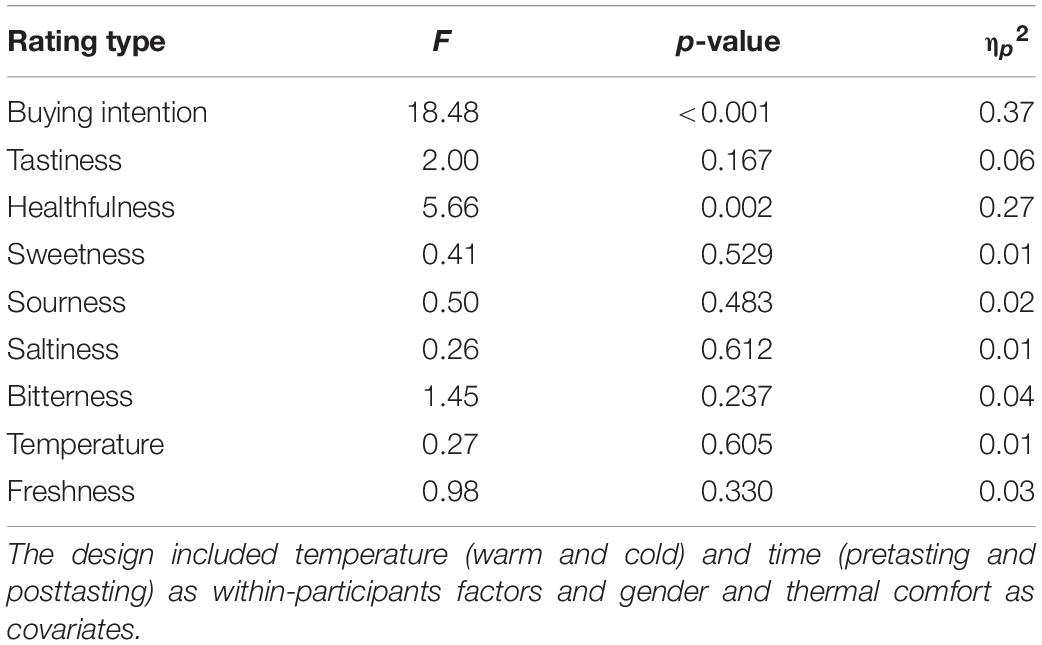
Table 4. Results of univariate analyses of covariance investigating the effects of temperature on taste ratings.
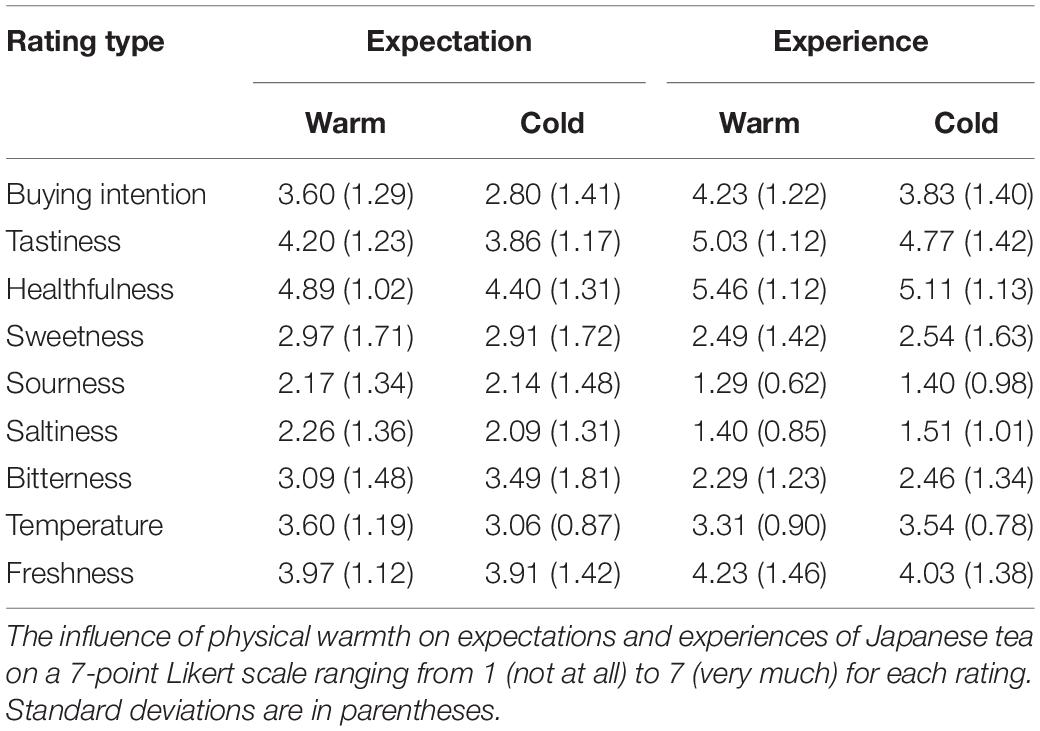
Table 5. Basic statistical summary of Experiment 2a.
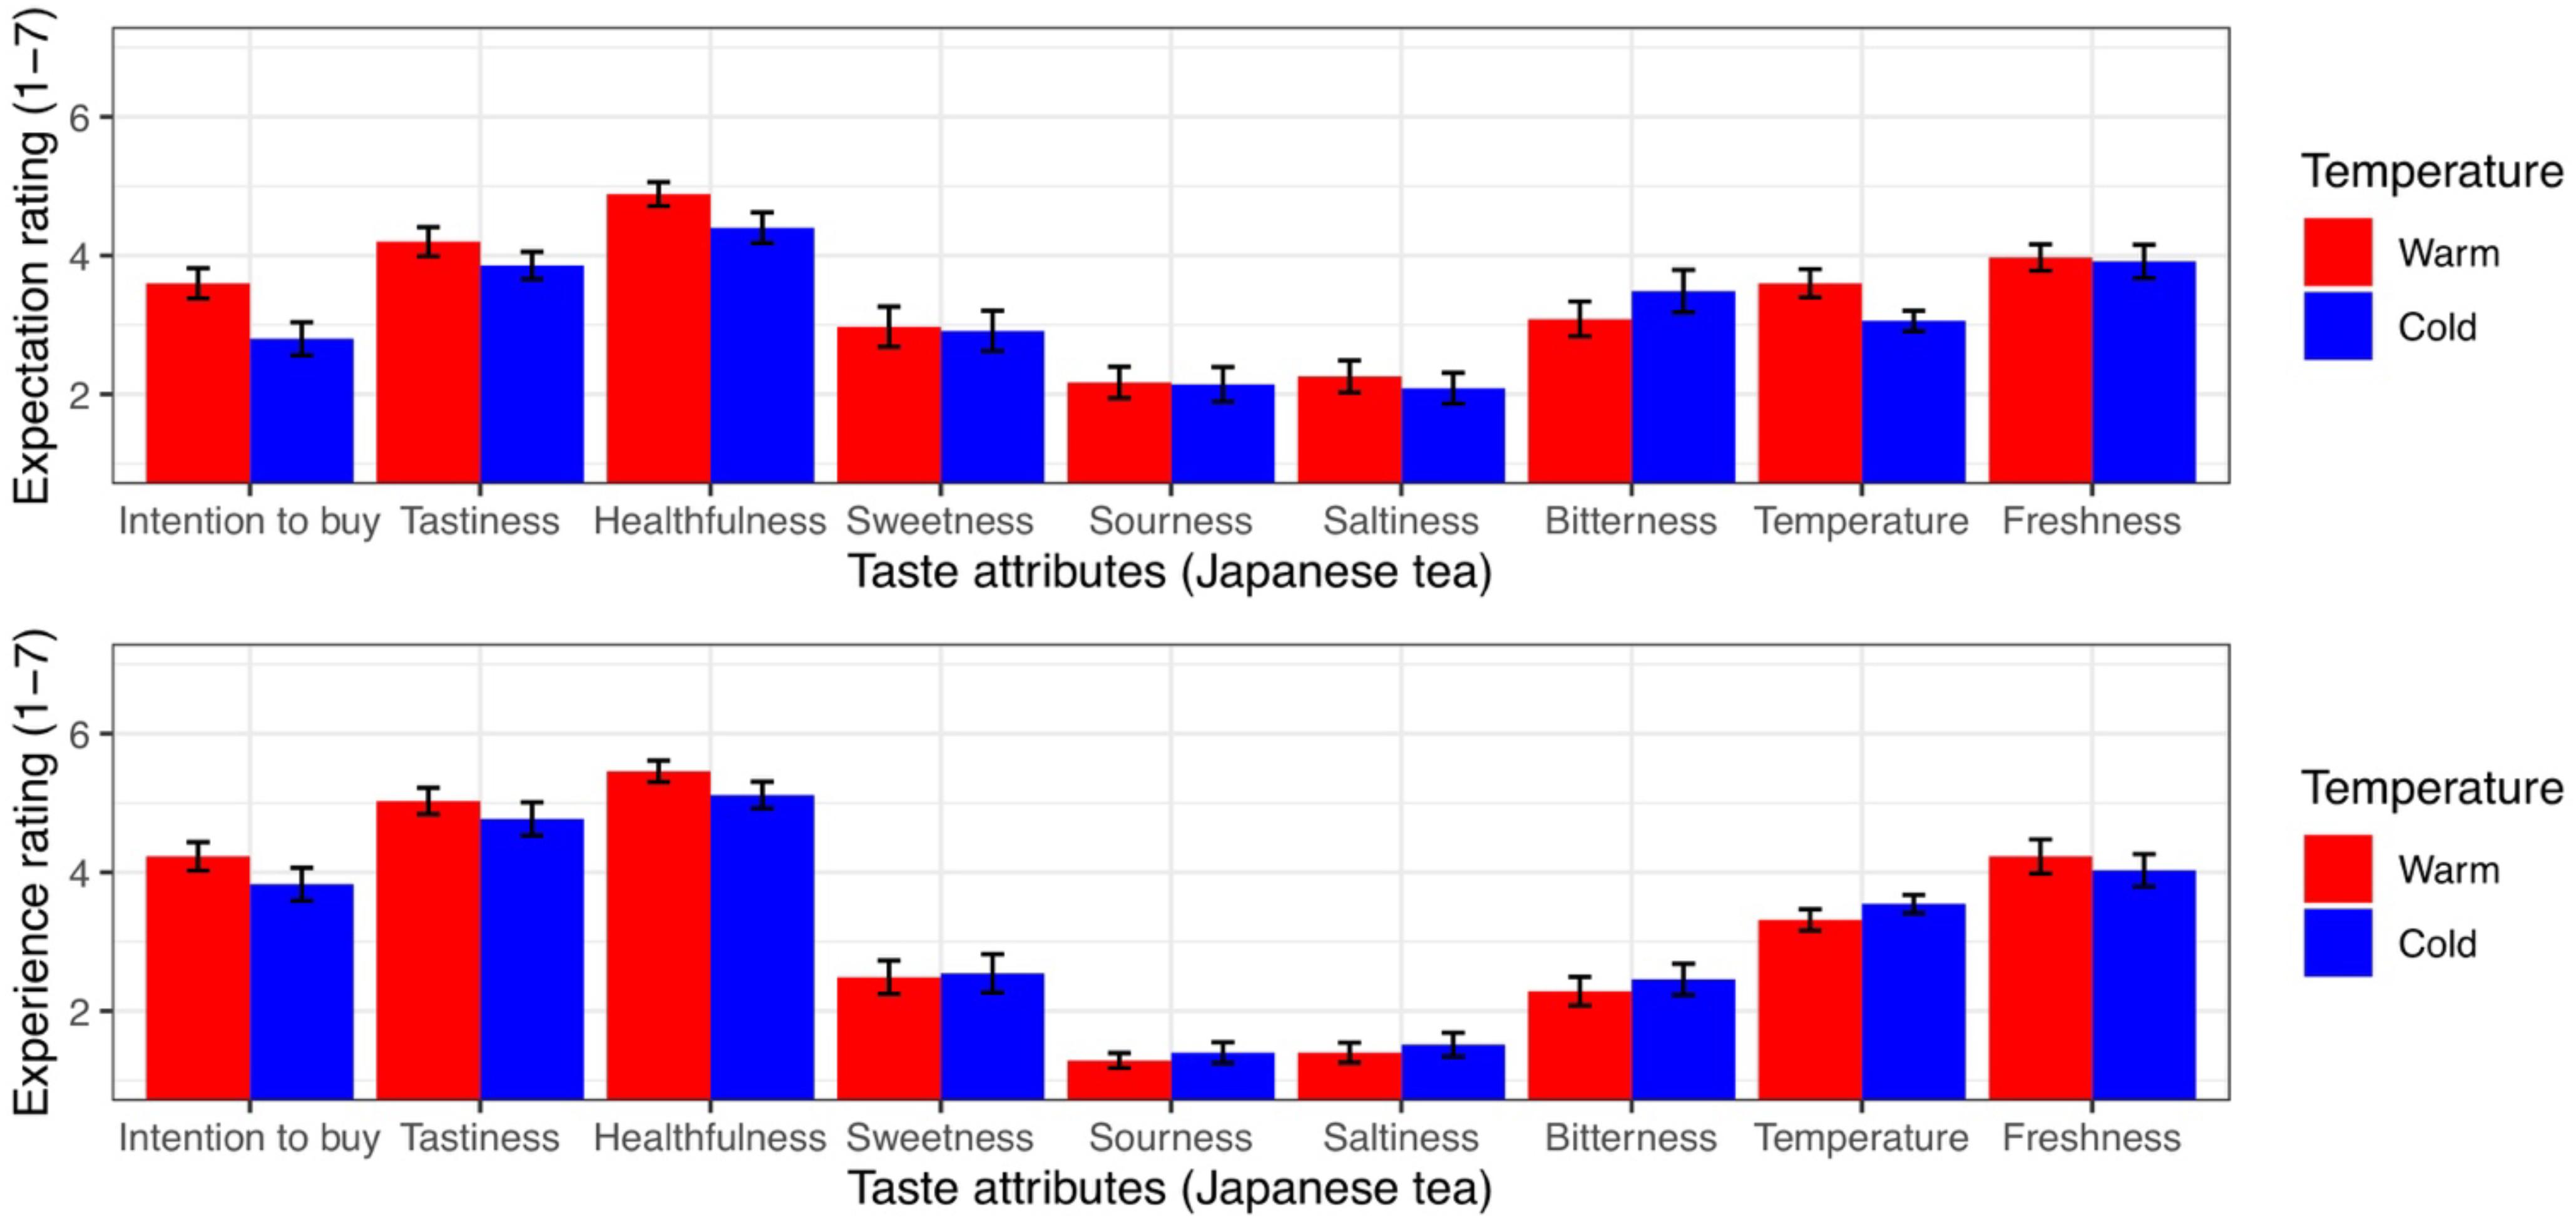
Figure 5. The influence of physical temperature on the taste attributes of Japanese tea. The error bars represent standard error.
Results for Black Coffee (Experiment 2b)
The analyses revealed significant main effects of time. However, no main effects of temperature, gender, or thermal comfort or any interactive effects were observed (Table 6). Follow-up univariate ANCOVAs revealed that pretasting (vs. posttasting) increased the buying intention, tastiness, healthfulness, sweetness, drink warmth, and freshness ratings (Appendix Table B). The basic statistics are shown in Table 7. The data are illustrated graphically in Figure 6. Note that the main results were unchanged when we ran the ANOVAs without the covariates (gender and thermal comfort).
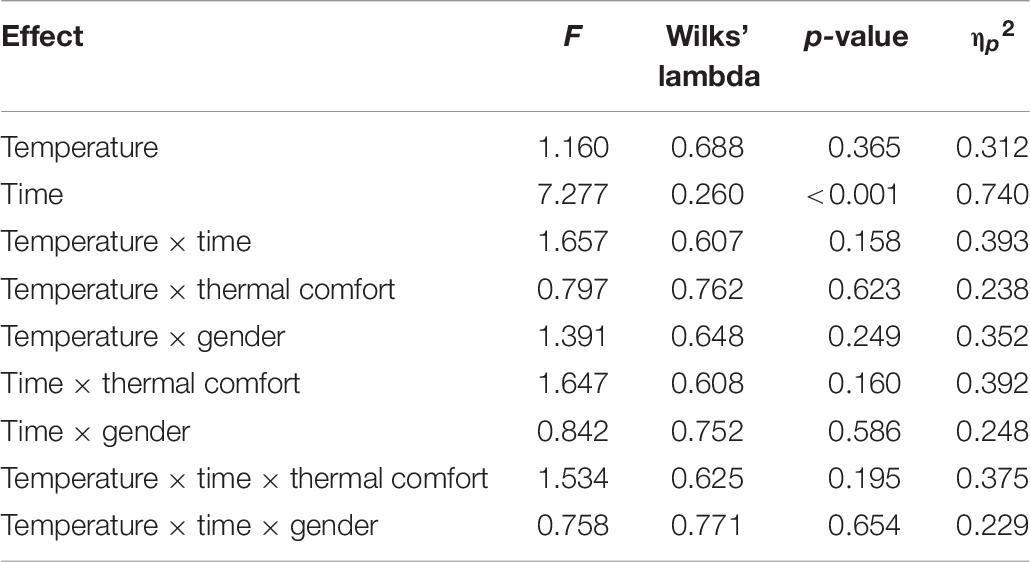
Table 6. Results of repeated-measures analyses of covariance investigating the effects of temperature (warm and cold) and time (pretasting and posttasting) on taste ratings with gender and thermal comfort as covariates.
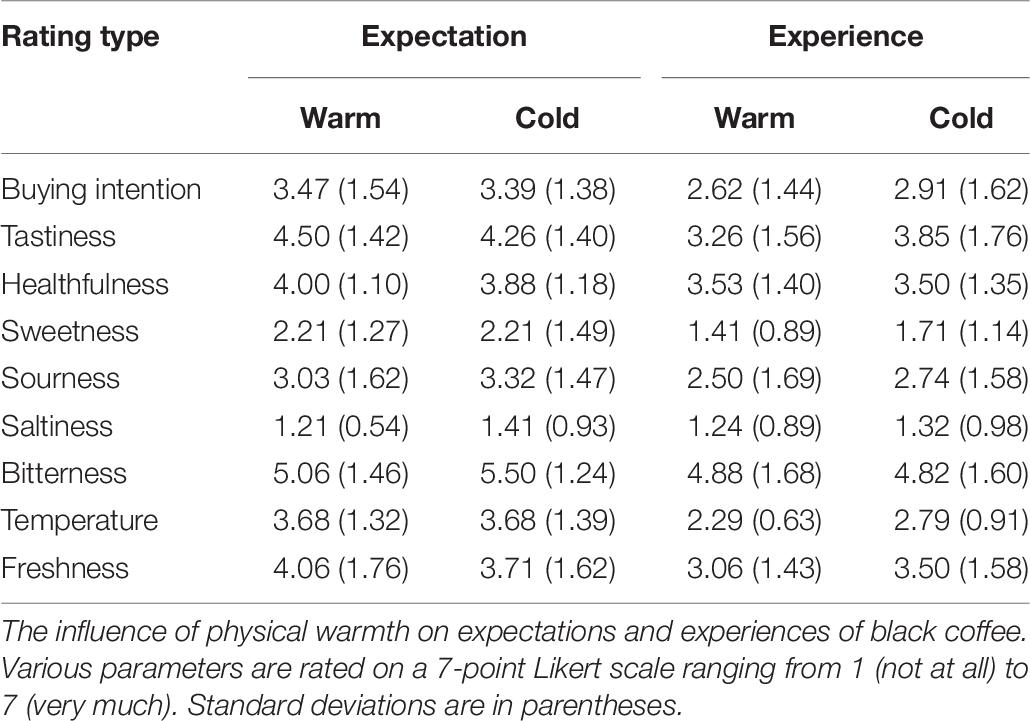
Table 7. Basic statistical summary of Experiment 2b.
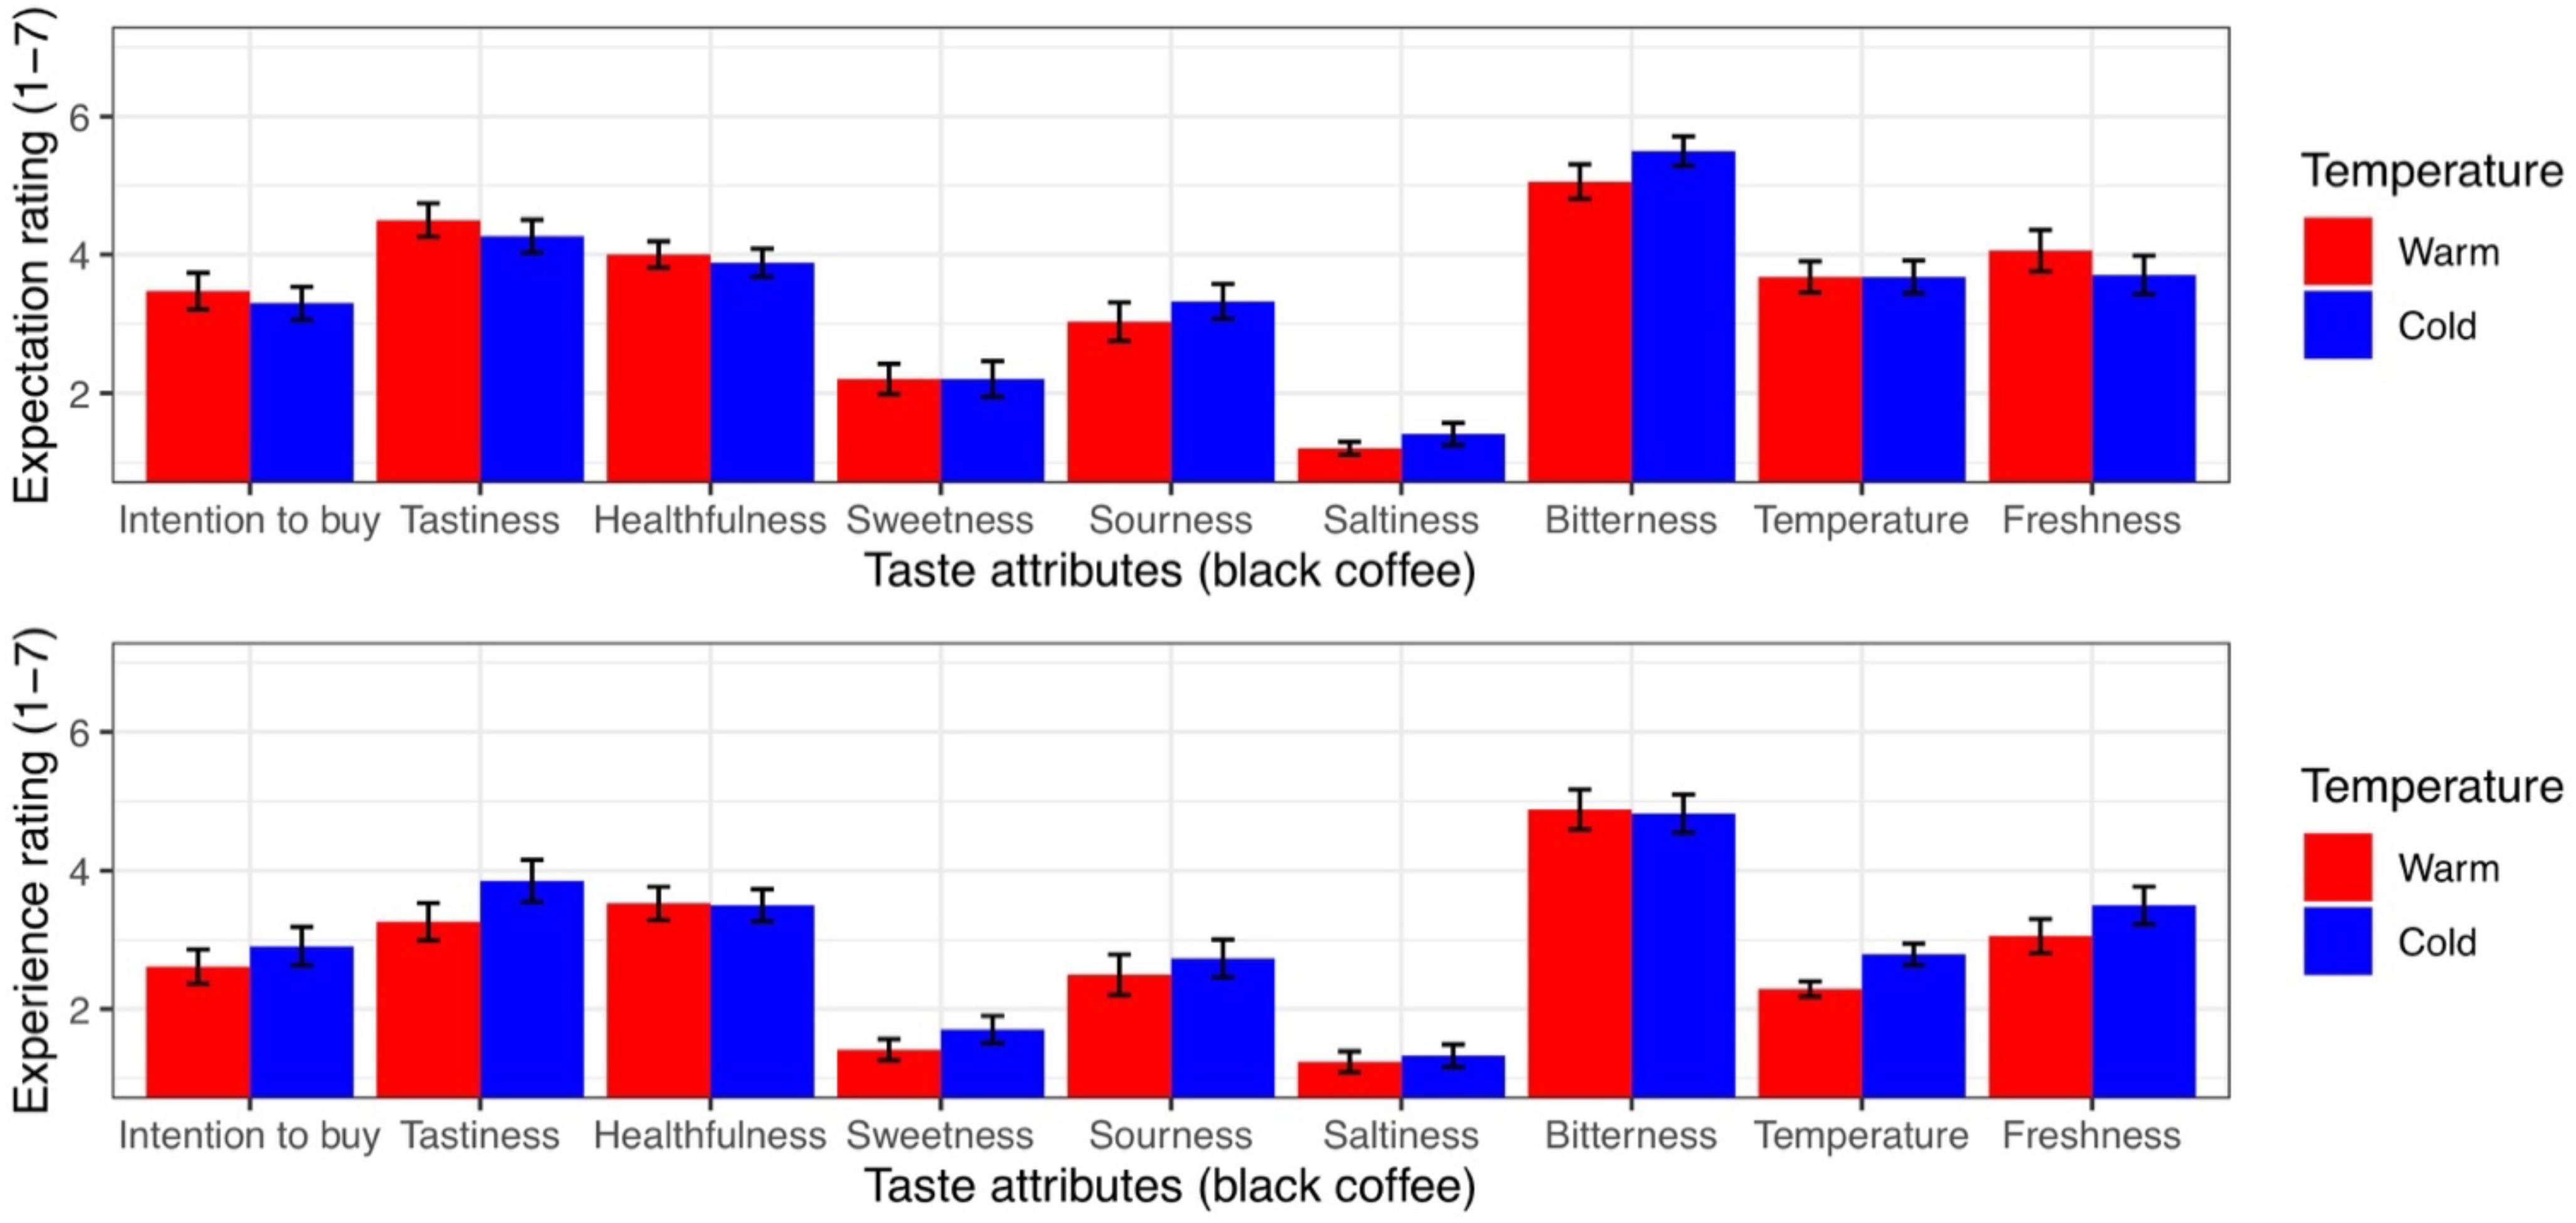
Figure 6. The influence of physical temperature on the taste attributes of black coffee. The error bars represent standard error.
Discussion
This study aimed to determine temperature–taste correspondence. We investigated mental representations of temperature–taste correspondence and cross-modal mental representations that influence corresponding sensory/hedonic perceptions of beverages, with a focus on manipulating the extrinsic warmth of food. The results of Experiment 1 showed that the word warmth (vs. coldness) was matched more with saltiness, tastiness, healthfulness, and buying intention. By contrast, the word coldness (vs. warmth) was matched more with sourness and freshness. The results of Experiment 2a revealed that the experience of physical warmth (vs. coldness) increased healthfulness and buying intention for Japanese green tea. The results of Experiment 2b did not reveal any changes in sensory/hedonic attributes of black coffee following warm versus cold temperatures. These findings provide the evidence of taste–temperature correspondence and provide preliminary support for the association between food-extrinsic temperature and corresponding hedonic attributes.
Temperature–Taste Correspondence
The results of Experiment 1 revealed that people have specific associations between temperature and sensory/hedonic attributes. Although the emerging literature on cross-modal correspondence has shown that temperature has a specific association with other sensory modalities (Velasco et al., 2013; Ho et al., 2014b; Wang and Spence, 2017; Roque et al., 2018; Motoki et al., 2019b), temperature-based cross-modal correspondence has only been reported for visual and auditory features (e.g., warmth and red color). Although a close relationship has been shown between temperature and taste attributes (McBurney et al., 1973; Moskowitz, 1973; Bartoshuk et al., 1982; Green and Frankmann, 1987, 1988; Cruz and Green, 2000; Schiffman et al., 2000; Engelen et al., 2003; Mony et al., 2013; Kim et al., 2015; Stokes et al., 2016; Pramudya and Seo, 2017, 2018), it has not been shown how temperature is specifically associated with taste attributes in the subjective matching task. Our findings show that the word warmth (vs. coldness) was matched more with saltiness, tastiness, healthfulness, and buying intention. By contrast, the word coldness (vs. warmth) was matched more with sourness and freshness. Taken together, these findings provide evidence of temperature–taste correspondence and show how people map the concept of temperature onto sensory/hedonic attributes.
The results of Experiment 2 showed that the experience of physical warmth (vs. coldness) increased healthfulness and buying intention for Japanese green tea. This finding was partially consistent with the results of the word-matching task (Experiment 1), such that warmth (vs. coldness) was more associated with the concepts of healthfulness and buying intention. According to embodiment theory (Barsalou, 2010), abstract psychological concepts (e.g., emotional warmth and positive reactions) are metaphorically grounded in concrete physical experiences (e.g., physical warmth) (Barsalou, 2010). Previous research has demonstrated that physically warm temperatures lead to more positive evaluations of beverages (Zwebner et al., 2014). Although the results of Experiment 1 demonstrated that warmth and coolness are matched more with taste attributes (e.g., warmth with saltiness and coolness with sourness), we did not find any effects of physical warmth on basic taste ratings (sweet, sour, salty, bitter). Taken together, these results indicate that an experience of physical warmth increases the evaluation of abstract food concepts (i.e., healthfulness, buying intention) but does not influence basic taste evaluations.
Underlying Mechanisms for Taste–Temperature Correspondence
The explanation behind temperature–taste correspondence is linked to statistical regularity (Spence, 2011). People may be regularly exposed to a certain mapping of temperatures and taste-related information. For example, salty food (e.g., miso soup) is often served at a warm temperature. By contrast, sour and fresh food (e.g., gumi and carbonated drinks) is often served cold. Consumers might often see such associations between temperatures and tastes in daily dining settings. Repeated exposure to the statistical co-occurrence of temperature and taste attributes may influence internalization of the environmental statistics.
An alternative explanation has to do with valence matching (Velasco et al., 2015; Kantono et al., 2016, 2019; Motoki et al., 2019d; Xu et al., 2019). As we showed here, warm sensations elicit positive feelings, which transfer to a higher willingness to pay for products (Zwebner et al., 2014). People generally like warm foods (Pramudya and Seo, 2018). Both healthfulness and tastiness are positively correlated with food preferences (Motoki et al., 2018a). Given the similarity in valence, people tend to associate warmth with likable taste attributes (tastiness, healthfulness, and greater buying intention). Although valence matching often reveals changes in sweet and bitter perceptions (Velasco et al., 2015; Motoki et al., 2019d), we did not find any associations between temperature and sweetness or bitterness in Experiment 1 or 2. The results did not fit our hypotheses, possibly because of individual differences in the valence of sweetness and bitterness. Although sweetness is liked and bitterness is disliked in general, the degree of valence of sweet and bitter foods might be more varied than likable taste attributes (tastiness, healthfulness, and greater buying intention). For example, there are individual differences in how people attribute sweet tastes to a positive valence, and some may attribute sweetness to a negative valence (e.g., guilty feelings) (Kampov-Polevoy et al., 2006). Weaker valence matching may have attenuated the effects of temperature on sweet and bitter taste correspondence. We did not measure core affect (valence and arousal), which could improve understanding of putative emotional transfer. For instance, it is not clear whether thermal comfort corresponds to valence (Spence, 2020a).
Previous research has shown that warm and cold temperatures are associated with red and blue, respectively (Ho et al., 2014b). However, in our experiments, the colors of the hot/cold pad (green) and beverages (black for black coffee and green for Japanese green tea) were not associated with previously reported color temperatures. Thus, it seems that our findings are not attributable to color-temperature correspondence.
Differential Effects of Physical Warmth on Hedonic/Sensory Perceptions of Two Beverages
The effects of physical warmth on hedonic/sensory ratings were different between Japanese tea and black coffee, although we did not hypothesize a differential influence of physical warmth between the two beverages. The matching of warmth with healthfulness and perception of Japanese tea as healthier than black coffee might have influenced these results. The results of Experiment 1 showed that warmth (vs. coldness) and healthfulness were matched more frequently than any other attribute pair. Thus, warmth may exert more influence on perceived healthfulness than other attributes. The data from Experiment 2 suggested that Japanese tea is perceived to be healthier than black coffee. This result might explain the differential influence of warmth on the perceptions of Japanese tea and black coffee; warmth might increase the perception of healthfulness only when the drink is already regarded as healthy to some extent (e.g., Japanese tea).
Possible Applications of the Findings
Our findings have practical implications for industry. The results for Experiment 2a showed that physical warmth increased perceptions of healthfulness and buying intention. Thus, restaurant staff could recommend Japanese tea to customers wearing warm clothes. This could be especially effective for customers who are interested in a healthy lifestyle. Modifying the ambient temperature of the store to increase physical warmth might also be effective.
Limitations and Future Directions
A major limitation of this study is its small sample size (n = 35 for Experiment 2a, n = 34 for Experiment 2b, within-participants design). We did not conduct a sample size calculation for the experiments because no previous research has investigated the effect of extrinsic temperature on hedonic and sensory ratings. We hypothesized an influence of physical warmth on hedonic/sensory perceptions of the two beverages (Japanese tea and black coffee), but no significant effects were observed in Experiment 2b (black coffee). This might have been because of the small sample sizes in this study. Although we did not find any evidence for the effects of temperature on sensory/hedonic ratings of black coffee, this does not mean that the effects were non-existent. The directions of some of the sensory/hedonic attributes of black coffee were consistent with the hypothesis. For example, the mean freshness rating for black coffee was 3.50 at the cold temperature and 3.06 at the warm temperature. Previous research using relatively small sample sizes and a between-participants design did not find significant differences in sensory transference (Machiels, 2018). To detect possible small effects of physical warmth on sensory/hedonic ratings, further study is needed to replicate the current findings with larger sample sizes.
This study checked for the manipulation of physical warmth using subjective feelings of warmth. Although this procedure has been used previously with extrinsic temperature (Wortman et al., 2014; Zwebner et al., 2014; Motoki et al., 2018b, 2019b; Sinha and Bagchi, 2019), it remains unknown how manipulating warmth affects participants’ actual physical temperature. Further studies should measure changes in participants’ actual physical temperature after wearing a hot/cold pad.
An additional limitation was the possible mismatch between the measured temperature (temperature words) in Experiment 1 and the actual temperature (hot/cold pads) in Experiment 2. Participants in Experiment 1 may have perceived the temperature words to relate to a food item. Although previous research suggests a link between oral and physical experiences (e.g., Biggs et al., 2016), associations between food temperature and hedonic/sensory attributes might differ from those between physical temperature and hedonic/sensory attributes. This could explain the differences between the results of Experiments 1 and 2.
There were also limitations pertaining to the within-participants design. In Experiment 2, participants experienced hot and cold conditions and drank the same beverage. Thus, they may have been aware that temperature was a variable of interest in the study. Further studies should aim to replicate our findings using a between-participants design.
This study manipulated food-extrinsic temperature using physical sensation and a neck pad. However, ambient temperatures can be more easily manipulated by store managers than physical warmth. Ambient temperature influences food preferences (Zwebner et al., 2014; Motoki et al., 2018b). It remains unknown how ambient temperature influences expectations and experiences of food and drink and whether the effects of ambient temperature are similar to those of physical warmth. The interaction between ambient temperature and sample temperature might also have influenced the present results. The drinks were stored at room temperature, where warm (vs. cold) ambient temperatures might differentially influence hot and cold drinks. Warm (vs. cold) ambient temperatures might increase the preference for cold (vs. hot) drinks and accordingly influence ratings of taste attributes associated with pleasantness (e.g., tastiness, healthfulness). Ambient temperature may also have influenced the results of the word association task (Experiment 1). Further studies are needed to determine whether manipulating ambient temperature influences taste-temperature associations, as well as drinking expectations and experiences.
Individual differences in consumption patterns/preferences might also have affected the results. We did not investigate the participants’ tea and coffee consumption patterns or preferences. Some of the participants might habitually drink hot (rather than room temperature) Japanese tea and black coffee. Additionally, personal preference for Japanese tea or black coffee may have influenced the results.
Cultural, demographic and individual factors should also be considered. Consuming (Japanese) green tea and non-hot coffee is considered normal in Japan. Thus, a similar study including participants from other cultures might yield different findings. Additionally, the age range of the participants was different between Experiments 1 and 2. The participants in Experiment 2 were all university students, and were younger than those in Experiment 1. Also, the proportion of male participants was higher in Experiment 2 than Experiment 1. These differences may have contributed to the different results between Experiments 1 and 2. Moreover, we did not collect smell or taste impairment data. Further studies should investigate the generalizability of our findings by manipulating cultural, demographic and individual factors.
Conclusion
This study investigated temperature–taste correspondence. The word warm (vs. cool) was matched more frequently with saltiness and positive attributes (tastiness, healthfulness, and buying intention). By contrast, the word cool (vs. warm) was matched more frequently with sourness and freshness. Further experiments showed that physical warmth (vs. coldness) increased healthfulness and buying intention of Japanese green tea, although no effects of physical warmth on sensory/hedonic perceptions were observed for black coffee. These findings provide evidence of taste–temperature correspondence and provide preliminary support for the influence of food-extrinsic warmth on taste attributes related to positivity.
Data Availability Statement
The raw data supporting the conclusions of this article will be made available by the authors, without undue reservation, to any qualified researcher.
Ethics Statement
The studies involving human participants were reviewed and approved by the Ethics Committee of Tohoku University School of Medicine. The patients/participants provided their written informed consent to participate in this study.
Author Contributions
KM: conceptualization, formal analysis, writing – original draft. KM and TS: data curation. KM and RN: funding acquisition. KM, TS, RN, and MS: investigation, methodology. MS: resources, supervision. TS, RN, and MS: writing – review and editing. All authors contributed to the article and approved the submitted version.
Funding
This study was supported by a Grant-in-Aid for Scientific Research on Innovative Areas (Research in a proposed research area: 17H06046) (RN), and by a Grant-in-Aid for Research Activity start-up (19K23384) (KM).
Conflict of Interest
The authors declare that the research was conducted in the absence of any commercial or financial relationships that could be construed as a potential conflict of interest.
Supplementary Material
The Supplementary Material for this article can be found online at: https://www.frontiersin.org/articles/10.3389/fpsyg.2020.571852/full#supplementary-material
Footnotes
- ^ https://www.lancers.jp/
- ^ https://www.qualtrics.com/jp/
- ^ http://www.itoen.co.jp/products/detail.php?id=51
- ^ https://shop.nestle.jp/front/contents/machine/ics/bottle/
References
Barsalou, L. W. (2010). Grounded cognition: past, present, and future. Top. Cogn. Sci. 2, 716–724. doi: 10.1111/j.1756-8765.2010.01115.x
Bartoshuk, L. M., Rennert, K., Rodin, J., and Stevens, J. C. (1982). Effects of temperature on the perceived sweetness of sucrose. Physiol. Behav. 28, 905–910. doi: 10.1016/0031-9384(82)90212-8
Berry, P. C. (1961). Effect of colored illumination upon perceived temperature. J. Appl. Psychol. 45, 248–250. doi: 10.1037/h0040221
Biggs, L., Juravle, G., and Spence, C. (2016). Haptic exploration of plateware alters the perceived texture and taste of food. Food Qual. Prefer. 50, 129–134. doi: 10.1016/j.foodqual.2016.02.007
Brown, F., and Diller, K. R. (2008). Calculating the optimum temperature for serving hot beverages. Burns 34, 648–654. doi: 10.1016/j.burns.2007.09.012
Cardello, A. V., and Maller, O. (1982). Acceptability of Water, Selected Beverages and Foods as a Function of Serving Temperature. J. Food Sci. 47, 1549–1552. doi: 10.1111/j.1365-2621.1982.tb04980.x
Crisinel, A.-S., and Spence, C. (2011). Crossmodal associations between flavoured milk solutions and musical notes. Acta Psychol. 138, 155–161. doi: 10.1016/j.actpsy.2011.05.018
Cruz, A., and Green, B. G. (2000). Thermal stimulation of taste. Nature 403, 889–892. doi: 10.1038/35002581
Engelen, L., de Wijk, R. A., Prinz, J. F., Janssen, A. M., Weenen, H., and Bosman, F. (2003). The effect of oral and product temperature on the perception of flavor and texture attributes of semi-solids. Appetite 41, 273–281. doi: 10.1016/s0195-6663(03)00105-3
Green, B. G., and Frankmann, S. P. (1987). The effect of cooling the tongue on the perceived intensity of taste. Chem. Senses 12, 609–619. doi: 10.1093/chemse/12.4.609
Green, B. G., and Frankmann, S. P. (1988). The effect of cooling on the perception of carbohydrate and intensive sweeteners. Physiol. Behav. 43, 515–519. doi: 10.1016/0031-9384(88)90127-8
Hardin, C. L. (2000). Red and yellow, green and blue, warm and cool: explaining colour appearance. J. Consc. Stud. 7, 113–122.
Ho, H.-N., Iwai, D., Yoshikawa, Y., Watanabe, J., and Nishida, S’y (2014a). Combining colour and temperature: A blue object is more likely to be judged as warm than a red object. Sci. Rep. 4:5527.
Ho, H.-N., Van Doorn, G. H., Kawabe, T., Watanabe, J., and Spence, C. (2014b). Colour-temperature correspondences: when reactions to thermal stimuli are influenced by colour. PLoS One 9:e91854. doi: 10.1371/journal.pone.0091854
Kampfer, K., Leischnig, A., Ivens, B. S., and Spence, C. (2017). Touch-flavor transference: Assessing the effect of packaging weight on gustatory evaluations, desire for food and beverages, and willingness to pay. PLoS One 12:e0186121. doi: 10.1371/journal.pone.0186121
Kampov-Polevoy, A. B., Alterman, A., Khalitov, E., and Garbutt, J. C. (2006). Sweet preference predicts mood altering effect of and impaired control over eating sweet foods. Eat. Behav. 7, 181–187. doi: 10.1016/j.eatbeh.2005.09.005
Kantono, K., Hamid, N., Shepherd, D., Lin, Y. H. T., Skiredj, S., and Carr, B. T. (2019). Emotional and electrophysiological measures correlate to flavour perception in the presence of music. Physiol. Behav. 199, 154–164. doi: 10.1016/j.physbeh.2018.11.012
Kantono, K., Hamid, N., Shepherd, D., Yoo, M. J. Y., Grazioli, G., and Carr, B. T. (2016). Listening to music can influence hedonic and sensory perceptions of gelati. Appetite 100, 244–255. doi: 10.1016/j.appet.2016.02.143
Karjalainen, S. (2007). Gender differences in thermal comfort and use of thermostats in everyday thermal environments. Build. Environ. 42, 1594–1603. doi: 10.1016/j.buildenv.2006.01.009
Kim, J.-W., Samant, S. S., Seo, Y., and Seo, H.-S. (2015). Variation in saltiness perception of soup with respect to soup serving temperature and consumer dietary habits. Appetite 84, 73–78. doi: 10.1016/j.appet.2014.09.018
Krishna, A., and Morrin, M. (2008). Does Touch Affect Taste? The Perceptual Transfer of Product Container Haptic Cues. J. Consum. Res. 34, 807–818. doi: 10.1086/523286
Lee, H. S., and O’Mahony, M. (2002). At What Temperatures Do Consumers Like to Drink Coffee?: Mixing Methods. J. Food Sci. 67, 2774–2777. doi: 10.1111/j.1365-2621.2002.tb08814.x
Lorentz, E., Ekstrand, C., Gould, L., and Borowsky, R. (2016). Red-hot: How colour and semantic temperature processing interact in a Stroop-like paradigm. Vis. cogn. 24, 173–181. doi: 10.1080/13506285.2016.1183742
Machiels, C. J. A. (2018). Bittersweet Findings: Round Cups Fail to Induce Sweeter Taste. Beverages 4:12. doi: 10.3390/beverages4010012
McBurney, D. H., Collings, V. B., and Glanz, L. M. (1973). Temperature dependence of human taste responses. Physiol. Behav. 11, 89–94. doi: 10.1016/0031-9384(73)9012790123
Michael, G. A., and Rolhion, P. (2008). Cool colors: color-induced nasal thermal sensations. Neurosci. Lett. 436, 141–144. doi: 10.1016/j.neulet.2008.03.007
Mobini, S., Platts, R. G., and Booth, D. A. (2011). Haptic signals of texture while eating a food. Multisensory cognition as interacting discriminations from norm. Appetite 56, 386–393. doi: 10.1016/j.appet.2010.12.024
Mony, P., Tokar, T., Pang, P., Fiegel, A., Meullenet, J.-F., and Seo, H.-S. (2013). Temperature of served water can modulate sensory perception and acceptance of food. Food Qual. Prefer. 28, 449–455. doi: 10.1016/j.foodqual.2012.12.002
Moskowitz, H. R. (1973). Effect of solution temperature on taste intensity in humans. Physiol. Behav. 10, 289–292. doi: 10.1016/0031-9384(73)90312-0
Motoki, K., Saito, T., Nouchi, R., Kawashima, R., and Sugiura, M. (2018a). Tastiness but not healthfulness captures automatic visual attention: Preliminary evidence from an eye-tracking study. Food Qual. Prefer. 64, 148–153. doi: 10.1016/j.foodqual.2017.09.014
Motoki, K., Saito, T., Nouchi, R., Kawashima, R., and Sugiura, M. (2018b). The paradox of warmth: Ambient warm temperature decreases preference for savory foods. Food Qual. Prefer. 69, 1–9. doi: 10.1016/j.foodqual.2018.04.006
Motoki, K., Saito, T., Nouchi, R., Kawashima, R., and Sugiura, M. (2019a). A Sweet Voice: The Influence of Cross-Modal Correspondences Between Taste and Vocal Pitch on Advertising Effectiveness. Multisens Res. 32, 401–427. doi: 10.1163/22134808-20191365
Motoki, K., Saito, T., Nouchi, R., Kawashima, R., and Sugiura, M. (2019b). Light colors and comfortable warmth: Crossmodal correspondences between thermal sensations and color lightness influence consumer behavior. Food Qual. Prefer. 72, 45–55. doi: 10.1016/j.foodqual.2018.09.004
Motoki, K., Saito, T., Nouchi, R., Kawashima, R., and Sugiura, M. (2019c). Round Faces Are Associated with Sweet Foods: The Role of Crossmodal Correspondence in Social Perception. Foods 8:103. doi: 10.3390/foods8030103
Motoki, K., Saito, T., Park, J., Velasco, C., Spence, C., and Sugiura, M. (2019d). Tasting names: Systematic investigations of taste-speech sounds associations. Food Qual. Prefer. 80:103801. doi: 10.1016/j.foodqual.2019.103801
Piqueras-Fiszman, B., and Spence, C. (2012). The influence of the feel of product packaging on the perception of the oral-somatosensory texture of food. Food Qual. Prefer. 26, 67–73. doi: 10.1016/j.foodqual.2012.04.002
Pramudya, R. C., and Seo, H.-S. (2017). Influences of Product Temperature on Emotional Responses to, and Sensory Attributes of, Coffee and Green Tea Beverages. Front. Psychol. 8:2264.
Pramudya, R. C., and Seo, H.-S. (2018). Using Check-All-That-Apply (CATA) method for determining product temperature-dependent sensory-attribute variations: A case study of cooked rice. Food Res. Int. 105, 724–732. doi: 10.1016/j.foodres.2017.11.075
Roque, J., Lafraire, J., Spence, C., and Auvray, M. (2018). The influence of audiovisual stimuli cuing temperature, carbonation, and color on the categorization of freshness in beverages. J. Sens. Stud. 33:e12469. doi: 10.1111/joss.12469
Saluja, S., and Stevenson, R. J. (2018). Cross-Modal Associations Between Real Tastes and Colors. Chem. Senses 43, 475–480. doi: 10.1093/chemse/bjy033
Schiffman, S. S., Sattely-Miller, E. A., Graham, B. G., Bennett, J. L., Booth, B. J., Desai, N., et al. (2000). Effect of temperature, pH, and ions on sweet taste. Physiol. Behav. 68, 469–481. doi: 10.1016/s0031-9384(99)00205-x
Sinha, J., and Bagchi, R. (2019). Role of Ambient Temperature in Influencing Willingness to Pay in Auctions and Negotiations. J. Mark. 83, 121–138. doi: 10.1177/0022242919841595
Slocombe, B. G., Carmichael, D. A., and Simner, J. (2016). Cross-modal tactile-taste interactions in food evaluations. Neuropsychologia 88, 58–64. doi: 10.1016/j.neuropsychologia.2015.07.011
Spence, C. (2011). Crossmodal correspondences: a tutorial review. Atten. Percept. Psychophys. 73, 971–995. doi: 10.3758/s13414-010-0073-7
Spence, C. (2020a). Assessing the Role of Emotional Mediation in Explaining Crossmodal Correspondences Involving Musical Stimuli. Multisens. Res. 33, 1–29. doi: 10.1163/22134808-20191469
Spence, C. (2020b). Temperature-based crossmodal correspondences: causes and consequences. Multisens. Res. 33, 645–682. doi: 10.1163/22134808-20191494
Spence, C., Wan, X., Woods, A., Velasco, C., Deng, J., Youssef, J., et al. (2015). On tasty colours and colourful tastes? Assessing, explaining, and utilizing crossmodal correspondences between colours and basic tastes. Flavour 4:23.
Stokes, C. N., O’sullivan, M. G., and Kerry, J. P. (2016). Assessment of black coffee temperature profiles consumed from paper-based cups and effect on affective and descriptive product sensory attributes. Int. J. Food Sci. Technol. 51, 2041–2048. doi: 10.1111/ijfs.13176
Tu, Y., Yang, Z., and Ma, C. (2015). Touching tastes: The haptic perception transfer of liquid food packaging materials. Food Qual. Prefer. 39, 124–130. doi: 10.1016/j.foodqual.2014.07.001
Velasco, C., Beh, E. J., Le, T., and Marmolejo-Ramos, F. (2018a). The shapes associated with the concept of “sweet and sour” foods. Food Qual. Prefer. 68, 250–257. doi: 10.1016/j.foodqual.2018.03.012
Velasco, C., Hyndman, S., and Spence, C. (2018b). The role of typeface curvilinearity on taste expectations and perception. Int. J. Gastr. Food Sci. 11, 63–74. doi: 10.1016/j.ijgfs.2017.11.007
Velasco, C., Jones, R., King, S., and Spence, C. (2013). The Sound of Temperature: What Information do Pouring Sounds Convey Concerning the Temperature of a Beverage. J. Sens. Stud. 28, 335–345. doi: 10.1111/joss.12052
Velasco, C., Woods, A. T., Deroy, O., and Spence, C. (2015). Hedonic mediation of the crossmodal correspondence between taste and shape. Food Qual. Prefer. 41, 151–158. doi: 10.1016/j.foodqual.2014.11.010
Velasco, C., Woods, A. T., Petit, O., Cheok, A. D., and Spence, C. (2016). Crossmodal correspondences between taste and shape, and their implications for product packaging: A review. Food Qual. Prefer. 52, 17–26.
Wang, Q. J., and Spence, C. (2017). The Role of Pitch and Tempo in Sound-Temperature Crossmodal Correspondences. Multisens. Res. 30, 307–320.
Wang, Q. J., and Spence, C. (2018). A smooth wine? Haptic influences on wine evaluation. Int. J. Gastr. Food Sci. 14, 9–13.
Wang, Q. J., Wang, S., and Spence, C. (2016). “Turn Up the Taste”: Assessing the Role of Taste Intensity and Emotion in Mediating Crossmodal Correspondences between Basic Tastes and Pitch. Chem. Senses 41, 345–356.
Whitelaw, G. H. (2014). Coffee Life in Japan. Soc. Sci. Japan J. 17, 270–273. doi: 10.1093/ssjj/jyu016
Wnuk, E., de Valk, J. M., Huisman, J. L. A., and Majid, A. (2017). Hot and Cold Smells: Odor-Temperature Associations across Cultures. Front. Psychol. 8:1373.
Wortman, J., Donnellan, M. B., and Lucas, R. E. (2014). Can physical warmth (or coldness) predict trait loneliness? A replication of Bargh and Shalev (2012). Arch. Sci. Psychol. 2:13.
Wright, B. (1962). The influence of hue, lightness, and saturation on apparent warmth and weight. Am. J. Psychol. 75, 232–241.
Xu, Y., Hamid, N., Shepherd, D., Kantono, K., Reay, S., Martinez, G., et al. (2019). Background soundscapes influence the perception of ice-cream as indexed by electrophysiological measures. Food Res. Int. 125:108564.
Keywords: temperature, physical warmth, cross-modal correspondence, multisensory experiences, beverages
Citation: Motoki K, Saito T, Nouchi R and Sugiura M (2020) Cross-Modal Correspondences Between Temperature and Taste Attributes. Front. Psychol. 11:571852. doi: 10.3389/fpsyg.2020.571852
Received: 12 June 2020; Accepted: 18 August 2020;
Published: 25 September 2020.
Edited by:
Davide Giacalone, University of Southern Denmark, DenmarkReviewed by:
Qian Janice Wang, Aarhus University, DenmarkBruno Mesz, National University of Quilmes, Argentina
Copyright © 2020 Motoki, Saito, Nouchi and Sugiura. This is an open-access article distributed under the terms of the Creative Commons Attribution License (CC BY). The use, distribution or reproduction in other forums is permitted, provided the original author(s) and the copyright owner(s) are credited and that the original publication in this journal is cited, in accordance with accepted academic practice. No use, distribution or reproduction is permitted which does not comply with these terms.
*Correspondence: Kosuke Motoki, bW90b2tpa0BteXUuYWMuanA=