 Ileana Schmalbach1,2*
 Bjarne Schmalbach1
 Markus Zenger3,4Katja Petrowski1,5*
 Manfred Beutel6
 Anja Hilbert4*†
 Elmar Brähler4,6†
- 1Department of Medical Psychology and Medical Sociology, University Medical Center of the Johannes Gutenberg University Mainz, Mainz, Germany
- 2Technische Universität Dresden, Carl Gustav Carus Faculty of Medicine, Division of Psychological and Social Medicine and Developmental Neurosciences, Research Group Applied Medical Psychology and Medical Sociology, Dresden, Germany
- 3Applied Human Studies, University of Applied Sciences Magdeburg-Stendal, Stendal, Germany
- 4Integrated Research and Treatment Center Adiposity Diseases, Behavioral Medicine Research Unit, Department of Psychosomatic Medicine and Psychotherapy, University of Leipzig Medical Center, Leipzig, Germany
- 5Universitätsklinikum Carl Gustav Carus an der Technischen Universität Dresden, Abteilung für Innere Medizin III, Dresden, Germany
- 6Department for Psychosomatic Medicine and Psychotherapy, University Medical Center of Johannes Gutenberg University of Mainz, Mainz, Germany
Background: The Self-Regulation of Eating Behavior Questionnaire (SREBQ) is an economical way of assessing an individual's self-regulatory abilities regarding eating behavior. Such scales are needed in the German population; therefore, the purpose of the present study was the translation and validation of a German version of the SREBQ.
Method: First, we conducted a pilot study (Study 1; N = 371) after the translation procedure. Second, we assessed the final scale in a representative sample of the German population (Sample 2; N = 2,483) and its underlying factor structure. Further, we tested for measurement invariance and evaluated the SREBQ's associations with related scales to explore convergent and discriminant validity. Finally, we considered differences in SREBQ based on sociodemographic variables and provided derived reference scores (norm values).
Results: Factor analysis revealed deficiencies in the original model. Thus, we shortened the scale based on statistical considerations and the adapted version showed improved fit in Confirmatory Factor Analysis and reliability. We also found evidence for partial strict invariance, which means the measure is equivalent for the tested groups of age and gender. Item and scale psychometric properties of the shortened version were satisfactory. In terms of diagnostic validity, it was shown that individuals with higher body mass index (kg/m2) have worse self-regulation of eating behavior than those with lower.
Conclusion: In sum, the SREBQ evidenced good validity and reliability and is suitable for application in medical, psychological, and nutritional research.
Introduction
Obesity [body mass index (BMI) ≥30 kg/m2; Deutsche Adipositas Gesellschaft/German Obesity Society, 2014] is a serious health concern, that not only affects patient's health at an individual level (e.g., cardiovascular and metabolic diseases; Lewis et al., 2009; Swinburn et al., 2011), but it also has consequence at a societal dimension (e.g., unemployment; economic burden for health care; Lehnert et al., 2015; Effertz et al., 2016; De Lorenzo et al., 2019). Psychologically, it is associated with depression and eating disorders [e.g., binge-eating disorder (BED); Hilbert, 2021]. In Germany, the proportion of citizens with obesity has been growing since the past three decades peaking at about 24% of the population (Mensink et al., 2013). Effertz et al. (2016) reported that obesity caused by unhealthy eating habits is, after smoking, the second riskiest “lifestyle factor” resulting in poor quality of life (Deutsche Adipositas Gesellschaft/German Obesity Society, 2014; Effertz et al., 2016). Specifically, self-regulation of eating behavior has been directly related to positive physical and mental health outcomes, as well as to overall life satisfaction (Torres and Nowson, 2007; Grant et al., 2009; Gupta and Verma, 2019; Sharbafshaaer, 2019). On the other hand, low self-regulation is associated with high BMI and obesity (Balani et al., 2019; Ruzanska and Warschburger, 2019).
Individuals can positively affect their own health by enhancing self-regulated eating (Reed et al., 2016), however, this can be challenging. Therefore, the ability to effectively regulate one's eating behavior is an important goal for many health-related interventions (Gardner et al., 2012; Llewellyn and Wardle, 2015). Consequently, standardized scales for the evaluation of such interventions are key. For this purpose, Kliemann et al. (2016) developed the Self-Regulation of Eating Behavior Questionnaire (SREBQ), which assess the extent to which individuals are able to effectively self-regulate their eating behavior and measure change in response to self-regulation interventions. The aim of the present study is to develop a German version of the SREBQ and assess its psychometric properties.
Self-Regulation of Eating Behavior
In general, behavioral self-regulation is defined as intentional control of attention, thoughts, emotions, behaviors, and environment (Carver and Scheier, 2012, 2017; Baumeister et al., 2018; Usher and Schunk, 2018) that can be improved with practice (Hofmann et al., 2012). From this perspective, individuals engage in situation selection, modification, attentional deployment, cognitive change, and response modulation of various kinds (Gross, 2014). For example, someone who is trying to lose weight might choose to refrain from situations involving enticing, calorically dense foods. Hence, by simply avoiding situations that could be detrimental to their goal (i.e., losing weight), they enhance the probability for a successful goal achievement. Other strategies related to eating behavior include self-monitoring, planning, and impulse control—among others (Kreausukon et al., 2012; Hankonen et al., 2013; Dombrowski et al., 2014). Accordingly, it has been suggested that the ability to choose and competently apply strategies of self-regulation may explain the gap between intention and behavior (Allan et al., 2011; Gellert et al., 2011). For instance, individuals lacking self-regulation in the sense of reduced impulse control, could be at higher risk of weight gain (Campos-Uscanga et al., 2017; Johnson and Annesi, 2018). In patients with obesity, studies revealed deficits in broad executive functions, which are strongly correlated with successful self-regulation (Dohle et al., 2018; Yang et al., 2018). From this perspective, affected patients may find it challenging to ingest appropriate amounts of food (according to their caloric needs), exhibiting abnormal eating habits. Similarly, in individuals with binge-eating disorder (BED) tend to overeat, while those with anorexia nervosa (AN) are prone to extremely reduce their food intake (Hagger et al., 2009; Leehr et al., 2015; Dingemans et al., 2017; Kenny et al., 2017, 2019). In this light, the ability to effectively regulate one's eating behavior is a major goal not only for patients with an ED, but also for individuals in dietary and weight-loss interventions (e.g., obesity).
Indeed, there are scales assessing self-regulation, however, regulatory aspects of eating behavior are not considered (Carey et al., 2004; Tangney et al., 2004; Schroder et al., 2013), relate to children and adolescents (Moilanen, 2007; De Vet et al., 2014; Monnery-Patris et al., 2019), are gender-specific (Pelletier et al., 2004) or lack invariance across genders (Hamilton et al., 2018). Therefore, there is a need of valid measures that measure self-regulation of eating behavior for a broader population. Hence, the main goal of the SREBQ is to evaluate the self-regulatory skills in terms of regulating eating behavior, considering the capabilities that are necessary to healthfully regulate eating (Kliemann et al., 2016).
Purpose of the Study
The purpose of the present study was to translate the SREBQ and validate it in a German population sample. To this end, we analyzed item and scale psychometric properties, and conducted factor analysis and tests of measurement invariance. Furthermore, - to explore convergent and discriminant validity—we computed correlations between the SREBQ and several established measures. We expected better self-regulation of eating behavior to be associated with lower eating disorder psychopathology, lower overall psychological distress, lower symptoms of depression and anxiety, higher satisfaction with life, better subjective health status, and a better nutritional and weight management lifestyle. In terms of diagnostic validity, we hypothesized that individuals with a higher BMI (kg/m2) would exhibit lower levels of self-regulation (Cameron and Leventhal, 2003; Hagger et al., 2009; Berking and Wupperman, 2012; De Castella et al., 2013; Leventhal et al., 2016; Campos-Uscanga et al., 2017; Johnson and Annesi, 2018; Annesi, 2019).
Method
The translation process (English items into German) was based on the WHO protocol of translation and adaption of instruments (e.g., forward and back translation, pre-testing and final version; World Health Organization, 2010). In order to improve the quality of the analyses, two samples were collected. In Sample 1, the quality of the psychometric properties of the newly translated scale were piloted (Study 1). In a validation study (Study 2) the final scale was tested in a larger and representative sample (Sample 2). See Rresults section.
Participants and Procedure
In general, mentally and physically healthy participants of a minimum age of 14 years were included. Participants without knowledge of the German language were excluded.
Sample 1
We recruited a sample of n = 462 participants using the online survey tool SoSciSurvey (Leiner, 2014). After giving their informed consent, the participants submitted their sociodemographic information and answered several questionnaires about their mental and physical health. The average study duration was 754 seconds (s) (SD = 481 s). The ethics committee of the University of Applied Sciences Magdeburg-Stendal approved of the procedure (AZ-4973-75). We conducted the study in accordance with the common ethical guidelines of the Declaration of Helsinki. Ninety (19.5%) participants dropped out from the survey before or after giving their sociodemographic information, leaving n = 371 participants, who answered the SREBQ. Participants were on average M = 27.02 years old (SD = 8.51; Min = 16; Max = 66). Further sample characteristics are reported in Table 1. The German items are displayed in Table 2.
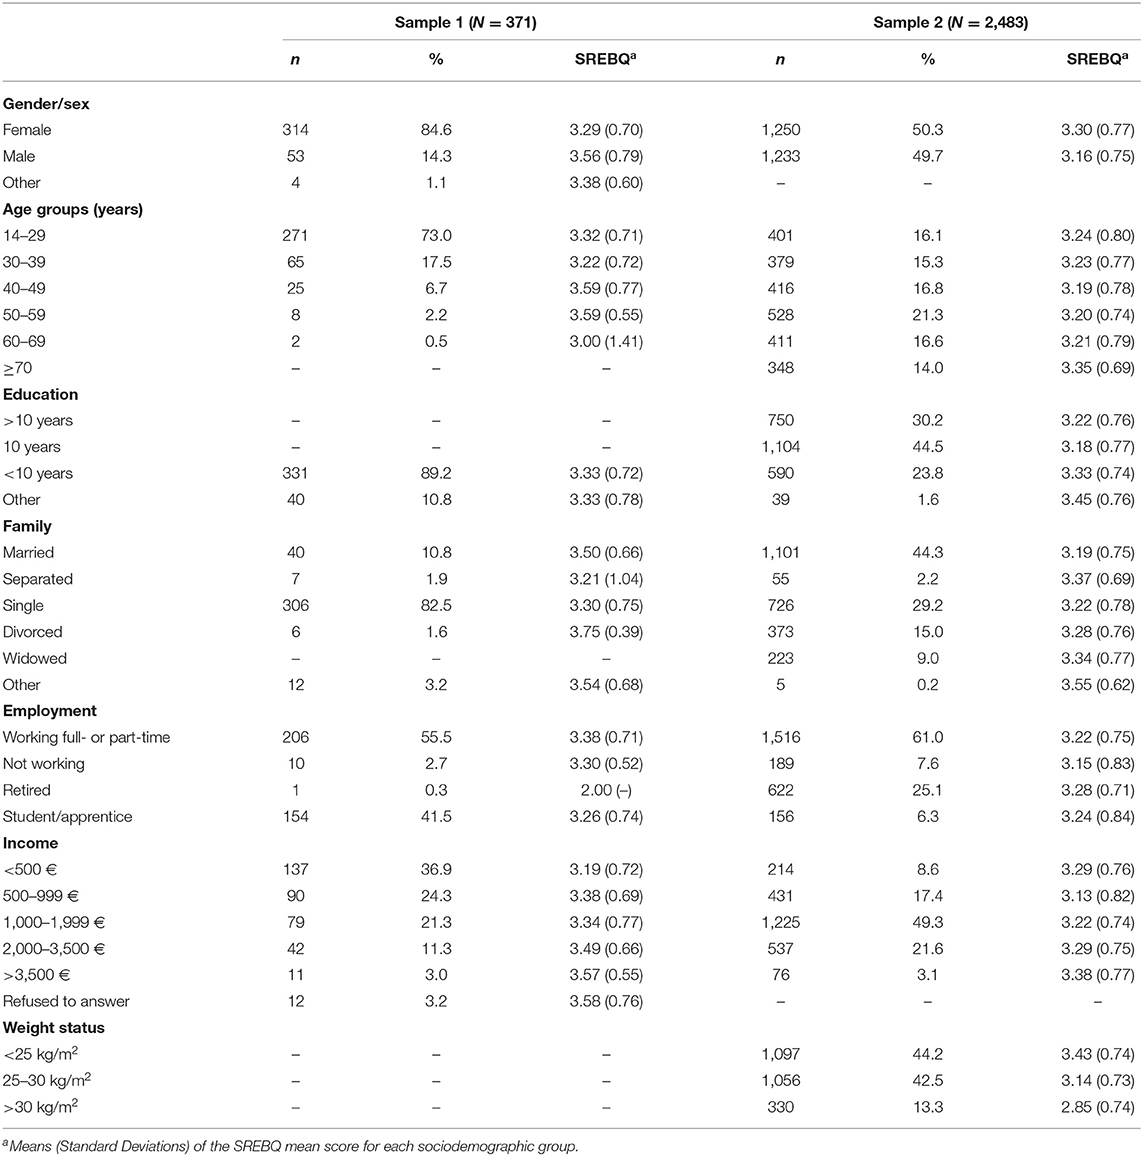
Table 1. Sociodemographic characteristics of both samples.
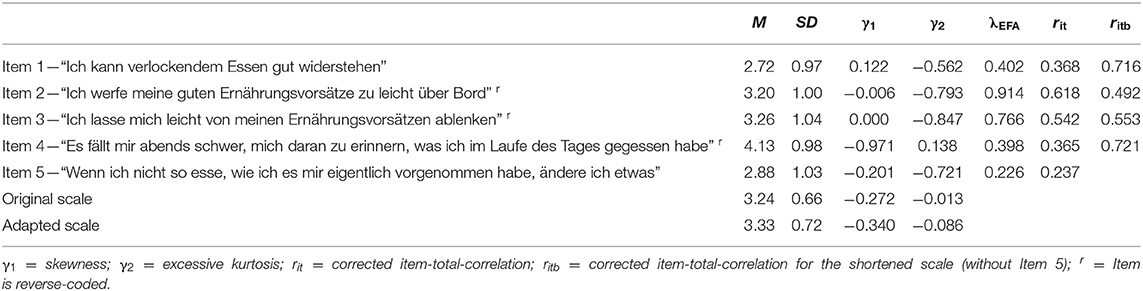
Table 2. SREBQ item and scale characteristics (Sample 1).
Sample 2
This sample was recruited by the demographic consulting company USUMA, Berlin, by using a multistage sampling approach, aiming for a sample that is representative of the German general population in terms of participant age and sex. First, households were selected using a random-route procedure. Within each household, the interviewee was selected based on the Kish selection grid. A trained professional then conducted the interviews with the consenting participants. Custodian consent from parents or legal guardians was granted for underaged participants (oral consent in accordance with the German law). The ethics committee of the University of Leipzig approved the procedure (002/20—ek). The resulting sample consisted of n = 2,503 individuals. After excluding respondents with missing values, we retained a sample of n = 2,483. Participants were on average M = 49.52 years old (SD = 17.47; Min = 14; Max = 95) and we found a close to even sex distribution (see Table 1). In this regard, Sample 2 was representative for the German population regarding age and sex (Federal Statistical Office of Germany, 2019). The average BMI (kg/m2) was M = 26.12 (SD = 4.74; Min = 15.94; Max = 66.57).
Instruments
Self-Regulation of Eating Behavior Questionnaire (SREBQ; Kliemann et al., 2016). This scale assesses an individual's self-regulatory capacity in terms of eating behavior, using five items (e.g., “I'm good at resisting tempting food”). Participants answered these items on a 5-point scale from “0 = never” to “4 = always”. The scale score is obtained by calculating the sum score of the items. The psychometric properties of the SREBQ are satisfactory (Cronbach's α = 0.75; Kliemann et al., 2016). The reliability in the present study was ω = 0.919.
Eating Disorder Examination-Questionnaire 8 (EDE-Q8; Kliem et al., 2016). The EDE-Q8 measures eating disorder psychopathology using eight items on a 7-point scale (“0” – “6”), and higher mean scores reflect greater severity or frequency. The authors reported adequate internal consistency (α = 0.93). In the present study, the reliability was ω = 0.872.
The Symptom Checklist-K-9 (Klaghofer and Brähler, 2001; Prinz et al., 2013; SCL-9-K) captures general psychological distress using nine items on a 5-point scale “1 = not at all” to “4 = extremely.” Higher mean scores demonstrate increased symptom severity. Its psychometric properties including internal consistency are satisfactory (α = 0.84; Prinz et al., 2013). The reliability in the present study was ω = 0.768.
Patient Health Questionnaire (Kroenke et al., 2009; Löwe et al., 2010; PHQ-4). This tool screens for symptoms of depression and anxiety using two items each on a 4-point scale (“1 = not at all” to “4 = nearly every day”). Higher sum scores demonstrate increased symptom of depression. The psychometric properties of the PHQ-4 and Cronbach's Alpha are satisfactory (α = 0.81–82; Löwe et al., 2010). In the present study, the reliability was ω = 0.821.
The Satisfaction-with-Life Scale (SWLS; Glaesmer et al., 2011) uses five items on a 7-point scale (“1 = strongly agree” to “7 = strongly disagree”) to measure overall life satisfaction. We inverted the score, so that higher sum scores indicate higher life satisfaction. Glaesmer and colleagues reported adequate psychometric properties and internal consistency (α = 0.92). The reliability in the present study was ω = 0.892.
Health Visual Analog Scale (Health VAS; Brooks et al., 2003). Participants indicate their subjective health status on the Health VAS, ranging from 0 “worst imaginable health status” to 100 “best imaginable health status.”
Six Factor Weight Management Questionnaire (6FQ; Kushner et al., 2016). This scale consists of 27-items that identify six unhealthy affective, cognitive, and behavioral lifestyle factors related to nutrition and weight management (Convenient Diner, Fast Pacer, Easily Enticed Eater, Exercise Struggler, Self-Critic, All-or-Nothing Doer). Participants answer on a 4-point scale (“1 = don't agree at all” to “4 = strongly agree”). Higher sum scores indicate association with the weight management style. We translated the questionnaire using the same method as we did for the SREBQ. The psychometric properties are satisfactory. The reliability in the present study was between ω =0.731 and.861 for the six subscales.
Statistical Analyses
We conducted the statistical analysis using R and the packages EFAutilities, ezCutoffs, lavaan, paran, and semTools (Rosseel, 2012; SemTools Contributors, 2016; Dinno, 2018; Schmalbach et al., 2019; Zhang et al., 2020). Our hypotheses and data-analytical plan were specified prior data collection. For the exploratory factor analysis (EFA), we first ran parallel analysis (PA; Horn, 1965) to establish the number of components in the data by comparing the empirical eigenvalues to those of randomly generated data sets with the same general properties. Then, we utilized EFA to check the loadings of the indicators. For the CFA (Confirmatory Factor Analysis), we used the robust maximum likelihood estimation method with Yuan-Bentler's scaled χ2 (Yuan and Bentler, 2000). To evaluate goodness-of-fit, we utilized popular fit indices with commonly recommended cut-off criteria for good fit (Hu and Bentler, 1998, 1999; Schermelleh-Engel et al., 2003): The χ2-test which should ideally not be significant; the Comparative Fit Index (CFI) and the Tucker-Lewis Index (TLI), which should both be larger than 0.95, the Root Mean Square Error of Approximation (RMSEA) and its 90% confidence interval and the Standardized Root Means Square Residual (SRMR) which should both be smaller than 0.08. To supplement these model evaluations, we employed the simulation-based approach introduced by Schmalbach et al. (2019): By simulating and fitting data sets based on the parameter tables of the empirical model at hand and then finding the 95th percentile of the resulting fit indices, one can obtain empirically justified fit index cutoffs. Now, if the empirical fit index is within the bounds set out by the simulated cutoff, this is strong evidence for good model fit.
Furthermore, we tested measurement invariance across age, gender, and BMI (kg/m2) status using the procedure described by Milfont and Fischer (2010): We compared increasingly constrained models in a stepwise fashion to establish increasingly strict levels of invariance. First, we tested metric (or weak) invariance by comparing the unconstrained model with a model that constrains factor loadings to be equal across groups. Second, we tested scalar (or strong) invariance by comparing the metric model to one that additionally constrains item intercepts to be equal. Finally, we tested strict invariance by comparing the scalar model to a model that also constrains residuals to be equal across tested groups. As recommended by Cheung and Rensvold (2002), we evaluated model comparisons using the χ2-test as well as differences in CFI and gamma hat (GH; Steiger, 1989). χ2 should ideally not be significant, and ΔCFI and ΔGH should not be larger than 0.01 between models. As per recommendations from Trizano-Hermosilla and Alvarado (2016), we reported McDonald's ω (McDonald, 1999) as a measure of internal consistency. To compare the SREBQ by sociodemographic groups, we computed ANOVAs.
Results
Item and Scale Characteristics
We ran this descriptive analysis in Sample 1. The Shapiro-Wilk test for normal distribution was highly significant, p < 0.001, for all items and the scale. However, considering our sample size, this was not surprising (Yap and Sim, 2011; Kim, 2013). For larger samples (n > 300), Kim recommends the analysis of skewness and kurtosis by comparing empirical values to the cutoff values of two for skewness and four for excess kurtosis. Thus, the data can be considered normally distributed. Reliability for the 5-Item scale was ω = 0.652. We reported further descriptive statistics in Table 2.
Factor Structure
In the initial PA, the empirical eigenvalues for the first three components were 2.02, 0.89, and 0.80, whereas the randomly generated ones were 1.21, 1.11, and 1.03. Thus, it was confirmed that only a singular component should be extracted from the five-item matrix. We reported the factor loadings of the subsequent EFA in Table 2. Upon inspection of the various item descriptive statistics, it became evident that Item 5 is not a very good measure of the underlying construct. Its factor loading in EFA and its corrected item-total correlation are below 0.30.
Next, we conducted CFA (see Table 3). In Sample 1, the model proposed by Kliemann et al. (2016) had moderate to unacceptable fit, which led us to seek for a better fitting model. We found high modification indices for Item 5, indicating non-factor specific correlations with other indicators. This combined with the low CFA factor loading (λ = 0.165), low EFA loading, and the low-item-total correlation result in a marked improvement when Item 5 was excluded from the scale. ω for the 4-Item scale is 0.735. The remaining CFA factor loadings were then between 0.365 and 0.955.
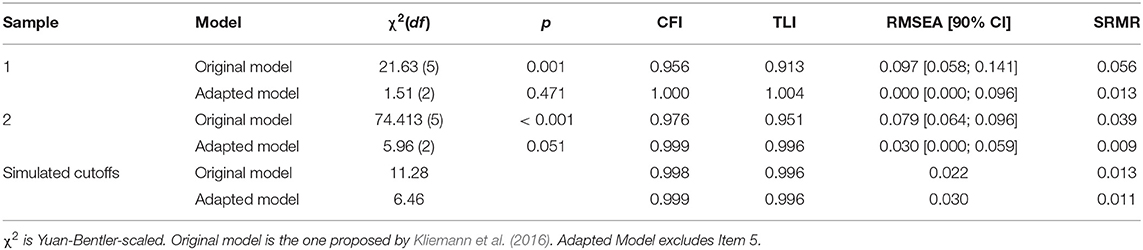
Table 3. Confirmatory factor analysis results of the Self-Regulation of Eating Behavior Questionnaire (Samples 1 and 2).
This initial analysis was replicated in Sample 2. Here we found good model fit for both, the 5- item and the 4-item version of the SREBQ. Internal consistency was acceptable for both as well (ω5 = 0.700; ω4 = 0.766). It should be noted that Item 5 again displayed a very low factor loading, λ = 0.065. Thus, it cannot be recommended for the assessment of self-regulation of eating behavior within the German SREBQ. Consequently, we excluded item 5 from the model. The other loadings fell between 0.334 and 0.882. We supplemented these analyses by comparing the empirical model fit indices to simulated cutoff values generated in the R package ezCutoffs (Schmalbach et al., 2019). As is evident from Table 3, the adapted model is within the acceptable bounds laid out by the 95th percentile of the simulated fit index distribution, but the original model is not.
Next, we only tested for measurement invariance in Sample 2. We found evidence for strict measurement invariance across participant sex as well as age and BMI (Kg/m2) groups, as evidenced by small differences in CFI and GH (see Table 4). The χ2-test was significant in four of the nine comparisons, however it is well-known to be overly sensitive in larger sample sizes (Bentler and Bonett, 1980). The difference in CFI and GH did not exceed 0.01 for any of the comparisons. Only the test of strict invariance in the case of the weight status groups was not fully conclusive with significant Δχ2 and ΔCFI but an insignificant ΔGH. For this variable, only scalar invariance should be assumed. In sum, the measurement models were fully equivalent across age and sex, and largely equivalent for weight status.
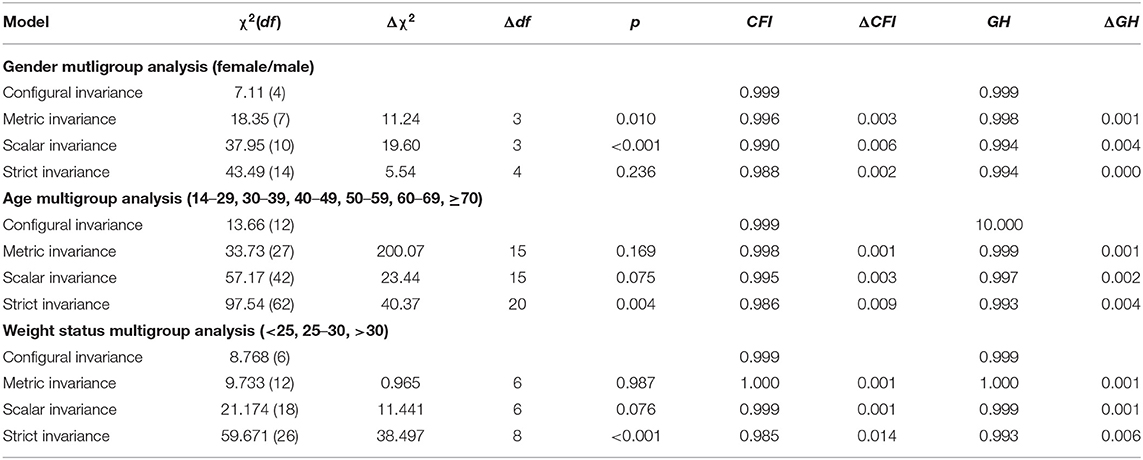
Table 4. Analysis of measurement invariance (Sample 2).
Convergent and Divergent Validity
We calculated correlations between the SREBQ and the other instruments for which we collected data in Sample 1. All associations were significant (p < 0.05), most highly so (p < 0.001; see Table 5). The SREBQ exhibited moderate negative correlations with the EDE-Q8, the SCL-9-K, and both subscales of the PHQ-4. It correlated weakly and positively with SWLS and the Health VAS. Finally, we found moderate to high negative associations with the subscales of the 6FQ. In addition, we calculated a correlation between BMI (kg/m2) and SREBQ in Sample 2. Here we found a moderately sized, negative correlation, r = −0.274, p < 0.001, indicating that individuals with higher BMIs have worse self-regulation of eating behavior.
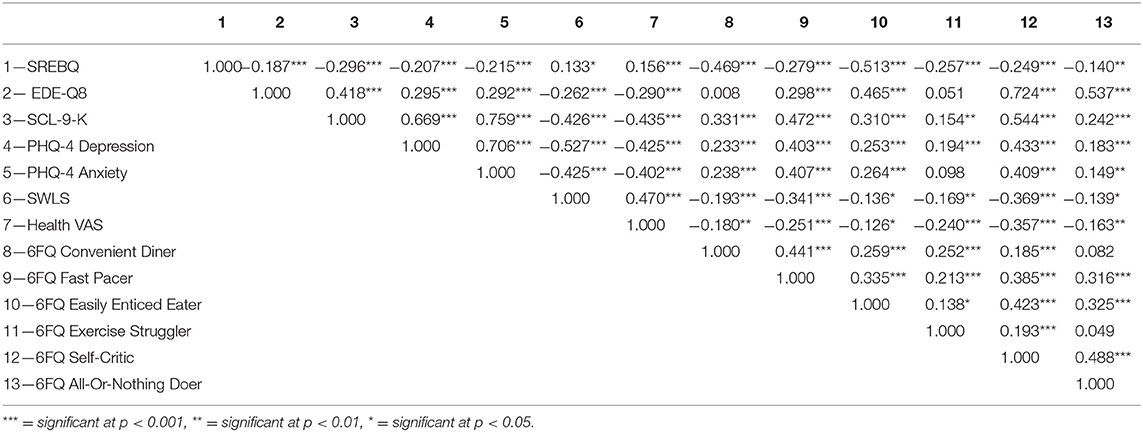
Table 5. Correlations between the Self-Regulation of Eating Behavior Questionnaire and theoretically related scales (Sample 1).
Diagnostic Validity and Sociodemographic Variables
We compared sociodemographic groups by calculating ANOVAs in Sample 2. All effect sizes (η2p) indicated small to less than small effects, as per Cohen (1992). Only weight status was substantially associated with SREBQ, with medium effect size (see Table 6). Participants with a BMI between 25 and 30 kg/m2 indicative of overweight exhibited lower levels of self-regulation than individuals with a BMI lower than 25 kg/m2, displaying normal weight or underweight, t(2,151) = 9.15, p = 0.001. Also, participants with a BMI higher than 30 kg/m2 in the obese weight range scored lower on the SREBQ scale than participants with a BMI lower than 25 kg/m2, t(1,425) = 12.65, p = 0.001. Further, the results indicated that women scored significantly higher in the SREBQ than men. In addition, individuals with a higher degree of education and income exhibited higher levels of self-regulation of eating behavior. Derived norm values are provided in Table 7.
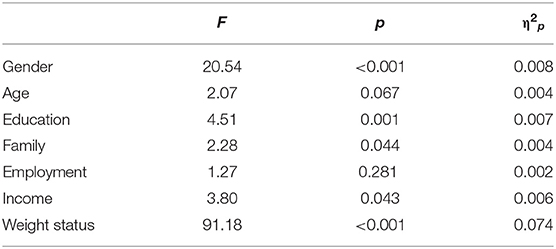
Table 6. ANOVA results for the Self-Regulation of Eating Behavior Questionnaire (Sample 2).
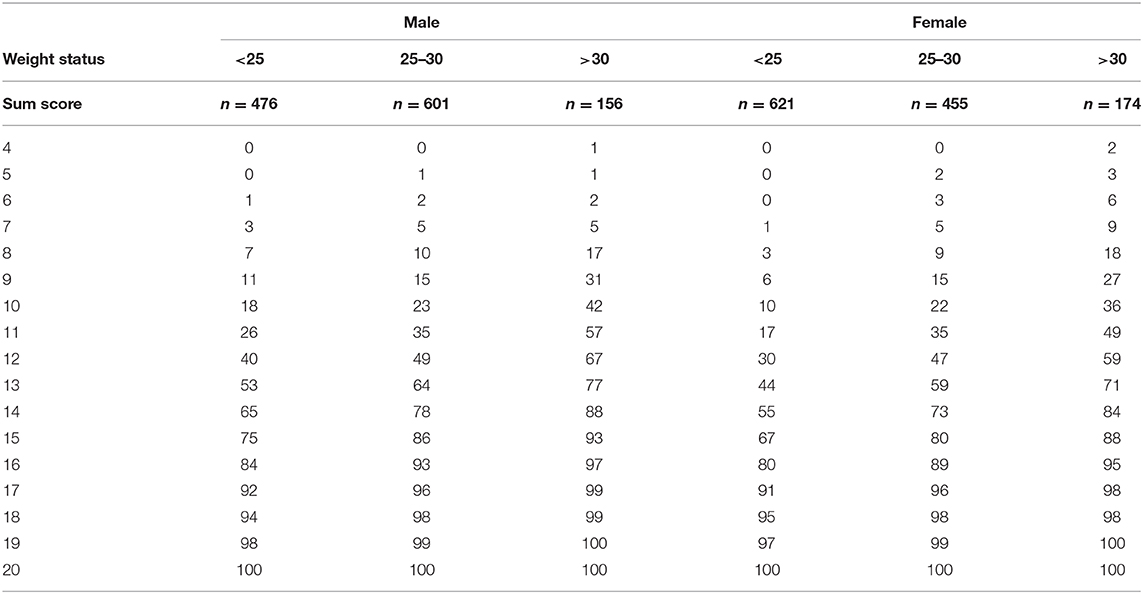
Table 7. Normative percentile ranks for the Self-Regulation of Eating Behavior Questionnaire sum scores.
Discussion
The aim of the present study was to develop a German version of the SREBQ and to assess the unifactorial model of the scale to German data. For this aim, we first tested the five translated items in a model corresponding to the one proposed by Kliemann et al. (2016).
Our data exhibited medium to poor fit in the original model across the employed indices (except for SRMR). Additionally, Item 5 had a very low item-total correlation and factor loading, leading us to exclude it and test an adapted model consisting of the remaining four items. This is consistent with the results of the original model, since item 5 also showed a smaller loading relative to the remaining items (Kliemann et al., 2016). Still, a possible explanation of this result might lie in the German translation and wording of this item 5 (“If I am not eating in the way I intend to I make changes”). It is conceivable that the word “intention” and the notion of it might have led to different responses. For example, to have an (initial) plan or an intention is not the same (Ajzen, 1985; Gollwitzer and Sheeran, 2006) opening scope for divergent interpretations of these concepts. A more precise translation, such as “… the way I initially planned to” might have provided a more accurate response in the German population. An alternative perspective provides cross-cultural differences related to food choices and health beliefs (e.g., quality vs. quantity; Leeman et al., 2011; Meule, 2020). In contrast to the fice-item model, the four-item model evidenced exceptional fit indices across the board and was thus accepted. Item characteristics for Items 1–4 were adequate and scale reliability improved to ω = 0.738, which is an acceptable internal consistency.
In a following study (Study 2), we replicated these findings in a robust and representative sample of the German population (Sample 2). In addition, we employed a simulation-based algorithm for judging model fit (Schmalbach et al., 2019). This approach addresses criticisms of the traditional fixed cutoff values (Nye and Drasgow, 2011) and hence presented conclusive support for the model fit of the 4-item SREBQ over the 5-item version. Furthermore, we presented evidence for strict invariance of the SREBQ across participant sex and age. Concerning weight status, we found evidence of scalar invariance, which is the minimum prerequisite for meaningful group comparisons.
The correlations of the SREBQ with related measures demonstrated convergent validity. First and foremost, we found moderate to high negative associations with the 6FQ, which captures unhealthy nutritional lifestyle choices—the opposite of successful self-regulation of eating behaviors. Furthermore, we observed negative relationships with eating disorder psychopathology, as well as psychological distress and more general psychopathology—depression and anxiety, confirming the reports of Tangney et al. (2004). On the other hand, positive correlations with life satisfaction and subjective health status were exhibited, as reported in previous studies (e.g., Gupta and Verma, 2019; Sharbafshaaer, 2019). Finally, there were no meaningful differences in SREBQ with regard to sociodemographic variables, except for gender. This indicates that other variables, such as personal lifestyle choices (as evidenced by the 6FQ) might be of greater interest in explaining interindividual differences in SREBQ. In line with previous studies (Campos-Uscanga et al., 2017; Johnson and Annesi, 2018), our results suggested that individuals with overweight and obesity exhibited lower levels of self-regulation than individuals with normal weight or underweight. Further, women exhibited better self-regulation of eating behavior than men. This outcome is in accordance with previous evidence, reporting that compared to men, women had better self-regulation in terms of nutritional behavior (Anderson et al., 2007). A possible explanation could be that women feel more social pressure concerning their appearance (Helfert and Warschburger, 2013), are in average more concerned with dieting and have a higher health literacy than men (Rozin et al., 2003). Moreover, our results suggested that individuals with a higher degree of education and income have in average higher levels of self-regulation of eating behavior. This outcome is consistent with the construct of health-related locus of control (Strudler Wallston and Wallston, 1978), which is related to self-regulation (Bandura, 1977; AbuSabha and Achterberg, 1997; Scoffier et al., 2010). It describes the ability to control one's health is a relevant determinants of health behavior and it has shown to be predictive of nutrition, weight control, and compliance to health programs, as described in past studies (Steptoe and Wardle, 2001; Helmer et al., 2012; Anastasiou et al., 2015).
Limitations
A potential criticism of our study is that we conducted both EFA and CFA on Sample 1. It is generally recommended to avoid doing so in order to avoid model over-specification. Nonetheless, this criticism can be invalidated by the confirmatory analysis we conducted in Sample 2. From the beginning, Sample 1 was planned as an exploratory pilot study, whereas the much larger Sample 2 was collected for purely confirmatory purposes. Further, even if the four-item-model yielded an adequate fit, it needs to be noted that item 4 exhibited a comparatively small loading. Future research could also consider testing the original scale with an adapted wording of the item 5. Taking these aspects into account further studies are needed to confirm our results.
Even if we did find a general negative association between self-regulation of eating behavior and eating disorder pathology (and psychopathology in general), we did not differentiate between types of eating disorders. EDs are associated with a disturbed self-regulation of eating behavior. While anorexia nervosa is related to an excessive and thus pathological amount of self-regulation, bulimia nervosa and binge-eating disorder (Hagger et al., 2009; Dingemans et al., 2017; Kenny et al., 2017, 2019) were found to be associated with lower levels of self-regulation. Consequently, we assumed that the SREBQ would evince these specific differences in the self-regulation of eating behavior. The negative association between SREBQ and BMI (kg/m2) is indicative of that, confirming this assumption. On a related note, the immediate impact of self-regulation on BMI trajectory would be an interesting research topic.
Conclusion
The data collected for the SREBQ assessment revealed that is a suitable tool for the measurement of an adult's and adolescent's self-regulatory ability in terms of eating behavior. In addition, a refined model was more suitable. With four, rather than five items the SREBQ allows for an economical yet accurate evaluation and can be recommended for medical, psychological, and nutritional research.
Data Availability Statement
The datasets generated and/or analyzed in Study 2 during the current study are not publicly available due to data protection, but are available from the authors who sponsored the data collection (Prof. Brähler, Prof. Hilbert, Prof. Beutel) upon reasonable request.
Ethics Statement
Ethics approval and consent to participate Study 1: The ethics committee of the University of Applied Sciences Magdeburg-Stendal approved of the procedure (AZ-4973-75). We conducted the study in accordance with the common ethical guidelines of the Declaration of Helsinki. Ethics approval and consent to participate Study 2: The ethics committee of the University of Leipzig approved the procedure (002/20-ek). Both studies were conducted in accordance with the common ethical guidelines of the Declaration of Helsinki.
Author Contributions
EB and AH contributed with data collection and study design and provide advice. MZ and KP contributed with literature research and provided critical advice for data interpretation. IS and BS contributed with writing the first draft of the paper. BS contributed with data analysis and interpretation and provided helpful advice for the discussion. All authors contributed with the writing and drafting of the paper.
Conflict of Interest
The authors declare that the research was conducted in the absence of any commercial or financial relationships that could be construed as a potential conflict of interest.
Acknowledgments
We are grateful to Susanne Rau, Stefan Wrabetz, Mark Martin, and Alexander von Eisenhart Rothe for the careful backtranslation of the questionnaire.
References
AbuSabha, R., and Achterberg, C. (1997). Review of self-efficacy and locus of control for nutrition-and health-related behavior. J. Am. Diet. Assoc. 97, 1122–1132. doi: 10.1016/S0002-8223(97)00273-3
Ajzen, I. (1985). “From intentions to actions: a theory of planned behavior,” in Action Control. SSSP Springer Series in Social Psychology, eds J. Kuhl, and J. Beckmann (Berlin, Heidelberg: Springer). doi: 10.1007/978-3-642-69746-3_2
Allan, J. L., Johnston, M., and Campbell, N. (2011). Missed by an inch or a mile? Predicting the size of intention–behaviour gap from measures of executive control. Psychol. Health 26, 635–650. doi: 10.1080/08870441003681307
Anastasiou, C. A., Fappa, E., Karfopoulou, E., Gkza, A., and Yannakoulia, M. (2015). Weight loss maintenance in relation to locus of control: the MedWeight study. Behav. Res. Ther. 71, 40–44. doi: 10.1016/j.brat.2015.05.010
Anderson, E. S., Winett, R. A., and Wojcik, J. R. (2007). Self-regulation, self-efficacy, outcome expectations, and social support: social cognitive theory and nutrition behavior. Ann. Behav. Med. 34, 304–312. doi: 10.1007/BF02874555
Annesi, J. J. (2019). Change in behavioral exercise program-associated self-regulation enhances self-regulation-induced eating improvements across levels of obesity severity. Eval. Program Plann. 75, 31–37. doi: 10.1016/j.evalprogplan.2019.04.002
Balani, R., Herrington, H., Bryant, E., Lucas, C., and Kim, S. C. (2019). Nutrition knowledge, attitudes, and self-regulation as predictors of overweight and obesity. J. Am. Assoc. Nurs. Pract. 31, 502–510. doi: 10.1097/JXX.0000000000000169
Bandura, A. (1977). Self-efficacy: toward a unifying theory of behavioral change. Psychol. Rev. 84:191. doi: 10.1037/0033-295X.84.2.191
Baumeister, R. F., Tice, D. M., and Vohs, K. D. (2018). The strength model of self-regulation: Conclusions from the second decade of willpower research. Perspect. Psychol. Sci. 13, 141–145. doi: 10.1177/1745691617716946
Bentler, P. M., and Bonett, D. G. (1980). Significance tests and goodness of fit in the analysis of covariance structures. Psychol. Bull. 88:588. doi: 10.1037/0033-2909.88.3.588
Berking, M., and Wupperman, P. (2012). Emotion regulation and mental health: recent findings, current challenges, and future directions. Curr. Opin. Psychiatry 25, 128–134. doi: 10.1097/YCO.0b013e3283503669
Brooks, R., Rabin, R., and de Charro, F. (2003). The Measurement and Valuation of Health Status Using EQ-5D: A European Perspective. Dordrecht: Kluwer Academic. doi: 10.1007/978-94-017-0233-1
Cameron, L. D., and Leventhal, H., (eds.). (2003). The Self-Regulation of Health and Illness Behaviour. London and New York: Routledge, 1–14.
Campos-Uscanga, Y., Gutiérrez-Ospina, G., Morales-Romero, J., and Romo-González, T. (2017). Self-regulation of eating and physical activity is lower in obese female college students as compared to their normal weight counterparts. Eat. Weight Disord. Stud. Anorexia Bulimia Obesity 22, 311–319. doi: 10.1007/s40519-016-0338-9
Carey, K. B., Neal, D. J., and Collins, S. E. (2004). A psychometric analysis of the self-regulation questionnaire. Addict. Behav. 29, 253–260. doi: 10.1016/j.addbeh.2003.08.001
Carver, C. S., and Scheier, M. F. (2012). “A model of behavioral self-regulation,” in Handbook of Theories of Social Psychology, eds P. A. M. Van Lange, A. W. Kruglanski and E. T. Higgins (Thousand Oaks, CA: Sage), 505–525.
Carver, C. S., and Scheier, M. F. (2017). Self-regulatory functions supporting motivated action. Adv. Motiv. Sci. 4, 1–37. doi: 10.1016/bs.adms.2017.02.002
Cheung, G. W., and Rensvold, R. B. (2002). Evaluating goodness-of-fit indexes for testing measurement invariance. Struct. Equ. Model. 9, 233–255. doi: 10.1207/S15328007SEM0902_5
De Castella, K., Goldin, P., Jazaieri, H., Ziv, M., Dweck, C. S., and Gross, J. J. (2013). Beliefs about emotion: links to emotion regulation, well-being, and psychological distress. Basic Appl. Soc. Psychol. 35, 497–505. doi: 10.1080/01973533.2013.840632
De Lorenzo, A., Gratteri, S., Gualtieri, P., Cammarano, A., Bertucci, P., and Di Renzo, L. (2019). Why primary obesity is a disease? J. Transl. Med. 17, 1–13. doi: 10.1186/s12967-019-1919-y
De Vet, E., De Ridder, D., Stok, M., Brunso, K., Baban, A., and Gaspar, T. (2014). Assessing self-regulation strategies: development and validation of the tempest self-regulation questionnaire for eating (TESQ-E) in adolescents. Int. J. Behav. Nutr. Phys. Act. 11, 1–15. doi: 10.1186/s12966-014-0106-z
Deutsche Adipositas Gesellschaft/German Obesity Society (2014). S3-Leitlinie Prävention und Therapie der Adipositas. Availble online at: https://www.awmf.org/uploads/tx_szleitlinien/050-001l_S3_Adipositas_Pr%C3%A4vention_Therapie_2014-11-abgelaufen.pdf (accessed January 25, 2021).
Dingemans, A., Danner, U., and Parks, M. (2017). Emotion regulation in binge eating disorder: a review. Nutrients 9:1274. doi: 10.3390/nu9111274
Dinno, A. (2018). paran: Horn's Test of Principal Components/Factors. R Package Version 1.5.2. Availble online at: https://CRAN.R-project.org/package=paran (accessed October 15, 2020).
Dohle, S., Diel, K., and Hofmann, W. (2018). Executive functions and the self-regulation of eating behavior: a review. Appetite 124, 4–9. doi: 10.1016/j.appet.2017.05.041
Dombrowski, S. U., Knittle, K., Avenell, A., Araujo-Soares, V., and Sniehotta, F. F. (2014). Longterm maintenance of weight loss with non-surgical interventions in obese adults: systematic review and meta-analyses of randomized controlled trials. BMJ 348:g2646. doi: 10.1136/bmj.g2646
Effertz, T., Engel, S., Verheyen, F., and Linder, R. (2016). The costs and consequences of obesity in Germany: a new approach from a prevalence and life-cycle perspective. Eur. J. Health Econ. 17, 1141–1158. doi: 10.1007/s10198-015-0751-4
Federal Statistical Office of Germany (2019). Bevölkerung [Population]. Available online at: https://www.destatis.de/DE/ZahlenFakten/GesellschaftStaat/Bevoelkerung/Bevoelkerung.html (accessed January 25, 2021).
Gardner, B., Lally, P., and Wardle, J. (2012). Making health habitual: the psychology of ‘habit-formation' and general practice. Br. J. Gen. Pract. 62, 664–666. doi: 10.3399/bjgp12X659466
Gellert, P., Ziegelmann, J. P., Lippke, S., and Schwarzer, R. (2011). Future time perspective and health behaviors: temporal framing of self-regulatory processes in physical exercise and dietary behaviors. Ann. Behav. Med. 43, 208–218. doi: 10.1007/s12160-011-9312-y
Glaesmer, H., Grande, G., Braehler, E., and Roth, M. (2011). The German version of the satisfaction with life scale (SWLS). Eur. J. Psychol. Assess. 27, 127–132. doi: 10.1027/1015-5759/a000058
Gollwitzer, P. M., and Sheeran, P. (2006). Implementation intentions and goal achievement: a meta-analysis of effects and processes. Adv. Exp. Soc. Psychol. 38, 69–119. doi: 10.1016/S0065-2601(06)38002-1
Grant, N., Wardle, J., and Steptoe, A. (2009). The relationship between life satisfaction and health behavior: a cross-cultural analysis of young adults. Int. J. Behav. Med. 16, 259–268. doi: 10.1007/s12529-009-9032-x
Gross, J. J. (2014). “Emotion regulation: conceptual and empirical foundations,” in Handbook of Emotion Regulation, ed J. J. Gross (New York, NY: Guilford), 3–20.
Gupta, S., and Verma, H. V. (2019). Mindfulness, mindful consumption, and life satisfaction: an experiment with higher education students. J. Appl. Res. Higher Educ.12:235. doi: 10.1108/JARHE-11-2018-0235
Hagger, M. S., Wood, C., Stiff, C., and Chatzisarantis, N. L. (2009). The strength model of self-regulation failure and health-related behaviour. Health Psychol. Rev. 3, 208–238. doi: 10.1080/17437190903414387
Hamilton, T., Hoffman, J., Arsiwalla, D., Volpe, R., Schmidt, E., and Gropper, S. (2018). Gender comparisons of young adults' eating behavior regulation: re-examination of the Regulation of Eating Behavior Scale (REBS). Appetite 126, 80–89. doi: 10.1016/j.appet.2018.03.014
Hankonen, N., Kinnunen, M., Absetz, P., and Jallinoja, P. (2013). Why do people high in self-control eat more healthily? Social cognitions as mediators. Ann. Behav. Med. 47, 242–248. doi: 10.1007/s12160-013-9535-1
Helfert, S., and Warschburger, P. (2013). The face of appearance-related social pressure: gender, age and body mass variations in peer and parental pressure during adolescence. Child Adolesc. Psychiatry Ment. Health 7:16. doi: 10.1186/1753-2000-7-16
Helmer, S. M., Krämer, A., and Mikolajczyk, R. T. (2012). Health-related locus of control and health behaviour among university students in North Rhine Westphalia, Germany. BMC Res. Notes 5:703. doi: 10.1186/1756-0500-5-703
Hilbert, A. (2021). Adipositas und psychische Komorbidität: therapeutische Implikationen. Psychotherapeut 66, 10–15. doi: 10.1007/s00278-020-00480-4
Hofmann, W., Schmeichel, B. J., and Baddeley, A. D. (2012). Executive functions and self-regulation. Trends Cogn. Sci. 16, 174–180. doi: 10.1016/j.tics.2012.01.006
Horn, J. L. (1965). A rationale and test for the number of factors in factor analysis. Psychometrika 30, 179–185. doi: 10.1007/BF02289447
Hu, L. T., and Bentler, P. M. (1998). Fit indices in covariance structure modeling: sensitivity to underparameterized model misspecification. Psychol. Methods 3:424. doi: 10.1037/1082-989X.3.4.424
Hu, L. T., and Bentler, P. M. (1999). Cutoff criteria for fit indexes in covariance structure analysis: conventional criteria versus new alternatives. Struct. Equ. Model. 6, 1–55. doi: 10.1080/10705519909540118
Johnson, P. H., and Annesi, J. J. (2018). Factors related to weight gain/loss among emerging adults with obesity. Am. J. Health Behav. 42, 3–16. doi: 10.5993/AJHB.42.3.1
Kenny, T. E., Singleton, C., and Carter, J. C. (2017). Testing predictions of the emotion regulation model of binge-eating disorder. Int. J. Eat. Disord. 50:22787. doi: 10.1002/eat.22787
Kenny, T. E., Singleton, C., and Carter, J. C. (2019). An examination of emotion-related facets of impulsivity in binge eating disorder. Eat. Behav. 32, 74–77. doi: 10.1016/j.eatbeh.2018.12.006
Kim, H. Y. (2013). Statistical notes for clinical researchers: assessing normal distribution (2) using skewness and kurtosis. Restorative Dent. Endodont. 38, 52–54. doi: 10.5395/rde.2013.38.1.52
Klaghofer, R., and Brähler, E. (2001). Konstruktion und Teststatistische Prüfung einer Kurzform der SCL-90–R. [Construction and test statistical evaluation of a short version of the SCL-90 -R]. Z. Klin. Psychol. Psychiatrie Psychother. 49, 115–124.
Kliem, S., Mößle, T., Zenger, M., Strau,ß, B., Brähler, E., and Hilbert, A. (2016). The eating disorder examination-questionnaire 8: a brief measure of eating disorder psychopathology (EDE-Q8). Int. J. Eat. Disord. 49, 613–616. doi: 10.1002/eat.22487
Kliemann, N., Beeken, R. J., Wardle, J., and Johnson, F. (2016). Development and validation of the self-regulation of eating behaviour questionnaire for adults. Int. J. Behav. Nutr. Phys. Act. 13:87. doi: 10.1186/s12966-016-0414-6
Kreausukon, P., Gellert, P., Lippke, S., and Schwarzer, R. (2012). Planning and self-efficacy can increase fruit and vegetable consumption: a randomized controlled trial. J. Behav. Med. 35, 443–451. doi: 10.1007/s10865-011-9373-1
Kroenke, K., Spitzer, R. L., Williams, J. B., and Löwe, B. (2009). An ultra-brief screening scale for anxiety and depression: the PHQ−4. Psychosomatics 50, 613–621. doi: 10.1176/appi.psy.50.6.613
Kushner, R. F., Choi, S. W., and Burns, J. L. (2016). Development of a six-factor questionnaire for use in weight management counseling. Patient Educ. Couns. 99, 2018–2025. doi: 10.1016/j.pec.2016.06.022
Leehr, E. J., Krohmer, K., Schag, K., Dresler, T., Zipfel, S., and Giel, K. E. (2015). Emotion regulation model in binge eating disorder and obesity-a systematic review. Neurosci. Biobehav. Rev. 49, 125–134. doi: 10.1016/j.neubiorev.2014.12.008
Leeman, R. F., Fischler, C., and Rozin, P. (2011). Medical doctors' attitudes and beliefs about diet and health are more like those of their lay countrymen (France, Germany, Italy, UK and USA) than those of doctors in other countries. Appetite 56, 558–563. doi: 10.1016/j.appet.2011.01.022
Lehnert, T., Streltchenia, P., Konnopka, A., Riedel-Heller, S. G., and König, H. H. (2015). Health burden and costs of obesity and overweight in Germany: an update. Eur. J. Health Econ. 16, 957–967. doi: 10.1007/s10198-014-0645-x
Leiner, D. J. (2014). SoSci Survey (Version 2.6.00-i) [Computer software]. Available online at: https://www.soscisurvey.de
Leventhal, H., Phillips, L. A., and Burns, E. (2016). The Common-Sense Model of Self-Regulation (CSM): a dynamic framework for understanding illness self-management. J. Behav. Med. 39, 935–946. doi: 10.1007/s10865-016-9782-2
Lewis, C. E., McTigue, K. M., Burke, L. E., Poirier, P., and Eckel, R. H. (2009). Mortality, health outcomes, and body mass index in the overweight range. A science advisory from the American Heart Association. Circulation 119, 3263–3271.
Llewellyn, C., and Wardle, J. (2015). Behavioral susceptibility to obesity: gene–environment interplay in the development of weight. Physiol. Behav. 152, 494–501. doi: 10.1016/j.physbeh.2015.07.006
Löwe, B., Wahl, I., Rose, M., Spitzer, C., Glaesmer, H., Wingenfeld, K., et al. (2010). A 4-item measure of depression and anxiety: validation and standardization of the Patient Health Questionnaire-4 (PHQ-4) in the general population. J. Affect. Disord. 122, 86–95. doi: 10.1016/j.jad.2009.06.019
Mensink, G. B., Schienkiewitz, A., Haftenberger, M., Lampert, T., Ziese, T., and Scheidt-Nave, C. (2013). Übergewicht und adipositas in deutschland. Bundesgesundheitsblatt. Gesundheitsforschung. Gesundheits. 56, 786–794. doi: 10.1007/s00103-012-1656-3
Meule, A. (2020). “Cross-cultural testing of dietary restraint,” in Handbook of Eating and Drinking, ed H. Meiselman (Cham: Springer), 1–15. doi: 10.1007/978-3-030-14504-0_134
Milfont, T. L., and Fischer, R. (2010). Testing measurement invariance across groups: applications in cross-cultural research. Int. J. Psychol. Res. 3, 111–130. doi: 10.21500/20112084.857
Moilanen, K. L. (2007). The adolescent self-regulatory inventory: the development and validation of a questionnaire of short-term and long-term self-regulation. J. Youth Adolesc. 36, 835–848. doi: 10.1007/s10964-006-9107-9
Monnery-Patris, S., Rigal, N., Peteuil, A., Chabanet, C., and Issanchou, S. (2019). Development of a new questionnaire to assess the links between children's self-regulation of eating and related parental feeding practices. Appetite 138, 174–183. doi: 10.1016/j.appet.2019.03.029
Nye, C. D., and Drasgow, F. (2011). Assessing goodness of fit: simple rules of thumb simply do not work. Organ. Res. Methods 14, 548–570. doi: 10.1177/1094428110368562
Pelletier, L. G., Dion, S. C., Slovinec-D'Angelo, M., and Reid, R. (2004). Why do you regulate what you eat? Relationships between forms of regulation, eating behaviors, sustained dietary behavior change, and psychological adjustment. Motiv. Emot. 28, 245–277. doi: 10.1023/B:MOEM.0000040154.40922.14
Prinz, U., Nutzinger, D. O., Schulz, H., Petermann, F., Braukhaus, C., and Andreas, S. (2013). Comparative psychometric analyses of the SCL-90-R and its short versions in patients with affective disorders. BMC Psychiatry 13:104. doi: 10.1186/1471-244X-13-104
Reed, J. R., Yates, B. C., Houfek, J., Pullen, C. H., Briner, W., and Schmid, K. K. (2016). Eating self-regulation in overweight and obese adults: a concept analysis. Nurs. Forum 51, 105–116. doi: 10.1111/nuf.12125
Rosseel, Y. (2012). Lavaan: an R package for structural equation modeling and more. Version 0.5–12 (BETA). J. Stat. Softw. 48, 1–36. doi: 10.18637/jss.v048.i02
Rozin, P., Bauer, R., and Catanese, D. (2003). Food and life, pleasure and worry, among American college students: gender differences and regional similarities. J. Pers. Soc. Psychol. 85:132. doi: 10.1037/0022-3514.85.1.132
Ruzanska, U. A., and Warschburger, P. (2019). Intuitive eating mediates the relationship between self-regulation and BMI-Results from a cross-sectional study in a community sample. Eat. Behav. 33, 23–29. doi: 10.1016/j.eatbeh.2019.02.004
Schermelleh-Engel, K., Moosbrugger, H., and Müller, H. (2003). Evaluating the fit of structural equation models: tests of significance and descriptive goodness-of-fit measures. Methods Psychol. Res. Online 8, 23–74. Available online at: http://www.mpr-online.de
Schmalbach, B., Irmer, J. P., and Schultze, M. (2019). ezCutoffs: Fit Measure Cutoffs in SEM. R Package Version 1.0.2. Available online at: https://CRAN.R-project.org/package=ezCutoffs (accessed October 15, 2020).
Schroder, K. E. E., Ollis, C. L., and Davies, S. (2013). Habitual self–control: a brief measure of persistent goal pursuit. Eur. J. Pers. 27, 82–95. doi: 10.1002/per.1891
Scoffier, S., Maïano, C., and d'Arripe-Longueville, F. (2010). The effects of social relationships and acceptance on disturbed eating attitudes in elite adolescent female athletes: the mediating role of physical self-perceptions. Int. J. Eat. Disord. 43, 65–71. doi: 10.1002/eat.20597
SemTools Contributors. (2016). semTools: Useful Tools For Structural Equation Modeling. R Package Version 0.4–14 Comprehensive R Archive Network (CRAN). Available online at: https://CRAN.R-project.org/package=semTools
Sharbafshaaer, M. (2019). Correlation between dimensions of psychological well-being with life satisfaction and self-regulation. J. Fundamentals Ment. Health 21, 160–166. doi: 10.22038/JFMH.2019.13401
Steptoe, A., and Wardle, J. (2001). Locus of control and health behaviour revisited: a multivariate analysis of young adults from 18 countries. Br. J. Psychol. 92, 659–672. doi: 10.1348/000712601162400
Strudler Wallston, B., and Wallston, K. A. (1978). Locus of control and health: a review of the literature. Health Educ. Monogr. 6, 107–117. doi: 10.1177/109019817800600102
Swinburn, B. A., Sacks, G., Hall, K. D., McPherson, K., Finegood, D. T., Moodie, M. L., et al. (2011). The global obesity pandemic: shaped by global drivers and local environments. Lancet 378, 804–814. doi: 10.1016/S0140-6736(11)60813-1
Tangney, J. P., Baumeister, R. F., and Boone, A. L. (2004). High self-control predicts good adjustment, less pathology, better grades, and interpersonal success. J. Pers. 72, 271–324. doi: 10.1111/j.0022-3506.2004.00263.x
Torres, S. J., and Nowson, C. A. (2007). Relationship between stress, eating behavior, and obesity. Nutrition 23, 887–894. doi: 10.1016/j.nut.2007.08.008
Trizano-Hermosilla, I., and Alvarado, J. M. (2016). Best alternatives to cronbach's alpha reliability in realistic conditions: congeneric and asymmetrical measurements. Front. Psychol. 7:769. doi: 10.3389/fpsyg.2016.00769
Usher, E. L., and Schunk, D. H. (2018). Social cognitive theoretical perspective of self-regulation. doi: 10.4324/9781315697048-2
World Health Organization (2010). Processs of translation and adaption of instruments. Availble online at: https://www.who.int/substance_abuse/research_tools/translation/en/ (accessed February 26, 2021).
Yang, Y., Shields, G. S., Guo, C., and Liu, Y. (2018). Executive function performance in obesity and overweight individuals: a meta-analysis and review. Neurosci. Biobehav. Rev. 84, 225–244. doi: 10.1016/j.neubiorev.2017.11.020
Yap, B. W., and Sim, C. H. (2011). Comparisons of various types of normality tests. J. Stat. Comput. Simul. 81, 2141–2155. doi: 10.1080/00949655.2010.520163
Yuan, K. H., and Bentler, P. M. (2000). Three likelihood-based methods for mean and covariance structure analysis with nonnormal missing data. Sociol. Methodol. 30, 165–200. doi: 10.1111/0081-1750.00078
Zhang, G., Jiang, G., Hattori, M., and Trichtinger, L. (2020). EFAutilities: Utility Functions for Exploratory Factor Analysis. R Package Version 2.1.1. Availble online at: https://CRAN.R-project.org/package=EFAutilities (accessed October 15, 2020).
Keywords: self-regulation, eating behavior, health, short scale, psychometric properties, weight management
Citation: Schmalbach I, Schmalbach B, Zenger M, Petrowski K, Beutel M, Hilbert A and Brähler E (2021) Psychometric Properties of the German Version of the Self-Regulation of Eating Behavior Questionnaire. Front. Psychol. 12:649867. doi: 10.3389/fpsyg.2021.649867
Received: 05 January 2021; Accepted: 15 February 2021;
Published: 12 March 2021.
Edited by:
Sai-fu Fung, City University of Hong Kong, Hong KongReviewed by:
Jinbo He, The Chinese University of Hong Kong, ChinaWanderson Silva, São Paulo State University, Brazil
Copyright © 2021 Schmalbach, Schmalbach, Zenger, Petrowski, Beutel, Hilbert and Brähler. This is an open-access article distributed under the terms of the Creative Commons Attribution License (CC BY). The use, distribution or reproduction in other forums is permitted, provided the original author(s) and the copyright owner(s) are credited and that the original publication in this journal is cited, in accordance with accepted academic practice. No use, distribution or reproduction is permitted which does not comply with these terms.
*Correspondence: Ileana Schmalbach, aXN0ZWZmZW5AdW5pLW1haW56LmRl; Katja Petrowski, a3BldHJvd3NAdW5pLW1haW56LmRl; Anja Hilbert, YW5qYS5oaWxiZXJ0QHVuaS1sZWlwemlnLmRl
†These authors have contributed equally to this work