 Carolina Gonzálvez
 Miriam Martín
 María Vicent
 Ricardo Sanmartín
- Department of Development Psychology and Teaching, University of Alicante, Alicante, Spain
In order to reduce school attendance problems and aggressive behavior, it is essential to determine the relationship between both variables. The aim of this study was twofold: (1) to examine the mean differences in scores on aggression, based on school refusal behavior, and (2) to analyze the predictive capacity of high scores on aggression, based on school refusal behavior factors. The sample consisted of 1455 Spanish secondary school students, aged 13–17 (M = 14.85; SD = 1.56). The School Refusal Assessment Scale-Revised (I. Avoidance of negative affectivity, II. Escape from aversive social and/or evaluative situations, III. Pursuit of attention from significant others, and IV. Pursuit of tangible reinforcement outside of school) and the Aggression Questionnaire (I. Physical Aggression, II. Verbal Aggression, III. Anger, and IV. Hostility) were used. Results indicated that students having high levels of Physical Aggression, Verbal Aggression, Anger, and Hostility received significantly higher scores on school refusal behavior. In most cases, school refusal behavior was found to be a positive and statistically significant predictor of aggression. Students that base their school refusal on the pursuit of tangible reinforcements outside of school earned higher scores, and other functional conditions underlying school refusal behavior were found to be associated with aggression issues. The role of aggression as a risk factor for school refusal behavior is discussed.
Introduction
School attendance and academic success have long been recognized as fundamental and crucial competencies for children and adolescents (Kearney et al., 2019). However, school attendance problems concern educational authorities as they are considered a violation of school rules but also social norms (Donat et al., 2018). Problems regarding school attendance include distinct types of school absence or general difficulties in attending or staying in school (Heyne et al., 2019). It is difficult to establish one unique model that includes all of the potential causes of this behavior (Gonzálvez and Inglés, 2019). However, according to a functional model of school refusal behavior (see Figure 1), four basic conditions exist, upon which the failure to attend school may be based: I. Avoidance of stimuli that provoke negative affectivity, II. Escape from aversive social and/or evaluative situations, III. Pursuit of attention from significant others, and IV. Pursuit of tangible reinforcement outside of school (Kearney, 2002).
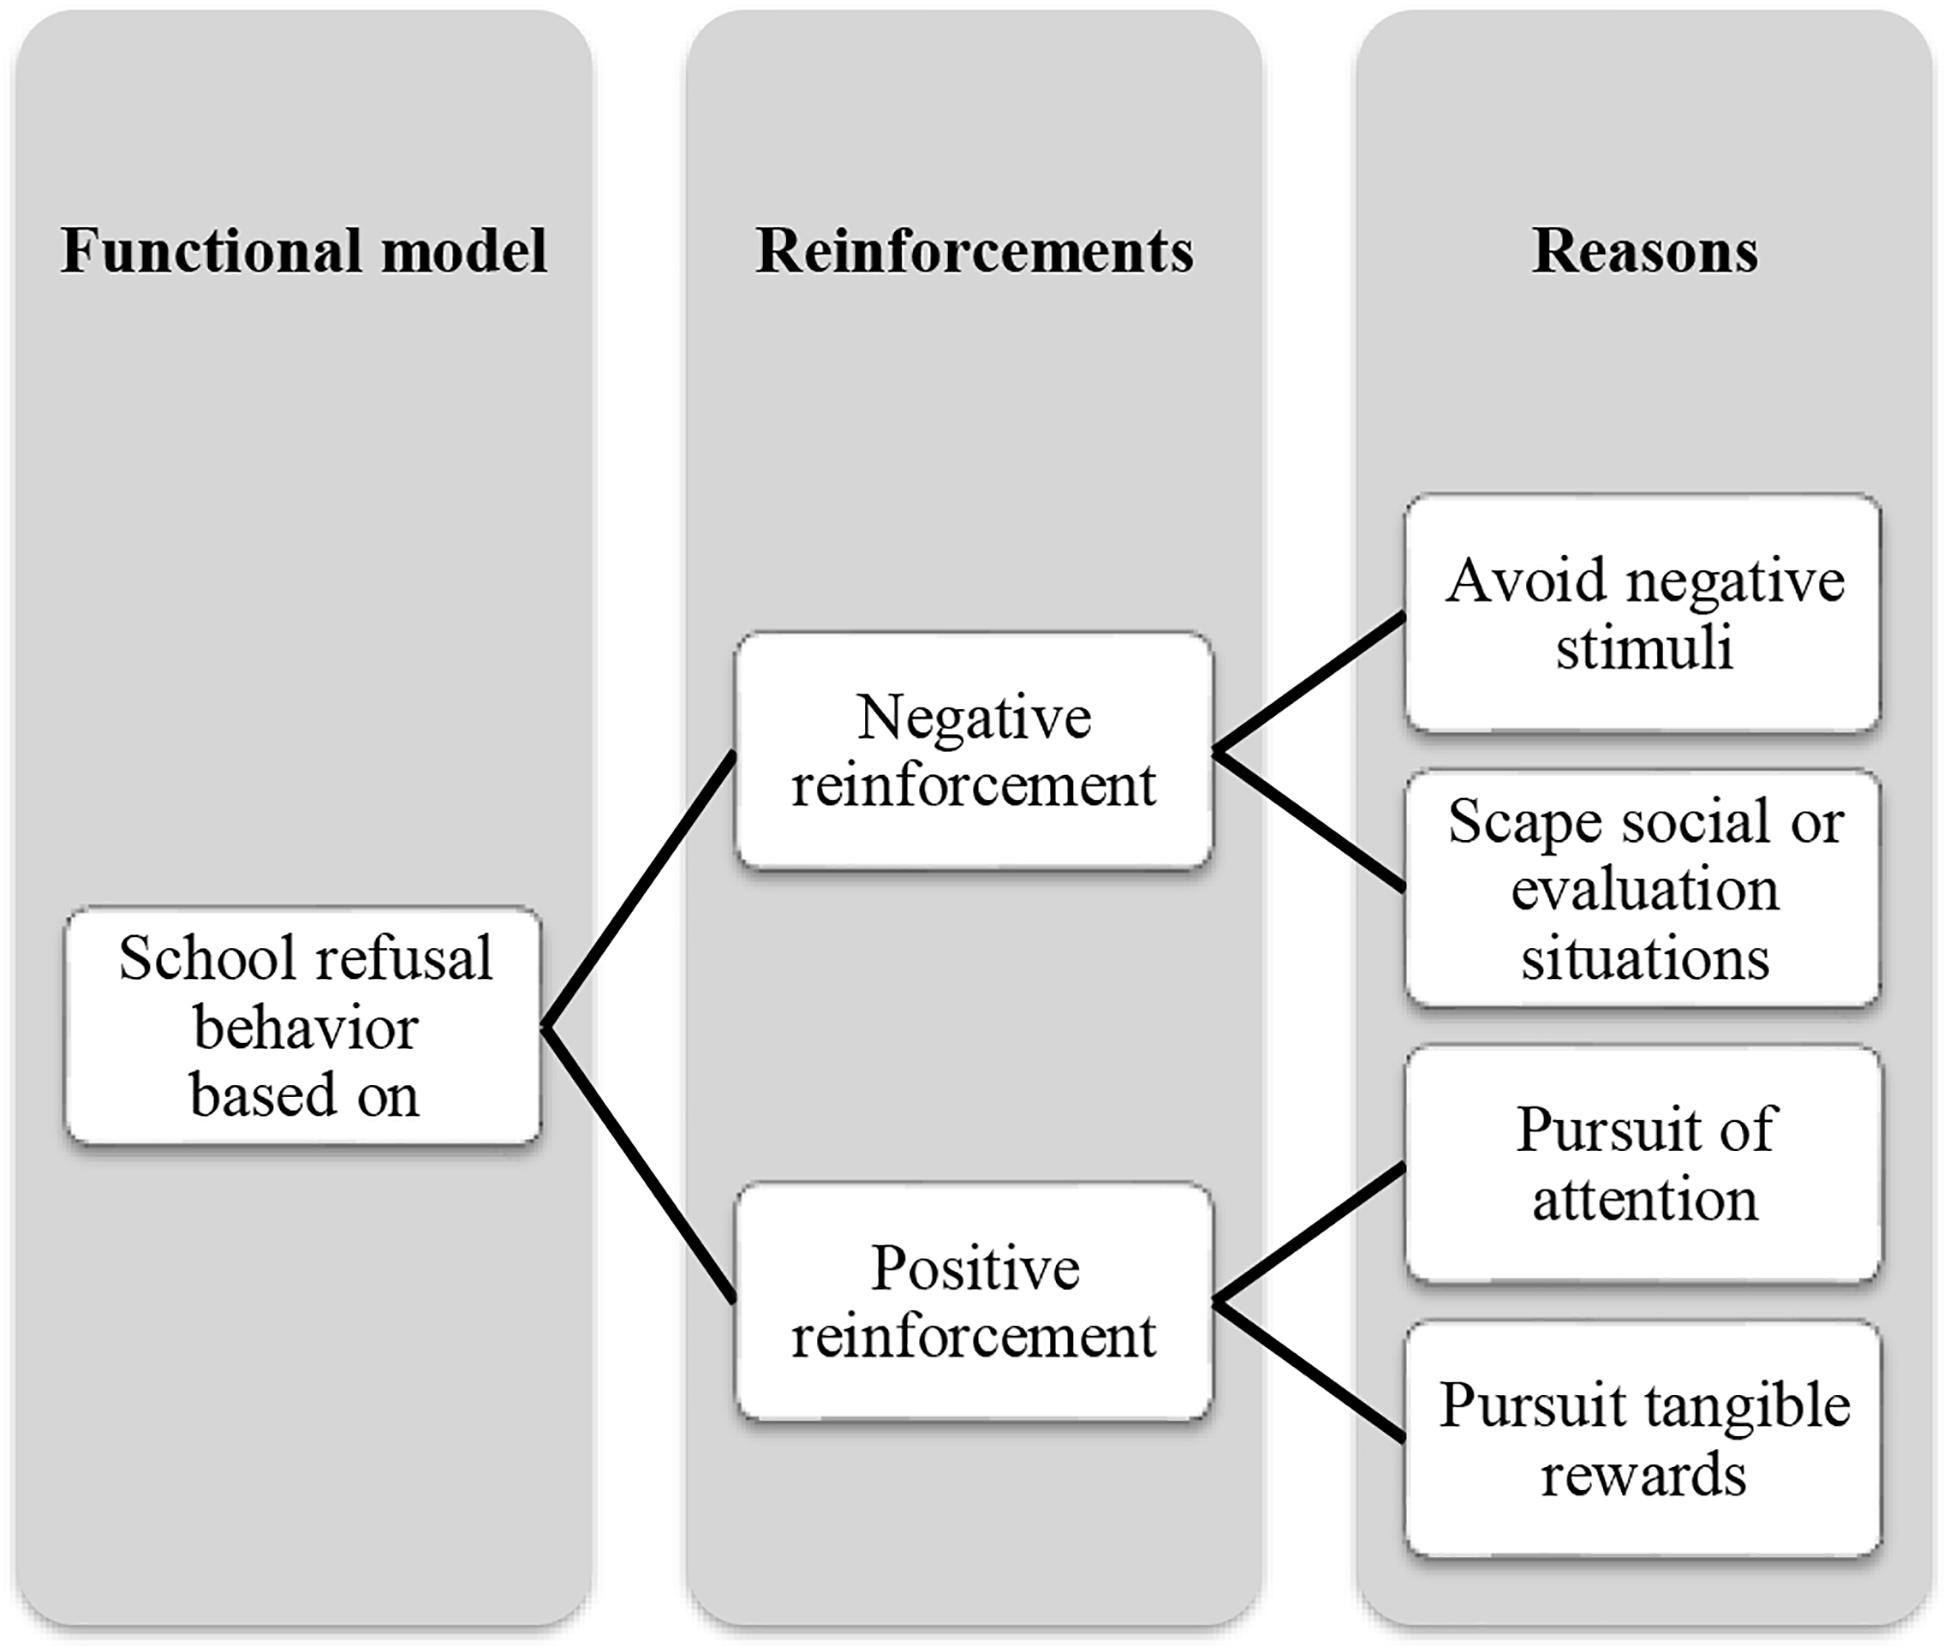
Figure 1. Functional model of school refusal behavior.
In a society that encourages the education of its youth, school attendance has become a major issue for political and educational authorities (Havik et al., 2014). Given that the social significance of attending school has been shown to favor the educational, social, and personal development of children, measures have been created to remedy school absenteeism, by enacting distinct legal provisions and prevention/intervention measures. An example of this is the Sustainable Development Goal 4 (SDG 4) of Agenda 2030, approved by the General Assembly of the United Nations in 2015, which urges governments to guarantee that all children complete their primary and secondary level education. In Spain, legal measures have been proposed to reduce school absenteeism, promoting early intervention for students. Specifically, article 8 of Decreto 104/2008 establishes the principles of equality and inclusion in Valencia’s educational system. It establishes plans to combat school absenteeism and early school dropout. School refusal demands early intervention to ensure the reincorporation of affected students as soon as possible. This helps avoid situations of inequality and social exclusion (Pehlivan, 2011; Ingul et al., 2019). Several familiar, personal, and social factors play a significant role in school refusal behavior; therefore, educational inclusion practices may improve students’ expectations and results. This, in turn, thus promotes their school adaptation (Fernández-Batanero, 2011). In this sense, the school plays a very important role, because depending on the quality of individual attention a student receives or the type of methodology used by the teacher, school refusal behavior could occur (Filippello et al., 2019).
Every year, approximately 246 million students experience some sort of violence in and around school (United Nations, 2017), with school attendance problems being one potential consequence of this violence (Shaikh et al., 2019). The individual’s response to school absenteeism plays a major role in their resulting emotions, which may range from intense excitement to anger or aggressiveness (Law et al., 2011). Our society has made a latent attempt to improve the quality of life of its citizens and to reduce violence. Therefore, an improved understanding of the influential factors underlying these types of aggressive behavior is necessary (Cupaioli et al., 2019). Baron and Byrne (2005) noted that the primary motives explaining aggression are social, personal, and situational factors. Furthermore, three basic components of aggressive behavior have been proposed: a cognitive component (hostility), an emotional component (anger), and a motor component (physical or verbal aggression) (Anderson and Bushman, 2002). It has been suggested that the main objective of physical aggression is to harm or humiliate (Ramírez and Andreu, 2003), and the objective of verbal aggression is to cause psychological harm (Piko and Keresztes, 2006). Anger is a response to threats that are real (or not real) (García et al., 2020), while hostility is a negative emotion resulting from refusal and that may lead to abusive and aggressive situations (Rendón, 2008).
Of the negative consequences of school absenteeism, evidence suggests that certain types of school refusal behaviors are linked to externalizing behavior problems (Vaughn et al., 2014). Cardwell et al. (2019) noted that a greater presence of risk factors (e.g., impulsiveness, poor relationship with parents, or antisocial behavior with peers) can lead to a greater probability of engaging in violent acts during adolescence. Previous studies have suggested that the transition into adolescence coincides with a period of psychological, biological, and emotional transformation (Martínez González and Álvarez Blanco, 2005), which may explain the increase in disruptive or aggressive behavior during this life phase (Buckley et al., 2012; Peltzer and Pengpid, 2017; Rocque et al., 2017). However, no studies with Spanish student samples have been found that analyze the relationship between school refusal (from a functional model) and aggression during this period. Only one study has been identified that examined the relationship between these variables, but in a sample of young children (Aparicio-Flores et al., 2020). In this study, it was determined that students with very aggressive behavior received higher scores on school refusal, and this refusal was a positive predictor of aggression. Differences based on sex and age were found in this study, highlighting the need for further research on the relationship between these variables during adolescence.
The objective of this study is to examine the relationship between school refusal and aggression in Spanish adolescents aged 13–17. This general objective has been narrowed down into two specific objectives: (a) to examine whether or not differences exist in mean scores on school refusal behavior in students with high and low scores on Physical Aggression, Verbal Aggression, Anger, and Hostility; and (b) to analyze the predictive capacity of school refusal on high scores in Physical Aggression, Verbal Aggression, Anger, and Hostility. Based on empirical evidence, the following hypotheses were proposed:
Hypothesis 1: It is expected that students with high levels of Physical Aggression, Verbal Aggression, Anger, and Hostility will score higher on school refusal behavior than their peers having low aggression levels (Echevarría and López-Zafra, 2011; Aparicio-Flores et al., 2020).
Hypothesis 2: It is expected that school refusal behavior will act as a positive and statistically significant predictor of high levels of Physical Aggression, Verbal Aggression, Anger, and Hostility (Wood et al., 2012; Agreda and Hinojo, 2015; Aparicio-Flores et al., 2020).
Materials and Methods
Participants
The initial sample consisted of 1518 students aged 13–17 (M = 14.85; SD = 1.56) (see Table 1). Of these participants, 63 were excluded because they either did not give the written informed consent from their parents (N = 37) or because there were errors or omissions in the completed questionnaires (N = 26). The final sample contained 1455 high school students (61% male). Sample selection was conducted via random cluster sampling (geographic areas: north, south, east, west, and center) in the province of Alicante (Spain), with the participation of 12 schools (eight public and four charter schools). The socio-economic level, based on the parents’ labor situation and academic education levels, was considered as middle class.
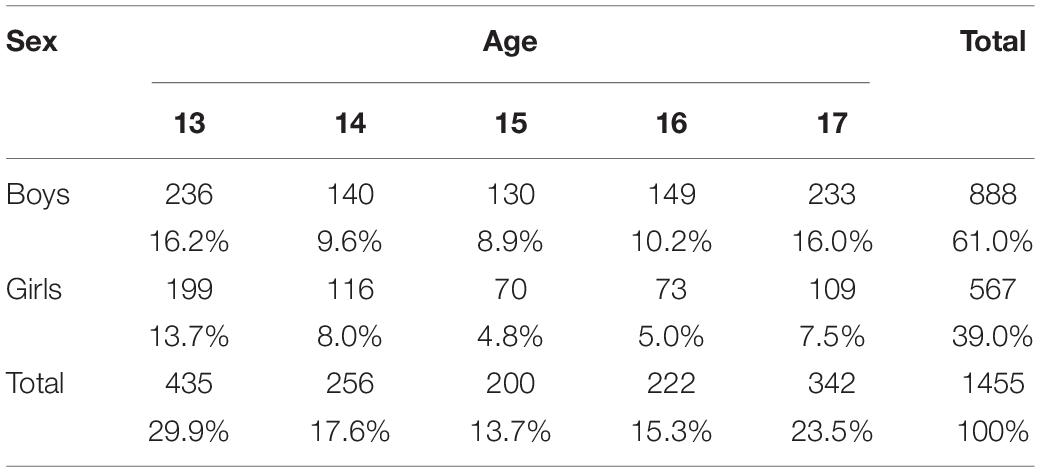
Table 1. Sample distribution across sex and age.
Instruments
School Refusal Assessment Scale-Revised (SRAS-R; Kearney, 2002). The SRAS-R is a self-reporting measure consisting of 24 items having a seven-point response scale (0 = never; 6 = always). This instrument assesses school refusal behavior in students aged 8–17. Specifically, it permits the assessment of causes of school absenteeism, using a functional model that proposes four factors that contribute to school refusal: I. Avoidance of stimuli that provoke negative affectivity (e.g., “How often do you stay away from school because if you go, you will feel sad or depressed?”), II. Escape from aversive social and/or evaluative situations (e.g., “If it were easier for you to make new friends, would it be easier for you to go to school?”), III. Pursuit of attention from significant others (e.g., “How much would you rather be taught by your parents at home than by your teacher at school?”), and IV. Pursuit of tangible reinforcement outside of school (e.g., “How often do you refuse to go to school because you want to have fun outside of school?”) (Kearney, 2002). In this study, the Spanish version of the SRAS-R developed by Gonzálvez et al. (2016) was used and the internal consistency was estimated by the Cronbach’s alpha coefficient. Optimal values were obtained in this study for each of the factors: 0.81 (Factor I), 0.80 (Factor II), 0.80 (Factor III), and 0.70 (Factor IV).
Aggression Questionnaire (AQ) (Buss and Perry, 1992). The AQ is a self-reporting measure consisting of 29 items that assess four components of aggression: I. Physical Aggression (nine items, e.g., “Given enough provocation, I may hit another person”), II. Verbal Aggression (five items, e.g., “I can’t help getting into arguments when people disagree with me”), III. Anger (seven items, e.g., “Sometimes I feel like a powder keg ready to explode”), and IV. Hostility (eight items, e.g., “When people are especially nice to me, I wonder what they want”). A five-point Likert scale was used for response to each item (1 = extremely uncharacteristic of me; 5 = extremely characteristic of me). In this study, the Spanish version of the AQ developed by Santisteban and Alvarado (2009) was used and acceptable reliability values estimated by Cronbach’s alpha were found for this instrument: 0.80 (Physical Aggression), 0.76 (Verbal Aggression), 0.71 (Anger), and 0.72 (Hostility).
Procedure
First, an interview was conducted with the school management teams and informative letters were sent to all of the families, requesting their written informed consent for participation of the children. Once authorization was received, students anonymously and voluntarily completed the questionnaires. The measures were completed during school hours, in a 30-min session in which they were given all the pertinent instructions. In all of the sessions, at least one researcher was present, in addition to the classroom teacher. Finally, the members of the educational community were thanked for their collaboration. The Ethics Committee of the University of Alicante (code of ethics: UA-2017-09-05) approved the study and the standards established by the Declaration of Helsinki (Rickham, 1964) were followed.
Statistical Analysis
To determine the differences between students with high aggression (scores equal to or higher than the 75th percentile) and low aggression (scores equal to and lower than the 25th percentile) on the mean scores on school refusal, the Student’s t-test was applied. In addition, the size of the differences was calculated using Cohen’s d (standardized difference between means) (Cohen, 1988). The d index was interpreted as follows: small size (0.20 ≤ d ≤ 0.50), medium size (0.51 ≤ d ≤ 0.79), and large size (d ≥ 0.80). The predictive capacity of school refusal on high scores on aggression was analyzed using the binary logistic regression method, with the forward stepwise procedure, in accordance with the Wald test. This predictive capacity was estimated using the OR (odds ratio). All of the analyses were carried out using the SPSS statistics program, version 25.0.
Results
Mean Differences
The differences found between the student groups with high and low scores on Physical Aggression, based on the type of school refusal behavior, are presented in Table 2. Results show that students having high scores on Physical Aggression obtained a higher mean score on school refusal behavior, with statistically significant differences for the first two factors of the SRAS-R (I. Avoidance of negative affectivity, II. Escape from aversive social and/or evaluative situations) and the fourth factor (IV. Pursuit tangible reinforcement outside of school). The size of the differences was found to be small for Factor II (d = 0.21) and Factor IV (d = 0.25), while it was medium for Factor I (d = 0.51).
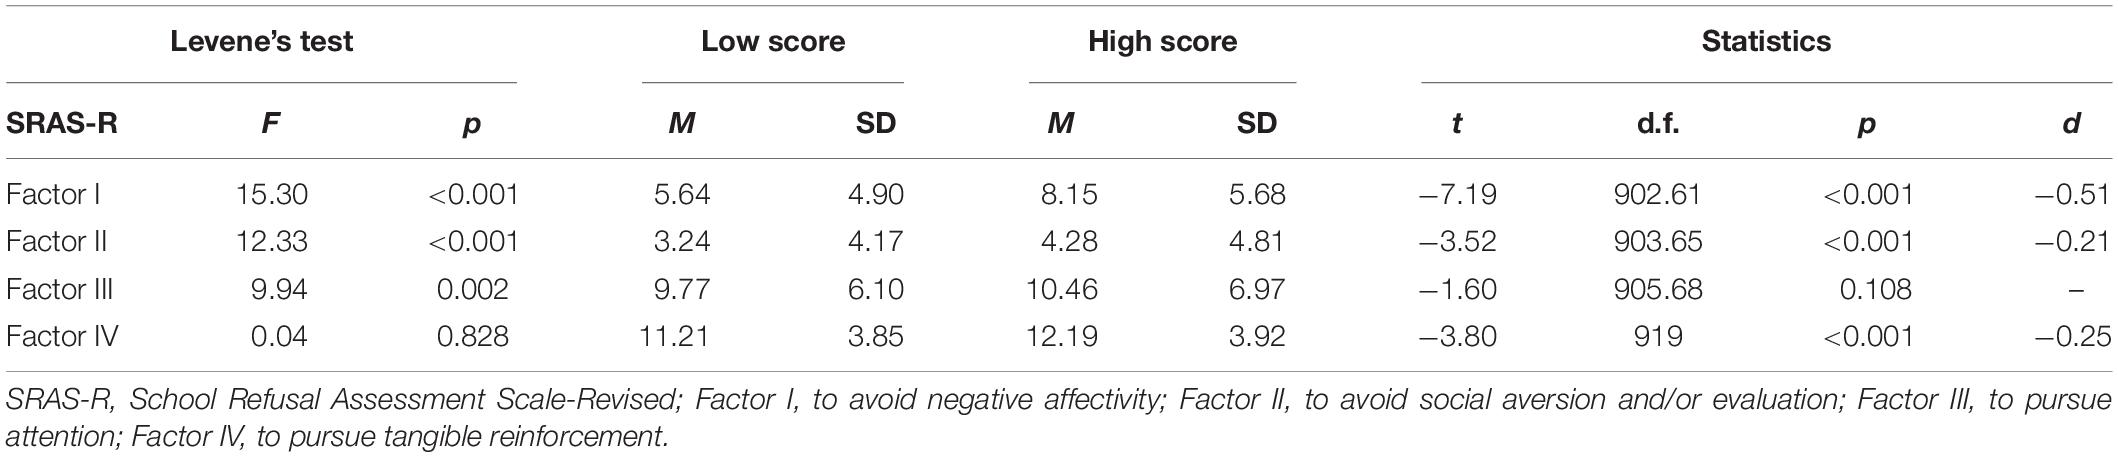
Table 2. Differences in school refusal behavior in students with high and low scores on Physical Aggression.
Differences found between the groups of students having high and low scores on Verbal Aggression, based on the type of school refusal behavior, are presented in Table 3. Results show that students having high scores on Verbal Aggression obtained a higher mean score on school refusal behavior, with statistically significant differences for all of the factors of SRAS-R (I. Avoidance of negative affectivity; II. Escape from aversive social and/or evaluative situations; III. Pursuit of attention from significant others; and IV. Pursuit tangible reinforcement outside of school). The size of the differences found was small for Factor II (d = 0.33), Factor III (d = 0.16), and Factor IV (d = 0.24), while it was medium for Factor I (d = 0.54).

Table 3. Differences in school refusal behavior in students with high and low scores on Verbal Aggression.
Differences found between the groups of students having high and low scores on Anger, based on the type of school refusal behavior, are presented in Table 4. Results show that students having high scores on Anger obtained a higher mean score on school refusal behavior, with statistically significant differences for all of the factors of SRAS-R (I. Avoidance of negative affectivity, II. Escape from aversive social and/or evaluative situations, III. Pursuit of attention from significant others, and IV. Pursuit tangible reinforcement outside of school). The size of the differences found was small for Factor III (d = 0.15) and Factor IV (d = 0.14), while it was medium for Factor I (d = 0.66) and Factor II (d = 0.50).
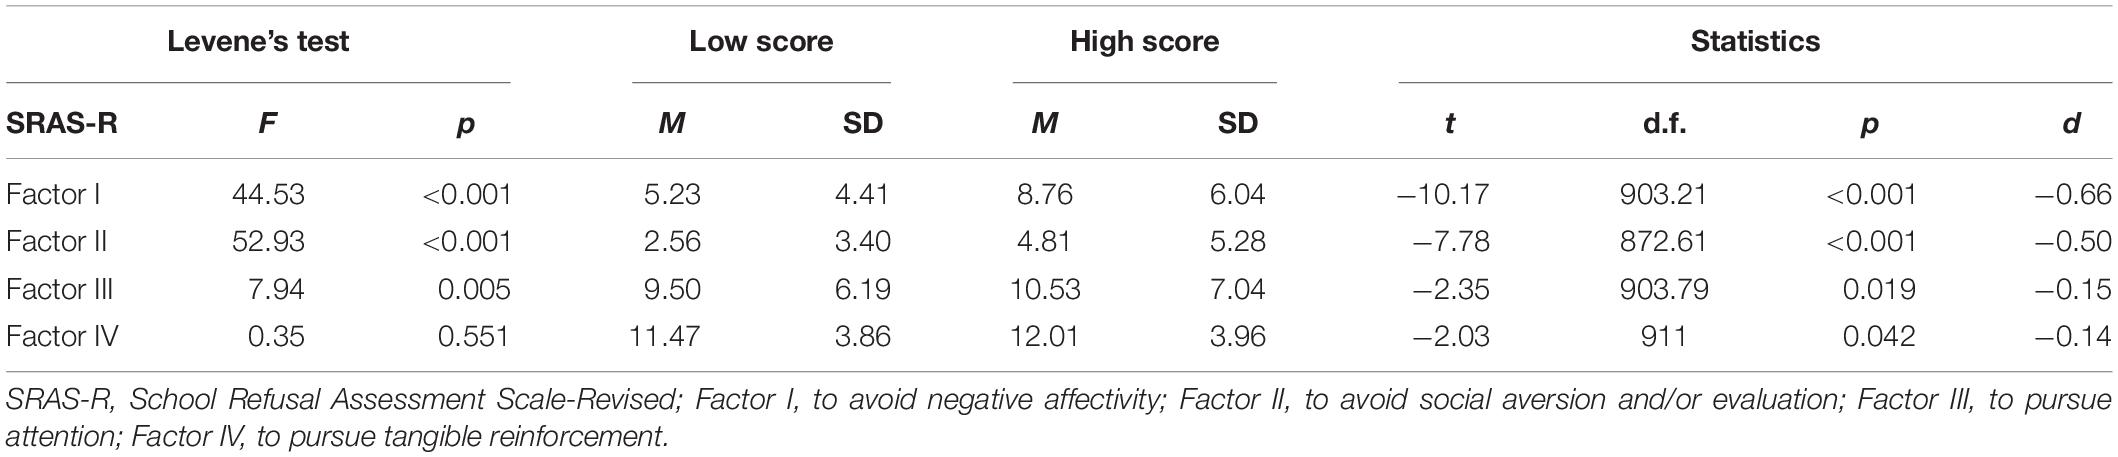
Table 4. Differences in school refusal behavior in students with high and low scores on Anger.
Differences found between the groups of students having high and low scores on Hostility, based on the type of school refusal behavior, are presented in Table 5. Results show that students having high scores on Hostility obtained a higher mean score on school refusal behavior, with statistically significant differences for all of the factors of SRAS-R (I. Avoidance of negative affectivity, II. Escape from aversive social and/or evaluative situations, III. Pursuit of attention from significant others, and IV. Pursuit tangible reinforcement outside of school). The size of the differences found was small for Factors III (d = 0.40) and IV (d = 0.16), medium for Factor II (d = 0.71), and large for Factor I (d = 0.84).
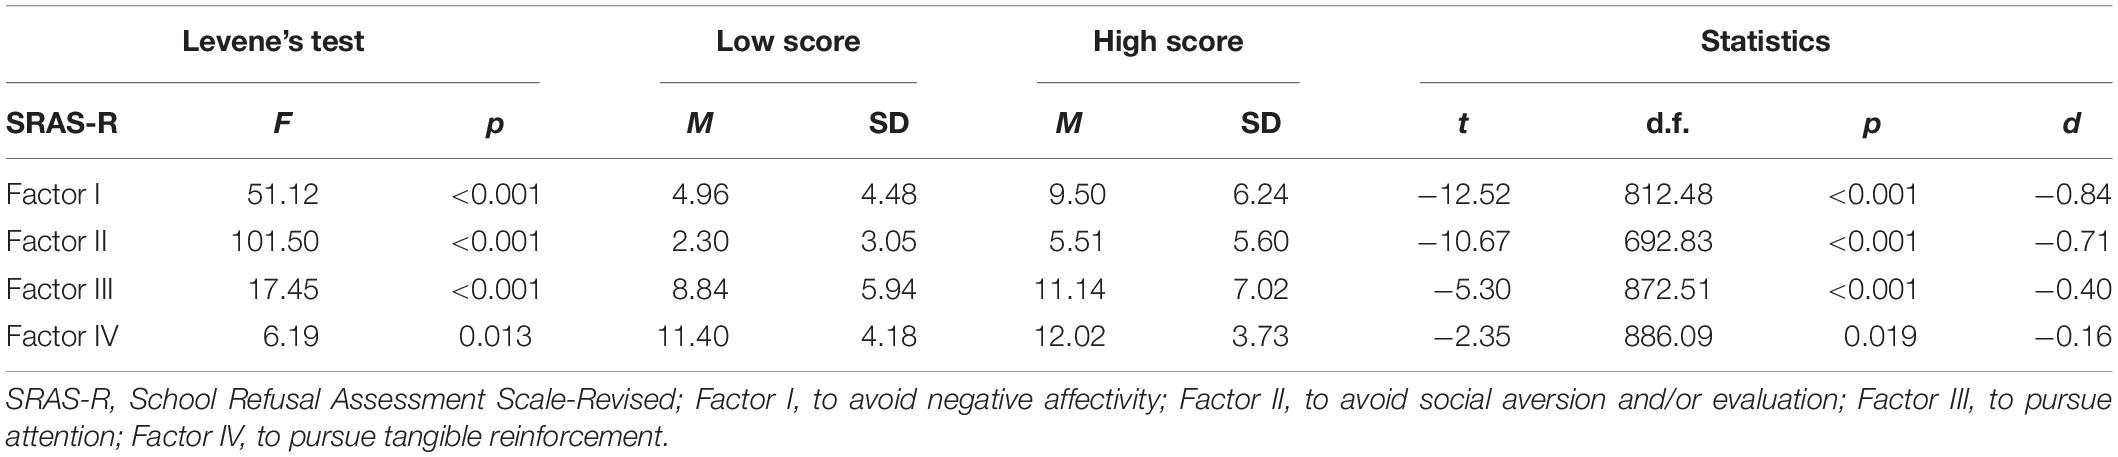
Table 5. Differences in school refusal behavior in students with high and low scores on Hostility.
Predictive Capacity of School Refusal on Aggression
Table 6 provides the results of the logistic regression analysis for the probability of receiving high scores on Physical Aggression based on the type of school refusal. The proportion of correctly classified cases ranged from 55.4% of the cases (χ2 = 14.38; p = 0.001) for the second factor and 61.2% of the cases (χ2 = 50.93; p ≤ 0.001) for the first factor of the SRAS-R. The values of the OR were higher than 1 for the school refusal models, with the probability of having high Physical Aggression being 1.10 (Factor I), 1.05 (Factor II), and 1.06 (Factor IV) times greater for each point that the scores increased, respectively, on the cited school refusal dimensions.
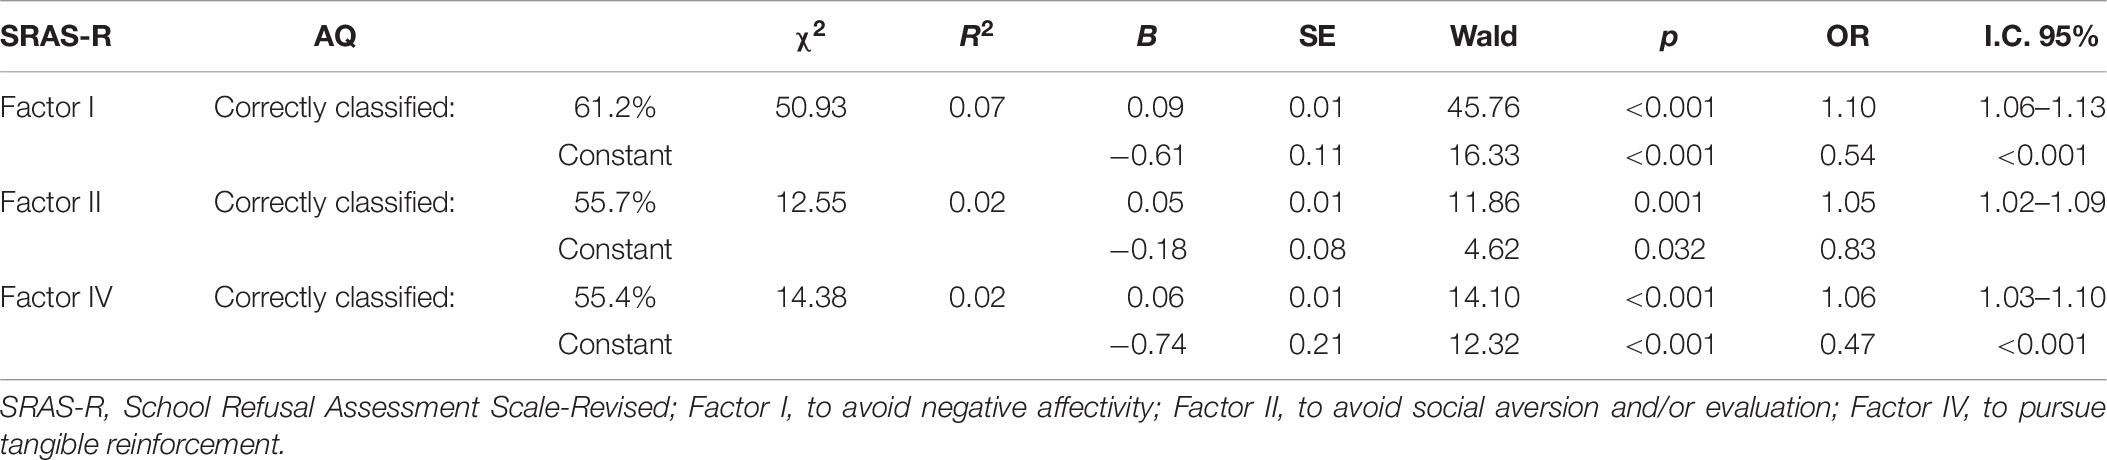
Table 6. Logistic regression model for the probability of presenting high Physical Aggression based on the school refusal behavior.
Table 7 offers the results of the logistic regression analysis for the probability of receiving high scores on Verbal Aggression based on the type of school refusal. The proportion of correctly classified cases ranged from 56.1% of the cases (χ2 = 5.616; p = 0.019) for the third factor and 64.2% of the cases (χ2 = 63.77; p ≤ 0.001) for the first factor of the SRAS-R. The values of the OR were higher than 1 for the school refusal models, with the probability of having high Verbal Aggression being 1.11 (Factor I), 1.08 (Factor II), 1.02 (Factor III), and 1.06 (Factor IV) times greater for each point that the scores increased, respectively, on the cited school refusal dimensions.
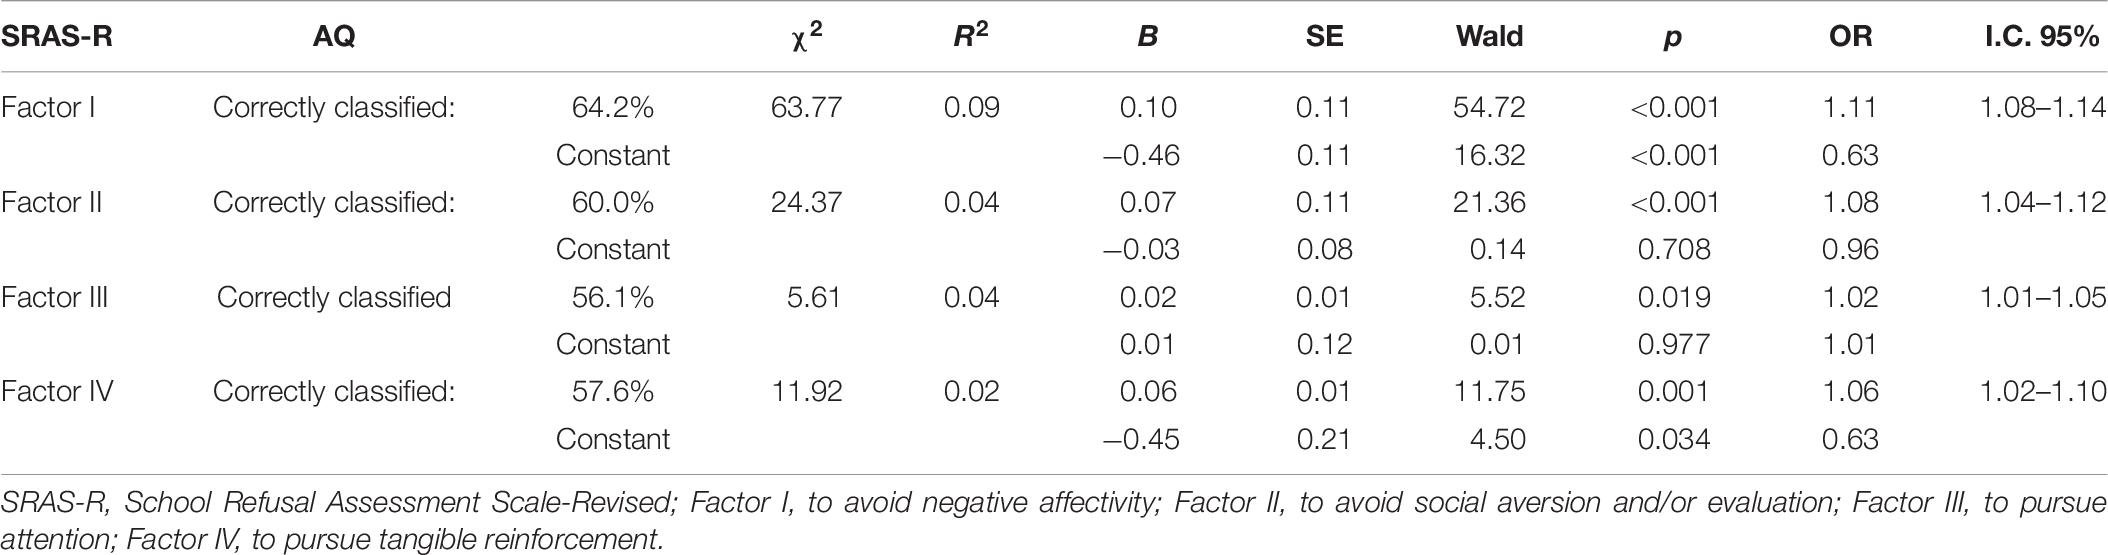
Table 7. Logistic regression model for the probability of presenting high Verbal Aggression based on the school refusal behavior.
Table 8 offers the results of the logistic regression analysis for the probability of receiving high scores on Anger based on the type of school refusal. The proportion of correctly classified cases ranged from 54.3% of the cases (χ2 = 4.13; p = 0.042) for the fourth factor and 64.1% of the cases (χ2 = 95.90; p ≤ 0.001) for the first factor of the SRAS-R. The values of the OR were higher than 1 for the school refusal models, with the probability of having high scores on Anger being 1.13 (Factor I), 1.13 (Factor II), 1.02 (Factor III), and 1.04 (Factor IV) times greater for each point that the scores increased, respectively, on the cited school refusal dimensions.
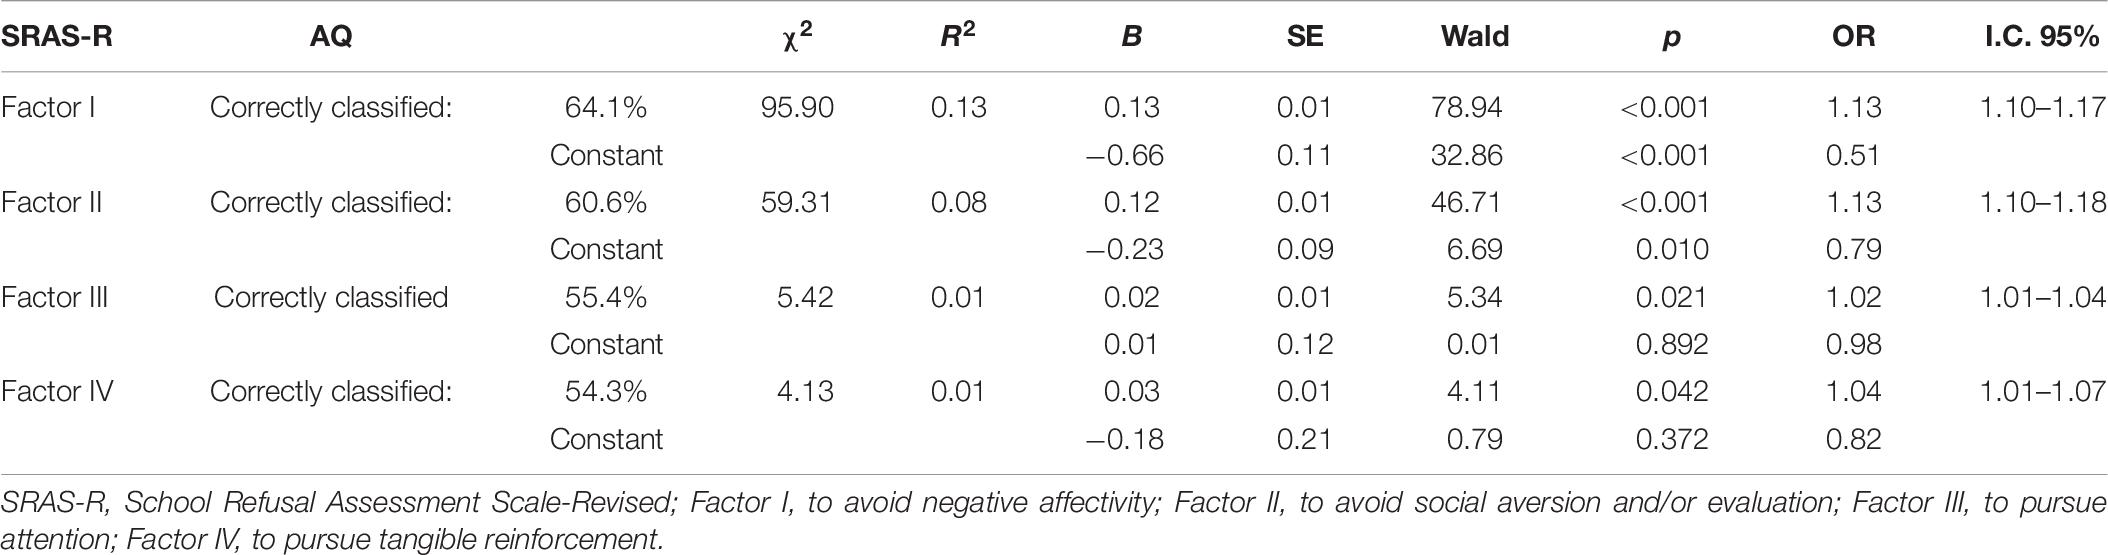
Table 8. Logistic regression model for the probability of presenting high Anger based on the school refusal behavior.
Table 9 offers the results of the logistic regression analysis for the probability of receiving high scores on Hostility based on the type of school refusal. The proportion of correctly classified cases ranged from 52.7% of the cases (χ2 = 5.55; p = 0.019) for the fourth factor and 67.6% of the cases (χ2 = 148.4; p ≤ 0.001) for the first factor of the SRAS-R. The values of the OR were higher than 1 for the school refusal models, with the probability of having high scores on Hostility being 1.17 (Factor I), 1.21 (Factor II), 1.05 (Factor III), and 1.04 (Factor IV) times greater for each point that the scores increased, respectively, on the cited school refusal dimensions.
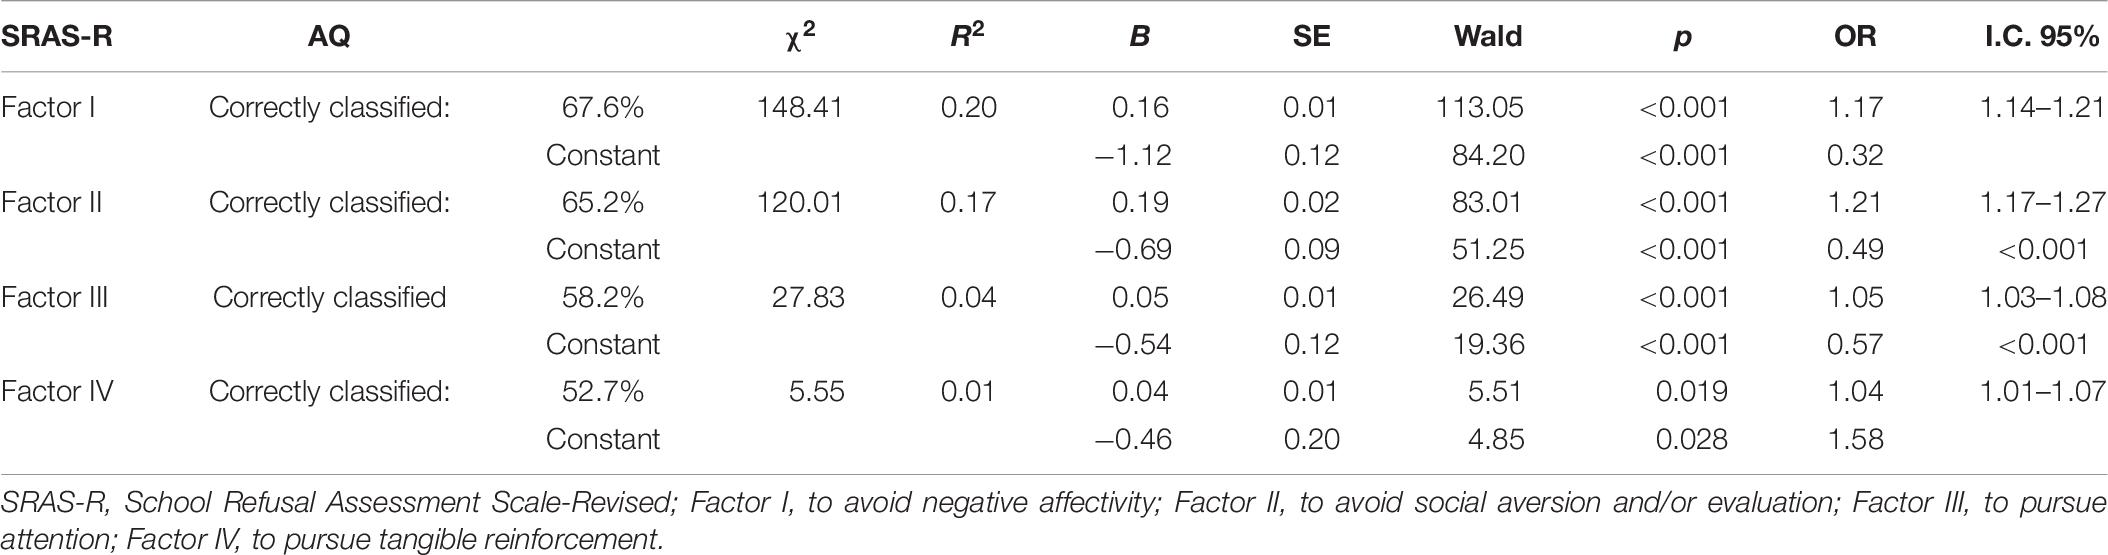
Table 9. Logistic regression model for the probability of presenting high Hostility based on the school refusal behavior.
Discussion
The purpose of this study was to examine the predictive relationships between school refusal behavior and aggression in Spanish adolescents aged 13–17. To achieve this objective, first, the differences in mean scores on school refusal behavior based on the high and low scores on Physical Aggression, Verbal Aggression, Anger, and Hostility were compared. Then, the predictive capacity of school refusal behavior on high scores on aggression was analyzed.
Given that school refusal behavior has been associated with aggressive and criminal attitudes (Heyne and Sauter, 2013), these findings reinforce the idea of an association between these issues. In this work, students with high scores on the distinct types of aggression, in general, were found to have statistically significant higher scores on the four types of school refusal behavior, thereby confirming Hypothesis 1. It should be noted that, until now, most studies analyzing the comorbidity between school refusal behavior from a functional approach and externalizing behavior problems had associated it with the fourth factor of the SRAS-R (Kearney and Albano, 2004). This could be explained by the fact that the fourth factor is not related to an attitude of school refusal based on anxiety or fears associated to the educational contexts (Kearney, 2008; Gonzálvez et al., 2018). The results of this study, however, are novel, given that upon analyzing the specific manifestation of aggression, differentiating between four distinct dimensions (Physical, Verbal, Anger, and Hostility), not only did those students that based their school refusal on the fourth factor receive higher scores, but the other causes of refusal behavior were also associated with aggressive behavior. This may be due to the fact students with high scores on school refusal, based on the first three SRAS-R factors, have also been associated with internalizing behaviors. In other words, they display manifestations of anxious and depressive behavior (Evren et al., 2015; Finning et al., 2019; Knollmann et al., 2019; Lawrence et al., 2019; Fornander and Kearney, 2020). These behaviors, characterized by a low emotional control, may lead to the manifestation of aggressive behavior as a means of escape (Henry et al., 2012; Bucur et al., 2020; Fernández-Sogorb et al., 2020). According to Law et al. (2011), how an individual behaves in the face of distinct situations may have repercussions on the manifestation of emotions such as anger or aggression, thus increasing the risk of impulsive or aggressive behavior that may lead to school refusal (Shaikh et al., 2019). Therefore, emotionally vulnerable students could react with aggressive-based responses to cope with stressful school situations (Torregrosa et al., 2020). As for the predictive analysis, the results confirm Hypothesis 2, with school refusal acting as a positive and statistically significant predictor of aggression. The relationship between both variables suggests that, in most cases, the distinct causes of school refusal act as predictors of high aggression scores. These results coincide with those of Aparicio-Flores et al. (2020), who considered a Spanish early childhood-aged sample and found a positive predictive relationship between school refusal and high levels of aggressive behavior.
Despite the contributions of this study, certain limitations should also be considered. First, the limited number of documents found on the subject prevented a contrast of the results for distinct samples. Therefore, future studies should examine the relationship between these two variables in order to offer greater validity and consistency to these study results. Due to the cross-sectional nature of the study design, causal inferences cannot be made, and it is impossible to generalize the findings to other ages and cultures. It would be interesting to examine this relationship in samples from other countries and in an early childhood-aged sample, given the importance of early intervention to reduce subsequent absenteeism and school dropout during adolescence (Escobar et al., 2016; Gonzálvez et al., 2018), and longitudinal studies would be useful to establish causal relationships between the analyzed variables. Although our findings are with adolescents, aggressive behavior can be developed from an early age (Hay, 2017). According to previous studies, while physical aggression decreases from childhood to adolescence, social aggression increases (Kikas et al., 2009). Finally, collecting information about school attendance records and using additional sources of data (student performance, parents’, and teachers’ views) should be considered in future studies.
Conclusion
To conclude, despite the previously mentioned limitations, this study reinforces the relationship existing between two problems affecting our current education system: aggressive behavior and school attendance problems. A significant relationship was revealed to exist between both variables. Future studies should consider the need to design and offer educational strategies with specific intervention and prevention measures for use by schools and education specialists (Bucur et al., 2020). Preventive interventions could be focused on improving the affective levels of all students, especially the most emotionally vulnerable, which would be positively reflected in the development and happiness of the students due to the relationship found between the school refusal behavior, affectivity, and aggression (Sanmartín et al., 2018; Vicent et al., 2018). Designing these proposals, the different reasons for school refusal must be taken into account in order to offer a more adjusted intervention. In most cases, school refusal behavior was found to be a positive and statistically significant predictor of aggression. However, special attention should be given to those students who base their school refusal by negative reinforcement (Factors I and II) due to its higher prediction scores.
Data Availability Statement
The raw data supporting the conclusions of this article will be made available by the authors, without undue reservation.
Ethics Statement
The studies involving human participants were reviewed and approved by the Ethics Committee of the University of Alicante (UA-2017-09-05). Written informed consent to participate in this study was provided by the participants’ legal guardian/next of kin.
Author Contributions
CG and MM: conceptualization and writing—original draft preparation. RS and MV: methodology and formal analysis. CG, MM, and MV: investigation. RS: writing—review and editing. All authors contributed equally to the research design, data analysis, and revision, and approved the final manuscript.
Funding
This research was funded by the Ministry of Science, Innovation and Universities and Fondos FEDER with the grant number RTI2018-098197-B-I00 awarded to José M. García-Fernández and the Project GV/2019/075 awarded to CG.
Conflict of Interest
The authors declare that the research was conducted in the absence of any commercial or financial relationships that could be construed as a potential conflict of interest.
References
Agreda, M., and Hinojo, M. A. (2015). “El absentismo: un problema educativo más allá de la escuela,” in Libro de actas del I Seminario Estatal de Interculturalidad, comunidad y escuela. La educación, un mar de colores, eds J. J. Leiva and Y. E. Almenta (Málaga: SICOE).
Aparicio-Flores, M. P., López-Gallardo, C., Gonzálvez, C., Pérez-García, A., Granados, L., and García-Fernández, J. M. (2020). Agresividad y comportamiento de rechazo a la escuela en niños. Espacios 41, 272–286.
Buckley, L., Chapman, R., and Sheehan, M. (2012). Adolescent involvement in anti-social and delinquent behaviours: predicting future injury risk. Accid. Anal. Prev. 48, 518–522. doi: 10.1016/j.aap.2012.02.010
Bucur, A., Ursoniu, S., Caraion-Buzdea, C., Ciubanu, V., Floresco, S., and Vladescu, C. (2020). Aggresive behaviours among 15-16-years-old romain high school students: results from two consecutives surveys related to alcohol and other drug use at the european level. Int. J. Environ. Res. Public Health 17:3670. doi: 10.3390/ijerph17103670
Buss, A. H. Y., and Perry, M. (1992). The aggression questionnaire. J. Pers. Soc. Psychol. 63, 452–459. doi: 10.1037//0022-3514.63.3.452
Cardwell, S. M., Mazerolle, L., and Piquero, A. R. (2019). Truancy intervention and violent offending: evidence from a randomized controlled trial. Aggress. Violent Behav. 49:101308. doi: 10.1016/j.avb.2019.07.003
Cohen, J. (1988). Statistical Power Analysis for the Behavioral Sciences. New York, NY: Academic Press.
Cupaioli, F. A., Zucca, F. A., Caporale, C., Cinzia, L., Klaus, P., Passamonti, L., et al. (2019). The neurobiology of human aggressive behavior: neuroimaging, genetic, and neurochemical aspects. Prog. Neuropsychopharmacol. Biol. Psychiatry 106:110059. doi: 10.1016/j.pnpbp.2020.110059
DECRETO (2018). Decreto 104/2008, de 27 de Julio, del Consell, por el que se Desarrollan los Principios de Equidad y de Inclusión en el Sistema Educativo Valenciano. Valencia: Conselleria d’Educació, Investigació, Cultura i Esport.
Donat, M., Gallschütz, C., and Dalbert, C. (2018). The relation between students’ justice experiences and their school refusal behavior. Soc. Psychol. Educ. 21, 447–475. doi: 10.1007/s11218-017-9423-9
Echevarría, A., and López-Zafra, E. (2011). Pigmalion >sigue vivo? Inteligencia emocional y la percepcion del profesorado de alumnos de E.S.O. Bol. Psicol. 102, 7–22.
Escobar, J. V., González, M. N., and Manco, S. A. (2016). Mirada pedagógica a la concepción de infancia y prácticas de crianza como alternativa para refundar la educación infantil. Rev. Virtual Universidad Católica del Norte 47, 64–81.
Evren, C., Bozkurt, M., Demirci, A. C., Evren, B., Can, Y., and Umut, G. (2015). Gender differences according to psychological and behavioral variables among 10th grade students in Istanbul. Anadolu Psikiyatri Derg. 16, 77–84. doi: 10.5455/apd.160603
Fernández-Batanero, J. M. (2011). Abandono escolar y prácticas educativas inclusivas. Revista Latinoamericana de Educación Inclusiva 5, 43–58.
Fernández-Sogorb, A., Sanmartín, R., Vicent, M., and García-Fernández, J. M. (2020). Latent profiles of anxious children and their differences in aggressive behavior. Sustainability 12:6199. doi: 10.3390/su12156199
Filippello, P., Buzzai, C., Costa, S., and Sorrenti, L. (2019). School refusal and absenteeism: perception of teacher behaviors, psychological basic needs, and academic achievement. Front. Psychol. 10:1471. doi: 10.3389/fpsyg.2019.01471
Finning, K., Ford, T., Moore, D. A., and Ukoumunne, O. (2019). Emotional disorder and absence from school: findings from the 2004 British Child and Adolescent Mental Health Survey. Eur. Child Adolesc. Psychiatry 29, 187–198. doi: 10.1007/s00787-019-01342-4
Fornander, M. J., and Kearney, C. A. (2020). Internalizing symptoms as predictors of school absenteeism severity at multiple levels: ensemble and classification and regression tree analysis. Front. Psychol. 10:3079. doi: 10.3389/fpsyg.2019.03079
García, E. E., Cruzata-Martínez, A., Bellido, R. S., and Rejas, L. G. (2020). Decrease in aggressiveness in elementary students: the “Strengthening” program. Propósitos y Representaciones 8:e559. doi: 10.20511/pyr2020.v8n2.559
Gonzálvez, C., and Inglés, C. J. (2019). Avances actuales en el rechazo escolar y otros problemas de asistencia: una perspectiva internacional. Introducción al monográfico. Eur. J. Educ. Psychol. 12, 11–15. doi: 10.30552/ejep.v12i1.237
Gonzálvez, C., Sanmartín, R., Gómez-Núñez, M. I., Aparicio, P., and Vicent, M. (2018). El afecto positivo como factor protector del comportamiento de rechazo a la escuela. Estud. Pedagógicos XLIV 3, 89–99. doi: 10.4067/s0718-07052018000300089
Gonzálvez, C., Inglés, C. J., Kearney, C. A., Vicent, M., Sanmartín, R. Y., and García-Fernández, J. M. (2016). School refusal assessment scale-revised: factorial invariance and latent means differences across gender and age in Spanish children. Front. Psychol. 7:2011. doi: 10.3389/fpsyg.2016.02011
Havik, T., Bru, E., and Ertesvåg, S. K. (2014). Parental perspectives of the role of school factors in school refusal. Emot. Behav. Diffic. 19, 131–153. doi: 10.1080/13632752.2013.816199
Hay, D. F. (2017). The early development of human aggression. Child Dev. Perspect. 11, 102–106. doi: 10.1111/cdep.12220
Henry, D. B., Tolan, P. H., Gorman-Smith, D., and Schoeny, M. E. (2012). Risk and direct protective factors for youth violence. results from the centers for disease control and prevention’s multisite violence prevention project. Am. J. Prev. Med. 43, 67–75. doi: 10.1016/j.amepre.2012.04.025
Heyne, D., Gren-Landell, M., Melvin, G., and Gentle-Genitty, C. (2019). Differentiation between school attendance problems: why and how? Cogn. Behav. Pract. 26, 8–34. doi: 10.1016/j.cbpra.2018.03.006
Heyne, D., and Sauter, F. M. (2013). “School refusal,” in The Wiley-Blackwell Handbook of the Treatment of Childhood and Adolescent Anxiety, eds C. A. Essau and T. H. Ollendick (Chichester: John Wiley & Sons, Ltd), 471–517. doi: 10.1002/9781118315088
Ingul, J. M., Havik, T., and Heyne, D. (2019). Emerging school refusal: a school-based framework for identifying early signs and risk factors. Cogn. Behav.Pract. 26, 46–62. doi: 10.1016/j.cbpra.2018.03.005
Kearney, C. A. (2002). Identifying the function of school refusal behavior: a revision of the school refusal assessment scale. J. Psychopathol. Behav. Assess. 24, 235–245. doi: 10.1023/A:1020774932043
Kearney, C. A. (2008). An interdisciplinary model of school absenteeism in youth to inform professional practice and públic policy. Educ. Psychol. Rev. 20, 257–282. doi: 10.1007/s10648-008-9078-3
Kearney, C. A., and Albano, A. M. (2004). The functional profiles of school refusual behavior: diagnostic aspects. Behav. Modif. 28, 147–161. doi: 10.1177/0145445503259263
Kearney, C. A., Gonzálvez, C., Graczyk, P. A., and Fornander, M. J. (2019). Reconciling contemporary approaches to school attendance and school absenteeism: toward the promotion and nimble response, global policy review and implementation, and future adaptability (Part 1). Front. Psychol. 10:2222. doi: 10.3389/fpsyg.2019.02222
Kikas, E., Peets, K., Tropp, K., and Hinn, M. (2009). Associations between verbal reasoning, normative beliefs about aggression, and different forms of aggression. J. Res. Adolesc. 19, 137–149. doi: 10.1111/j.1532-7795.2009.00586.x
Knollmann, M., Reissner, V., and Hebebran, J. (2019). Towards a comprehensive assessment of school absenteeism: development and initial validation of the inventory of school attendance problems. Eur. Child Adolesc. Psychiatry 28, 399–414. doi: 10.1007/s00787-018-1204-2
Law, K. C., Rogers, M. L., Tucker, R. P., Bawer, B. W., Capron, D. W., Anestis, M. D., et al. (2011). Rumination in the context of anger and sadness: diferential effects on state agitation. J. Affect. Disord. 280, 89–96. doi: 10.1016/j.jad.2020.11.071
Lawrence, D., Dawnson, V., Houghton, S., Goodsell, B., and Sawyer, M. G. (2019). Impact of mental disorders on attendance at school. Aust. J. Educ. 63, 5–21. doi: 10.1177/0004944118823576
Martínez González, R. A., and Álvarez Blanco, L. (2005). Fracaso y abandono escolar en Educación Secundaria Obligatoria: implicación de la familia y los centros escolares. Aula Abierta 85, 127–146.
United Nations (2017). El Acoso y la Violencia Escolar Afecta a Uno de Cada Cuatro Niños. Washington, DC: Oficina Regional para las Américas de la Organización Mundial de la Salud.
Pehlivan, Z. (2011). Absenteeism at state high schools and related school management policies in Turkey. Procedia Soc. Behav. Sci. 15, 3121–3126. doi: 10.1016/j.sbspro.2011.04.257
Peltzer, K., and Pengpid, S. (2017). Prevalence and correlates of physical fighting among school going students aged 13-15 in the association of Southeast Asian Nations (ASEAN) Member States. Iran. J. Pediatr. 27:e8170. doi: 10.5812/ijp.8170
Piko, B., and Keresztes, N. (2006). Physical activity, psychosocial health and life goals among youth. J. Community Health 31, 136–145. doi: 10.1007/s10900-005-9004-2
Ramírez, J. M., and Andreu, J. M. (2003). Aggression’s typologies. Int. Rev. Soc. Psychol. 16, 125–141.
Rendón, M. (2008). Regulación de Ira, Tristeza y Norma Subjetiva en una Muestra de Escolares. Master’s thesis. Bogotá: Universidad Nacional de Colombia.
Rickham, P. P. (1964). Human Experimentation: Code of Ethics of the World Medical Association. Br. Med. J. 2:177. doi: 10.1136/bmj.2.5402.177
Rocque, M., Jennings, W. G., Piquero, A. R., Ozkan, T., and Farrington, D. P. (2017). The importance of school attendance: findings from the Cambridge study in delinquent development on the life-course effects of truancy. Crime Delinq. 63, 592–612. doi: 10.1177/0011128716660520
Sanmartín, R., Inglés, C. J., Gonzálvez, C., Vicent, M., Ruiz-Esteban, C., and García-Fernández, J. M. (2018). Impact of affective profiles on school refusal in a Spanish sample of primary education. J. Child Fam. Stud. 27, 1349–1357. doi: 10.1007/s10826-017-0962-7
Santisteban, C., and Alvarado, J. M. (2009). The aggression questionnaire for Spanish preadolescents and adolescents: AQ-PA. Span. J. Psychol. 12, 320–326. doi: 10.1017/s1138741600001712
Shaikh, M. A., Abio, A., Celedonia, K. L., and Wilson, M. L. (2019). Physical fighting among school-attending adolescents in Pakistan: associated factors and contextual influences. Environ. Res. Public Health 16:5039. doi: 10.3390/ijerph16245039
Torregrosa, M. S., Gómez-Núñez, M. I., Inglés, C. J., Ruiz-Esteban, C., Sanmartín, R., and García-Fernández, J. M. (2020). Buss and perry aggression questionnaire-short form in Spanish children. J. Psychopathol. Behav. Assess. 42, 1–16. doi: 10.1007/s10862-020-09809-4
Vaughn, M. G., Maynard, B., Salas-Wrigth, C., Perron, B. E., and Abdon, A. Y. (2014). Prevalence and correlates of truancy in the US: results from a national sample. J. Adolesc 36, 767–776. doi: 10.1016/j.adolescence.2013.03.015
Vicent, M., Inglés, C. J., Sanmartín, R., Gonzálvez, C., and García-Fernández, J. M. (2018). Aggression profiles in the Spanish child population: differences in perfectionism, school refusal and affect. Front. Behav. Neurosci. 12:12. doi: 10.3389/fnbeh.2018.00012
Keywords: school refusal behavior, physical aggression, verbal aggression, anger, hostility, adolescents
Citation: Gonzálvez C, Martín M, Vicent M and Sanmartín R (2021) School Refusal Behavior and Aggression in Spanish Adolescents. Front. Psychol. 12:669438. doi: 10.3389/fpsyg.2021.669438
Received: 18 February 2021; Accepted: 22 March 2021;
Published: 29 April 2021.
Edited by:
Cecilia María Ruiz Esteban, University of Murcia, SpainReviewed by:
Juan González Hernández, University of Granada, SpainVicente Gabarda Méndez, University of Valencia, Spain
Copyright © 2021 Gonzálvez, Martín, Vicent and Sanmartín. This is an open-access article distributed under the terms of the Creative Commons Attribution License (CC BY). The use, distribution or reproduction in other forums is permitted, provided the original author(s) and the copyright owner(s) are credited and that the original publication in this journal is cited, in accordance with accepted academic practice. No use, distribution or reproduction is permitted which does not comply with these terms.
*Correspondence: Carolina Gonzálvez, Y2Fyb2xpbmEuZ29uemFsdmV6QHVhLmVz