 Zheng Wang
 Jinjin Wang3†
- 1Soochow College, Soochow University, Suzhou, China
- 2School of Physical Education, Soochow University, Suzhou, China
- 3Department of Physical Education, Kangda College, Nanjing Medical University, Lianyungang, China
- 4School of Physical Education, Qingdao University, Qingdao, China
- 5Logistics Management Division, Soochow University, Suzhou, China
Objective: An accurate BMI classification system specific to the population is of great value in health promotion. Existing studies have shown that the BMI recommended cut-off value for adults is not suitable for college students. Thus, the current study aims to identify optimal BMI cutoff points in obesity screening for Chinese college students.
Methods: Anthropometric assessments were performed on 6,798 college students (Male = 3,408, Female = 3,390) from three universities in Jiangsu, China. Exploratory factor analysis (EFA) was conducted to establish the standardized models to estimate anthropometry for male and female students. Further indices were derived from the assessments, including body mass index (BMI), relative fat mass (RFM), obesity degree percentage (OBD%), waist-to-hip ratio (WHR), waist circumference (WC), and body fat percentage (BF%). The anthropometric index with the highest correlation to the models for male and female students were selected as the gold standard for obesity screening. Receiver operating characteristic (ROC) curve was applied to evaluate diagnostic value of each anthropometric index according to the area under curve (AUC). Youden index maximum points determined the optimal cutoff points with the highest accuracy in obesity screening.
Results: The anthropometric models for both male and female students consisted of three factors. Vervaeck index was selected as the gold standard for obesity screening. By comparing AUC of the anthropometric indices, we found BMI provided the highest value in obesity screening. Further analysis based on Youden index identified the optimal BMI of 23.53 kg/m2 for male and 23.41 kg/m2 for female. Compared with the universal standard recommended by World Health Organization (WHO), the adjusted BMI criteria were characterized by high sensitivity as well as specificity.
Conclusion: BMI is the most appropriate anthropometric index of obesity screening for Chinese college students. The optimal cutoff points were lower than the WHO reference. Evidence substantiated the adjusted BMI criteria as an effective approach to improve accuracy of obesity screening for this population.
Introduction
Obesity is ranked as the fifth leading cause of death globally, which has raised serious public health concerns (Safaei et al., 2021). Researchers estimated that, by 2025, global obesity prevalence would exceed 18% in men and 21% in women, of which 6% in men and 9% in women would be categorized as severe obesity (Collaboration, 2016). Obesity significantly increases risks of morbidity and mortality associated with cardiovascular disease (Khan et al., 2018), sleep disorder breathing (Peppard et al., 2000), diabetes, cancers (Bhaskaran et al., 2014; Hu et al., 2020), and musculoskeletal disorder (Jiang et al., 2011). Evidence has shown the close connection between quality of life and body weight management. Improved quality of life is evident after weight loss interventions in different age groups (Payne et al., 2018; Diao et al., 2020). Body mass index (BMI) is the most widely used measure to diagnose obesity and provide guidelines for weight loss and control in clinical practice (Seidell et al., 2001; Romero-Corral et al., 2008). World Health Organization (WHO) has defined the cutoff points of overweight and obesity for Asian populations as 23 and 25 kg/m2, respectively (Barba et al., 2004). To increase accuracy and generalizability of BMI classifications, an increasing number of research has examined obesity cutoff points for different populations (Rahman and Berenson, 2010; Hunma et al., 2016; Chen et al., 2018).
The collegiate period has been considered a critical time to develop lifelong healthy behaviors such as physically active lifestyle and healthy dietary patterns (Karabulut et al., 2018; Niedermeier et al., 2018; Saghafi-Asl et al., 2020). Accurate BMI classifications for college students are of great value in not only anthropometric assessment but also influence on the young generation’s behaviors in future. A recent study in Chinese college students reported that 23.5% in male and 11.9% in female were classified as either overweight or obese (Chen et al., 2020), indicating immediate attention to address the prevalent issue. The number of college students in China has been growing in the past decades and reached 44.3 million in 2022 (Ministry of Education of the People’s Republic of China, 2021). An accurate BMI standard which is specific to college students in China can make significant contributions to public health in consideration of the large population size. BMI is characterized by a number of practical advantages such as simplicity, low cost, and noninvasive measure, which make BMI an efficient screening tool for such a population size in China. However, a major concern has been noticed with respect to the precision of applying the current WHO standard to specific populations (Romero-Corral et al., 2008). Considering potential limitations of a universal BMI standard, researchers have been investigating population and ethnicity specific BMI criteria over the past decade (Hunma et al., 2016; Karabulut et al., 2018; Itani et al., 2020). The research that improves accuracy of BMI based obesity screening for Chinese college students is warranted.
The current study aims to develop an evidence-based obesity screening tool for Chinese college students. Stringent procedures were conducted to ensure robustness of the research findings. Based on a set of anthropometric measures, exploratory factor analysis (EFA) was used to establish a standardized model (z-score model) for the college students’ physique. Further analysis identified the gold standard in terms of the standardized model. The anthropometric index with the highest correlation to the z-score model was the gold standard. It is worth pointing out that the current study does not assume BMI the most appropriate measure in obesity screening. In fact, the area under the receiver operating characteristic (ROC) curve was used to identify the screening tool from available anthropometric measures. The anthropometric index with the largest area under curve (AUC) would be selected for obesity screening. Optimal cutoff points of the selected anthropometric index were calculated by the Youden index. Additionally, agreement measures of the cutoff points were assessed by Kappa index. By following the aforementioned procedures, the current study identifies the anthropometric index for obesity screening, and then determines the cutoff points of obesity.
Materials and methods
Participants
The current study was approved and supported by Jiangsu Physical Fitness and Health Promotion Center. The center is an official institution which administers annual fitness examination and evaluation for students in Jiangsu, China. Participants were recruited from three randomly selected universities in the province. Eligible participants must meet the following criteria: (i) undergraduate students aged between 18 and 22 years old, (ii) no chronic disease or functional impairment, and (iii) no mental health issues. Information on research purpose and procedures was acknowledged prior to the study. All participants provided written informed consent and voluntarily completed all the required tests. A total of 6,798 college students (Male = 3,408; Female = 3,390) agreed to participate in the study.
Anthropometric measures
Height and weight were measured by a calibrated electronic scale with the precision of 0.1 cm and 0.1 kg (HM1000-SZ, HeMei Tech Corp., China). Participants were light clothing with shoes off. Participants stood in an anatomical position in the measure of standing height. Sitting height was measured as the height from the seat of the chair in which a participant was sitting to the top of the head. Participants were asked to keep the back of the head, shoulder blades and buttocks in touch with the vertical board. The thighs of the participants were touching closely together on the sitting board, forming a right angle with the trunk (Zhang and Li, 2015).
Chest, waist, and hip circumferences were measured by a nonelastic tape with a precision of 0.1 cm. For chest circumference (CC), the tape was placed at the level of the fourth rib and set snug around the body (Trüb et al., 2020). Waist circumference (WC) was measured at the midpoint between the lower edge of the rib cage and the iliac crest after a full expiration (Shrestha et al., 2021). Hip circumference (HC) was measured at the maximum protuberance of the buttocks (Skrypnik et al., 2015). Skinfold thickness was measured by a caliper in 0.1 cm. Triceps, subscapular, and abdominal site were selected for skinfold measurement. Trained research assistants measured circumferences and skinfold thickness twice for each site, with the average used for data analysis. Anthropometric measures of the participants were summarized in Table 1.
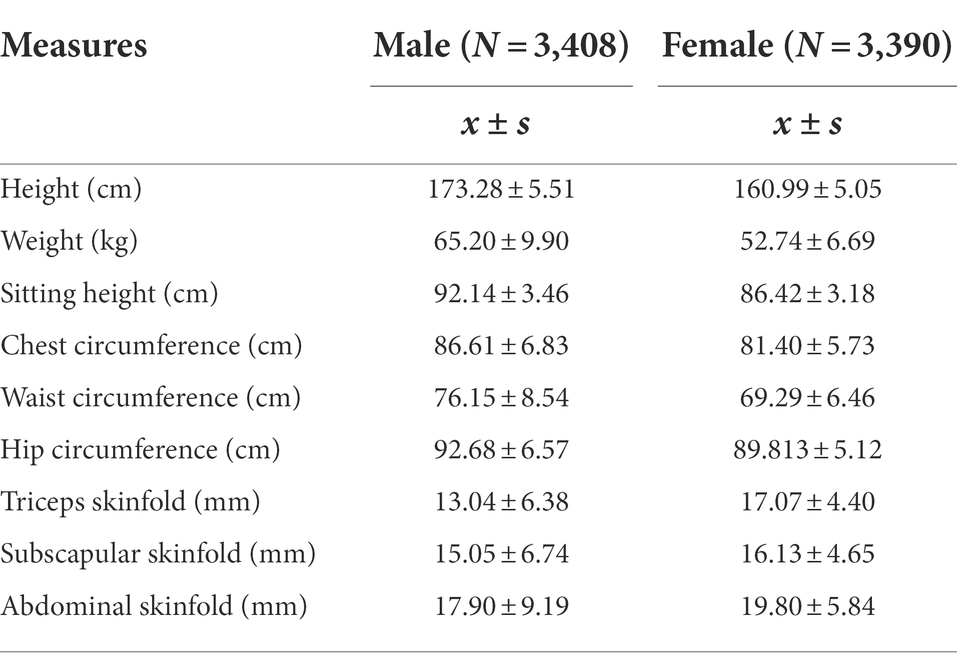
Table 1. Anthropometric measures of participants.
Anthropometric indices
Six indices were derived from the anthropometric measures to provide further insights into the physique of college students. BMI was calculated based on body weight (BW) in kilograms (kg) and height in meters (m). The WHO recommended cutoff point for obesity is above 28 kg/m2 (Barba et al., 2004). BMI calculation was presented as Equation 1.
Relative fat mass (RFM) has been proved a valid estimator of whole-body fat percentage. Based on the measurements of height and WC in meters, the cutoff points of obesity for male and female are 22.8 and 33.9, respectively (Woolcott and Bergman, 2018). RFM for male and female was calculated as follows (Equations 2-1, 2-2):
Obesity degree (OBD) was a commonly used method for obesity screening among Chinese adults. This index is a percentage based on the calculation of BW in kg and height in cm. Individuals with OBD% above 20% are classified as obesity (Zhang et al., 2017). Calculation of OBD% was presented as Equations 3-1, 3-2.
Waist to hip ratio (WHR) was calculated by WC and HC in cm (Equation 4). Males with the WHR above 0.90 and females with the ratio above 0.85 were considered obese (Liu et al., 2018).
Calculations of body fat percentage (BF%) consisted of a series of steps involving body density (BD) and skinfold (SF). SF was the sum of triceps and subscapular thickness in millimeters (Equation 5-1), which led to BD for male (Equation 5-2) and female (Equation 5-3). Based on BD for individuals, BF% was calculated by Equation 5-4. The cutoff points of obesity for both male and female were set at 25 and 30%, respectively (Barba et al., 2004).
Vervaeck index was calculated based on BW in kg, CC in cm, and height in cm (Equation 6). The index remains stable in adulthood, which makes it suitable for obesity screening among college students. The value above 94.3 was defined as obesity for Chinese (Shang et al., 2007).
Statistical analysis
EFA was used to extract key factors of the standardized anthropometric model (z-score model) for college students. Varimax orthogonal rotation was conducted to examine model fit and calculate factor loadings. The factors were identified based on eigenvalues, factor loadings, and the interpretability of the extracted factors. The gold standard for obesity screening was selected from the anthropometric indices with the highest correlation to the standardized model. The ROC curve was drawn by MedCalc 18.2. Area under curve (AUC) reflects the diagnostic value, with 0.5<AUC ≤ 0.7 for low diagnostic value, 0.7<AUC ≤ 0.9 for medium diagnostic value, and AUC>0.9 for high diagnostic value (Dou et al., 2016). The anthropometric index with the highest diagnostic value would be chosen as the tool for obesity screening. Youden index maximum points helped to identify the optimal cutoff points for obesity screening. Kappa index was used as agreement measures to testify and improve accuracy of the cutoff points in screening obesity. The significance level was set at the value of p of 0.05. All statistical analyses were conducted by SPSS 25.
Results
EFA identified three primary factors of the anthropometric model for both male and female college students. The three factors accounted for 83.61 and 78.09% of the variance in the anthropometric data for male and female, respectively. Factor 1 (z1) consisted of BW, CC, WC, and HC. Factor 2 (z2) identified three skinfold measures of triceps, subscapular, and abdominal thickness. Factor 3 (z3) included two measures of height which were standing height and sitting height. Factor loadings of the extracted anthropometric measures were above 0.7. The standardized (z-score) models for male and female students were presented as Equations 7-1, 7-2, respectively. Table 2 indicated factor loadings of the anthropometric measures for male and female students.
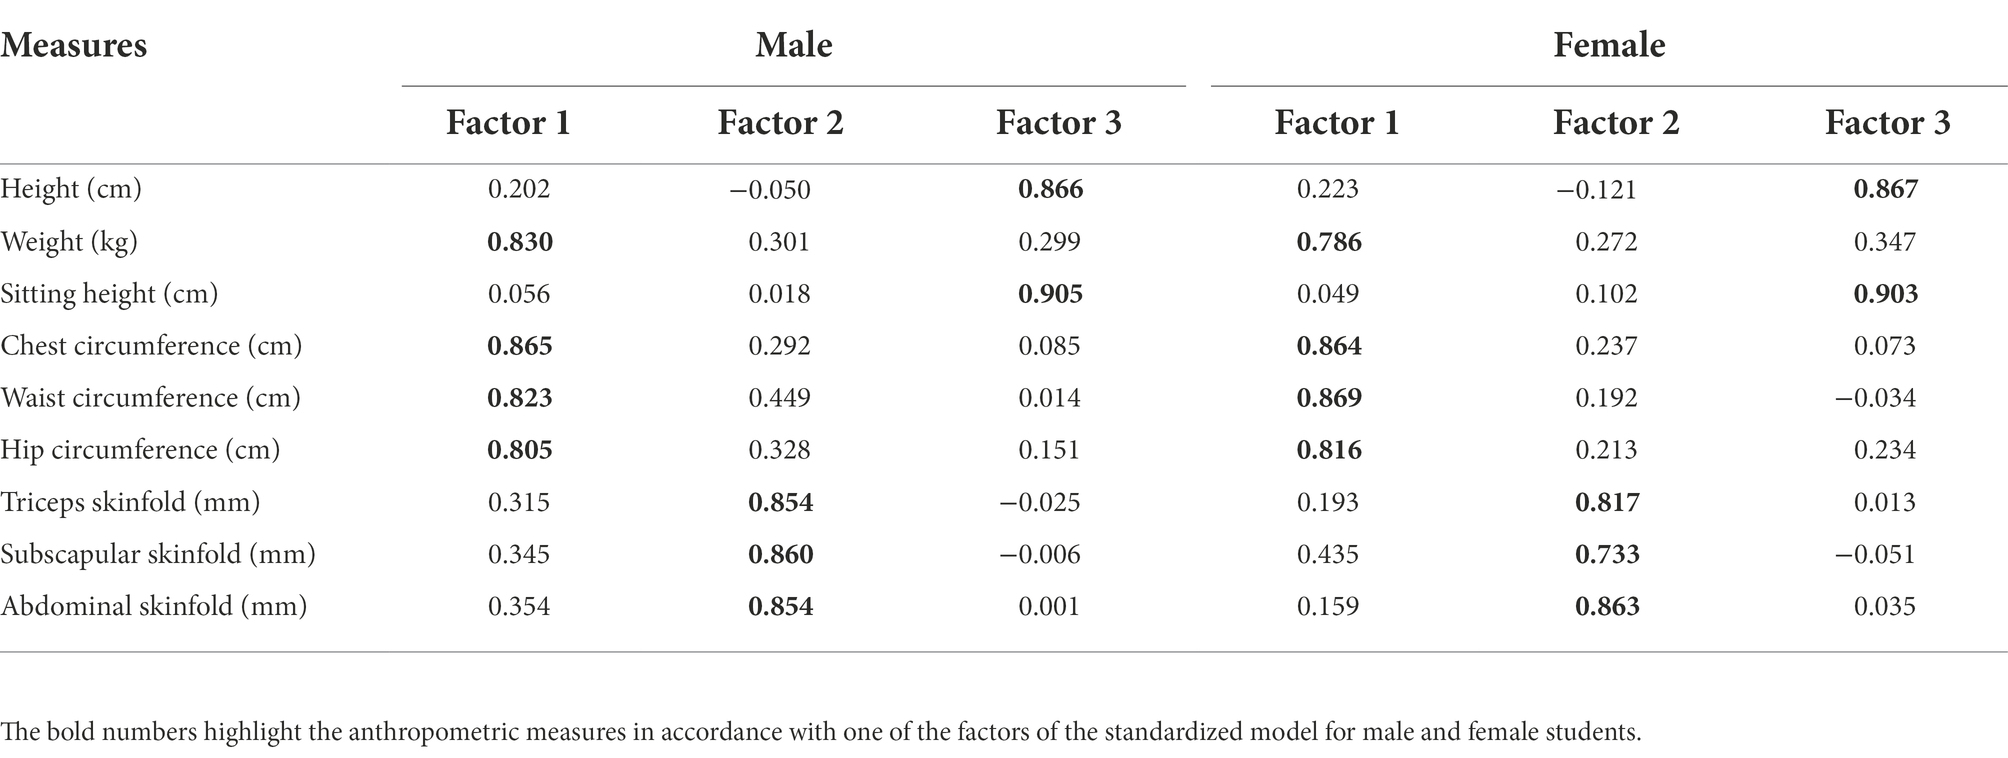
Table 2. Rotated factor loading of the anthropometric measures.
Vervaeck index was chosen as the gold standard because of the highest correlation to the z-score model. The coefficients for male and female were r = 0.847 and r = 0.817, respectively. Table 3 summarized the correlation coefficients of anthropometric indices to the z-score models.
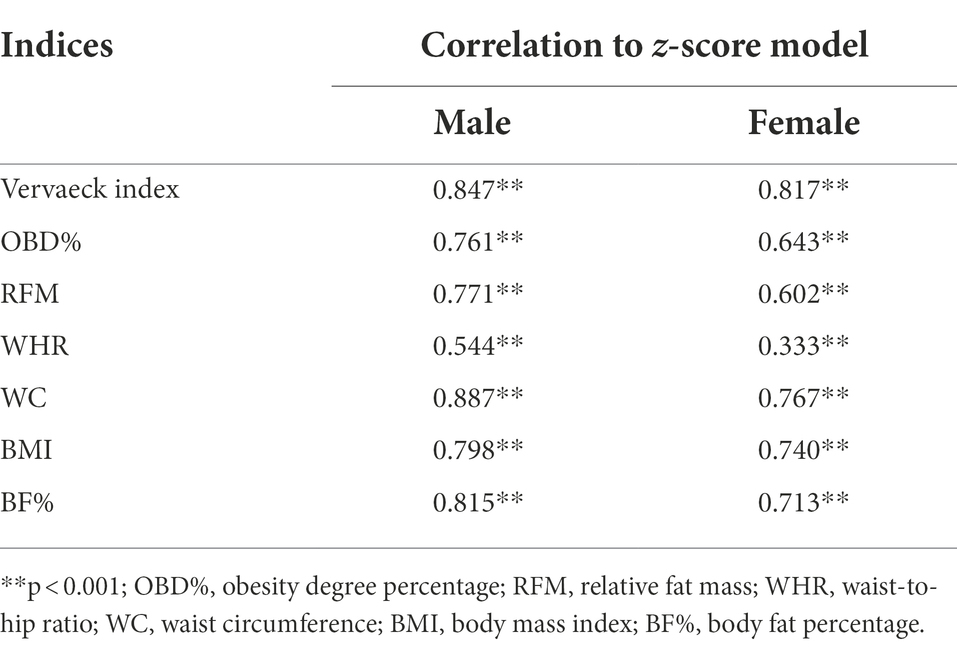
Table 3. Correlation coefficients of anthropometric indices to the z-score model.
ROC curves display the accuracy of BMI, OBD%, RFM, WC, BF%, and WHR in obesity screening for male and female students (Figure 1). With Vervaeck index as the gold standard, the mean AUC of BMI was greater than that of other factors for both male (AUC = 0.986, 95% CI: 0.981–0.990) and female students (AUC = 0.983, 95% CI: 0.979–0.988), suggesting the best accuracy of using BMI to diagnose obesity for the college students. The mean AUC of each anthropometric index was listed in Table 4.

Figure 1. ROC curves for male (left) and female (right).
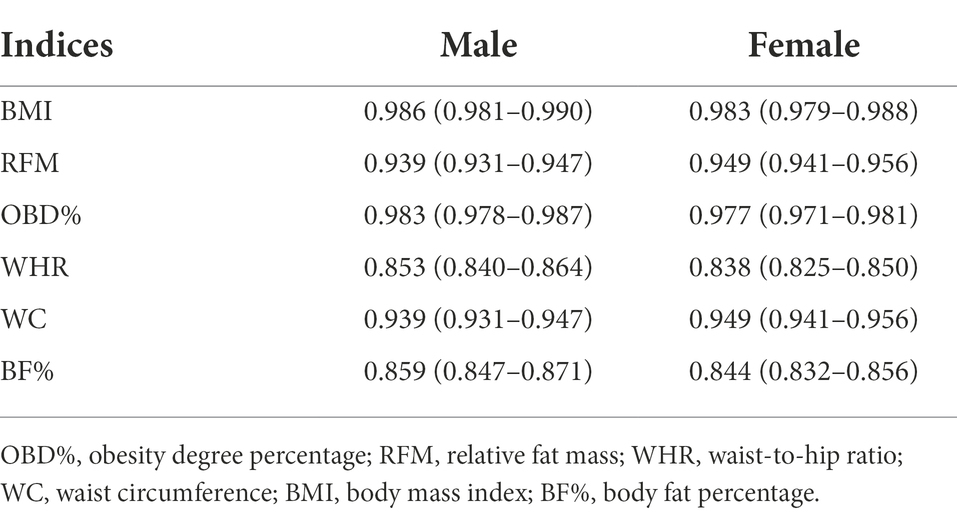
Table 4. AUC by the anthropometric indices.
The optimal cutoff points of BMI for obesity screening were determined by the maximum point of Youden index. The BMI cutoff point for male students is 23.53 kg/m2 in corresponding to the Youden index of 0.877. Compared with the WHO reference of 28 kg/m2, the optimal cutoff point shows prominent improvement in sensitivity from 19.91 to 93.77% and decline in specificity from 99.96 to 93.93% (Table 5). The Youden index for female students is 0.8726 in corresponding to the optimal BMI cutoff point of 23.41 kg/m2. Compared with the WHO reference, the adjusted value shows an increased sensitivity from 14.63 to 91.22% and a drop in specificity from 100 to 96.04%. The optimal BMI cutoff points indicate a remarkable improvement in the sensitivity associated with a high level of specificity for both male and female college students (Table 5).
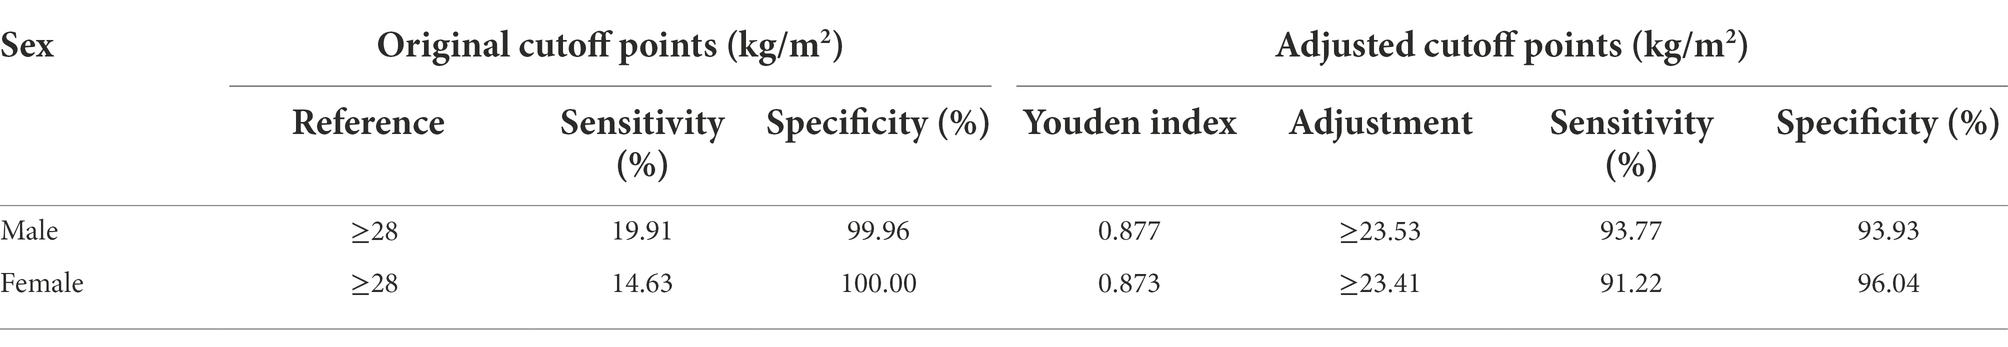
Table 5. Sensitivity and specificity of original and adjusted BMI cutoff points.
Adjusted BMI cutoff points largely increased agreement to the gold standard (Vervaeck index) for obesity screening, which was evident by significant improvement in Kappa index for male (Original cutoff point = 0.289, adjusted cutoff point = 0.817) and female students (Original cutoff point = 0.251, adjusted cutoff point = 0.697). Statistics of Kappa index associated with the adjusted BMI cutoff points were listed in Table 6.
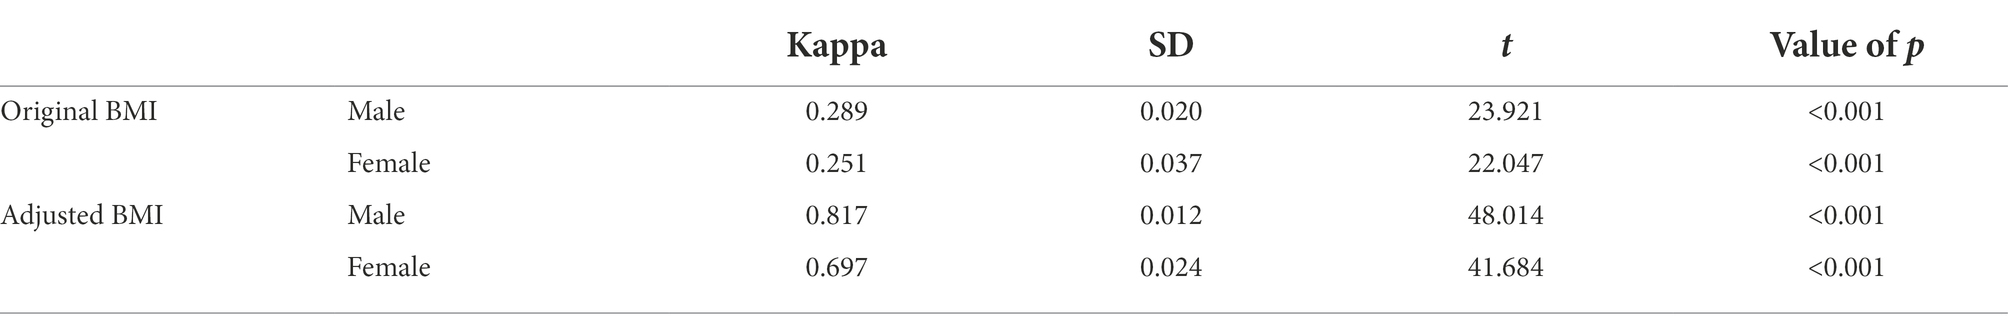
Table 6. Kappa statistics of original and adjusted BMI cutoff points.
The adjusted BMI cutoff points classified higher proportion of college students into obesity than the WHO reference. According to the new BMI cutoff points, 23.00% of male and 9.29% of female students were identified as obesity, while the original criteria (BMI ≥ 28 kg/m2) only accounted for 3.93 and 0.91% of male and female students, respectively (Table 7). The results suggest that the adjusted BMI be more powerful in obesity screening and effectively lower the risk of false classifications.
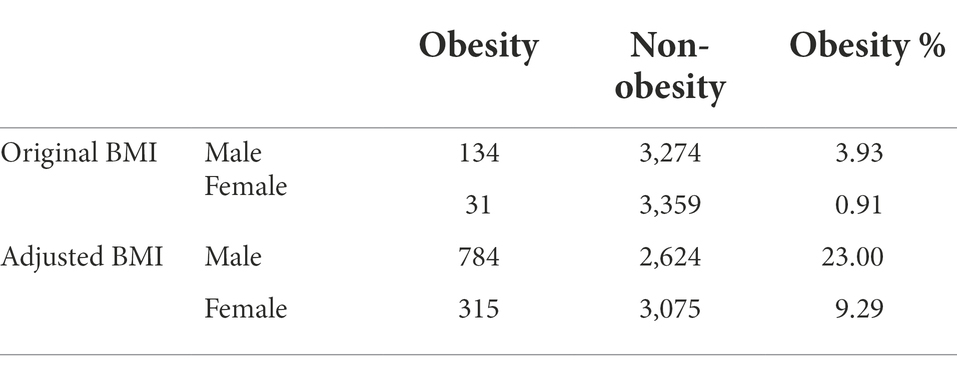
Table 7. Comparisons between original and adjusted BMI cutoffs in obesity screening.
Discussion
The current study explored the optimal BMI cutoff points for obesity screening among Chinese college students. Compared with the WHO standard for general population (BMI ≥ 28 kg/m2), the cutoff points for Chinese male (BMI ≥ 23.53 kg/m2) and female college students (BMI ≥ 23.41 kg/m2) were lower. The reduced BMI cutoff points were characterized by high sensitivity and specificity as well as good consistency with the gold standard based on Vervaeck index, which substantiated the new criteria in obesity screening. According to the adjusted BMI standard, an increased number of students were classified as obesity.
The evidence indicated that the original cutoff point may be too high to accurately reflect obesity prevalence among college students in China. Indeed, prominent differences across populations implied the necessity of developing population-specific criteria for obesity screening (Deurenberg, 2001). The use of BMI cutoff points for classifying obesity should account for ethnicity given that a universal BMI standard may be not appropriate in clinical practice (Norgan, 1994). Cumulative evidence suggests that, compared with the WHO reference, lower BMI values should be applied particularly in Asians (Mascie-Taylor and Goto, 2007). Nguyen and colleagues provided evidence for lower BMI cutoff point in Chinese adults than that in Western populations (Nguyen et al., 2008). Such a conclusion was substantiated by the research in which Taiwan Chinese were characterized by lower BMI associated with higher BF% than Caucasians (Chang et al., 2003). Further analysis indicated that the BMI obesity cutoff point of 30 kg/m2 for Caucasians was comparable to 25 kg/m2 for Taiwan Chinese. Consistent evidence can be found in a study involving Hong Kong Chinese (Ko et al., 2001). Researchers identified a BMI of 26 kg/m2 in corresponding to obesity defined by BF%.
Education is another important consideration in obesity classification. Research has shown that obesity is more prevalent among the low educated individuals compared with college graduates (Cohen et al., 2013). The lower BMI cutoff points identified in the current study can be justified by the inverse relationship between education level and obesity (Hermann et al., 2011; Boing and Subramanian, 2015). People with higher educational attainment may be better aware of the consequences of obesity and approaches to a healthy lifestyle through restricted diet and regular exercise (Eide and Showalter, 2011). In addition, social network also has substantial impact on health-related behaviors (Kim, 2016). The networks formed by individuals with higher educational attainment may provide financial, physical, and emotional support for health promotion (Berkman, 1995). It is reasonable to apply lower BMI classifications to obesity screening among college students compared with general populations.
In developed countries the rate of obesity in females is 1.5 to 2 times as many as that in males (Seidell, 2005). The current study also identified difference between male and female students, but the rate of obesity in male students (23.00%) is over twice as many as that in females students (9.29%). It is worth noting that preferences for physical appearance impose particular influences on females in Asian countries (Jackson et al., 2016). In China, more female college students are categorized as normal weight and underweight than male counterparts (Chen et al., 2020). An epidemic study in obesity prevalence in urban adults of Northeast China also identified higher obesity rate in males than that in females (Wang et al., 2012). It is worth pointing out potential sociocultural influence on body image among Chinese, as females reported greater body dissatisfaction than males. While males consider increasing muscle mass and weight essential to enhance body image, females show particular interests in body weight management (Xu et al., 2010). A recent study identified a quadratic relationship between female BMI and attractiveness ratings. Young females perceived a BMI of 22.00 ideal for body attractiveness, which was lower than the BMI preference (BMI = 25.75) in males (Han et al., 2021). The distinct perceptions on body image led to different body change behaviors between males and females in China, which could interpret the lower BMI and obesity prevalence among females.
The current study identified high sensitivity (93.77% for male and 91.22% for female) as well as specificity (93.93% for male and 96.04% for female) of the optimal BMI cutoff points in obesity screening for college students. However, the poor sensitivity has been considered a limitation of the BMI classifications in previous research. Sensitivity of the WHO reference (BMI ≥ 30 kg/m2) for older adults was only 14.5% for male and 23.4% for female, indicating poor efficacy of identifying obesity in this population (Batsis et al., 2016). In another research on Chinese children and adolescents, the sensitivity of BMI references for obesity varied between 12.8 and 47.3%, indicating limited accuracy of diagnosis (Chen et al., 2018). A meta-analysis provided robust evidence for accuracy of commonly used BMI values for obesity screening. The results reported a sensitivity of 50%, indicating that half of individuals with excess BF% failed to be identified based on the BMI classifications (Okorodudu et al., 2010). Therefore, increasing the sensitivity of BMI is needed to reduce the false negative rate in obesity screening (Fu et al., 2003).
The lower BMI cutoff points of the current study resulted in a higher sensitivity, which was substantiated by the previous research involving Saudi adult population. Compared with the BF%-defined obesity (83.9% in men and 97.3% in women), the BMI cutoff point of 30 kg/m2 classified only 29% of men and 53% of women as obesity. The BMI sensitivity reached a comparable level to the BF% classification as the BMI cutoff points were reduced to 24 kg/m2 (Alammar et al., 2020). It is reasonable to adopt a more stringent standard with lower BMI cutoff points for the concerns with the low BMI sensitivity in obesity screening (Javed et al., 2015). The current study proposed the BMI references with high sensitivity as well as specificity which may be attributed to age of the participants due to the strong correlation between age and body fatness (Gallagher et al., 1996). Other factors such as the gold standard for reference, prevalence of obesity, and populations can also impact specificity and sensitivity of BMI (Leeflang et al., 2013; Gába and Přidalová, 2016).
The current study has some specific contributions to the field of public health. Existing research on Chinese college students is limited, which demands practical and reliable approach to identify obesity prevalence for this population. Exercise intervention during an individual’s college period is particularly important for obesity prevention in lifetime. The lower BMI cutoff points with high sensitivity for obesity screening would facilitate obesity prevention for college students in China. The new BMI cutoff points increased the number of college students who were not considered obese by the commonly used BMI reference. It is possible that a few students may be falsely categorized as obesity, but the benefits associated with the higher sensitivity would exceed potential costs in corresponding to the increased obesity prevalence. Compared with previous research which selected bioelectrical impedance analysis of body composition and dual-energy x-ray absorptiometry as the gold standard (Anderson et al., 2012), the current study chose Vervaeck index which was convenient to use in clinical practice. BMI-based assessment allows quick and non-invasive applications to a large population. Precise cutoff points specific to Chinese college students are crucial for obesity screening and prevention.
Conclusion
Compared with other anthropometric measures, BMI is the best approach of obesity screening for Chinese college students. The optimal cutoff points for both male and female students are lower than the WHO reference, leading to a higher proportion of obesity. Prominent increase in sensitivity was identified along with high level of specificity in the adjusted BMI, which substantiated applications of the new cutoff points to obesity screening. The current study provides health policy implications. On the one hand, the population-based cutoffs improve screening accuracy in clinical practice. In addition, the findings highlight the feasibility of implementing a stricter BMI standard for college students in China.
Data availability statement
The raw data supporting the conclusions of this article will be made available by the authors, without undue reservation.
Ethics statement
Ethical review and approval was not required for the study involving human participants in accordance with the local legislation and institutional requirements. Written informed consent to participate in this study was obtained from the participants.
Author contributions
ZW and QF: Conceptualization, methodology, and writing - original draft preparation. ZW and JL: Validation. JL, QT, and JW: Investigation. ZW, YS, JL, and JW: Resources. ZW and MW: Data curation. QF: Writing - review and editing. All authors have read and agreed to the published version of the manuscript.
Funding
This research was funded by the Jiangsu Research Center for Student Physical Health Promotion, grant number 2019KT009.
Acknowledgments
We gave special thanks to Wang Liu and Xianglei Wu for his contributions and support to the current study.
Conflict of interest
The authors declare that the research was conducted in the absence of any commercial or financial relationships that could be construed as a potential conflict of interest.
Publisher’s note
All claims expressed in this article are solely those of the authors and do not necessarily represent those of their affiliated organizations, or those of the publisher, the editors and the reviewers. Any product that may be evaluated in this article, or claim that may be made by its manufacturer, is not guaranteed or endorsed by the publisher.
References
Alammar, M., Alsoghayer, S., El-Abd, K., and Alkhenizan, A. (2020). Diagnostic accuracy of body mass index (BMI) when diagnosing obesity in a Saudi adult population in a primary care setting, cross sectional, retrospective study. Diabetes Metab. Syndr. Obes. 13, 2515–2520. doi: 10.2147/DMSO.S263063
Anderson, L. J., Erceg, D. N., and Schroeder, E. T. (2012). Utility of multifrequency bioelectrical impedance compared with dual-energy x-ray absorptiometry for assessment of total and regional body composition varies between men and women. Nutr. Res. 32, 479–485. doi: 10.1016/j.nutres.2012.05.009
Barba, C., Cavalli-Sforza, T., Cutter, J., Darnton-Hill, I., Deurenberg, P., Deurenberg-Yap, M., et al. (2004). Appropriate body-mass index for Asian populations and its implications for policy and intervention strategies. Lancet 363, 157–163. doi: 10.1016/s0140-6736(03)15268-3
Batsis, J. A., Mackenzie, T. A., Bartels, S. J., Sahakyan, K. R., Somers, V. K., and Lopez-Jimenez, F. (2016). Diagnostic accuracy of body mass index to identify obesity in older adults: NHANES 1999-2004. Int. J. Obes. 40, 761–767. doi: 10.1038/ijo.2015.243
Berkman, L. F. (1995). The role of social relations in health promotion. Psychosom. Med. 57, 245–254. doi: 10.1097/00006842-199505000-00006
Bhaskaran, K., Douglas, I., Forbes, H., Dos Santos-Silva, I., Leon, D. A., and Smeeth, L. (2014). Body-mass index and risk of 22 specific cancers: a population-based cohort study of 5·24 million UK adults. Lancet 384, 755–765. doi: 10.1016/S0140-6736(14)60892-8
Boing, A. F., and Subramanian, S. V. (2015). The influence of area-level education on body mass index, waist circumference and obesity according to gender. Int. J. Public Health 60, 727–736. doi: 10.1007/s00038-015-0721-8
Chang, C. J., Wu, C. H., Chang, C. S., Yao, W. J., Yang, Y. C., Wu, J. S., et al. (2003). Low body mass index but high percent body fat in Taiwanese subjects: implications of obesity cutoffs. Int. J. Obes. Relat. Metab. Disord. 27, 253–259. doi: 10.1038/sj.ijo.802197
Chen, X., Cui, J., Zhang, Y., and Peng, W. (2020). The association between BMI and health-related physical fitness among Chinese college students: a cross-sectional study. BMC Public Health 20:444. doi: 10.1186/s12889-020-08517-8
Chen, Y., Zhang, Y., and Wang, L. (2018). Low diagnostic accuracy of body mass index-based and waist circumference-based references of childhood overweight and obesity in identifying overfat among Chinese children and adolescents. Biomed. Res. Int. 2018, 4570706–4570709. doi: 10.1155/2018/4570706
Cohen, A. K., Rai, M., Rehkopf, D. H., and Abrams, B. (2013). Educational attainment and obesity: a systematic review. Obes. Rev. 14, 989–1005. doi: 10.1111/obr.12062
Collaboration, N. R. F. (2016). Trends in adult body-mass index in 200 countries from 1975 to 2014: a pooled analysis of 1698 population-based measurement studies with 19·2 million participants. Lancet 387, 1377–1396. doi: 10.1016/S0140-6736(16)30054-X
Deurenberg, P. (2001). Universal cut-off BMI points for obesity are not appropriate. Br. J. Nutr. 85, 135–136. doi: 10.1079/BJN2000273
Diao, H., Wang, H., Yang, L., and Li, T. (2020). The impacts of multiple obesity-related interventions on quality of life in children and adolescents: a randomized controlled trial. Health Qual. Life Outcomes 18:213. doi: 10.1186/s12955-020-01459-0
Dou, P., Ju, H., Shang, J., Li, X., Xue, Q., Xu, Y., et al. (2016). Application of receiver operating characteristic curve in the assessment of the value of body mass index, waist circumference and percentage of body fat in the diagnosis of polycystic ovary syndrome in childbearing women. J. Ovarian Res. 9:51. doi: 10.1186/s13048-016-0260-9
Eide, E. R., and Showalter, M. H. (2011). Estimating the relation between health and education: what do we know and what do we need to know? Econ. Educ. Rev. 30, 778–791. doi: 10.1016/j.econedurev.2011.03.009
Fu, W. P., Lee, H. C., Ng, C. J., Tay, Y. K., Kau, C. Y., Seow, C. J., et al. (2003). Screening for childhood obesity: international vs population-specific definitions. Which is more appropriate? Int. J. Obes. Relat. Metab. Disord. 27, 1121–1126. doi: 10.1038/sj.ijo.0802385
Gába, A., and Přidalová, M. (2016). Diagnostic performance of body mass index to identify adiposity in women. Eur. J. Clin. Nutr. 70, 898–903. doi: 10.1038/ejcn.2015.211
Gallagher, D., Visser, M., Sepúlveda, D., Pierson, R. N., Harris, T., and Heymsfield, S. B. (1996). How useful is body mass index for comparison of body fatness across age, sex, and ethnic groups? Am. J. Epidemiol. 143, 228–239. doi: 10.1093/oxfordjournals.aje.a008733
Han, C., Lei, X., Yan, P., Li, X., and Morrison, E. R. (2021). Age differences in preferences for body physique. Personal. Individ. Differ. 181:111033. doi: 10.1016/j.paid.2021.111033
Hermann, S., Rohrmann, S., Linseisen, J., May, A. M., Kunst, A., Besson, H., et al. (2011). The association of education with body mass index and waist circumference in the EPIC-PANACEA study. BMC Public Health 11:169. doi: 10.1186/1471-2458-11-169
Hu, C., Chen, X., Yao, C., Liu, Y., Xu, H., Zhou, G., et al. (2020). Body mass index-associated molecular characteristics involved in tumor immune and metabolic pathways. Cancer Metab. 8:21. doi: 10.1186/s40170-020-00225-6
Hunma, S., Ramuth, H., Miles-Chan, J. L., Schutz, Y., Montani, J. P., Joonas, N., et al. (2016). Body composition-derived BMI cut-offs for overweight and obesity in Indians and Creoles of Mauritius: comparison with Caucasians. Int. J. Obes. 40, 1906–1914. doi: 10.1038/ijo.2016.176
Itani, L., Kreidieh, D., El Masri, D., Tannir, H., Chehade, L., and El Ghoch, M. (2020). Revising BMI cut-off points for obesity in a weight management setting in Lebanon. Int. J. Environ. Res. Public Health 17:3832. doi: 10.3390/ijerph17113832
Jackson, T., Jiang, C., and Chen, H. (2016). Associations between Chinese/Asian versus Western mass media influences and body image disturbances of young Chinese women. Body Image 17, 175–183. doi: 10.1016/j.bodyim.2016.03.007
Javed, A., Jumean, M., Murad, M. H., Okorodudu, D., Kumar, S., Somers, V. K., et al. (2015). Diagnostic performance of body mass index to identify obesity as defined by body adiposity in children and adolescents: a systematic review and meta-analysis. Pediatr. Obes. 10, 234–244. doi: 10.1111/ijpo.242
Jiang, L., Rong, J., Wang, Y., Hu, F., Bao, C., Li, X., et al. (2011). The relationship between body mass index and hip osteoarthritis: a systematic review and meta-analysis. Joint Bone Spine 78, 150–155. doi: 10.1016/j.jbspin.2010.04.011
Karabulut, U., Romero, Z., Conatser, P., and Karabulut, M. (2018). Assessing overweight/obesity, dietary habits, and physical activity in Hispanic college students. Exerc. Med. 2:5. doi: 10.26644/em.2018.005
Khan, S. S., Ning, H., Wilkins, J. T., Allen, N., Carnethon, M., Berry, J. D., et al. (2018). Association of Body Mass Index with lifetime risk of cardiovascular disease and compression of morbidity. JAMA Cardiol. 3, 280–287. doi: 10.1001/jamacardio.2018.0022
Kim, Y. J. (2016). The long-run effect of education on obesity in the US. Econ. Hum. Biol. 21, 100–109. doi: 10.1016/j.ehb.2015.12.003
Ko, G. T., Tang, J., Chan, J. C., Sung, R., Wu, M. M., Wai, H. P., et al. (2001). Lower BMI cut-off value to define obesity in Hong Kong Chinese: an analysis based on body fat assessment by bioelectrical impedance. Br. J. Nutr. 85, 239–242. doi: 10.1079/bjn2000251
Leeflang, M. M., Rutjes, A. W., Reitsma, J. B., Hooft, L., and Bossuyt, P. M. (2013). Variation of a test's sensitivity and specificity with disease prevalence. Can. Med. Assoc. J. 185, E537–E544. doi: 10.1503/cmaj.121286
Liu, M.-M., Liu, Q.-J., Wen, J., Wang, M., Wu, L.-Y., Qu, M.-L., et al. (2018). Waist-to-hip ratio is the most relevant obesity index at each phase of insulin secretion among obese patients. J. Diabetes Complicat. 32, 670–676. doi: 10.1016/j.jdiacomp.2018.04.006
Mascie-Taylor, C. G., and Goto, R. (2007). Human variation and body mass index: a review of the universality of BMI cut-offs, gender and urban-rural differences, and secular changes. J. Physiol. Anthropol. 26, 109–112. doi: 10.2114/jpa2.26.109
Ministry of Education of the People’s Republic of China (2021). Number of Students of Formal Education by Type and Level. Available at: http://www.moe.gov.cn/jyb_sjzl/moe_560/2020/quanguo/202108/t20210831_556364.html (Accessed August 31, 2022).
Nguyen, T. T., Adair, L. S., He, K., and Popkin, B. M. (2008). Optimal cutoff values for overweight: using body mass index to predict incidence of hypertension in 18- to 65-year-old Chinese adults. J. Nutr. 138, 1377–1382. doi: 10.1093/jn/138.7.1377
Niedermeier, M., Frühauf, A., Kopp-Wilfling, P., Rumpold, G., and Kopp, M. (2018). Alcohol consumption and physical activity in Austrian college students—a cross-sectional study. Subst. Use Misuse 53, 1581–1590. doi: 10.1080/10826084.2017.1416406
Norgan, N. G. (1994). Population differences in body composition in relation to the body mass index. Eur. J. Clin. Nutr. 48 Suppl 3:S10-25; discussion S26-7. doi: 10.1079/BJN19940080
Okorodudu, D. O., Jumean, M. F., Montori, V. M., Romero-Corral, A., Somers, V. K., Erwin, P. J., et al. (2010). Diagnostic performance of body mass index to identify obesity as defined by body adiposity: a systematic review and meta-analysis. Int. J. Obes. 34, 791–799. doi: 10.1038/ijo.2010.5
Payne, M. E., Porter Starr, K. N., Orenduff, M., Mulder, H. S., McDonald, S. R., Spira, A. P., et al. (2018). Quality of life and mental health in older adults with obesity and frailty: associations with a weight loss intervention. J. Nutr. Health Aging 22, 1259–1265. doi: 10.1007/s12603-018-1127-0
Peppard, P. E., Young, T., Palta, M., Dempsey, J., and Skatrud, J. (2000). Longitudinal study of moderate weight change and sleep-disordered breathing. JAMA 284, 3015–3021. doi: 10.1001/jama.284.23.3015
Rahman, M., and Berenson, A. B. (2010). Accuracy of current body mass index obesity classification for white, black, and Hispanic reproductive-age women. Obstet. Gynecol. 115, 982–988. doi: 10.1097/AOG.0b013e3181da9423
Romero-Corral, A., Somers, V. K., Sierra-Johnson, J., Thomas, R. J., Collazo-Clavell, M. L., Korinek, J., et al. (2008). Accuracy of body mass index in diagnosing obesity in the adult general population. Int. J. Obes. 32, 959–966. doi: 10.1038/ijo.2008.11
Safaei, M., Sundararajan, E. A., Driss, M., Boulila, W., and Shapi'i, A. (2021). A systematic literature review on obesity: understanding the causes & consequences of obesity and reviewing various machine learning approaches used to predict obesity. Comput. Biol. Med. 136:104754. doi: 10.1016/j.compbiomed.2021.104754
Saghafi-Asl, M., Aliasgharzadeh, S., and Asghari-Jafarabadi, M. (2020). Factors influencing weight management behavior among college students: an application of the health belief model. PLoS One 15:e0228058. doi: 10.1371/journal.pone.0228058
Seidell, J. C. (2005). Epidemiology of obesity. Semin. Vasc. Med. 5, 3–14. doi: 10.1055/s-2005-871737
Seidell, J. C., Kahn, H. S., Williamson, D. F., Lissner, L., and Valdez, R. (2001). Report from a Centers for Disease Control and Prevention workshop on use of adult anthropometry for public health and primary health care. Am. J. Clin. Nutr. 73, 123–126. doi: 10.1002/ana.410430221
Shang, L., Hu-Jian, L. I., and Jiang, X. (2007). Comparative study on somatotypes features of different minority male youth aged 18–20. Chin. J. Public Health 23, 1324–1325.
Shrestha, R., Upadhyay, S. K., Khatri, B., Bhattarai, J. R., Kayastha, M., and Upadhyay, M. P. (2021). BMI, waist to height ratio and waist circumference as a screening tool for hypertension in hospital outpatients: a cross-sectional, non-inferiority study. BMJ Open 11:e050096. doi: 10.1136/bmjopen-2021-050096
Skrypnik, D., Bogdański, P., Mądry, E., Karolkiewicz, J., Ratajczak, M., Kryściak, J., et al. (2015). Effects of endurance and endurance strength training on body composition and physical capacity in women with abdominal obesity. Obes. Facts 8, 175–187. doi: 10.1159/000431002
Trüb, F. P., Wells, J. C., Rühli, F. J., Staub, K., and Floris, J. (2020). Filling the weight gap: estimating body weight and BMI using height, chest and upper arm circumference of Swiss conscripts in the first half of the 20th century. Econ. Hum. Biol. 38:100891. doi: 10.1016/j.ehb.2020.100891
Wang, H., Wang, J., Liu, M. M., Wang, D., Liu, Y. Q., Zhao, Y., et al. (2012). Epidemiology of general obesity, abdominal obesity and related risk factors in urban adults from 33 communities of Northeast China: the CHPSNE study. BMC Public Health 12:967. doi: 10.1186/1471-2458-12-967
Woolcott, O. O., and Bergman, R. N. (2018). Relative fat mass (RFM) as a new estimator of whole-body fat percentage ─ a cross-sectional study in American adult individuals. Sci. Rep. 8:10980. doi: 10.1038/s41598-018-29362-1
Xu, X., Mellor, D., Kiehne, M., Ricciardelli, L. A., McCabe, M. P., and Xu, Y. (2010). Body dissatisfaction, engagement in body change behaviors and sociocultural influences on body image among Chinese adolescents. Body Image 7, 156–164. doi: 10.1016/j.bodyim.2009.11.003
Zhang, M., Chen, J., Gan, Y.-N., Ruan, B.-Y., Wang, X., Liu, Y., et al. (2017). Diagnostic values of four common methods for adult obesity. Chinese Gen. Pract. 22, 2732–2738. doi: 10.3969/j.issn.1007-9572.2017.22.010
Keywords: college students, BMI cutoff points, ROC curve, obesity, China
Citation: Wang Z, Wang J, Shi Y, Fang Q, Tan Q, Wang M and Li J (2022) Optimal BMI cutoff points in obesity screening for Chinese college students. Front. Psychol. 13:1017645. doi: 10.3389/fpsyg.2022.1017645
Edited by:
Ferman Konukman, Qatar University, QatarReviewed by:
María Luisa Zagalaz-Sánchez, University of Jaén, SpainArista Lahiri, Indian Institute of Technology Kharagpur, India
Copyright © 2022 Wang, Wang, Shi, Fang, Tan, Wang and Li. This is an open-access article distributed under the terms of the Creative Commons Attribution License (CC BY). The use, distribution or reproduction in other forums is permitted, provided the original author(s) and the copyright owner(s) are credited and that the original publication in this journal is cited, in accordance with accepted academic practice. No use, distribution or reproduction is permitted which does not comply with these terms.
*Correspondence: Jingping Li, bGlqaW5ncGluZ0BzdWRhLmVkdS5jbg==
†These authors have contributed equally to this work and share first authorship