Abstract
With rapid urbanization and social change, mental health issues have surged. Urban blue spaces (UBSs) offer a potential tool to increase well-being, yet the way in which sensory stimuli shape landscape perception and well-being remains underexplored. Intergenerational integration, a crucial aspect of well-being, refers to shared experiences and social interactions among different age groups, improving cognition and reducing loneliness. However, the role of UBSs in facilitating such interactions remains insufficiently studied. This research, grounded in the Stimulus-Organism-Response (S-O-R) framework, examines how perceived multisensory stimuli (visual, auditory, olfactory, and tactile) influence landscape perception and well-being. Structural equation modeling (SEM) of survey data (n = 532) reveals that perceived visual, auditory, and tactile stimuli significantly enhance landscape perception and well-being, while olfactory stimuli have no significant effect. Landscape perception mediates the relationship between visual, auditory, and tactile stimuli and well-being, but not for olfactory stimuli. These findings underscore the importance of optimizing sensory environments in UBSs to enhance psychological restoration. The study provides empirical insights for urban planners and policymakers, advocating for nature-based strategies that enhance visual aesthetics, maintain site quality, integrate natural soundscapes, and improve water accessibility to maximize restorative benefits and foster intergenerational inclusion.
1 Introduction
In recent years, mental health issues have surged with rapid urbanization and social change. The World Health Organization (World Health Organization, 2022) reported that nearly one billion people worldwide suffered from anxiety and depression in 2019, with urbanization contributing to their rising prevalence (Lecic-Tosevski, 2019; Ventriglio et al., 2021). In China, rapid urban expansion has reduced access to green and blue spaces, heightening mental health risks (Chen et al., 2020; Gong et al., 2012). Consequently, depression and anxiety now affect 26.4% of the population (Fu et al., 2023), posing a direct threat to well-being (Gautam et al., 2024). In response, researchers increasingly explore Nature-Based Solutions (NBS) to mitigate urbanization’s impact on mental health (Jiang et al., 2020; Li and Lange, 2023; Twohig-Bennett and Jones, 2018).
Since 2000, the European Commission has actively promoted Nature-Based Solutions (NBS), introducing initiatives like “Green Gyms” (Yerrell, 2008) and “Blue Gym” programs (Depledge and Bird, 2009) to enhance mental health through nature. Early research primarily focused on urban green spaces (UGSs)—vegetated areas such as parks, forests, and gardens (Nutsford et al., 2016)—highlighting benefits like reduced disease risk (Villeneuve et al., 2012) and improved mental health (Nguyen et al., 2021). In contrast, studies on urban blue spaces (UBSs) have emerged more recently. Völker and Kistemann (2011) define UBSs as all visible surface waters in cities, including rivers, lakes, and coastal areas. The EU-funded BlueHealth project further describes them as natural or artificial water-dominated environments accessible through direct (e.g., being in, on, or near water) or indirect (e.g., visual or auditory) interaction (Grellier et al., 2017). Notably, UGSs and UBSs often coexist (Smith et al., 2021), and water bodies were historically classified as part of green spaces (Han, 2003; Laumann et al., 2001), leading to an underappreciation of their unique benefits. Recent studies increasingly emphasize UBSs’ impact on psychological health and well-being (Britton et al., 2020; Foley, 2015; White et al., 2020). Like green spaces, UBSs reduce stress, enhance emotional well-being, and support psychological restoration (Gascon et al., 2017). Their natural elements, open views, and tranquil atmosphere further contribute to their restorative potential (White et al., 2020). This study defines UBSs as inland water-centered environments—including rivers, lakes, canals, and wetlands—focusing on their interaction with greenery and human engagement (Foley and Kistemann, 2015; Li and Trivic, 2024).
The World Health Organization defines health as complete physical, mental, and social well-being rather than merely the absence of disease (World Health Organization, 1948). Long-term exposure to UBSs has been linked to improved mental health (Gascon et al., 2017) and reduced psychological distress, particularly in economically disadvantaged communities (Mitchell and Popham, 2008). Beyond individual mental health, UBSs play a crucial role in social cohesion. Compared to green spaces, they are more effective in fostering social interactions and enhancing community well-being (Ashbullby et al., 2013; Foley, 2015; Vaeztavakoli et al., 2018; Völker and Kistemann, 2015). Urban rivers and lakes are natural landscapes and public spaces that encourage intergenerational engagement (Völker and Kistemann, 2011). Hipp et al. (2014) found that UBSs strengthen social connections, while other studies have linked them to a sense of community, neighborhood attachment, and social participation (Liu et al., 2020; Rugel et al., 2017). De Bell et al. (2017) further emphasized their dual role in promoting psychological benefits and social interaction. UBSs also provide targeted benefits for specific groups, including children, adolescents, and older adults (Tillmann et al., 2018; Yeo et al., 2020). However, maximizing their accessibility and usability remains a key challenge (Völker and Kistemann, 2011).
The UN-Habitat (2016) underscores the role of UBSs in fostering sustainable and healthy cities. With over half of the global population living within three kilometers of freshwater bodies (Kummu et al., 2011), their importance in urban planning is increasingly recognized. Effective UBS planning can enhance well-being while advancing urban sustainability. Despite growing evidence of their mental health benefits, limited research has examined how landscape attributes shape perceptions of UBSs and their influence on well-being (Georgiou et al., 2021). Moreover, their role in social integration and community cohesion remains underexplored (Honey-Rosés and Zapata, 2023). While studies on UGSs have assessed youth mental health through intergenerational factors—such as shared use, interaction opportunities, and age-inclusive design (Barron and Rugel, 2023)—the contribution of UBSs to intergenerational well-being is less understood. Additionally, most empirical studies focus on the correlation between waterfront environments and mental health, overlooking the role of sensory stimuli and the mediating effects of individual environmental preferences (Yen et al., 2021). These mediators are critical in enhancing blue health mechanisms yet remain underexamined. To address these gaps, this study focuses on landscape characteristics to evaluate how UBSs influence mental well-being.
UBSs are vital to human health and well-being (Yakinlar and Akpinar, 2022). While rivers and lakes offer restorative benefits, they also pose urban planning challenges. This study examines how landscape perception and perceived multisensory experiences shape well-being and influence user preferences in UBSs. The findings will guide planners and policymakers in designing inclusive, accessible, and engaging blue spaces that maximize public health benefits and urban livability.
2 Literature review
2.1 The S-O-R theory
Mehrabian and Russell (1974) introduced the Stimulus-Organism-Response (S-O-R) theory, a foundational framework in environmental psychology and behavioral research. This model explains how external stimuli shape behavior through internal psychological states (Buxbaum, 2016). It posits that an individual’s behavior is mediated by emotional and cognitive responses to environmental stimuli: an external stimulus (S) triggers an internal state (O), which subsequently leads to a behavioral response (R) (Mehrabian and Russell, 1974). The S-O-R model evolved from Stimulus-Response (S-R) theory, a behaviorist approach that conceptualized behavior as a direct reaction to external stimuli. However, the S-R theory failed to account for cognitive and emotional processes influencing behavior. To address this, Woodworth introduced the “organism” (O) as a mediating factor in 1929, incorporating cognitive and affective dimensions such as perception, emotion, and motivation (Koppes, 2014). Mehrabian and Russell (1974) refined this framework by integrating a three-dimensional emotional model—dominance, arousal, and delight—expanding its applicability. Later, advancements in cognitive psychology further enhanced the model by incorporating attention, perception, memory, and decision-making (Simon, 1979).
Today, the S-O-R model is widely applied in cognitive psychology, behavioral science, and consumer research. For instance, Tan et al. (2024) used it to analyze how public art attributes influence perceived value and walking behavior. Wu et al. (2021) examined its role in tourism applications, assessing how atmospheric cues shape visitors’ emotional and behavioral responses. Similarly, Chakraborty et al. (2024) explored how tourists’ willingness to pay mediates the relationship between stimuli and sustainable behaviors.
In the context of urban landscape perception, the organism (O) represents cognitive and affective responses to environmental stimuli (S), including visual, auditory, olfactory, and tactile perceptions of UBSs (Völker and Kistemann, 2011). Landscape perception is shaped by sensory inputs, subjective experiences, and cognitive appraisals (Wu et al., 2023; Xie et al., 2024).
Thus, this study applies the S-O-R framework to examine the role of UBSs in shaping well-being. UBSs function as the external stimuli (S), triggering landscape perception (O), which in turn influences self-reported well-being (R). This approach provides insight into how UBSs contribute to psychological health by shaping cognitive and affective responses.
2.2 Theoretical framework and current hypotheses
2.2.1 Spatial characteristics (stimulus, S)
As early as 1980, the World Health Organization recognized that perceived environmental quality influences the psychological benefits of UBSs (World Health Organization, 1980). Later, Thompson Coon et al. (2011) underscored the need for further research on its role in well-being. Studies suggest that sensory perceptions beyond visual cues—such as auditory, olfactory, and tactile stimuli—significantly shape well-being and restorative experiences (Holloway and Hubbard, 2014).
Multisensory perception is crucial in optimizing public space experiences by providing appropriate levels of engagement and interest (Haider, 2007; Kaplan et al., 2007; Larkin et al., 2010). The restorative effects of green spaces have been widely studied through a multisensory lens. For example, Zhang et al. (2019) proposed a framework demonstrating how visual, auditory, and tactile perceptions influence restoration via emotional and behavioral regulation. A UK-based qualitative study further explored how multisensory inputs—including visual, auditory, olfactory, and tactile stimuli—shape well-being and social interactions across age groups (Reece et al., 2024).
In this study, spatial characteristics refer to perceived external stimuli that shape human experiences in UBSs, including visual, auditory, olfactory, and tactile elements. This classification is based on Zhang et al. (2019) multisensory perception theory, which extends environmental perception beyond visual cues to incorporate auditory, tactile, and other sensory inputs in shaping landscape experiences and supporting psychological restoration.
While Zhang et al. (2019) primarily examined visual, auditory, and tactile stimuli, emerging research highlights the role of olfactory perception in emotion regulation, memory, and place attachment (Bratman et al., 2024). Investigating olfactory interactions with other sensory inputs may offer a more comprehensive understanding of UBSs’ restorative potential. To enhance this multisensory perspective, this study incorporates olfactory stimuli.
In summary, the current study aims to examine the role of these multisensory landscape elements (e.g., visual, auditory, olfactory, and tactile) as stimuli in enhancing environmental experiences in UBSs and promoting mental health and well-being. Unlike objective measurements (e.g., decibel levels for sound), the analysis relies on subjective sensory perceptions. To ensure clarity, the following section will detail the role of each perceived sensory stimulus in shaping landscape perception and psychological outcomes.
2.2.1.1 Perceived visual stimuli (PVS)
The perceived visual stimuli of UBS play a key role in shaping landscape perception. According to Kaplan and Kaplan’s (1989) landscape preference theory, individuals’ perception and preference for natural environments are shaped by mystery, coherence, legibility, and complexity, which UBSs inherently reflect. Within the visual stimuli perception, openness (Steinwender et al., 2008; Völker and Kistemann, 2011), maintenance (Pflüger et al., 2010), and scenic beauty (Lee L.-H., 2017; Lee L., 2017) are key elements defining UBS landscapes, influencing visual quality, environmental perception, and psychological restoration.
From a landscape perception perspective, expansive water bodies enhance mystery and coherence, encouraging exploration (Herzog, 1985; Kaplan and Kaplan, 1989). Riparian vegetation increases legibility and ecological awareness (Steinwender et al., 2008; Völker and Kistemann, 2011), while well-maintained greenery enhances aesthetic appeal and biophilic engagement (Pflüger et al., 2010, p. 76). Harmonious colors, diverse water features (Jahani and Saffariha, 2020), and biodiversity (e.g., plants, birds, butterflies) (Carrus et al., 2013; Hipp et al., 2016; Hipp and Ogunseitan, 2011) contribute to landscape attractiveness and social connectivity (Hipp et al., 2014; Völker and Kistemann, 2011).
Additionally, visual stimuli support psychological restoration and well-being (Kaplan and Kaplan, 1989; Ulrich et al., 1991). Openness fosters a sense of freedom and security, reducing stress (Völker and Kistemann, 2011). Spacious landscapes promote social interaction and cohesion (Barron and Rugel, 2023), while clean water and orderly landscapes improve accessibility and psychological recovery (Gidlow et al., 2012). Well-maintained environments further reduce visual clutter and anxiety (Pflüger et al., 2010). Thus, we propose the following hypotheses:
Hypothesis 1 (H1) The perceived visual stimuli of UBSs significantly positively impact landscape perception.
Hypothesis 5 (H5) The perceived visual stimuli of UBSs have a significant positive impact on well-being.
2.2.1.2 Perceived auditory stimuli (PAS)
As an integral aspect of urban environments, soundscapes shape environmental perception (Aletta et al., 2016) and influence spatial mystery and legibility (Pijanowski et al., 2011). Dynamic variations in water sound enhance spatial intrigue and attractiveness (Nicolosi et al., 2021), while people highly value the diversity of water acoustics, from gentle streams to rushing waterfalls, due to their impact on spatial perception (White et al., 2010, p. 490). Additionally, natural sounds, such as flowing water, birdsong, and wind, provide auditory pleasure and enrich environmental complexity, fostering deeper emotional connections to space (White et al., 2010, p. 490; Zhang et al., 2024).
A high-quality soundscape not only enhances environmental perception but also improves well-being. Studies show that natural soundscapes promote mental health, reduce stress, and alleviate anxiety and fatigue (Alvarsson et al., 2010; Guo et al., 2022). Furthermore, the type and compatibility of water sounds affect their restorative potential. Liu et al. (2022) found that river, fountain, and stream sounds provide the highest restorative benefits in UBSs, whereas ocean waves are less effective. In highly urbanized UBSs, integrating natural sounds (e.g., birdsong, flowing water) enhances restoration (Liu et al., 2022) and mitigates the adverse effects of traffic noise (Jeon et al., 2010; You et al., 2010). Additionally, pleasant soundscapes foster psychological well-being, a sense of belonging in public spaces, and social interaction (Abdelmoula et al., 2024), underscoring the positive role of auditory perception in mental health. Based on these findings, we propose the following hypotheses:
Hypothesis 2 (H2) The perceived auditory stimuli of UBSs significantly positively impact landscape perception.
Hypothesis 6 (H6) The perceived auditory stimuli of UBSs have a significant positive impact on well-being.
2.2.1.3 Perceived olfactory stimuli (POS)
Although often regarded as the least significant sense, olfaction plays a vital role in shaping place attachment (Pennycook and Otsuji, 2015) and influencing spatial perception and environmental quality (Hoover, 2009).
First, olfactory cues can guide movement within a space, shaping landscape preferences by making specific paths or areas more appealing (Hoover, 2009). A diverse range of scents enhances spatial legibility and complexity, enriching environmental experiences (Li et al., 2023). Natural aromas, such as mint, pine, and floral scents, strengthen landscape attachment (Houghton and Houghton, 2013). Moreover, pleasant and enduring scents foster human-environment interactions, encouraging social engagement (Thrift, 2003).
Beyond spatial perception, olfactory stimuli contribute to psychological well-being. Pleasant scents promote relaxation, reduce anxiety, and enhance happiness (Joshi and Hummel, 2024). Natural aromas, such as mint, pine, and floral scents, have been proven to relieve stress and boost well-being (Thrift, 2003). Additionally, they strengthen human-environment connections, support psychological restoration, and alleviate depression (Bratman et al., 2024; Gorman, 2017; Maund et al., 2019). Based on these findings, the following hypotheses are proposed:
Hypothesis 3 (H3) The perceived olfactory stimuli of UBSs significantly positively impact landscape perception.
Hypothesis 7 (H7) The perceived olfactory stimuli of UBSs have a significant positive impact on well-being.
2.2.1.4 Perceived tactile stimuli (PTS)
Perceived tactile stimuli significantly shape landscape perception by enhancing sensory engagement, promoting physiological stability, and reducing stress, thereby contributing to mental well-being (Warren et al., 2011). UBSs offer direct interaction with water features, such as shallow streams and interactive platforms, fostering place attachment (Asakawa et al., 2004), which can strengthen environmental attachment (Ulrich, 1983; Zhang et al., 2021).
Safety also significantly impacts landscape perception. Fall prevention barriers, adequate lighting, and clear signage enhance spatial legibility and accessibility, encouraging active exploration (Luo et al., 2023; Sonti et al., 2020). Additionally, well-designed pathways, ramps, seating, and shelters promote social inclusion, ensuring diverse user groups can experience UBSs’ restorative benefits (Haeffner et al., 2017; Zhang et al., 2021). Highly accessible blue spaces foster environmental attachment and social interactions, reinforcing their role in urban well-being (Gascon et al., 2017).
Beyond shaping landscape perception, tactile stimuli contribute to mental health by strengthening human-nature connections, promoting relaxation, and reducing anxiety (Ulrich, 1983; Zhang et al., 2021). Safety perception is equally critical; studies suggest that insecure environments diminish restorative benefits, whereas protective infrastructure, such as nighttime lighting, enhances psychological comfort and happiness (Luo et al., 2023; Sonti et al., 2020). Furthermore, high accessibility lowers stress levels and enhances restorative experiences, making blue space relaxation more inclusive (Gascon et al., 2017; Zhang et al., 2021). For older adults and individuals with mobility limitations, inclusive infrastructure ensures equitable access to blue spaces, supporting social well-being (Völker and Kistemann, 2015). Based on the above discussion, the following hypotheses are proposed:
Hypothesis 4 (H4) The perceived tactile stimuli of UBSs significantly positively impact landscape perception.
Hypothesis 8 (H8) The perceived tactile stimuli of UBSs have a significant positive impact on well-being.
2.2.2 Landscape perception (organism, O)
Individuals develop landscape perception through interaction with their surroundings, shaping subjective preferences based on sensory experiences (Wu et al., 2023). Perception is mediated by the senses, influencing emotional and cognitive responses to UBSs (Völker and Kistemann, 2011). The visual, auditory, olfactory, and tactile characteristics of UBSs contribute to environmental preferences, which are widely studied in environmental psychology, urban planning, and design (Van der Jagt et al., 2014). Various methods have been employed to quantify landscape preferences. For instance, Kaplan’s landscape preference matrix assesses preferences based on mystery, coherence, legibility, and complexity (Kaplan, 1987), which has been applied to measure urban greening preferences in Singapore (Zhao and Zhang, 2024). In contrast, Ning et al. (2024) used a qualitative approach to examine how landscape ecological indicators influence environmental preferences in rural settings.
To systematically assess environmental preferences, Van der Jagt et al. (2014) developed the Environmental Preference Scale (EPS), encompassing four core dimensions: coherence, legibility, complexity, and mystery. Yan et al. (2023) extended this framework to blue spaces by introducing the Water Environment Preference Scale (WEPS), incorporating biophilia and attachment (Kellert and Wilson, 1995; Lewicka, 2011). Given the role of place meaning, identity, and attachment in shaping well-being (Abraham et al., 2010; Davenport and Anderson, 2005; Frumkin, 2003), this study enhances WEPS by integrating place belonging, providing a more comprehensive evaluation of UBS-related psychological and social impacts (Völker and Kistemann, 2011).
Additionally, shared use fosters social integration in public spaces (Nelischer and Loukaitou-Sideris, 2023; Reece et al., 2024). To account for this, we expand WEPS by incorporating a shared-use dimension, resulting in the Blue Environmental Preference Scale (BEPS). This refined scale captures age-group-specific perceptions and preferences for UBSs, offering more profound insights into intergenerational engagement with blue spaces.
According to the Arabian-Russell Model theory, subjective environmental perception plays a pivotal role in health and well-being, influencing emotional states and behavioral choices (Liu et al., 2019; Wang et al., 2019). Perception is a critical mediator between objective environmental quality and health outcomes, as demonstrated by studies on green space exposure and mental well-being (Sallis et al., 2006). Positive perceptions of green spaces have been shown to enhance psychological health (Liu et al., 2019), suggesting a similar mediating effect in UBSs. Based on these findings, the following hypotheses are proposed:
Hypothesis 9 (H9) Landscape perception has a significant positive impact on well-being.
Hypothesis 10 (H10) Landscape perception mediates the effect of perceived visual stimuli in UBS on human well-being.
Hypothesis 11 (H11) Landscape perception mediates the effect of perceived auditory stimuli of UBSs on human well-being.
Hypothesis 12 (H12) Landscape perception mediates the effect of perceived olfactory stimuli of UBSs on human well-being.
Hypothesis 13 (H13) Landscape perceptions mediate the effect of perceived tactile stimuli on human well-being.
2.2.3 Well-being (reactions, R)
Well-being is a multidimensional construct encompassing mental and psychosocial health, commonly assessed through indicators such as self-esteem, self-efficacy, social confidence, and resilience (Britton et al., 2020). Increasing evidence links environmental health to human well-being (Whitmee et al., 2015), with research suggesting that exposure to UBS can promote pro-environmental behaviors (Alcock et al., 2020) and enhance mental health by reducing stress and anxiety, improving attention restoration, and fostering social interaction across generations (Brito et al., 2019; Dzhambov et al., 2018; Foley and Kistemann, 2015; Pitt, 2018). Schebella et al. (2019) categorized well-being into four key dimensions: stress reduction, mood enhancement, improved concentration, and self-esteem. A study in Hong Kong further examined self-reported health and well-being among older adults in relation to blue space exposure (Garrett et al., 2019). Following these frameworks, this study evaluates the impact of UBSs on well-being across three dimensions: Psychological relief, including stress and anxiety reduction; Cognitive and emotional enhancement, such as improved focus and mood stimulation; Social well-being, including cognitive benefits, reduced loneliness, and intergenerational social engagement. By systematically assessing these dimensions, this study aims to reveal the mechanisms through which UBSs contribute to mental health and social well-being, offering insights for urban planning and public health policies.
2.3 The impact of intergenerational factors and related research
Intergenerational integration plays a vital role in enhancing well-being in UBSs. By optimizing spatial diversity, shared accessibility, and multifunctional facilities, UBSs foster interaction among age groups, strengthening social bonds and community cohesion (Barron and Rugel, 2023; Haider, 2007; Mishra et al., 2023; Thang and Kaplan, 2013). Visual, auditory, olfactory, and tactile sensory stimuli are key to promoting intergenerational engagement. Open, multi-layered landscapes attract users of all ages, facilitating cross-generational exchange (Larkin et al., 2010). Dynamic water features, birdsong, and wind sounds create a universally appealing sensory environment (Haider, 2007; Rigolon et al., 2015), while familiar natural scents, such as floral and wetland aromas, enhance emotional connections between generations (Bratman et al., 2024). Additionally, water-friendly designs—including shallow water areas, accessible walkways, and interactive installations—promote safe, inclusive engagement for all age groups (Azevedo, 2020).
Beyond enriching environmental experiences, intergenerational integration contributes to mental health and social well-being, positioning UBSs as vital spaces for fostering cross-generational interactions (Bell et al., 2021). Studies suggest that UBSs enhance social cohesion and community well-being (Barron and Rugel, 2023; Gascon et al., 2017).
While research has explored intergenerational dynamics in urban green spaces and their impact on youth mental health (Barron and Rugel, 2023), studies on UBSs remain limited. Future research should further investigate UBSs’ role in social capital formation, intergenerational communication, and social cohesion (Honey-Rosés and Zapata, 2023). This study integrates key intergenerational factors (e.g., shared use, interaction opportunities, and age-inclusive design) into assessing landscape perception and environmental experience, providing new insights into the relationship between UBSs and human well-being.
2.4 Research hypotheses and model building
This study applies the Stimulus-Organism-Response (S-O-R) theory to examine how UBSs influence perceived well-being through sensory perception (visual, auditory, olfactory, and tactile). A theoretical model is proposed to explain the pathway from the environmental multisensory stimuli (S) → landscape perception (O) → well-being (R). The study addresses three key questions:
-
(1)
How do different sensory stimuli shape landscape perception?
-
(2)
How does landscape perception influence well-being?
-
(3)
Is there a mediating effect?
Structural Equation Modeling (SEM) is employed to explore these relationships. SEM enables the analysis of multiple variable interactions, assessment of latent constructs, and verification of mediation effects. This approach ensures a rigorous examination of the S-O-R framework, refining theoretical pathways and offering empirical insights to optimize UBS planning for enhanced well-being. Figure 1 illustrates the proposed theoretical model.
FIGURE 1

Theoretical model.
3 Research design and methodology
3.1 Study site
This study focuses on freshwater UBSs, excluding coastal environments such as estuaries. McDougall et al. (2020) noted that urban areas predominantly feature freshwater UBSs, making these findings more generalizable. UBSs are commonly classified into six types: urban rivers, canals, lakes, streams, ponds, and fountains (Völker et al., 2018). Among them, lakes, rivers, and canals are the most significant for enhancing well-being and quality of life (McDougall et al., 2022). Therefore, this study selects three frequently used UBSs—urban rivers, canals, and lakes—as investigation sites.
During March-April 2024, a desk-based review and field surveys were conducted in Hengshui City to identify potential UBSs. The selection criteria required that sites be located within urban environments and frequented by residents. Based on these criteria, the following three UBSs were chosen: People’s Park (urban lake), Fuyang River Ecological Park (urban river), and Ju Wu Canal Ecological Park (urban canal).
Each UBS site exhibits distinct environmental features, reflecting differences in urbanization, natural elements, and sensory experiences:
-
•
People’s Park (urban lake, Figure 2-A) is surrounded by residential and commercial buildings in the central commercial district. The lake’s varying openness creates a layered spatial experience with diverse visual stimuli. As the city’s oldest park, it holds cultural significance and fosters place attachment. However, due to high foot traffic, its soundscape is dominated by traffic noise and human activity, with minimal natural sounds. It is a highly active UBS, supporting outdoor activities and social interactions.
-
•
Fuyang River Ecological Park (urban river, Figure 2-B) is a historically significant river originating in Fengfeng Mining District, Handan, and flowing into the Bohai Sea. The highly urbanized riverbanks are lined with commercial and residential buildings. The river primarily serves urban drainage functions, limiting green space but offering some openness in visual perception. Its soundscape is shaped by commercial activity and urban noise. The site is used for running and walking, emphasizing functionality and recreation.
-
•
Wugong Canal Ecological Park (urban canal, Figure 2-C) was originally an artificial drainage canal constructed by the Chinese writer Wu Rulun and later restored as a wetland park. It features waterside trails and platforms for fishing, walking, and cycling. The canal has high ecological integrity, with a soundscape dominated by birdsong and flowing water, creating an immersive auditory experience. Additionally, the wetland ecosystem improves air quality, enhancing olfactory perception and reinforcing restorative qualities.
FIGURE 2
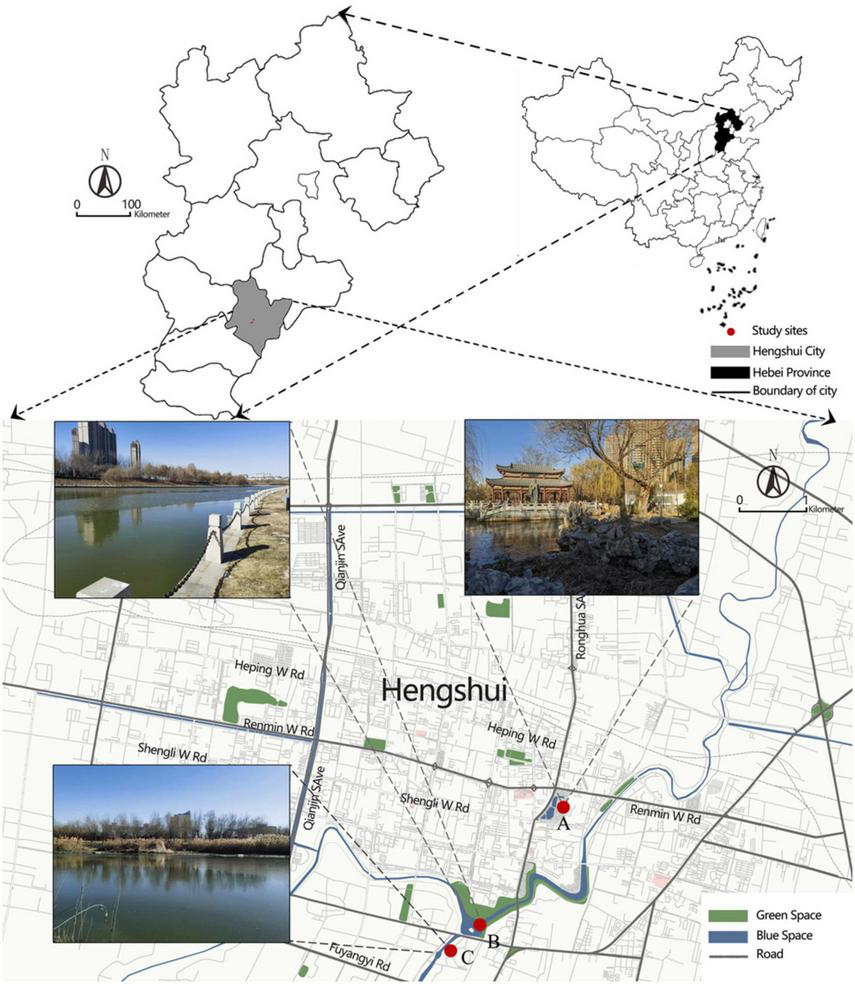
The map and the photos of the study sites: (A) the photo in people’s park (by authors), (B) the photo in Fuyang river (by authors), (C) the photo in Wugong Canal (by authors).
The selection of study sites aligns with the Stimulus-Organism-Response (S-O-R) framework. Each UBS presents distinct variations in sensory stimuli (visual, auditory, olfactory, and tactile), providing an ideal setting for analyzing how sensory experiences shape landscape perception (O) and well-being (R).
3.2 Questionnaire design
The first author assembled a panel of five experts from diverse age groups and disciplines, including landscape design, environmental science, ecology, and urban planning, to pilot-test the initial questionnaire on-site. After discussion, items that were ambiguous or difficult to interpret, such as “easy to organize and construct waterfront landscapes,” were removed to enhance clarity and usability. The finalized questionnaire consists of four sections.
The first section collects demographic and socioeconomic data, including gender, age, education, marital status, occupation, and household income. The second section assesses visit frequency and duration at the selected UBSs. The third section evaluates UBSs based on four perceived sensory dimensions—visual, auditory, olfactory, and tactile. Each dimension includes three to four items measuring perceived quality. Visual perception regarding openness, maintenance, and scenic beauty is assessed, reflecting spatial perception and aesthetics. Auditory perception evaluates soundscape quality, loudness, and diversity, capturing acoustic comfort and restorative potential. Based on Li et al. (2023), Olfactory perception considers scent diversity, characteristics, and duration to assess the psychological impact of environmental odors. Tactile perception examines interactivity, safety, and accessibility.
Landscape preferences were measured using BEPS, comprising 15 items categorized into seven factors: coherence, legibility, complexity, mystery, biophilia, attachment, and sharing, with two to three items per factor. Responses were recorded on a five-point Likert scale (1 = strongly disagree, 5 = strongly agree), and scores for each dimension were averaged (Akpinar, 2016).
The final section measures self-reported well-being in UBSs across five dimensions: stress reduction, mood enhancement, concentration, self-esteem (Schebella et al., 2019), and loneliness reduction (Heu and Brennecke, 2023). Participants rated their agreement with statements such as “This place has significantly improved my stress levels” on a five-point Likert scale. To streamline the analysis, stress, and mood were combined into negative mood improvement, attention into positive mood improvement, and self-cognition and loneliness into intergenerational well-being improvement, with scores averaged separately (Akpinar, 2016). Table 1 provides descriptions to aid participant comprehension.
TABLE 1
| Constructs | Items | Contents (5-Point Likert Scale) | Preference |
| Perceived visual stimuli | Openness (PVS1) |
The water view here is very open | Yan et al., 2023; Bell et al., 2021; Luo et al., 2023 |
| This place is very spacious. | |||
| The proportion of the water body is appropriate here. | |||
| The sites around the water bodies vary in size. | |||
| Maintenance (PVS2) |
The water here is very clear. | Steinwender et al., 2008; Bell et al., 2021; Lovell et al., 2014; Pflüger et al., 2010 | |
| The facilities here (such as ground, guardrail, etc.) are well maintained. | |||
| The vegetation here is very well maintained. | |||
| The facilities here can accommodate people of all ages. | |||
| Scenic quality (PVS3) |
It is a picturesque place. | Lee L.-H., 2017; Lee L., 2017; de Vries et al., 2013, p. 27; Wang et al., 2023; Fisher et al., 2021; Marselle et al., 2015 | |
| The landscape here is very natural, without artificial traces. | |||
| The color of the vegetation on this site is very harmonious. | |||
| There are rich species (birds, butterflies, aquatic plants). | |||
| Perceived auditory stimuli | Soundscape (PAS1) | The soundscape here is pleasant. | Pijanowski et al., 2011; Alvarsson et al., 2010; Guo et al., 2022; White et al., 2010, p. 490 |
| Loudness (PAS2) | Volume is soft. | ||
| Diversity of sounds (PAS3) | The soundscape here is varying (Such as bird song, wind, water wave beating sound) | ||
| Perceived olfactory stimuli | Diversity of scents (POS1) | The air here is filled with various scents, such as the fragrance of flowers and fresh grass. | Bratman et al., 2024; Maund et al., 2019 |
| Scent characteristic (POS2) | The scent here is unique. | ||
| Duration (POS3) | The fragrance here has a long duration. | ||
| Perceived tactile stimuli | Interactivity (PTS1) |
It is easy to get to the waterfront. | Zhang et al., 2021; Ulrich, 1983; Bell et al., 2021 |
| You can feel the wind near the water here. | |||
| Various water-based or waterside activities, such as boating and fishing, can be enjoyed here. | |||
| Safety (PTS2) |
There is adequate protection against falling water. | Luo et al., 2023 | |
| Lighting is adequate in this area. | |||
| Accessibility (PTS3) |
There is a barrier-free design? | Völker and Kistemann, 2015; Gascon et al., 2017 | |
| It is very convenient to get to here. | |||
| Landscape perception | Coherence (LP1) |
The style here is very consistent with the surrounding environment. | Van der Jagt et al., 2014 |
| The different landscapes here blend perfectly. | |||
| Legibility (LP2) |
It is easy to find my way around this waterfront space. | Van der Jagt et al., 2014 | |
| The position of different landscape elements is apparent. | |||
| Complexity (LP3) |
This scene contains a lot of different elements. | Van der Jagt et al., 2014 | |
| This waterfront landscape looks changeful. | |||
| Mystery (LP4) |
This waterfront view looks secluded and profound. | Van der Jagt et al., 2014 | |
| This waterscape could arouse my interest in further exploration. | |||
| Biophilia (LP5) |
This waterfront landscape has a sense of vitality. | Kellert and Wilson, 1995; Lewicka, 2011 | |
| This waterfront space allows me to get very close to nature. | |||
| Attachment (LP6) |
I want to revisit this waterfront space. | Kellert and Wilson, 1995; Lewicka, 2011 | |
| It gives me a strong sense of local identity. | |||
| Sharing (LP7) |
It allows me to build strong social connections with others. | Nelischer and Loukaitou-Sideris, 2023; Reece et al., 2024 | |
| There are opportunities for people of different ages to communicate and interact, such as familiar games and observation experiences. | |||
| Here, people of different ages are connected in sight. | |||
| Well-being | Improvement of negative emotion (WB1) | I think a typical visit to this blue space can significantly reduce my stress. | Schebella et al., 2019 |
| I think a typical visit to this blue space can improve my negative mood. | |||
| Improvement of positive emotions (WB2) | I think a typical visit to this blue space can significantly improve my attention. | Schebella et al., 2019 | |
| Inter-generational positive effects (WB3) | I think a typical visit to this blue space can significantly improve my cognitive skills. | Barron and Rugel, 2023; Nelischer and Loukaitou-Sideris, 2023 | |
| I think sharing this blue space with other age groups can relieve my loneliness greatly. |
Measurement items.
3.3 Data collection
The survey was conducted in Hengshui from October 1 to November 20, 2024, targeting adults aged 18 and above. To ensure data quality, six trained student surveyors from Hengshui University, the first author’s institution, were recruited and received a half-day training session before data collection. At each study site, systematic random sampling was employed to ensure a representative selection of participants. Surveyors followed a predetermined interval strategy, inviting every odd-numbered visitor rather than selecting respondents based on convenience. This method minimized selection bias and improved sample representativeness. The questionnaire required approximately 5–8 min to complete. As a token of appreciation, participants received small incentives, such as dishwashing liquid or noodles, upon survey completion.
A total of 625 questionnaires were collected, of which 532 were deemed valid after excluding incomplete or inconsistent responses, yielding an effective response rate of 85%. The sample size exceeds the recommended threshold of ten times the number of questionnaire items (22), meeting the requirements for SEM (Jackson, 2003).
Data were analyzed using SEM, a robust statistical method widely applied in social sciences, management, and psychology (Hair et al., 2011; Sarstedt et al., 2021). SEM enables examining relationships between latent and observed variables, making it particularly effective for assessing complex inter-variable associations. This study includes reliability and validity analysis of the measurement model, followed by structural model testing to evaluate hypothesized relationships. Statistical significance was set at p < 0.05, with additional thresholds of p < 0.01 and p < 0.001 where applicable.
3.4 Descriptive statistics
Table 2 presents the sample’s demographic, economic, and behavioral characteristics. Female respondents (62%) outnumber males (38%), and most (62.8%) are over 60. Marital status is nearly balanced (52.1% unmarried, 47.9% married). Education levels vary, with 57.7% holding a bachelor’s or college degree, while only 0.2% have a doctorate. Household income is primarily between RMB 2501-5000 (30.1%), with 26.1% earning below RMB 2500. Regarding UBS visits, 54.1% visit rarely, 18.2% daily, and 23% at least weekly. Most visits last 30–60 min (26.1%) or 15–30 min (24.6%). These findings provide a foundation for analyzing UBS’s perception and well-being.
TABLE 2
| Sample | Category | Number | Percentage |
| Gender | Male | 202 | 38% |
| Female | 330 | 62% | |
| Age | 18–44 | 117 | 22% |
| 45–60 | 81 | 15.20% | |
| Over 60 | 334 | 62.80% | |
| Marital Status | Unmarried | 277 | 52.10% |
| Married | 255 | 47.90% | |
| Education | Junior high school or below | 94 | 17.70% |
| High school | 89 | 16.70% | |
| Bachelor’s degree or college | 307 | 57.70% | |
| Master’s degree | 41 | 7.70% | |
| Doctor or above | 1 | 0.20% | |
| Monthly household income (RMB) | Under 2500 | 139 | 26.10% |
| 2501–5000 | 160 | 30.10% | |
| 5001–7500 | 135 | 25.40% | |
| 7501–10000 | 56 | 10.50% | |
| Above 10000 | 42 | 7.90% | |
| Frequency of visits | Seldom | 288 | 54.10% |
| Once per month | 25 | 4.70% | |
| Once per week | 60 | 11.30% | |
| Several times per week | 62 | 11.70% | |
| Every day | 97 | 18.20% | |
| Length of visit | <15 min | 33 | 6.20% |
| 15–30 min | 131 | 24.60% | |
| 30 min–1 h | 139 | 26.10% | |
| 1–2 h | 129 | 24.20% | |
| >2 h | 100 | 18.80% |
Descriptive statistics results.
4 Data analysis and results
4.1 Measurement model analysis
4.1.1 Reliability test
Reliability analysis was conducted using SPSS 27.0, with results presented in Table 3. The Cronbach’s α-values ranged from 0.863 to 0.944, all exceeding the 0.7 thresholds (Hair et al., 1986), confirming high internal consistency. Deleting any item did not improve Cronbach’s α, and Corrected Item-to-Total Correlation (CITC) values remained above 0.5, further supporting scale reliability (Churchill, 1979).
TABLE 3
| Dimension | Items | Corrected item-to-total correlation | Cronbach’s α if Item deleted | Cronbach’s α |
| PVS | PVS1 | 0.732 | 0.882 | 0.886 |
| PVS2 | 0.827 | 0.797 | ||
| PVS3 | 0.781 | 0.837 | ||
| PAS | PAS1 | 0.836 | 0.819 | 0.897 |
| PAS2 | 0.807 | 0.844 | ||
| PAS3 | 0.749 | 0.894 | ||
| POS | POS1 | 0.762 | 0.840 | 0.882 |
| POS2 | 0.806 | 0.801 | ||
| POS3 | 0.745 | 0.856 | ||
| PTS | PTS1 | 0.706 | 0.838 | 0.863 |
| PTS2 | 0.746 | 0.805 | ||
| PTS3 | 0.774 | 0.776 | ||
| LP | LP1 | 0.755 | 0.94 | 0.944 |
| LP2 | 0.797 | 0.937 | ||
| LP3 | 0.847 | 0.932 | ||
| LP4 | 0.798 | 0.936 | ||
| LP5 | 0.841 | 0.933 | ||
| LP6 | 0.811 | 0.935 | ||
| LP7 | 0.847 | 0.933 | ||
| WB | WB1 | 0.753 | 0.855 | 0.884 |
| WB2 | 0.829 | 0.785 | ||
| WB3 | 0.745 | 0.863 |
Results of confidence analysis.
4.1.2 Validity test
Validity was assessed using the Kaiser-Meyer-Olkin (KMO) test and Bartlett’s test of sphericity in SPSS 27.0 (Table 4). KMO values exceeded 0.5 (ranging from 0.723 to 0.934), and Bartlett’s test was statistically significant (p < 0.05), indicating suitability for factor analysis (Kaiser, 1974). Principal component analysis extracted a single factor per variable with eigenvalues >1, and cumulative variance contribution exceeded 50%, demonstrating high explanatory power. Factor loadings were >0.6, and communalities exceeded 0.5, aligning with prior research (Kohli et al., 1998).
TABLE 4
| Dimension | Items | KMO | Bartlett Sphere test | Factor loading | Commonality | Eigenvalue | Total variation explained |
| PVS | PVS1 | 0.727 | <0.001 | 0.876 | 0.768 | 2.451 | 81.69% |
| PVS2 | 0.929 | 0.862 | |||||
| PVS3 | 0.906 | 0.821 | |||||
| PAS | PAS1 | 0.735 | <0.001 | 0.931 | 0.867 | 2.489 | 82.97% |
| PAS2 | 0.917 | 0.841 | |||||
| PAS3 | 0.884 | 0.782 | |||||
| POS | POS1 | 0.736 | <0.001 | 0.896 | 0.802 | 2.428 | 80.93% |
| POS2 | 0.918 | 0.843 | |||||
| POS3 | 0.885 | 0.783 | |||||
| PTS | PTS1 | 0.730 | <0.001 | 0.866 | 0.751 | 2.359 | 78.63% |
| PTS2 | 0.889 | 0.791 | |||||
| PTS3 | 0.904 | 0.817 | |||||
| LP | LP1 | 0.934 | <0.001 | 0.818 | 0.670 | 5.250 | 75.00% |
| LP2 | 0.852 | 0.726 | |||||
| LP3 | 0.891 | 0.794 | |||||
| LP4 | 0.854 | 0.730 | |||||
| LP5 | 0.888 | 0.788 | |||||
| LP6 | 0.865 | 0.748 | |||||
| LP7 | 0.891 | 0.795 | |||||
| WB | WB1 | 0.723 | <0.001 | 0.890 | 0.793 | 2.439 | 81.29% |
| WB2 | 0.930 | 0.864 | |||||
| WB3 | 0.884 | 0.782 |
Analysis results of exploratory factor.
Convergent validity was assessed using AMOS. Following established criteria, standardized factor loadings should exceed 0.5, composite reliability (CR) should be ≥ 0.7 (Hair et al., 2020), and the average variance extracted (AVE) should be >0.5 (Hair et al., 2021). As shown in Table 5, all factor loadings exceed 0.7, CR values surpass 0.8, and AVE values are above 0.6, confirming strong convergent validity.
TABLE 5
| Dimension | Items | Unstandardized factor loading | Standardized factor loading | S.E. | p-value | AVE | CR |
| PVS | PVS1 | 1.000 | 0.779 | – | – | 0.729 | 0.889 |
| PVS2 | 1.079 | 0.896 | 0.049 | 0.000 | |||
| PVS3 | 1.062 | 0.882 | 0.048 | 0.000 | |||
| PAS | PAS1 | 1.000 | 0.921 | – | – | 0.748 | 0.899 |
| PAS2 | 0.958 | 0.872 | 0.034 | 0.000 | |||
| PAS3 | 0.869 | 0.798 | 0.036 | 0.000 | |||
| POS | POS1 | 1.000 | 0.834 | – | – | 0.717 | 0.883 |
| POS2 | 1.086 | 0.898 | 0.048 | 0.000 | |||
| POS3 | 1.01 | 0.805 | 0.048 | 0.000 | |||
| PTS | PTS1 | 1.000 | 0.783 | – | – | 0.682 | 0.865 |
| PTS2 | 1.184 | 0.824 | 0.061 | 0.000 | |||
| PTS3 | 1.137 | 0.869 | 0.056 | 0.000 | |||
| LP | LP1 | 1.000 | 0.785 | – | – | 0.700 | 0.942 |
| LP2 | 0.996 | 0.819 | 0.047 | 0.000 | |||
| LP3 | 1.093 | 0.869 | 0.048 | 0.000 | |||
| LP4 | 1.048 | 0.839 | 0.049 | 0.000 | |||
| LP5 | 1.121 | 0.908 | 0.049 | 0.000 | |||
| LP6 | 1.116 | 0.828 | 0.051 | 0.000 | |||
| LP7 | 1.036 | 0.804 | 0.044 | 0.000 | |||
| WB | WB1 | 1.000 | 0.869 | – | – | 0.746 | 0.898 |
| WB2 | 1.144 | 0.879 | 0.047 | 0.000 | |||
| WB3 | 1.048 | 0.843 | 0.049 | 0.000 |
Analysis results of convergent validity.
Discriminant validity was evaluated by comparing AVE square roots with construct correlations (Fornell and Larcker, 1981). As presented in Table 6, AVE square roots exceeded inter-construct correlations, confirming discriminant validity. Additionally, Heterotrait-Monotrait (HTMT) ratios remained <0.90, further supporting discriminant validity (Henseler et al., 2015; Table 7).
TABLE 6
| PVS | PAS | POS | PTS | LP | WB | |
| PVS | 0.854 | |||||
| PAS | 0.478 | 0.865 | ||||
| POS | 0.283 | 0.205 | 0.847 | |||
| PTS | 0.486 | 0.439 | 0.271 | 0.826 | ||
| LP | 0.633 | 0.575 | 0.293 | 0.539 | 0.837 | |
| WB | 0.465 | 0.440 | 0.230 | 0.421 | 0.520 | 0.948 |
Discriminant validity.
The bolded part of the diagonal line indicates the square root of AVE.
TABLE 7
| PAS | LP | POS | PTS | PVS | WB | |
| PAS | ||||||
| LP | 0.626 | |||||
| POS | 0.231 | 0.321 | ||||
| PTS | 0.500 | 0.597 | 0.312 | |||
| PVS | 0.537 | 0.692 | 0.321 | 0.558 | ||
| WB | 0.495 | 0.571 | 0.26 | 0.483 | 0.529 |
Heterotrait–monotrait (HTMT) ratio.
4.2 Structural model analysis
SEM was conducted following Kline (2023) fit indices criteria: χ2/df < 5, RMSEA & SRMR < 0.08, NFI, GFI, IFI, TLI, and CFI > 0.90. All model fit indices met these standards (Table 8), confirming strong structural validity. To assess common method bias, a common method factor was introduced (Xiong et al., 2012). Two models were compared: M1 (without a common method factor) and M2 (with a common method factor). Although M2 showed a slightly improved fit, the changes were negligible (RMSEA and SRMR differences <0.05; NFI, GFI, IFI, TLI, and CFI differences <0.1), suggesting common method bias was effectively controlled (Table 8).
TABLE 8
| Common Indices | χ2/df | RMSEA | GFI | NFI | IFI | TLI | CFI | SRMR |
| Judgment criteria | <5 | <0.08 | >0.9 | >0.9 | >0.9 | >0.9 | >0.9 | <0.08 |
| CFA value | 2.705 | 0.057 | 0.917 | 0.942 | 0.963 | 0.956 | 0.963 | 0.034 |
| CCLFM value | 2.411 | 0.052 | 0.926 | 0.949 | 0.969 | 0.963 | 0.969 | 0.033 |
Model fit measures, comparison of model fit between M1 and M2.
Moreover, path analysis results (Figure 3 and Table 9) revealed significant relationships except for H3 and H7, reinforcing the model’s explanatory power regarding UBSs’ well-being.
FIGURE 3

Model path analysis results. *p < 0.05, ***p < 0.001.
TABLE 9
| Hypothesis | Relationship | Unstd. | Std. | SE | p-values | Support→ |
| H1 | PVS→LP | 0.355 | 0.383 | 0.044 | 0.000 | Yes |
| H2 | PAS→LP | 0.255 | 0.296 | 0.037 | 0.000 | Yes |
| H3 | POS→LP | 0.043 | 0.054 | 0.028 | 0.127 | No |
| H4 | PTS→LP | 0.196 | 0.216 | 0.04 | 0.000 | Yes |
| H5 | PVS→WB | 0.159 | 0.151 | 0.065 | 0.014 | Yes |
| H6 | PAS→WB | 0.148 | 0.151 | 0.053 | 0.005 | Yes |
| H7 | POS→WB | 0.039 | 0.043 | 0.039 | 0.321 | No |
| H8 | PTS→WB | 0.150 | 0.145 | 0.057 | 0.009 | Yes |
| H9 | LP→WB | 0.310 | 0.272 | 0.074 | 0.000 | Yes |
Hypothesis test results.
4.3 Analysis of mediating effects
Mediation effects were tested using 1,000 bootstrap resamples. As shown in Table 10, LP significantly mediated the effects of PVS, PAS, and PTS on WB (p < 0.05, confidence intervals excluding zero). However, POS had no significant direct or indirect effect, indicating its negligible role in the model.
TABLE 10
| Effect | Parameter | Estimate | 95% confidence interval | ||
| p-value | Lower | Upper | |||
| Indirect effect | PVS→LP→WB | 0.104 | 0.015 | 0.015 | 0.288 |
| PAS→LP→WB | 0.080 | 0.013 | 0.015 | 0.221 | |
| POS→LP→WB | 0.015 | 0.079 | −0.002 | 0.060 | |
| PTS→LP→WB | 0.059 | 0.015 | 0.011 | 0.179 | |
| Direct effect | PVS→WB | 0.151 | 0.179 | −0.077 | 0.38 |
| PAS→WB | 0.151 | 0.164 | −0.06 | 0.363 | |
| POS→WB | 0.043 | 0.351 | −0.045 | 0.138 | |
| PTS→WB | 0.145 | 0.102 | −0.023 | 0.381 | |
| Total effect | PVS→WB | 0.255 | 0.036 | 0.025 | 0.497 |
| PAS→WB | 0.232 | 0.008 | 0.057 | 0.429 | |
| POS→WB | 0.057 | 0.219 | −0.035 | 0.156 | |
| PTS→WB | 0.204 | 0.037 | 0.026 | 0.402 | |
Results of mediated path tests.
5 Discussion
Of the 13 tested hypotheses, 10 were supported, while H3, H7, and H12 were not. H1, H2, H4, and H9 demonstrated the strongest effects.
5.1 Hypotheses for spatial characteristics and landscape perception of UBSs
The results show that perceived visual, auditory, and tactile stimuli in UBSs significantly influence landscape perception, with standardized path coefficients of 0.383, 0.296, and 0.216, respectively (p < 0.001). This indicates that a one-unit increase in these stimuli enhances residents’ environmental perception by 0.383, 0.296, and 0.216 standard deviations, supporting H1, H2, and H4. Among them, visual stimuli have the strongest effect, suggesting that optimizing UBSs’ visual environment is the most effective way to enhance landscape perception (Deng et al., 2020). Conversely, perceived olfactory stimuli do not significantly affect landscape perception (β = 0.054, p > 0.05), leading to the rejection of H3. This may be due to the relatively weak olfactory stimuli in UBSs, as olfaction generally requires a more intense trigger to be noticeable. Moreover, vision is the dominant sense in environmental perception, while olfaction is often secondary (Pennycook and Otsuji, 2015). Studies have shown that people rely more on vision when perceiving environments and pay less attention to olfaction (Wang et al., 2023), which explains why perceived olfactory stimuli have a weaker influence on landscape preference perception in UBSs.
5.2 Hypotheses for spatial characteristics and well-being of UBSs
Similarly, perceived visual, auditory, and tactile stimuli positively impact well-being, with standardized path coefficients of 0.151, 0.151, and 0.145, respectively (p < 0.05), confirming H5, H6, and H8. This suggests that enhancing UBSs’ visual, auditory, and tactile environments can promote relaxation and stress relief, ultimately improving well-being (Whitmee et al., 2015). However, the effect of perceived olfactory stimuli on well-being is not significant (β = 0.043, p > 0.05), invalidating H7. A possible explanation is that the study was conducted in a northern Chinese city during autumn and winter when plant diversity, a key contributor to olfactory experiences, is limited (He et al., 2022). Consequently, olfactory perception in UBSs may be weaker during this period, reducing its impact on well-being.
5.3 Hypotheses for landscape perception and well-being of UBSs
The results indicate that natural landscape perception significantly enhances well-being (β = 0.272, p < 0.001), meaning a one-unit increase in perception intensity leads to a 0.272-unit rise in well-being. This supports H9, suggesting that more profound engagement with UBS environments enhances individuals’ appreciation of their uniqueness, thereby amplifying well-being (Liu et al., 2019; Wang et al., 2019).
Additionally, all seven dimensions of landscape perception—coherence, legibility, complexity, mystery, biophilia, attachment, and sharing—contributed significantly to overall perception, though with varying degrees of influence (β = 0.785 –0.879). Sharing (β = 0.879), complexity (β = 0.869), and biophilia (β = 0.869) had the strongest effects, highlighting the importance of social interaction, moderate visual complexity in water features, and proximity to nature in shaping UBS perceptions (Kaplan and Kaplan, 1989; Ulrich, 1983). As illustrated in Figure 4, UBSs promote social interaction through shared spaces such as seating areas and open gathering zones, reinforcing the impact of sharing on landscape perception. Figure 5 highlights the contributions of complexity and biophilia, showcasing diverse vegetation, varied waterbody structures, and rich biodiversity, all of which enhance engagement and psychological restoration. Attachment (β = 0.843) and mystery (β = 0.828) were also influential, underscoring the role of emotional connection and exploratory elements in enriching perception. Conversely, coherence (β = 0.785) and legibility (β = 0.819) had relatively lower contributions, potentially due to the dominance of natural aesthetics over structural order and navigability. These findings emphasize the need for UBS designs to prioritize shared experiences, biodiversity, and visually engaging water features while also fostering emotional attachment and functional usability (Van den Berg et al., 2007; White et al., 2013).
FIGURE 4
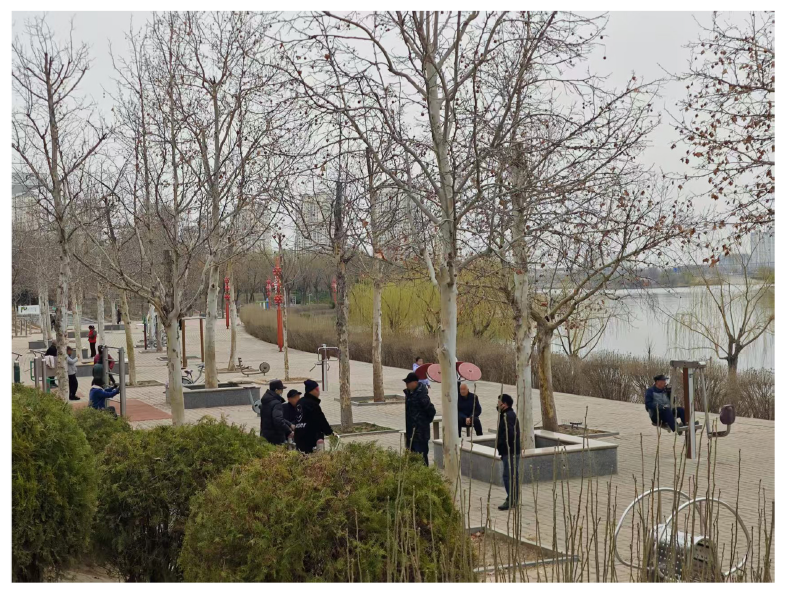
Shared spaces in UBS facilitating social interaction (by authors).
FIGURE 5
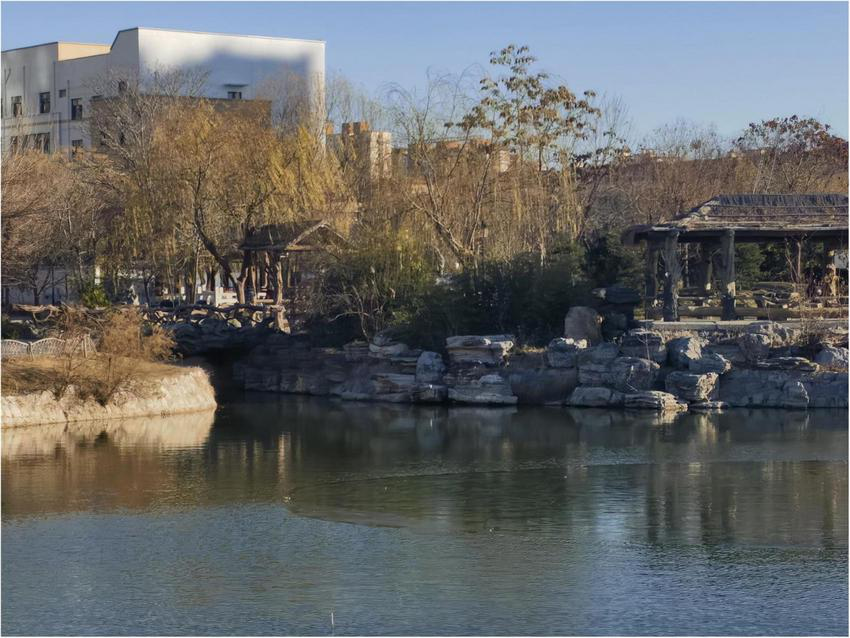
Landscape complexity and biophilic elements in UBS: diverse vegetation and waterbody structures (by authors).
Regarding well-being, the impact of intergenerational benefits (β = 0.804) was lower than that of stress reduction, mood improvement, and attention enhancement. This may reflect a tendency for individuals to prioritize immediate psychological relief in UBS settings. In contrast, long-term benefits, such as enhanced self-awareness and reduced loneliness through social interaction, are more likely to manifest over extended social engagement.
5.4 Hypotheses for spatial characteristics, landscape perception, and well-being of UBSs
Building on these findings, we further examined whether landscape perception mediates the relationship between sensory stimuli and well-being.
The analysis revealed significant indirect effects of perceived visual stimuli (PVS), auditory stimuli (PAS), and tactile stimuli (PTS) on well-being (WB), with effect values of 0.104, 0.080, and 0.059, respectively. The bias-corrected 95% confidence intervals did not contain zero, and all p-values were below 0.05, confirming that landscape perception significantly mediated these relationships. However, the indirect effect of perceived olfactory stimuli on well-being was 0.015, with a confidence interval including zero and a p-value exceeding 0.05, indicating no significant mediation effect.
The direct effects of PVS, PAS, POS, and PTS on WB were 0.151, 0.151, 0.043, and 0.145, respectively, but none were statistically significant, as their confidence intervals included zero and p-values exceeded 0.05. Similarly, the total effects of PVS, PAS, and PTS on WB were significant (0.255, 0.232, and 0.204, respectively), while POS showed no significant total effect (0.057). These findings confirm hypotheses H10, H11, and H13 but reject H12, reinforcing that landscape perception serves as the primary mediating mechanism between sensory stimuli (excluding olfactory) and well-being.
The results suggest that perceived visual, auditory, and tactile elements in UBSs substantially enhance well-being through landscape perception, with no significant direct effects. In contrast, perceived olfactory stimuli had minimal influence on all pathways. This may be attributed to the lower intensity of plant-derived odors and reduced air humidity in northern China during autumn and winter (Washington et al., 2019). While visual (e.g., water bodies and greenery) and auditory elements (e.g., bird songs and flowing water) effectively stimulate landscape perception and improve well-being (Alvarsson et al., 2010; Deng et al., 2020; Guo et al., 2022), olfactory experiences rely on specific environmental factors such as aromatic vegetation. The seasonal decline in plant emissions weakens olfactory stimulation (He, 2022), diminishing its impact on landscape perception and well-being (Wang et al., 2023).
Given that landscape perception mediates the relationship between sensory stimuli and well-being, with no significant direct effects observed, these findings align with the indirect effect theory in environmental psychology, which posits that sensory experiences influence well-being primarily through psychological states such as preference and cognition (Kaplan, 1995; Liu et al., 2019). Therefore, optimizing UBSs in northern China should prioritize enhancing visual and auditory elements. Strategies include improving water feature aesthetics, refining soundscape design, incorporating aromatic vegetation to strengthen olfactory stimulation, and organizing multisensory activities such as seasonal sightseeing events or concerts (Washington et al., 2019).
5.5 Sample representation
While the above findings highlight the effects of sensory stimuli on landscape perception and well-being, it is essential to consider sample representativeness to assess the broader applicability of these results.
Table 2 presents the sample’s demographic characteristics and highlights potential representational biases. Most respondents were female (62%), with 62.8% aged over 60. This aligns with some previous studies indicating that older adults are primary users of UBSs, particularly during weekdays and off-peak hours (Pleson et al., 2014; Yang et al., 2023; Yung et al., 2019). Younger adults (18–44 years) accounted for 22%, while the 45–60 age group represented 15.2%, suggesting a relatively lower representation of younger adults in this study. Regarding UBS visitation frequency, 54.1% of respondents reported infrequent visits, whereas 18.2% visited daily, and 27.7% visited at least once monthly. This distribution reflects real-world UBS usage patterns shaped by accessibility, lifestyle, and leisure preferences.
While the sample provides valuable insights into adult perceptions of UBSs, its composition may limit the generalizability of findings, particularly for younger populations. Future studies should employ stratified sampling and targeted outreach to achieve a more balanced age distribution and better collect data during different periods (e.g., weekends) to capture the experiences of younger and working populations. Additionally, longitudinal studies could assess the stability of UBS-related well-being outcomes across different user groups, enhancing the broader applicability of the findings.
6 Conclusion
6.1 Contribution
This study advances the S-O-R framework by systematically integrating multisensory perception (visual, auditory, olfactory, and tactile) into analyzing UBSs and their effects on well-being. While prior research has primarily focused on visual perception, this study highlights the interplay of multiple sensory stimuli, providing a more comprehensive understanding of environmental influences on human well-being. Additionally, by incorporating intergenerational integration into well-being assessments, this study underscores UBS’s role in fostering social interaction and cohesion, offering actionable insights for urban planning and sustainable development.
6.1.1 Theoretical contributions
This study fills a critical gap in environmental psychology and urban planning by moving beyond visual-dominant approaches and incorporating multisensory perception into studying UBSs. It further extends the indirect effect theory by empirically confirming that landscape perception mediates the relationship between sensory stimuli and well-being. It demonstrates that well-being is primarily shaped by cognitive and emotional responses rather than direct physiological effects.
These findings contribute to a deeper understanding of how multisensory perception enhances psychological restoration, offering a theoretical foundation for optimizing urban nature-based solutions. Additionally, by integrating intergenerational interaction into well-being assessments, this study provides novel insights into how UBSs contribute to social cohesion, supporting inclusive urban design and policymaking.
6.1.2 Management contributions
This study provides practical recommendations for urban planners, policymakers, social workers, and community administrators by identifying key environmental factors that enhance UBSs’ well-being. The findings emphasize the importance of multisensory optimization in UBS planning and management:
-
•
Visual Environment: In addition to enhancing spatial openness, improving landscape maintenance, aesthetic appeal, and biodiversity strengthens visual engagement and psychological restoration.
-
•
Auditory Environment: Incorporating natural soundscapes (e.g., birdsong, flowing water) and regulating sound levels enhances acoustic comfort and fosters emotional well-being.
-
•
Olfactory Environment: The intensity, persistence, and diversity of scents shape olfactory perception. Strategies such as planting aromatic vegetation, optimizing water circulation, and improving airflow can strengthen sensory appeal.
-
•
Tactile Experience: Enhancing water accessibility (e.g., walkways, open shorelines) and integrating interactive elements (e.g., shallow water areas) encourage user engagement, while safety measures (e.g., barriers, lighting, universal design) ensure inclusivity and accessibility.
From a policy perspective, these findings offer a scientific basis for:
-
•
Optimizing UBS development by integrating sustainable resource allocation and evidence-based maintenance strategies.
-
•
Creating age-inclusive UBS designs that enhance shared experiences and psychological well-being, which may contribute to intergenerational integration.
-
•
Addressing demographic shifts by enhancing universal accessibility, ensuring UBSs remain socially and physically inclusive.
By bridging academic research and practical applications, this study equips decision-makers with evidence-based strategies for designing more inclusive, engaging, and sustainable UBSs that optimize both individual well-being and social cohesion.
6.2 research limitations and future research directions
Despite its contributions, this study has several limitations that offer avenues for future research:
Geography: This study is based on data collected in Hengshui, China, which may limit the generalizability of the findings to other regions. Cultural, economic, and policy differences can influence UBS experiences, necessitating broader investigations across diverse geographic contexts. Future research could expand data collection to multiple regions, incorporating cross-cultural comparisons or multi-regional studies to assess the impact of regional variations on UBS perception and well-being.
Study Design: The study employs a cross-sectional design, capturing relationships between variables at a single point in time but lacking temporal insights into evolving perceptions of UBSs. Additionally, seasonal variations in UBS experiences were not explicitly examined. Future studies should consider longitudinal designs or multi-wave cross-sectional surveys to track temporal dynamics, capturing how seasonal changes and prolonged exposure influence well-being outcomes. While systematic random sampling was employed, potential biases may arise due to time-specific visitation patterns and voluntary participation. Future studies could implement stratified sampling across different periods and days of the week to further enhance sample representativeness.
Sample Representativeness and Age Distribution: This study focuses on adults (18+ years), excluding minors whose psychological responses to UBSs may differ due to developmental and behavioral variations. Adolescents, in particular, exhibit distinct environmental perceptions and participation patterns. Future research should incorporate younger age groups to enable cross-age comparisons and explore age-specific preferences and impacts on well-being in UBS settings. However, the sample structure presents certain biases, with over 60% of respondents being older adults, while the 18–44 age group is underrepresented. Furthermore, more than 50% of participants reported infrequent UBS visits, which may affect the interpretation of findings. Given these limitations, the study’s generalizability requires careful consideration. Future research should refine sampling strategies to achieve a more balanced age distribution, employing stratified sampling to ensure proportional representation across age groups. Data collection should also target weekends and holidays to increase young adult participation. Moreover, multi-stage sampling can be used to ensure adequate representation of individuals with varying UBS visitation frequencies, thereby enhancing the study’s robustness and applicability. Research methods: While quantitative methods systematically analyze variable relationships, they fail to capture the nuanced individual factors shaping adults’ UBS preferences. Future research should integrate qualitative approaches to uncover deeper insights, forming a more comprehensive analytical framework.
Addressing these limitations through expanded sample scope, longitudinal approaches, and mixed-methods research will enhance the generalizability and depth of UBS research. Future investigations should adopt interdisciplinary perspectives to optimize UBS design and maximize its psychological and social benefits.
Statements
Data availability statement
The raw data supporting the conclusions of this article will be made available by the authors, without undue reservation.
Ethics statement
The studies involving humans were approved by Hengshui University Academic Committee. The studies were conducted in accordance with the local legislation and institutional requirements. The participants provided their written informed consent to participate in this study. For the publication of identifiable images where explicit consent could not be obtained, appropriate blurring techniques have been applied to protect participant privacy.
Author contributions
PL: Conceptualization, Formal Analysis, Investigation, Methodology, Validation, Visualization, Writing – original draft. NS: Conceptualization, Supervision, Project administration, Writing – review and editing. YL: Data curation, Resources, Writing – review and editing. YW: Conceptualization, Writing – review and editing.
Funding
The author(s) declare that financial support was received for the research and/or publication of this article. This research was funded by the Scientific Research Project of Hebei Provincial Wetland Protection and Green Development Collaborative Innovation Center, grant number 2024XTCX011.
Conflict of interest
The authors declare that the research was conducted without any commercial or financial relationships that could be construed as a potential conflict of interest.
Generative AI statement
The authors declare that no Generative AI was used in the creation of this manuscript.
Publisher’s note
All claims expressed in this article are solely those of the authors and do not necessarily represent those of their affiliated organizations, or those of the publisher, the editors and the reviewers. Any product that may be evaluated in this article, or claim that may be made by its manufacturer, is not guaranteed or endorsed by the publisher.
References
1
Abdelmoula E. Abdelmoula B. Abdelmoula N. B. (2024). Natural soundscapes, urban design and psychological well-being.Eur. Psychiat.67S680–S680. 10.1192/j.eurpsy.2024.1414
2
Abraham A. Sommerhalder K. Abel T. (2010). Landscape and well-being: A scoping study on the health-promoting impact of outdoor environments.Int. J. Public Health5559–69. 10.1007/s00038-009-0069-z
3
Akpinar A. (2016). How is high school greenness related to students’ restoration and health?Urban For. Urban Green.161–8. 10.1016/j.ufug.2016.01.007
4
Alcock I. White M. P. Pahl S. Duarte-Davidson R. Fleming L. E. (2020). Associations between pro-environmental behaviour and neighbourhood nature, nature visit frequency and nature appreciation: Evidence from a nationally representative survey in England.Environ. Int.136:105441. 10.1016/j.envint.2019.105441
5
Aletta F. Kang J. Axelsson Ö (2016). Soundscape descriptors and a conceptual framework for developing predictive soundscape models.Landsc. Urban Plan.14965–74. 10.1016/j.landurbplan.2016.02.001
6
Alvarsson J. J. Wiens S. Nilsson M. E. (2010). Stress recovery during exposure to nature sound and environmental noise.Int. J. Environ. Res. Public Health71036–1046. 10.3390/ijerph7031036
7
Asakawa S. Yoshida K. Yabe K. (2004). Perceptions of urban stream corridors within the greenway system of Sapporo, Japan.Landsc. Urban Plan.68167–182. 10.1016/S0169-2046(03)00158-0
8
Ashbullby K. J. Pahl S. Webley P. White M. P. (2013). The beach as a setting for families’ health promotion: A qualitative study with parents and children living in coastal regions in Southwest England.Health Place23138–147. 10.1016/j.healthplace.2013.06.005
9
Azevedo C. (2020). “Urban public parks: Magnets for social inclusion and engagement across generations,” in Intergenerational Contact Zones, edsKaplanM.ThangL. L.SánchezM.HoffmanJ. (New York: Routledge), 86–96.
10
Barron S. Rugel E. J. (2023). Tolerant greenspaces: Designing urban nature-based solutions that foster social ties and support mental health among young adults.Environ. Sci. Policy1391–10. 10.1016/j.envsci.2022.10.005
11
Bell S. Fleming L. E. Grellier J. Kuhlmann F. Nieuwenhuijsen M. J. White M. P. (2021). Urban Blue Spaces: Planning and Design for Water, Health and Well-Being.London: Routledge.
12
Bratman G. N. Bembibre C. Daily G. C. Doty R. L. Hummel T. Jacobs L. F. et al (2024). Nature and human well-being: The olfactory pathway.Sci. Adv.10:eadn3028. 10.1126/sciadv.adn3028
13
Brito J. N. Pope Z. C. Mitchel N. R. Schneider I. E. Horton T. H. Pereira M. A. (2019). Changes in psychological state measures after green versus suburban walking exercise: A pilot crossover study: 902 Board# 136 May 29 2: 00 PM-3: 30 PM.Med. Sci. Sports Exerc.51:227. 10.1249/01.mss.0000561192.04079.7a
14
Britton E. Kindermann G. Domegan C. Carlin C. (2020). Blue care: A systematic review of blue space interventions for health and wellbeing.Health Promot. Int.3550–69. 10.1093/heapro/day103
15
Buxbaum O. (2016). Key Insights into Basic Mechanisms of Mental Activity.Cham: Springer International Publishing.
16
Carrus G. Lafortezza R. Colangelo G. Dentamaro I. Scopelliti M. Sanesi G. (2013). Relations between naturalness and perceived restorativeness of different urban green spaces.Psyecology4227–244. 10.1174/217119713807749869
17
Chakraborty D. Polisetty A. Nunkoo R. Rana N. P. (2024). What drives tourists towards sustainable behaviour? A longitudinal study.Asia Pac. J. Tour. Res.29352–374. 10.1080/10941665.2024.2324178
18
Chen T. Lang W. Li X. (2020). Exploring the impact of urban green space on residents’ health in Guangzhou, China.J. Urban Plan. Dev.146:05019022. 10.1061/(ASCE)UP.1943-5444.0000541
19
Churchill G. A. (1979). A paradigm for developing better measures of marketing constructs.J. Mark. Res.1664–73. 10.1177/002224377901600110
20
Davenport M. A. Anderson D. H. (2005). Getting from sense of place to place-based management: An interpretive investigation of place meanings and perceptions of landscape change.Soc. Nat. Resour.18625–641. 10.1080/08941920590959613
21
De Bell S. Graham H. Jarvis S. White P. (2017). The importance of nature in mediating social and psychological benefits associated with visits to freshwater blue space.Landsc. Urban Plan.167118–127. 10.1016/j.landurbplan.2017.06.003
22
de Vries S. van Dillen S. M. E. Groenewegen P. P. Spreeuwenberg P. (2013). Streetscape greenery and health: Stress, social cohesion and physical activity as mediators.Soc. Sci. Med.9426–33. 10.1016/j.socscimed.2013.06.030
23
Deng L. Li X. Luo H. Fu E.-K. Ma J. Sun L.-X. et al (2020). Empirical study of landscape types, landscape elements and landscape components of the urban park promoting physiological and psychological restoration.Urban For. Urban Green.48:126488. 10.1016/j.ufug.2019.126488
24
Depledge M. H. Bird W. J. (2009). The blue gym: Health and wellbeing from our coasts.Mar. Pollut. Bull.58947–948. 10.1016/j.marpolbul.2009.04.019
25
Dzhambov A. M. Markevych I. Hartig T. Tilov B. Arabadzhiev Z. Stoyanov D. et al (2018). Multiple pathways link urban green-and bluespace to mental health in young adults.Environ. Res.166223–233. 10.1016/j.envres.2018.06.004
26
Fisher J. C. Irvine K. N. Bicknell J. E. Hayes W. M. Fernandes D. Mistry J. et al (2021). Perceived biodiversity, sound, naturalness and safety enhance the restorative quality and wellbeing benefits of green and blue space in a neotropical city.Sci. Total Environ.755:143095. 10.1016/j.scitotenv.2020.143095
27
Foley R. (2015). Swimming in Ireland: Immersions in therapeutic blue space.Health Place35218–225. 10.1016/j.healthplace.2014.09.015
28
Foley R. Kistemann T. (2015). Blue space geographies: Enabling health in place.Health Place35157–165. 10.1016/j.healthplace.2015.07.003
29
Fornell C. Larcker D. F. (1981). Evaluating structural equation models with unobservable variables and measurement error.J. Mark. Res.1839–50. 10.1177/002224378101800104
30
Frumkin H. (2003). Healthy places: Exploring the evidence.Am. J. Public Health931451–1456. 10.2105/AJPH.93.9.1451
31
Fu X. L. Zhang K. Chen X. F. Chen Z. Y. (2023). Report on the Development of National Mental Health in China (2021-2022).Beingjing: Social Sciences Literature Publishing House.
32
Garrett J. K. White M. P. Huang J. Ng S. Hui Z. Leung C. et al (2019). Urban blue space and health and wellbeing in Hong Kong: Results from a survey of older adults.Health Place55100–110. 10.1016/j.healthplace.2018.11.003
33
Gascon M. Zijlema W. Vert C. White M. P. Nieuwenhuijsen M. J. (2017). Outdoor blue spaces, human health and well-being: A systematic review of quantitative studies.Int. J. Hyg. Environ. Health2201207–1221. 10.1016/j.ijheh.2017.08.004
34
Gautam S. Jain A. Chaudhary J. Gautam M. Gaur M. Grover S. (2024). Concept of mental health and mental well-being, it’s determinants and coping strategies.Indian J. Psychiatry66S231–S244. 10.4103/indianjpsychiatry.indianjpsychiatry_707_23
35
Georgiou M. Morison G. Smith N. Tieges Z. Chastin S. (2021). Mechanisms of impact of blue spaces on human health: A systematic literature review and meta-analysis.Int. J. Environ. Res. Public Health18:2486. 10.3390/ijerph18052486
36
Gidlow C. J. Ellis N. J. Bostock S. (2012). Development of the neighbourhood green space tool (NGST).Landsc. Urban Plan.106347–358. 10.1016/j.landurbplan.2012.04.007
37
Gong P. Liang S. Carlton E. J. Jiang Q. Wu J. Wang L. et al (2012). Urbanisation and health in China.Lancet379843–852. 10.1016/S0140-6736(11)61878-3
38
Gorman R. (2017). Smelling therapeutic landscapes: Embodied encounters within spaces of care farming.Health Place4722–28. 10.1016/j.healthplace.2017.06.005
39
Grellier J. White M. P. Albin M. Bell S. Elliott L. R. Gascón M. et al (2017). BlueHealth: A study programme protocol for mapping and quantifying the potential benefits to public health and well-being from Europe’s blue spaces.BMJ Open7:e016188. 10.1136/bmjopen-2017-016188
40
Guo S. Zhou Y. Yu J. Yang L. (2022). Effects of the combination of audio and visual factors on mental restoration in a large-scale urban greenway: Perspectives from Wuhan, China.Land11:2017. 10.3390/land11112017
41
Haeffner M. Jackson-Smith D. Buchert M. Risley J. (2017). Accessing blue spaces: Social and geographic factors structuring familiarity with, use of, and appreciation of urban waterways.Landsc. Urban Plan.167136–146. 10.1016/j.landurbplan.2017.06.008
42
Haider J. (2007). Inclusive design: Planning public urban spaces for children.Proc. Inst. Civil Eng. Munic. Eng.16083–88. 10.1680/muen.2007.160.2.83
43
Hair J. F. Anderson R. E. Tatham R. L. (1986). Multivariate Data Analysis with Readings.New York: Macmillan Publishing Co., Inc.
44
Hair J. F. Howard M. C. Nitzl C. (2020). Assessing measurement model quality in PLS-SEM using confirmatory composite analysis.J. Bus. Res.109101–110. 10.1016/j.jbusres.2019.11.069
45
Hair J. F. Hult G. T. M. Ringle C. M. Sarstedt M. Danks N. P. Ray S. (2021). Partial Least Squares Structural Equation Modeling (PLS-SEM) Using R: A Workbook.Cham: Springer.
46
Hair J. F. Ringle C. M. Sarstedt M. (2011). PLS-SEM: Indeed a silver bullet.J. Market. Theory Pract.19139–152. 10.2753/MTP1069-6679190202
47
Han K.-T. (2003). A reliable and valid self-rating measure of the restorative quality of natural environments.Landsc. Urban Plan.64209–232. 10.1016/S0169-2046(02)00241-4
48
He J. Y. (2022). Landscape design method of urban wetland park using the building information model.Wirel. Commun. Mob. Comput.10:6228513. 10.1155/2022/6228513
49
He M. Wang Y. Wang W. J. Xie Z. (2022). Therapeutic plant landscape design of urban forest parks based on the Five Senses Theory: A case study of Stanley Park in Canada. Int. J. Geoheritage Parks10, 97–112. 10.1016/j.ijgeop.2022.02.004
50
Henseler J. Ringle C. M. Sarstedt M. (2015). A new criterion for assessing discriminant validity in variance-based structural equation modeling.J. Acad. Mark. Sci.43115–135. 10.1007/s11747-014-0403-8
51
Herzog T. R. (1985). A cognitive analysis of preference for waterscapes.J. Environ. Psychol.5225–241. 10.1016/S0272-4944(85)80024-4
52
Heu L. C. Brennecke T. (2023). By yourself, yet not alone: Making space for loneliness.Urban Stud.603187–3197. 10.1177/00420980231169669
53
Hipp J. A. Ogunseitan O. A. (2011). Effect of environmental conditions on perceived psychological restorativeness of coastal parks.J. Environ. Psychol.31421–429. 10.1016/j.jenvp.2011.08.008
54
Hipp J. A. Gulwadi G. B. Alves S. Sequeira S. (2016). The relationship between perceived greenness and perceived restorativeness of university campuses and student-reported quality of life.Environ. Behav.481292–1308. 10.1177/0013916515598200
55
Hipp J. R. Corcoran J. Wickes R. Li T. (2014). Examining the social porosity of environmental features on neighborhood sociability and attachment.PLoS One9:e84544. 10.1371/journal.pone.0084544
56
Holloway L. Hubbard P. (2014). People and Place: The Extraordinary Geographies of Everyday Life.London: Routledge.
57
Honey-Rosés J. Zapata O. (2023). Green spaces with fewer people improve self-reported affective experience and mood.Int. J. Environ. Res. Public Health20:1219. 10.3390/ijerph20021219
58
Hoover K. C. (2009). The geography of smell.Cartogr. Int. J. Geogr. Inf. Geovisual.44237–239. 10.3138/carto.44.4.237
59
Houghton F. Houghton S. (2013). Exploring imagined therapeutic landscapes: Trainee social care practitioners in Ireland.Ir. Geogr.4679–90. 10.1080/00750778.2013.798125
60
Jackson D. L. (2003). Revisiting sample size and number of parameter estimates: Some support for the N: q hypothesis.Struct. Equ. Modeling10128–141. 10.1207/S15328007SEM1001_6
61
Jahani A. Saffariha M. (2020). Aesthetic preference and mental restoration prediction in urban parks: An application of environmental modeling approach.Urban For. Urban Green.54:126775. 10.1016/j.ufug.2020.126775
62
Jeon J. Y. Lee P. J. You J. Kang J. (2010). Perceptual assessment of quality of urban soundscapes with combined noise sources and water sounds.J. Acoust. Soci. Am.127, 1357–1366. 10.1121/1.3298437
63
Jiang X. Larsen L. Sullivan W. (2020). Connections between daily greenness exposure and health outcomes.Int. J. Environ. Res. Public Health17:3965. 10.3390/ijerph17113965
64
Joshi A. Hummel T. (2024). The association between well-being and olfactory sensitivity.J. Sens. Stud.39:e12905. 10.1111/joss.12905
65
Kaiser H. F. (1974). An index of factorial simplicity.Psychometrika3931–36. 10.1007/BF02291575
66
Kaplan M. Haider J. Cohen U. Turner D. (2007). Environmental design perspectives on intergenerational programs and practices: An Emergent conceptual framework.J. Intergener. Relatsh.581–110. 10.1300/J194v05n02_06
67
Kaplan R. Kaplan S. (1989). The Experience of Nature: A Psychological Perspective.Cambridge: Cambridge University press.
68
Kaplan S. (1987). Aesthetics, affect, and cognition: Environmental preference from an evolutionary perspective.Environ. Behav.193–32. 10.1177/0013916587191001
69
Kaplan S. (1995). The restorative benefits of nature: Toward an integrative framework.J. Environ. Psychol.15169–182. 10.1016/0272-4944(95)90001-2
70
Kellert S. R. Wilson E. O. (1995). The Biophilia Hypothesis.Washington, DC: Island Press.
71
Kline R. B. (2023). Principles and Practice of Structural Equation Modeling.New York: Guilford Publications.
72
Kohli A. K. Shervani T. A. Challagalla G. N. (1998). Learning and performance orientation of salespeople: The role of supervisors.J. Mark. Res.35263–274. 10.1177/002224379803500211
73
Koppes L. L. (2014). Historical Perspectives in Industrial and Organizational Psychology.New York: Psychology Press.
74
Kummu M. De Moel H. Ward P. J. Varis O. (2011). How close do we live to water? A global analysis of population distance to freshwater bodies.PLoS One6:e20578. 10.1371/journal.pone.0020578
75
Larkin E. Kaplan M. S. Rushton S. (2010). Designing brain healthy environments for intergenerational programs.J. Intergener. Relatsh.8161–176. 10.1080/15350771003741956
76
Laumann K. GÄRling T. Stormark K. M. (2001). Rating scale measures of restorative components of environments.J. Environ. Psychol.2131–44. 10.1006/jevp.2000.0179
77
Lecic-Tosevski D. (2019). Is urban living good for mental health?Curr. Opin. Psychiatr.32204–209. 10.1097/YCO.0000000000000489
78
Lee L. (2017). “Ecological aesthetics perspective for coastal wetland conservation,” in Coastal Wetlands: Alteration and Remediation, edsFinklC. W.MakowskiC. (Cham: Springer), 455–478.
79
Lee L.-H. (2017). Perspectives on landscape aesthetics for the ecological conservation of wetlands.Wetlands37381–389. 10.1007/s13157-016-0873-1
80
Lewicka M. (2011). Place attachment: How far have we come in the last 40 years?J. Environ. Psychol.31207–230. 10.1016/j.jenvp.2010.10.001
81
Li J. Trivic Z. (2024). Impact of “blue-green diet” on human health and wellbeing: A systematic review of potential determinants in shaping the effectiveness of blue-green infrastructure (BGI) in urban settings.Sci. Total Environ.926:171397. 10.1016/j.scitotenv.2024.171397
82
Li L. Lange K. W. (2023). Assessing the relationship between urban blue-green infrastructure and stress resilience in real settings: A systematic review.Sustainability15:9240. 10.3390/su15129240
83
Li S. Chen T. Chen F. Mi F. (2023). How does the urban forest environment affect the psychological restoration of Residents? A natural experiment in environmental perception from beijing.Forests14:22. 10.3390/f14101986
84
Liu F. Liu P. Kang J. Meng Q. Wu Y. Yang D. (2022). Relationships between landscape characteristics and the restorative quality of soundscapes in urban blue spaces.Appl. Acoust.189:108600. 10.1016/j.apacoust.2021.108600
85
Liu Y. Wang R. Grekousis G. Liu Y. Yuan Y. Li Z. (2019). Neighbourhood greenness and mental wellbeing in Guangzhou, China: What are the pathways?Landsc. Urban Plan.190:103602. 10.1016/j.landurbplan.2019.103602
86
Liu Y. Wang R. Lu Y. Li Z. Chen H. Cao M. et al (2020). Natural outdoor environment, neighbourhood social cohesion and mental health: Using multilevel structural equation modelling, streetscape and remote-sensing metrics.Urban For. Urban Green.48:126576. 10.1016/j.ufug.2019.126576
87
Lovell R. Wheeler B. W. Higgins S. L. Irvine K. N. Depledge M. H. (2014). A systematic review of the health and well-being benefits of biodiverse environments.J. Toxicol. Env. Health B Crit. Rev.171–20. 10.1080/10937404.2013.856361
88
Luo S. Xie J. Furuya K. (2023). Effects of perceived physical and aesthetic quality of urban blue spaces on user preferences-A case study of three urban blue spaces in Japan.Heliyon9:e15033. 10.1016/j.heliyon.2023.e15033
89
Marselle M. R. Irvine K. N. Lorenzo-Arribas A. Warber S. L. (2015). Moving beyond green: Exploring the relationship of environment type and indicators of perceived environmental quality on emotional well-being following group walks.Int. J. Environ. Res. Public Health12106–130. 10.3390/ijerph120100106
90
Maund P. R. Irvine K. N. Reeves J. Strong E. Cromie R. Dallimer M. et al (2019). Wetlands for wellbeing: Piloting a nature-based health intervention for the management of anxiety and depression.Int. J. Environ. Res. Public Health16:4413. 10.3390/ijerph16224413
91
McDougall C. W. Hanley N. Quilliam R. S. Oliver D. M. (2022). Blue space exposure, health and well-being: Does freshwater type matter?Landsc. Urban Plan.224:104446. 10.1016/j.landurbplan.2022.104446
92
McDougall C. W. Quilliam R. S. Hanley N. Oliver D. M. (2020). Freshwater blue space and population health: An emerging research agenda.Sci. Total Environ.737:140196.
93
Mehrabian A. Russell J. A. (1974). An Approach to Environmental Psychology.Cambridge, MA: MIT Press.
94
Mishra H. S. Bell S. Roberts B. R. White M. P. (2023). Theory-based design for promoting positive behaviours in an urban blue space: Pre-and-post observations of a community co-created intervention in Plymouth, United Kingdom.Landsc. Urban Plan.233:104708. 10.1016/j.landurbplan.2023.104708
95
Mitchell R. Popham F. (2008). Effect of exposure to natural environment on health inequalities: An observational population study.Lancet3721655–1660. 10.1016/S0140-6736(08)61689-X
96
Nelischer C. Loukaitou-Sideris A. (2023). Intergenerational public space design and policy: A review of the literature.J. Plan. Lit.3819–32. 10.1177/08854122221092175
97
Nguyen P. Y. Astell-Burt T. Rahimi-Ardabili H. Feng X. (2021). Green space quality and health: A systematic review.Int. J. Environ. Res. Public Health18:11028. 10.3390/ijerph182111028
98
Nicolosi V. Wilson J. Yoshino A. Viren P. (2021). The restorative potential of coastal walks and implications of sound.J. Leis. Res.5241–61. 10.1080/00222216.2020.1741329
99
Ning F. Wang H. Chien Y.-C. Pan H. Ou S.-J. (2024). An investigation into the shifting landscape preferences of rural residents in Taiwan and their relationship with ecological indicators.Sci. Rep.14:27893. 10.1038/s41598-024-77045-x
100
Nutsford D. Pearson A. L. Kingham S. Reitsma F. (2016). Residential exposure to visible blue space (but not green space) associated with lower psychological distress in a capital city.Health Place3970–78. 10.1016/j.healthplace.2016.03.002
101
Pennycook A. Otsuji E. (2015). Making scents of the landscape.Linguist. Landsc. Int. J.1191–212. 10.1075/ll.1.3.01pen
102
Pflüger Y. Rackham A. Larned S. (2010). The aesthetic value of river flows: An assessment of flow preferences for large and small rivers.Landsc. Urban Plan.9568–78. 10.1016/j.landurbplan.2009.12.004
103
Pijanowski B. C. Farina A. Gage S. H. Dumyahn S. L. Krause B. L. (2011). What is soundscape ecology? An introduction and overview of an emerging new science.Landsc. Ecol.261213–1232. 10.1007/s10980-011-9600-8
104
Pitt H. (2018). Muddying the waters: What urban waterways reveal about bluespaces and wellbeing.Geoforum92161–170. 10.1016/j.geoforum.2018.04.014
105
Pleson E. Nieuwendyk L. M. Lee K. K. Chaddah A. Nykiforuk C. I. J. Schopflocher D. (2014). Understanding older adults’ usage of community green spaces in Taipei, Taiwan.Int. J. Environ. Res. Public Health111444–1464. 10.3390/ijerph110201444
106
Reece R. Elliott L. Bray I. Bornioli A. (2024). How properties of urban greenspaces shape well-being across age groups: A qualitative study.Wellbeing Space Soc.7:100206. 10.1016/j.wss.2024.100206
107
Rigolon A. Derr V. Chawla L. (2015). “Green grounds for play and learning: An intergenerational model for joint design and use of school and park system,” in Handbook on Green Infrastructure: Planning, Design and Implementation, edsSinnettD.SmithN.BurgessS. (Cheltenham: Edward Elgar), 281–300.
108
Rugel E. J. Henderson S. B. Carpiano R. M. Brauer M. (2017). Beyond the normalized difference vegetation index (NDVI): Developing a natural space index for population-level health research.Environ. Res.159474–483. 10.1016/j.envres.2017.08.033
109
Sallis J. F. Cervero R. B. Ascher W. Henderson K. A. Kraft M. K. Kerr J. (2006). An ecological approach to creating active living communities.Annu. Rev. Public Health27297–322. 10.1146/annurev.publhealth.27.021405.102100
110
Sarstedt M. Ringle C. M. Hair J. F. (2021). “Partial least squares structural equation modeling,” in Handbook of Market Research, edsHomburgC.KlarmannM. (Cham: Springer), 587–632.
111
Schebella M. F. Weber D. Schultz L. Weinstein P. (2019). The wellbeing benefits associated with perceived and measured biodiversity in australian urban green spaces.Sustainability11:802. 10.3390/su11030802
112
Simon H. A. (1979). Models of Thought.New Haven, CT: Yale University Press.
113
Smith N. Georgiou M. King A. C. Tieges Z. Webb S. Chastin S. (2021). Urban blue spaces and human health: A systematic review and meta-analysis of quantitative studies.Cities119:103413. 10.1016/j.cities.2021.103413
114
Sonti N. F. Campbell L. K. Svendsen E. S. Johnson M. L. Auyeung D. S. N. (2020). Fear and fascination: Use and perceptions of New York City’s forests, wetlands, and landscaped park areas.Urban For. Urban Green.49:126601. 10.1016/j.ufug.2020.126601
115
Steinwender A. Gundacker C. Wittmann K. J. (2008). Objective versus subjective assessments of environmental quality of standing and running waters in a large city.Landsc. Urban Plan.84116–126. 10.1016/j.landurbplan.2007.07.001
116
Tan R. Wu Y. Zhang S. (2024). Walking in tandem with the city: Exploring the influence of public art on encouraging urban pedestrianism within the 15-minute community living circle in Shanghai.Sustainability16:3839. 10.3390/su16093839
117
Thang L. L. Kaplan M. S. (2013). “Intergenerational pathways for building relational spaces and places,” in Environmental Gerontology: Making Meaningful Places in Old Age, edsRowlesG. D.BernardM. (New York: Springer Publishing Company), 225–251.
118
Thompson Coon J. Boddy K. Stein K. Whear R. Barton J. Depledge M. H. (2011). Does participating in physical activity in outdoor natural environments have a greater effect on physical and mental wellbeing than physical activity indoors? A systematic review.Environ. Sci. Technol.451761–1772. 10.1021/es102947t
119
Thrift N. (2003). “All nose,” in Handbook of Cultural Geography, edsAndersonK.DomoshM.PileS.ThriftN. (London: Sage Publications), 9–14.
120
Tillmann S. Tobin D. Avison W. Gilliland J. (2018). Mental health benefits of interactions with nature in children and teenagers: A systematic review.J. Epidemiol. Community Health72958–966. 10.1136/jech-2018-210436
121
Twohig-Bennett C. Jones A. (2018). The health benefits of the great outdoors: A systematic review and meta-analysis of greenspace exposure and health outcomes.Environ. Res.166628–637. 10.1016/j.envres.2018.06.030
122
Ulrich R. S. (1983). “Aesthetic and affective response to natural environment,” in Behavior and the Natural Environment, edsAltmanI.WohlwillJ. F. (Cham: Springer), 85–125.
123
Ulrich R. S. Simons R. F. Losito B. D. Fiorito E. Miles M. A. Zelson M. (1991). Stress recovery during exposure to natural and urban environments.J. Environ. Psychol.11201–230. 10.1016/s0272-4944(05)80184-7
124
UN-Habitat. (2016). World Cities Report 2016: Urbanization and Development–Emerging Futures.Nairobi: United Nations Human Settlements Programme.
125
Vaeztavakoli A. Lak A. Yigitcanlar T. (2018). Blue and green spaces as therapeutic landscapes: Health effects of urban water canal areas of Isfahan.Sustainability10:4010. 10.3390/su10114010
126
Van den Berg A. E. Hartig T. Staats H. (2007). Preference for nature in urbanized societies: Stress, restoration, and the pursuit of sustainability.J. Soc. Issues6379–96. 10.1111/j.1540-4560.2007.00497.x
127
Van der Jagt A. P. N. Craig T. Anable J. Brewer M. J. Pearson D. G. (2014). Unearthing the picturesque: The validity of the preference matrix as a measure of landscape aesthetics.Landsc. Urban Plan.1241–13. 10.1016/j.landurbplan.2013.12.006
128
Ventriglio A. Torales J. Castaldelli-Maia J. M. De Berardis D. Bhugra D. (2021). Urbanization and emerging mental health issues.CNS Spectr.2643–50. 10.1017/S1092852920001236
129
Villeneuve P. J. Jerrett M. Su J. G. Burnett R. T. Chen H. Wheeler A. J. et al (2012). A cohort study relating urban green space with mortality in Ontario.Canada. Environ. Res.11551–58. 10.1016/j.envres.2012.03.003
130
Völker S. Kistemann T. (2011). The impact of blue space on human health and well-being – Salutogenetic health effects of inland surface waters: A review.Int. J. Hyg. Environ. Health214449–460. 10.1016/j.ijheh.2011.05.001
131
Völker S. Kistemann T. (2015). Developing the urban blue: Comparative health responses to blue and green urban open spaces in Germany.Health Place35196–205. 10.1016/j.healthplace.2014.10.015
132
Völker S. Heiler A. Pollmann T. Classen T. Hornberg C. Kistemann T. (2018). Do perceived walking distance to and use of urban blue spaces affect self-reported physical and mental health?Urban For. Urban Green.291–9. 10.1016/j.ufug.2017.10.014
133
Wang R. Yuan Y. Liu Y. Zhang J. Liu P. Lu Y. et al (2019). Using street view data and machine learning to assess how perception of neighborhood safety influences urban residents’ mental health.Health Place59:102186. 10.1016/j.healthplace.2019.102186
134
Wang Y. Yang G. Lu Y. (2023). Evaluation of urban wetland landscapes based on a comprehensive model — A comparative study of three urban wetlands in Hangzhou, China.Environ. Res. Commun.5:035004. 10.1088/2515-7620/acbf12
135
Warren J. P. Santello M. Helms Tillery S. I. (2011). Effects of fusion between tactile and proprioceptive inputs on tactile perception.PLoS One6:e18073. 10.1371/journal.pone.0018073
136
Washington T. L. Cushing D. F. Mackenzie J. Buys L. Trost S. (2019). Fostering social sustainability through intergenerational engagement in Australian neighborhood parks.Sustainability11:4435. 10.3390/su11164435
137
White M. P. Alcock I. Wheeler B. W. Depledge M. H. (2013). Would you be happier living in a greener urban area? A fixed-effects analysis of panel data.Psychol. Sci.24920–928. 10.1177/0956797612464659
138
White M. P. Elliott L. R. Gascon M. Roberts B. Fleming L. E. (2020). Blue space, health and well-being: A narrative overview and synthesis of potential benefits [Review].Environ. Res.191:110169. 10.1016/j.envres.2020.110169
139
White M. Smith A. Humphryes K. Pahl S. Snelling D. Depledge M. (2010). Blue space The importance of water for preference, affect, and restorativeness ratings of natural and built scenes.J. Environ. Psychol.30482–493. 10.1016/j.jenvp.2010.04.004
140
Whitmee S. Haines A. Beyrer C. Boltz F. Capon A. G. de Souza Dias B. F. et al (2015). Safeguarding human health in the Anthropocene epoch: Report of The Rockefeller Foundation–Lancet Commission on planetary health.Lancet3861973–2028. 10.1016/S0140-6736(15)60901-1
141
World Health Organization. (1948). Preamble to the Constitution of the World Health Organization as Adopted by the International Health Conference, New York, 19-22 June, 1946; signed on 22 July 1946 by the Representatives of 61 States (Official Records of the World Health Organization, no. 2, p. 100) and Entered into Force on 7 April 1948.Geneva: WHO.
142
World Health Organization. (1980). Environmental Sanitation in European Tourism Areas. Copenhagen: WHO Regional Office for Europe (EURO Reports and Studies No. 18), 33. Geneva: WHO.
143
World Health Organization. (2022). World Mental Health report: Transforming Mental Health for All.Geneva: World Health Organization.
144
Wu S. J. Ng E. Lin K. B. Cheng Y. H. Lepage B. A. Fang W. T. (2023). Influence of landscape preference and place attachment on responsible environmental behavior-A study of Taipei’s Guandu Nature Park Wetlands.Taiwan. Land.12:2036. 10.3390/land12112036
145
Wu S. Wong I. A. Lin Z. (2021). Understanding the role of atmospheric cues of travel apps: A synthesis between media richness and stimulus-organism-response theory.J. Hosp. Tour. Manag.49226–234. 10.1016/j.jhtm.2021.09.014
146
Xie X. Qiao J. Wang R. Gou Z. (2024). Correlation between vegetation landscape and subjective human perception: A systematic review.Buildings14:1734. 10.3390/buildings14061734
147
Xiong H. X. Zhang J. Ye B. J. Zheng X. Sun P. Z. (2012). Modelling the impact of common methodological variation and its statistical control pathways.Adv. Psychol. Sci.20757–769.
148
Yakinlar N. Akpinar A. (2022). How perceived sensory dimensions of urban green spaces are associated with adults’ perceived restoration, stress, and mental health?Urban For. Urban Green.72:127572. 10.1016/j.ufug.2022.127572
149
Yan C. Cai X. Wu Y. Tang X. Zhou Y. Yang Q. et al (2023). How do urban waterfront landscape characteristics influence people’s emotional benefits? Mediating effects of water-friendly environmental preferences.Forests15:25. 10.3390/f15010025
150
Yang X. Fan Y. Xia D. Zou Y. Deng Y. (2023). Elderly residents’ uses of and preferences for community outdoor spaces during heat periods.Sustainability15:11264.
151
Yen H.-Y. Chiu H.-L. Huang H.-Y. (2021). Green and blue physical activity for quality of life: A systematic review and meta-analysis of randomized control trials.Landsc. Urban Plan.212:104093. 10.1016/j.landurbplan.2021.104093
152
Yeo N. L. Elliott L. R. Bethel A. White M. P. Dean S. G. Garside R. (2020). Indoor nature interventions for health and wellbeing of older adults in residential settings: A systematic review.Gerontologist60e184–e199. 10.1093/geront/gnz019
153
Yerrell P. (2008). National Evaluation of BTCV’s Green Gym.Oxford: Oxford Brookes University.
154
You J. Lee P. J. Jeon J. Y. (2010). Evaluating water sounds to improve the soundscape of urban areas affected by traffic noise. Noise Control Eng. J.58, 477–483. 10.3397/1.3484183
155
Yung E. H. K. Wang S. Chau C.-K. (2019). Thermal perceptions of the elderly, use patterns and satisfaction with open space.Landsc. Urban Plan.18544–60. 10.1016/j.landurbplan.2019.01.003
156
Zhang T. Liu J. Li H. (2019). Restorative effects of multi-sensory perception in urban green space: A case study of urban park in Guangzhou, China.Int. J. Environ. Res. Public Health16:4943. 10.3390/ijerph16244943
157
Zhang X. Zhang Y. Zhai J. Wu Y. Mao A. (2021). Waterscapes for promoting mental health in the general population.Int. J. Environ. Res. Public Health18:11792. 10.3390/ijerph182211792
158
Zhang Y. Huang Y. Zheng M. Zhang H. Zhang Q. He T. et al (2024). A study on the characteristics and influencing factors of soundscape perception in landscape spaces of urban greenways.Forests15:670. 10.3390/f15040670
159
Zhao M. Zhang Y. (2024). Exploring the dose-response of landscape preference: A case study in Singapore.Appl. Geogr.170:103357. 10.1016/j.apgeog.2024.103357
Summary
Keywords
urban blue space, stimulus-organism-response theory, sensory perception, well-being, structural equation modeling
Citation
Lu P, Sani NM, Li Y and Wang Y (2025) How does urban blue space affect human well-being? A study based on the stimulus-organism-response theory. Front. Psychol. 16:1553296. doi: 10.3389/fpsyg.2025.1553296
Received
30 December 2024
Accepted
19 March 2025
Published
09 April 2025
Volume
16 - 2025
Edited by
Richard Elliot Wener, New York University, United States
Reviewed by
Shixian Luo, Southwest Jiaotong University, China
Kirren Chana, University of Vienna, Austria
Updates
Copyright
© 2025 Lu, Sani, Li and Wang.
This is an open-access article distributed under the terms of the Creative Commons Attribution License (CC BY). The use, distribution or reproduction in other forums is permitted, provided the original author(s) and the copyright owner(s) are credited and that the original publication in this journal is cited, in accordance with accepted academic practice. No use, distribution or reproduction is permitted which does not comply with these terms.
*Correspondence: Norazmawati Md. Sani, norazmawati@usm.my
Disclaimer
All claims expressed in this article are solely those of the authors and do not necessarily represent those of their affiliated organizations, or those of the publisher, the editors and the reviewers. Any product that may be evaluated in this article or claim that may be made by its manufacturer is not guaranteed or endorsed by the publisher.