Abstract
Objective:
Numerous studies suggest that hypnosis has significant potential in mental health and cognitive disorder treatments. However, the mechanisms by which hypnosis influences brain activity and functional network connectivity remain unclear. This study employed functional near-infrared spectroscopy (fNIRS) to investigate resting-state functional connectivity (rsFC) under hypnosis.
Methods:
Twenty-six healthy college students participated in the study. Resting-state oxygenated hemoglobin (HbO) data were collected from the prefrontal cortex (PFC) during both control aware and hypnotic states. Functional connectivity strengths between these states were analyzed to assess changes in brain activity associated with deep hypnosis.
Results:
A total of 55 paired samples t-tests were conducted across 11 regions of interest (ROIs), revealing statistically significant differences (p < 0.05) in functional connectivity strength between the control state and hypnotic state in 10 paired comparisons. Increased connectivity during hypnosis (6 pairs): LBA9-RBA10 (t = −2.672, p = 0.013), LBA6-RBA46 (t = −2.948, p = 0.007), LBA46-RBA46 (t = −2.516, p = 0.019), RBA8-RBA46 (t = −2.689, p = 0.013), RBA9-RBA46 (t = −2.090, p = 0.047), LBA10-RBA10 (t = −2.315, p = 0.029); Decreased connectivity during hypnosis (4 pairs): LBA9-LBA45 (t = 2.064, p = 0.049), LBA6-LBA45 (t = 3.151, p = 0.004), LBA8-LBA45 (t = 2.438, p = 0.022), LBA8-RBA9 (t = 2.085, p = 0.047). No significant differences were observed in connectivity strength between other ROI pairs.
Conclusion:
Hypnosis appears to modulate the function of the DLPFC, PFC, and related regions, enhancing specific brain network functional connectivity. This preliminary study demonstrates that resting-state functional connectivity analysis using fNIRS is a valuable approach for studying brain activity during hypnosis.
1 Introduction
Hypnosis is a therapeutic technique in which practitioners utilize specialized methods (e.g., relaxation and monotonous sensory stimuli) to induce a distinct altered state of consciousness distinct from sleep. Through hypnosis, individuals may access deeper unconscious processes and perceive mental content typically outside ordinary awareness. The application of hypnosis in human history spans over 250 years, tracing its origins to Franz Mesmer’s early explorations (Peter, 2024). Empirical evidence suggests that deep hypnotic states can rapidly alleviate psychological distress, enhance physical health, and improve quality of life. Hypnosis demonstrates particular efficacy in treating psychosomatic disorders and sleep-related pathologie (Chamine et al., 2018; Flammer and Alladin, 2007; Geagea et al., 2023). Notably, studies indicate heightened therapeutic responsiveness to hypnosis in children and adolescents (Rosendahl et al., 2023), potentially attributable to developmental differences in hypnotic suggestibility.
Although numerous studies have confirmed the positive effects of hypnosis in therapy and mental health, many people remain skeptical of it (Geagea et al., 2023). These misconceptions may stem from a lack of understanding or exposure to misleading information. Therefore, it is necessary to enhance public awareness and comprehension of hypnosis through further empirical research and science-based education, grounded in scientific evidence.
The advancement of neuroimaging has opened up new investigative avenues for hypnosis research. While cutting-edge techniques such as functional magnetic resonance imaging (fMRI) have been widely adopted in this domain, current neuroimaging characterizations of hypnosis demonstrate heterogeneous patterns of cerebral activation rather than a unified neural signature (Landry et al., 2017).
Hypnotic induction may correlate with increased activity in the left orbitofrontal cortex (OFC) (Aleksandrowicz et al., 2006), while hypnosis appears to enhance functional connectivity between the precuneus and the right dorsolateral prefrontal cortex (dlPFC), angular gyrus, and dorsal precuneus (Pyka et al., 2011; Wolf et al., 2022). Comparative studies on brain network connectivity during wakefulness versus hypnosis reveal significantly heightened connectivity in the dorsal attention network (DAN), salience network (SAN), and somatomotor network (SMN) during hypnotic states (Vazquez et al., 2024).
Divergent findings exist regarding default mode network (DMN) connectivity during hypnosis (McGeown et al., 2009; Sim et al., 2024), with some studies reporting reduced connectivity and others showing opposing trends (Demertzi et al., 2011).
These inconsistencies may stem from methodological factors, including fMRI’s inherent limitations (e.g., high noise levels, low motion tolerance) and variability in hypnotic protocols. Future investigations should integrate the psychosocial dimensions of hypnosis and employ multimodal neuroimaging approaches (Farahzadi and Kekecs, 2021; McGeown et al., 2009).
Functional near-infrared spectroscopy (fNIRS) is an advanced non-invasive brain imaging technology that primarily utilizes the differential absorption properties of hemoglobin in the 600–900 nm near-infrared wavelength range to measure real-time changes in cortical blood oxygen concentration, thereby indirectly reflecting brain activity. Due to its portability, high ecological validity, low cost, and tolerance to motion, fNIRS has been widely applied in brain function research (Halsband and Gerhard Wolf, 2019; Zhang et al., 2020).
Resting-state functional connectivity (rsFC) refers to the temporal synchronization of low-frequency spontaneous neural activity between different brain regions during a task-free resting state (Rainville et al., 2019; Vazquez et al., 2024). Unlike task-based analyses, rsFC does not focus on specific cognitive processes and is not constrained by external stimuli. Thus, it reveals the intrinsic functional architecture of the brain, reflecting general functional relationships between different regions (De Pascalis, 2024; Demertzi et al., 2011; Pyka et al., 2011). Resting-state functional connectivity analysis is crucial for understanding the fundamental mechanisms of brain function.
In this study, we employed fNIRS to record and observe changes in brain functional networks during hypnosis, comparing characteristic parameter differences between the control (awake) state and the hypnotic state. This approach provides scientific evidence for a deeper understanding of the intrinsic neural mechanisms underlying hypnosis.
Compared to fMRI, fNIRS offers unique advantages in hypnosis research, including higher ecological validity, long-term monitoring capability, lower cost, and easier reproducibility. In this study, we utilize fNIRS to track and analyze alterations in brain functional networks under both control and hypnotic conditions. By examining key network metrics across these states, we aim to establish a systematic framework for elucidating the intrinsic brain mechanisms of hypnosis.
2 Objects and methods
2.1 Study subjects
This study recruited 50 students (Mean age = 24.3 years, SD = 2.46 years). All participants had no history of psychiatric or neurological disorders, provided informed consent prior to the experiment, and received remuneration afterward. The study was approved by the Ethics Committee of Huaibei Normal University (Ethical Approval Number: HBSD2024-20). Of the 50 participants, 10 did not enter a hypnotic state, and 14 had poor data quality. Consequently, the final analysis included data from 26 participants.
2.2 Test procedure
The experimental protocol was conducted in a dedicated acoustically shielded chamber. Participants wearing functional near-infrared spectroscopy (fNIRS) devices were positioned in a semi-recumbent posture on an ergonomic recliner. The formal procedure commenced with an initial 3-min resting-state data acquisition during the controlled conscious condition. Subsequently, a certified hypnotherapist conducted a 20-min standardized hypnotic induction protocol. Following 15 min of sustained hypnosis, a 3-min silent interval was implemented to capture resting-state neural signatures under deep hypnotic state (Table 1). The session concluded with systematic dehypnotization procedures and participant debriefing.
Table 1
| Experimental stages | Time parameters | Operational protocols | Data acquisition |
|---|---|---|---|
| Baseline phase | 3 min | Eyes-closed rest | rsfC data collection |
| Hypnotic induction | 10 min | Progressive relaxation technique (standardized script) | – |
| Hypnotic deepening | 5 min | Elevator deepening technique (standardized script) | – |
| Resting phase | 3 min | No external stimuli | rsfC data collection |
| Awakening | 2 min | Counting awakening method | – |
Experimental schedule table.
After the hypnosis session, the experimenter conducted verbal inquiries (such as about relaxation level, brain activity, and bodily sensations) to confirm whether the participants had entered the hypnotic state. The 10 participants who did not enter hypnosis were excluded from the data analysis.
2.3 fNIRS data acquisition and channel localization
The fNIRS device used in this study was the Brite_24 system (Artinis Medical Systems, The Netherlands), with a sampling frequency of 25 Hz and wavelengths of 762 nm and 854 nm. The fNIRS channel layout consisted of 10 emitting electrodes (Tx1-Tx10, yellow dots) and 8 receiving electrodes (Rx1-Rx8, blue dots) for a total of 27 channels with a spacing of 3 cm (Figure 1). Data acquisition was conducted using the Oxysoft (3.4.13.1) software, and the raw light intensity signals were converted to the oxygenated hemoglobin (HbO), deoxygenated hemoglobin (HbR), and total hemoglobin (HbT) data based on the modified Beer–Lambert Law (Kocsis et al., 2006).
Figure 1
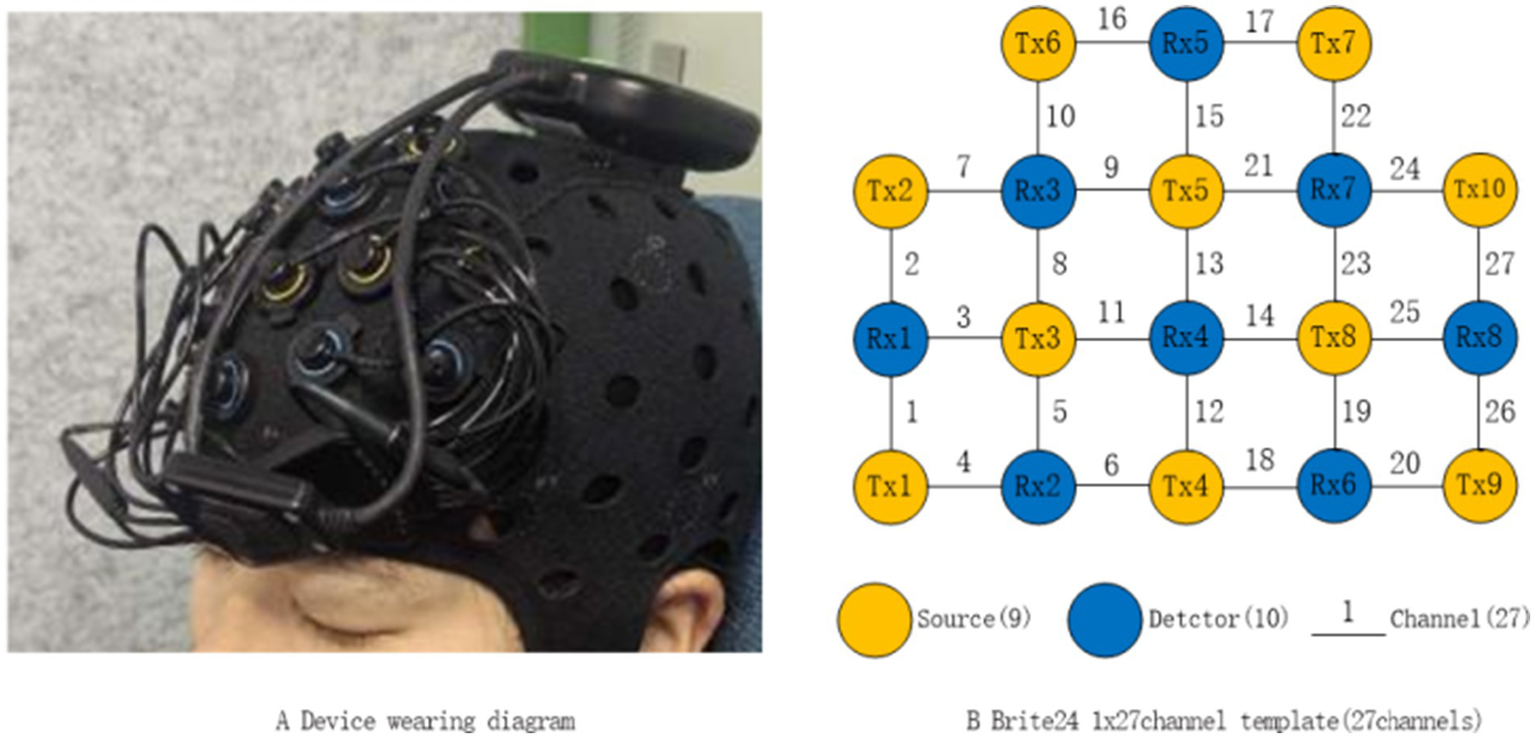
Schematic diagram of channel layout.
The nasal root (Nz), the left anterior point (AL), the right anterior point (AR), the central point (Cz), the occipital protrusion (Iz), and the optical electrode and channel coordinates were determined by the MATLAB-based NIRS_SPM toolkit to obtain the corresponding relationship to the Brudmann partition (BrodmannArea, MRIcro) (Tables 2, 3; Figure 2) (Chul et al., 2009; Singh et al., 2005).
Table 2
| Channel | Brodmann division | Coordinate MNI | Coverage probability | ||
|---|---|---|---|---|---|
| x | y | z | |||
| CH01 | * 9-Dorsolateral prefrontal cortex | −48.74 | 33.56 | 58.39 | 0.89 |
| CH02 | 45-Triangle District of Broca | −55.77 | 45.34 | 36.27 | 0.82 |
| CH03 | * 9-Dorsolateral prefrontal cortex | −39.10 | 44.26 | 58.75 | 0.80 |
| CH04 | * 6-Premotor cortex and the auxiliary motor cortex | −33.95 | 26.09 | 74.78 | 0.86 |
| CH05 | * 8-frontal eye region | −24.50 | 33.91 | 75.39 | 0.96 |
| CH06 | * 6-Premotor cortex and the auxiliary motor cortex | −11.52 | 17.87 | 86.65 | 0.98 |
| CH07 | * 46-Dorsolateral prefrontal cortex | −43.67 | 59.04 | 37.39 | 0.86 |
| CH08 | * 9-Dorsolateral prefrontal cortex | −25.87 | 54.89 | 58.96 | 0.93 |
| CH09 | * 9-Dorsolateral prefrontal cortex | −15.46 | 62.49 | 55.84 | 1.00 |
| CH10 | * 46-Dorsolateral prefrontal cortex | −29.48 | 70.49 | 35.29 | 0.56 |
| CH11 | * 8-frontal eye region | −12.56 | 45.23 | 72.50 | 0.94 |
| CH12 | * 6-Premotor cortex and the auxiliary motor cortex | −1.36 | 27.62 | 83.50 | 0.54 |
| CH13 | * 8-frontal eye region | −3.09 | 50.57 | 69.71 | 0.81 |
| CH14 | * 8-frontal eye region | 8.70 | 47.74 | 70.93 | 0.87 |
| CH15 | * 9-Dorsolateral prefrontal cortex | −4.11 | 69.47 | 49.61 | 0.91 |
| CH16 | * 10-Prefrontal cortex | −18.06 | 78.53 | 26.91 | 1.00 |
| CH17 | * 10-Prefrontal cortex | 11.35 | 79.70 | 27.24 | 1.00 |
| CH18 | * 6-Premotor cortex and the auxiliary motor cortex | 9.44 | 17.54 | 86.79 | 1.00 |
| CH19 | * 8-frontal eye region | 19.03 | 40.82 | 72.48 | 0.99 |
| CH20 | * 8-frontal eye region | 31.44 | 27.71 | 74.22 | 0.92 |
| CH21 | 9-found in the dorsolateral prefrontal cortex | 8.64 | 63.79 | 55.81 | 0.98 |
| CH22 | * 10-Prefrontal cortex | 21.87 | 73.35 | 34.39 | 0.67 |
| CH23 | * 9-Dorsolateral prefrontal cortex | 18.02 | 58.56 | 58.40 | 0.95 |
| CH24 | * 46-Dorsolateral prefrontal cortex | 35.20 | 63.15 | 39.44 | 0.53 |
| CH25 | * 9-Dorsolateral prefrontal cortex | 34.41 | 50.71 | 55.32 | 0.94 |
| CH26 | * 9-Dorsolateral prefrontal cortex | 44.38 | 38.92 | 56.50 | 0.81 |
| CH27 | * 46-Dorsolateral prefrontal cortex | 46.47 | 52.98 | 38.87 | 0.59 |
| Nz | 3.25 | 82.08 | −43.36 | ||
| Iz | −0.27 | −116.63 | −29.55 | ||
| RPA | 78.86 | −13.09 | −47.18 | ||
| LPA | −80.87 | −13.10 | −46.76 | ||
| Cz | 0.65 | −12.86 | 96.78 | ||
Plot of the channel position.
* indicates region of interest (ROI, Region of Interest).
Table 3
| Encephalic region | Encephalic region | Channel |
|---|---|---|
| *L_BA6 | Premotor cortex and the auxiliary motor cortex | CH04, CH06, CH12 |
| *R_BA6 | Premotor cortex and the auxiliary motor cortex | CH18 |
| *L_BA8 | Frontal eye movement area | CH05, CH11, CH13 |
| *R_BA8 | Frontal eye movement area | CH14, CH19, CH20 |
| *L_BA9 | Dorsolateral prefrontal cortex | CH01, CH03, CH08, CH09, CH15 |
| *R_BA9 | Dorsolateral prefrontal cortex | CH21, CH23, CH25, CH26 |
| *L_BA10 | Prefrontal cortex | CH16 |
| *R_BA10 | Prefrontal cortex | CH17, CH22 |
| *L_BA46 | Dorsolateral prefrontal cortex | CH07, CH10 |
| *R_BA46 | Dorsolateral prefrontal cortex | CH24, CH27 |
| L_BA45 | Triangle District of Broca District | CHO2 |
Detects the brain regions and the corresponding channels.
CH, channel; * indicates the region of interest (ROI, Region of Interest).
Figure 2
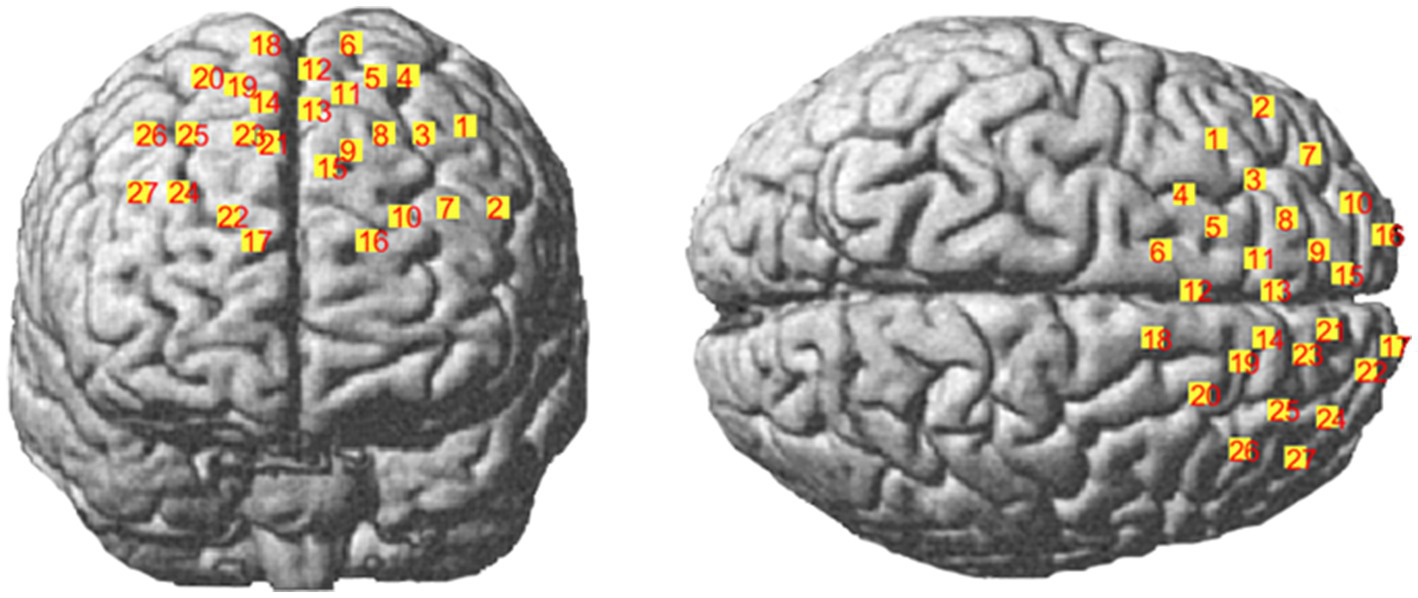
Schematic diagram of spatial coordinate localization.
2.4 fNIRS data analysis
2.4.1 Data preprocessing
Data preprocessing was carried out using the NIRS_KIT toolkit (MATLAB R2022b) (Hou et al., 2021). The data quality was initially assessed using the Data Viewer module of NIRS_KIT, which allowed for the identification and exclusion of subject data with poor channel signal quality. A total of 14 subjects were excluded based on this criterion.
The preprocessing module of NIRS_KIT was then used to process the data as follows:
(1) First, Data Trimming: the first and last minute of the data were removed to eliminate potential edge effects.; (2) Next, Detrending: linear or nonlinear trends were estimated using polynomial regression models and then subtracted from the original hemoglobin concentration signals; (3) Motion Correction: the Temporal Derivative Distribution Repair (TDDR) method was applied to correct motion artifacts based on the time-derivative distribution; (4) Filtering: A third-order infinite impulse response (IIR) band-pass filter was applied with a frequency range set between 0.01 and 0.08 Hz to remove general noise, including heartbeat, breathing, and Merwave (Xu et al., 2023; Lu et al., 2010; Yijing Luo et al., 2024). After preprocessing, the resting-state concentration values for HbO, HbR, and HbT were obtained.
2.4.2 Analysis of functional connectivity
In the Functional Connectivity module of NIRS_KIT software, each region of interest (ROI) was defined according to the groupings listed in Table 2. The average time series for each ROI was first calculated based on the relative concentration changes of HbO over time. Next, the Pearson correlation coefficient between the time series of two ROIs was computed, followed by Fisher-Z transformation. The resulting Z value was defined as the functional connectivity (ROI2ROI) strength between the two ROIs.
2.4.3 Statistical methods
In the Group-level Statistics module of NIRS_KIT software, paired-sample t-test was performed on the mean value of functional connectivity strength of the two states on each brain network time series. Then, FDR (False Discovery Rate) correction method was used to correct the p value after multiple comparisons.
3 Results
After conducting paired-sample t-tests on 55 pairs across 11 ROIs, 10 pairs showed significant differences in connectivity strength between the awake and hypnotic states (p < 0.05). Specifically, the connectivity strength in the hypnotic state was significantly higher than in the control state for 6 pairs: LBA9-RBA10, LBA6-RBA46, LBA46-RBA46, RBA8-RBA46, RBA9-RBA46, and LBA10-RBA10. Conversely, for 4 pairs, i.e., LBA9-LBA45, LBA6-LBA45, LBA8-LBA45, and LBA8-RBA9, the connectivity strength in the hypnotic state was significantly lower than in the control state. No significant differences in connectivity strength were found for other ROI pairs (Table 4).
Table 4
| Paired channel | Paired BA | Stat | P(FDR) | Sig |
|---|---|---|---|---|
| CH01, CH03, CH08, CH09, CH15-CHO2 | L_BA9-L_BA45 | 2.064 | 0.049 | 1 |
| CH01, CH03, CH08, CH09, CH15-CH17, CH22 | L_BA9-R_BA10 | −2.672 | 0.013 | 1 |
| CH04, CH06, CH12-CHO2 | L_BA6-L_BA45 | 3.151 | 0.004 | 1 |
| CH04, CH06, CH12-CH24, CH27 | L_BA6-R_BA46 | −2.948 | 0.007 | 1 |
| CH05, CH11, CH13-CHO2 | L_BA8-L_BA45 | 2.438 | 0.022 | 1 |
| CH05, CH11, CH13-CH21, CH23, CH25, CH26 | L_BA8-R_BA9 | 2.085 | 0.047 | 1 |
| CH07, CH10-CH24, CH27 | L_BA46-R_BA46 | −2.516 | 0.019 | 1 |
| CH14, CH19, CH20-CH24, CH27 | R_BA8-R_BA46 | −2.689 | 0.013 | 1 |
| CH16-CH17, CH22 | L_BA10-R_BA10 | −2.315 | 0.029 | 1 |
| CH21, CH23, CH25, CH26-CH24, CH27 | R_BA9-R_BA46 | −2.09 | 0.047 | 1 |
Statistical results.
Sig value equal to 1 represents a significant difference.
4 Discussion
4.1 Hypnosis alters the functional connectivity strength in certain regions of the frontal lobe
The results of the study show that, in the hypnotic state, the connectivity strength in six pairs of regions was significantly enhanced compared to the control state. These pairs include the left dorsolateral prefrontal cortex-right prefrontal cortex (LBA9-RBA10), left premotor prefrontal cortex and auxiliary motor cortex-right dorsolateral prefrontal cortex (LBA6-RBA46), left dorsolateral prefrontal cortex-right dorsolateral prefrontal cortex (RBA46), right frontal eye region-right dorsolateral prefrontal cortex (RBA8-RBA46), right dorsolateral prefrontal cortex-right dorsolateral prefrontal cortex (RBA9-RBA46), left prefrontal cortex-right prefrontal cortex (LBA10-RBA10). These regions involve the bilateral dorsolateral prefrontal cortex (LBA9, RBA9, LBA46, RBA46), bilateral prefrontal cortex (LBA10, RBA10), left premotor cortex and auxiliary motor cortex (LBA6), and right frontal eye movement area (RBA8). This finding is consistent with the results of previous studies (Jiang et al., 2016; Vazquez et al., 2024).
The core of hypnosis lies in focused attention and relaxation. Previous studies have indicated that these brain regions, particularly the prefrontal cortex (PFC) and dorsolateral prefrontal cortex (DLPFC), are closely associated with these psychological traits. These areas play a crucial role in attention regulation, especially in inhibiting interference and selectively concentrating attention (Egner et al., 2005; Niedernhuber et al., 2024). In the hypnotic state, the high concentration of attention may be closely related to the enhanced function of these regions, which may be one of the key factors in the remarkable effect of hypnotherapy. This finding reveals the unique advantage of hypnosis in facilitating functional brain connectivity.
In addition, the study finds that connectivity is significantly reduced in four brain region pairs: the left dorsolateral prefrontal cortex-left Broca (LBA9-LBA45), left premotor cortex and auxiliary motor cortex-left Broca (LBA6-LBA 45), left frontal eye movement (LBA8-LBA45), and left frontal eye movement-right dorsolateral prefrontal cortex (LBA8-RBA9). Notably, the regions of interest (ROIs) are predominantly located in the left hemisphere. This indicates that certain areas of the left cerebral cortex, particularly the left Broca area (LBA45), responsible for speech production and motor functions, which reflects a shift in network engagement during hypnosis. These findings suggest that hypnosis may be more closely associated with the functions of the right cerebral cortex.
4.2 fNIRS resting-state functional connectivity analysis serves as an effective tool for investigating cerebral cortical activity during hypnotic states
Resting state functional connectivity (rsFC) analysis was designed to explore synchronized activity between brain regions during resting state. In the resting state, brain activity is spontaneous and not disturbed by external tasks, and thus, resting-state functional connectivity analysis may reveal universal properties of brain activity. Resting-state functional connectivity analysis, based on functional near-infrared spectroscopy imaging (fNIRS), is expected to be an innovative tool and method to reveal cerebral cortical activity, which deserves further exploration. This study verifies the potential of functional near-infrared spectral imaging (fNIRS) in exploring the mechanism of hypnotic brain, and provides a useful reference for subsequent studies.
4.3 Limitations and future work
This study primarily focused on the frontal cortex due to equipment limitations, leaving other brain regions unexamined. As a result, the findings reflect the characteristics of the selected frontal regions and do not provide a comprehensive or systematic description of whole-brain functional connectivity. Additionally, only 26 participants were included in the analysis due to signal quality issues, indicating a need for a larger sample size. Furthermore, the study exclusively involved college students, leaving functional connectivity differences across different age groups in the resting state unexplored.
Future studies could employ fNIRS devices with broader brain coverage to collect more comprehensive data, while increasing sample sizes and including participants from diverse age groups to better capture the characteristics of whole-brain functional connectivity. Additionally, enhancing signal quality will be crucial, necessitating the use of more advanced signal processing techniques and improved equipment. These advancements will enable researchers to analyze brain activity more accurately, leading to more reliable and robust conclusions.
Additionally, given that the hypnotic state may be influenced by individual psychological and physiological factors, future research should incorporate a broader range of psychological and physiological variables to examine their impact on brain functional connectivity (De Pascalis, 2023; Takarada and Nozaki, 2014). To gain a more comprehensive understanding of the neural mechanisms underlying hypnosis, it is also recommended that future studies employ multiple neuroimaging techniques for cross-validation, providing deeper and more robust scientific insights (Nia et al., 2025; Scholkmann et al., 2014).
5 Conclusion
Hypnosis enhances the strength of functional connectivity in certain frontal regions. Resting-state functional connectivity analysis using functional near-infrared spectroscopy (fNIRS) proves to be a valuable tool for hypnosis research. Future studies could further refine the experimental design and incorporate multimodal approaches to provide a more comprehensive investigation of neural correlates during hypnosis.
Statements
Data availability statement
The datasets presented in this study can be found in online repositories. The names of the repository/repositories and accession number(s) can be found below: https://doi.org/10.57760/sciencedb.psych.00436.
Ethics statement
The studies involving humans were approved by Ethics Committee of Huaibei Normal University. The studies were conducted in accordance with the local legislation and institutional requirements. The participants provided their written informed consent to participate in this study. Written informed consent was obtained from the individual(s) for the publication of any potentially identifiable images or data included in this article.
Author contributions
ZZ: Funding acquisition, Visualization, Writing – original draft. WT: Writing – review & editing. YM: Validation, Writing – review & editing. MZ: Investigation, Resources, Writing – review & editing. YZ: Funding acquisition, Writing – review & editing. JW: Project administration, Writing – review & editing. YW: Funding acquisition, Writing – review & editing. ZhimL: Data curation, Writing – review & editing. ZhifL: Writing – review & editing. RH: Conceptualization, Supervision, Writing – review & editing.
Funding
The author(s) declare that financial support was received for the research and/or publication of this article. This research was funded by the Humanities and Social Science Research Project at Anhui University (SK2021ZD0047, 2023AH050290); and School-enterprise cooperation scientific research Project (Staff Psychological Counseling and Treatment, 22200254).
Conflict of interest
The authors declare that the research was conducted in the absence of any commercial or financial relationships that could be construed as a potential conflict of interest.
Generative AI statement
The authors declare that no Gen AI was used in the creation of this manuscript.
Correction note
This article has been corrected with minor changes. These changes do not impact the scientific content of the article.
Publisher’s note
All claims expressed in this article are solely those of the authors and do not necessarily represent those of their affiliated organizations, or those of the publisher, the editors and the reviewers. Any product that may be evaluated in this article, or claim that may be made by its manufacturer, is not guaranteed or endorsed by the publisher.
References
1
Aleksandrowicz J. W. Urbanik A. Binder M. (2006). Imaging of hypnosis with functional magnetic resonance. Psychiatr. Pol.40, 969–983.
2
Chamine I. Atchley R. Oken B. S. (2018). Hypnosis intervention effects on sleep outcomes: a systematic review. J. Clin. Sleep Med.14, 271–283. doi: 10.5664/jcsm.6952
3
Chul J. Tak S. Jang K. E. Jung J. Jang J. (2009). NIRS-SPM: statistical parametric mapping for near-infrared spectroscopy. NeuroImage44, 428–447. doi: 10.1016/j.neuroimage.2008.08.036
4
De Pascalis V. (2023). EEG oscillations and neural functional connectivity underpinning hypnosis and hypnotizability. Preprints. doi: 10.20944/preprints202312.0382.v1
5
De Pascalis V. (2024). Brain functional correlates of resting hypnosis and Hypnotizability: a review. Brain Sci.14:115. doi: 10.3390/brainsci14020115
6
Demertzi A. Soddu A. Faymonville M. E. Bahri M. A. Gosseries O. Vanhaudenhuyse A. et al . (2011). “Hypnotic modulation of resting state fMRI default mode and extrinsic network connectivity” in Slow brain oscillations of sleep, resting state and vigilance. eds. VanSomerenE. J. W.VanDerWerfY. D.RoelfsemaP. R.MansvelderH. D.DaSilvaF. H. L., vol. 193 (Amsterdam: Elsevier Science Bv), 309–322.
7
Egner T. Jamieson G. Gruzelier J. (2005). Hypnosis decouples cognitive control from conflict monitoring processes of the frontal lobe. NeuroImage27, 969–978. doi: 10.1016/j.neuroimage.2005.05.002
8
Farahzadi Y. Kekecs Z. (2021). Towards a multi-brain framework for hypnosis: a review of quantitative methods. Am. J. Clin. Hypn.63, 389–403. doi: 10.1080/00029157.2020.1865129
9
Flammer E. Alladin A. (2007). The efficacy of hypnotherapy in the treatment of psychosomatic disorders: Meta-analytical evidence. Int. J. Clin. Exp. Hypn.55, 251–274. doi: 10.1080/00207140701338696
10
Geagea D. Ogez D. Kimble R. Tyack Z. (2023). Demystifying hypnosis: unravelling facts, exploring the historical roots of myths, and discerning what is hypnosis. Complement. Ther. Clin. Pract.52:101776. doi: 10.1016/j.ctcp.2023.101776
11
Halsband U. Gerhard Wolf T. (2019). Functional changes in brain activity after hypnosis: neurobiological mechanisms and application to patients with a specific phobia—limitations and future directions. Int. J. Clin. Exp. Hypn.67, 449–474. doi: 10.1080/00207144.2019.1650551
12
Hou X. Zhang Z. Zhao C. Duan L. Gong Y. Li Z. et al . (2021). NIRS-KIT: a MATLAB toolbox for both resting-state and task fNIRS data analysis. Neurophotonics8:010802. doi: 10.1117/1.NPh.8.1.010802
13
Jiang H. White M. P. Greicius M. D. Waelde L. C. Spiegel D. (2016). Brain activity and functional connectivity associated with hypnosis. Cereb. Cortex27, 4083–4093. doi: 10.1093/cercor/bhw220
14
Kocsis L. Herman P. Eke A. (2006). The modified beer–Lambert law revisited. Phys. Med. Biol.51, N91–N98. doi: 10.1088/0031-9155/51/5/N02
15
Landry M. Lifshitz M. Raz A. (2017). Brain correlates of hypnosis: a systematic review and meta-analytic exploration. Neurosci. Biobehav. Rev.81, 75–98. doi: 10.1016/j.neubiorev.2017.02.020
16
Lu C. Zhang Y. Biswal B. Zang Y. Peng D. Zhu C. (2010). Use of fNIRS to assess resting state functional connectivity. J. Neurosci. Methods186, 242–249. doi: 10.1016/j.jneumeth.2009.11.010
17
McGeown W. J. Mazzoni G. Venneri A. Kirsch I. (2009). Hypnotic induction decreases anterior default mode activity. Conscious. Cogn.18, 848–855. doi: 10.1016/j.concog.2009.09.001
18
Nia A. F. Tang V. Malyshau V. Barde A. Talou G. D. M. Billinghurst M. (2025). FEAD: introduction to the fNIRS-EEG affective database. J IEEE Trans. Affect. Comput.16, 15–27. doi: 10.1109/taffc.2024.3407380
19
Niedernhuber M. Schroeder A. C. Lercher C. Bruegger M. Prates de Matos N. M. Noreika V. et al . (2024). An interhemispheric frontoparietal network supports hypnotic states. Cortex177, 180–193. doi: 10.1016/j.cortex.2024.05.008
20
Peter B. (2024). Hypnosis in psychotherapy, psychosomatics and medicine. A brief overview. Front. Psychol.15:1377900. doi: 10.3389/fpsyg.2024.1377900
21
Pyka M. Burgmer M. Lenzen T. Pioch R. Dannlowski U. Pfleiderer B. et al . (2011). Brain correlates of hypnotic paralysis-a resting-state fMRI study. NeuroImage56, 2173–2182. doi: 10.1016/j.neuroimage.2011.03.078
22
Rainville P. Streff A. Chen J.-I. Houze B. Desmarteaux C. Piche M. (2019). HYPNOTIC AUTOMATICITY IN THE BRAIN AT REST: an arterial spin labelling study. Int. J. Clin. Exp. Hypn.67, 512–542. doi: 10.1080/00207144.2019.1650578
23
Rosendahl J. Alldredge C. T. Haddenhorst A. (2023). Meta-analytic evidence on the efficacy of hypnosis for mental and somatic health issues: a 20-year perspective. Front. Psychol.14:1330238. doi: 10.3389/fpsyg.2023.1330238
24
Scholkmann F. Kleiser S. Metz A. J. Zimmermann R. Pavia J. M. Wolf U. et al . (2014). A review on continuous wave functional near-infrared spectroscopy and imaging instrumentation and methodology. NeuroImage85, 6–27. doi: 10.1016/j.neuroimage.2013.05.004
25
Sim S. Maldonado I. L. Castelnau P. Barantin L. El-Hage W. Andersson F. et al . (2024). Neural correlates of mindfulness meditation and hypnosis on magnetic resonance imaging: similarities and differences. A scoping review. J. Neuroradiol.51, 131–144. doi: 10.1016/j.neurad.2023.11.002
26
Singh A. K. Okamoto M. Dan H. Jurcak V. Dan I. (2005). Spatial registration of multichannel multi-subject fNIRS data to MNI space without MRI. NeuroImage27, 842–851. doi: 10.1016/j.neuroimage.2005.05.019
27
Takarada Y. Nozaki D. (2014). Hypnotic suggestion alters the state of the motor cortex. Neurosci. Res.85, 28–32. doi: 10.1016/j.neures.2014.05.009
28
Vazquez P. G. Whitfield-Gabrieli S. Bauer C. C. C. Barrios F. A. (2024). Brain functional connectivity of hypnosis without target suggestion. An intrinsic hypnosis rs-fMRI study. World J. Biol. Psychiatry25, 95–105. doi: 10.1080/15622975.2023.2265997
29
Wolf T. G. Faerber K. A. Rummel C. Halsband U. Campus G. (2022). Functional changes in brain activity using hypnosis: a systematic review. Brain Sci.12:16. doi: 10.3390/brainsci12010108
30
Xu G. Huo C. Yin J. Zhong Y. Sun G. Fan Y. et al . (2023). Test-retest reliability of fNIRS in resting-state cortical activity and brain network assessment in stroke patients. Biomed. Opt. Express14, 4217–4236. doi: 10.1364/boe.491610
31
Yijing Luo J. D. Hongliu Y. Fang F. Shi P. (2024). Resting-state fNIRS reveals changes in prefrontal cortex functional connectivity during TENS in patients with chronic pain. J. Sci. Rep.14:29187. doi: 10.1038/s41598-024-79820-2
32
Zhang Z. Olszewska-Guizzo A. Husain S. F. Bose J. Choi J. Tan W. et al . (2020). Brief relaxation practice induces significantly more prefrontal cortex activation during arithmetic tasks comparing to viewing greenery images as revealed by functional near-infrared spectroscopy (fNIRS). Int. J. Environ. Res. Public Health17:8366. doi: 10.3390/ijerph17228366
Summary
Keywords
functional near-infrared spectroscopy, hypnosis, frontal lobe, resting-state, functional connectivity
Citation
Zhang Z, Tan W, Ma Y, Zheng M, Zhang Y, Wei J, Wang Y, Li Z, Li Z and Ho RC (2025) Study on resting-state functional connectivity characteristics under hypnosis using functional near-infrared spectroscopy. Front. Psychol. 16:1567526. doi: 10.3389/fpsyg.2025.1567526
Received
27 January 2025
Accepted
23 May 2025
Published
05 June 2025
Corrected
23 July 2025
Volume
16 - 2025
Edited by
Daniela Di Basilio, Lancaster University, United Kingdom
Reviewed by
Arun Karumattu Manattu, University of Wisconsin-Madison, United States
Fan Zhang, University of Washington, United States
Updates
Copyright
© 2025 Zhang, Tan, Ma, Zheng, Zhang, Wei, Wang, Li, Li and Ho.
This is an open-access article distributed under the terms of the Creative Commons Attribution License (CC BY). The use, distribution or reproduction in other forums is permitted, provided the original author(s) and the copyright owner(s) are credited and that the original publication in this journal is cited, in accordance with accepted academic practice. No use, distribution or reproduction is permitted which does not comply with these terms.
*Correspondence: Yaozu Wang, wangyz@chnu.edu.cn
Disclaimer
All claims expressed in this article are solely those of the authors and do not necessarily represent those of their affiliated organizations, or those of the publisher, the editors and the reviewers. Any product that may be evaluated in this article or claim that may be made by its manufacturer is not guaranteed or endorsed by the publisher.