 Wenbo Chai†
 Beijiu Cheng
 Weina Si
 Haiyang Jiang
- National Engineering Laboratory of Crop Stress Resistance Breeding, School of Life Sciences, Anhui Agricultural University, Hefei, China
Nucleobase:cation symporter 2 (NCS2) proteins are important for the transport of free nucleobases, participating in diverse plant growth and developmental processes, as well as response to abiotic stress. To date, a comprehensive analysis of the NCS2 gene family has not been performed in maize. In this study, we conducted a comparative genomics analysis of NCS2 genes in 28 plant species, ranging from aquatic algae to land plants, concentrating mainly on maize. Gene duplication events contributed to the expansion of NCS2 genes from lower aquatic plants to higher angiosperms, and whole-genome/segmental and single-gene duplication events were responsible for the expansion of the maize NCS2 gene family. Phylogenetic construction showed three NCS2 subfamilies, I, II, and III. According to homology-based relationships, members of subfamily I are NCS2/AzgA-like genes, whereas those in subfamilies II and III are NCS2/NATs. Moreover, subfamily I exhibited ancient origins. A motif compositional analysis showed that one symbolic motif (motif 4) of the NCS2/NAT genes was absent in subfamily I. In maize, three NCS2/AzgA-like and 21 NCS2/NAT genes were identified, and purifying selection influenced the duplication of maize NCS2 genes. Additionally, a population genetic analysis of NCS2 genes revealed that ZmNCS2–21 showed the greatest diversity between the 78 inbred and 22 wild surveyed maize populations. An expression profile analysis using transcriptome data and quantitative real-time PCR revealed that NCS2 genes in maize are involved in diverse developmental processes and responses to abiotic stresses, including abscisic acid, salt (NaCl), polyethylene glycol, and low (4∘C) and high (42∘C) temperatures. ZmNCS2 genes with relatively close relationships had similar expression patterns, strongly indicating functional redundancy. Finally, ZmNCS2–16 and ZmNCS2–23 localize in the plasma membrane, which confirmed their predicted membrane structures. These results provide a foundation for future studies regarding the functions of ZmNCS2 proteins, particularly those with potentially important roles in plant responses to abiotic stresses.
Introduction
Nucleobases have considerable effects on various plant growth and physiological processes (Rapp et al., 2015). The consistent production of new nucleobases provides the necessary components for DNA and RNA synthesis, and nucleobase derivatives are important for cell signaling, nutrition, stress responses, and cell homeostasis (Senecoff et al., 1996). Many indispensable secondary metabolites are nucleobase derivatives, including cytokinins and caffeine. Consistent with the functional importance of nucleobases, pathways associated with their synthesis and catabolism are prevalent in diverse subcellular compartments. Additionally, extensive nucleobase trafficking between these compartments, mediated largely by transporters, is necessary. Several nucleobase transporters have been identified. Equilibrative nucleoside transporter family members are the primary nucleoside transporters in various eukaryotic organisms (Young et al., 2013). Proton symporters (e.g., NCS1), which can transport purines, have been detected in bacteria, fungi, and plants (de Koning and Diallinas, 2000). Two other transporter families, purine permease and ureide permease, have been identified in plants. Furthermore, the nucleobase:cation symporter (NCS2) proteins, which include the nucleobase–ascorbate transporter (NAT) and the AzgA-like protein families, are ubiquitous nucleobase transporters in many organisms (Girke et al., 2014; Niopek-Witz et al., 2014; Vastermark et al., 2015). NCS2/NAT genes are distantly related to NCS2/AzgA-like genes (Girke et al., 2014; Niopek-Witz et al., 2014; Vastermark et al., 2015). The NCS2/NAT proteins are important for plant growth and development. These proteins generally contain a NAT signature motif [Q/E/P]-N-X-G-X-X-X-X-T-[R/K/G] and a QH structure, which are critical for NCS2/NAT functions and missing in NCS/AzgA-like genes (Diallinas et al., 1998; Koukaki et al., 2005; Pantazopoulou and Diallinas, 2006).
The NCS2/NAT family proteins transport nucleotides and other specific molecules across membranes. In bacteria, plants, and fungi, NAT proteins are involved in transporting xanthine, uric acid, uracil, and a toxic purine analog. However, in mammals, these proteins transport ascorbate (vitamin C). Many NAT proteins from microorganisms and animals have been studied (Gournas et al., 2008). For example, 10 NCS2/NAT members in Escherichia coli have been analyzed, including the uracil transporter UraA (Lu et al., 2011; Li et al., 2014), the xanthine permeases XanQ and XanP (Karatza and Frillingos, 2005), the adenine permease PurP, and the guanine and hypoxanthine permeases YgfQ and YgfU. The latter functions as a high-capacity transporter of uric acid. (Papakostas and Frillingos, 2012; Papakostas et al., 2013). In contrast, relatively few plant NAT (NCS2) proteins have been functionally characterized (Niopek-Witz et al., 2014). The overexpression of Arabidopsis thaliana AtNAT3 and AtNAT12 in E. coli uraA knockout mutants indicated that they transport adenine, guanine, and uracil with high affinities. Moreover, the transient expression of AtNAT3 and AtNAT12 revealed that the encoded proteins are localized in the plasma membrane (Niopek-Witz et al., 2014). In maize (Zea mays), leaf permease 1, which is encoded by ZmLpe1, is the only functionally characterized NCS2 protein, and it is reportedly required for chloroplast development and membrane integrity (Argyrou and Diallinas, 2001). In Aspergillus nidulans, the AzgA-like proteins exist in membranes where they function as proton symporters specific for hypoxanthine, guanine, and adenine (Pantazopoulou et al., 2007). In Arabidopsis, AtAzg1 and AtAzg2 can transporter adenine and guanine (Mansfield et al., 2009).
There have been limited investigations into the evolution of the NCS2 gene family. However, recent developments in genome sequencing technology have resulted in the release of large amounts of plant genome sequences, which may be useful for analyzing the evolution of NCS2 genes (Schnable et al., 2009). Gene duplication has long been viewed as an important inducer of gene family expansion, especially in higher eukaryotes (Wendel, 2000; Sémon and Wolfe, 2007). Generally, gene duplication modes include whole-genome duplication/segmental duplication (WGD/SD), tandem duplication, and single-gene duplication. Recent genome sequencing studies confirmed that WGD/SD and tandem duplication events were important in duplicating plant genes (Tuskan et al., 2006; Schmutz et al., 2010; Wang et al., 2012). Single-gene duplications involve the relocation of a single gene to a new position, with segregants containing duplicated copies of the gene (Freeling, 2009). Tandem duplications accelerated the expansion of the nucleotide binding site–leucine-rich repeat gene family (Leister, 2004; Kohler et al., 2008), while WGDs contributed to the evolution of the heat-stress factor gene family (Lin et al., 2014). Following gene duplication events, some duplicated genes may be functionally the same as the original gene, while others become pseudogenes that evolve a new function or are deleted because of functional redundancy (Rody et al., 2017).
Globally, maize is an important crop. In this study, we comprehensively analyzed the NCS2 gene family in maize, as well as in other plant species. We observed that the expansions of the NCS2 gene families of diverse species, from aquatic algae to land plants, were the result of different types of duplication modes. In maize, WGD/SD and single-gene duplication events have been vital for the expansion of the NCS2 gene family. A phylogenetic analysis uncovered three NCS2 gene subfamilies and clarified their evolutionary history among plant species. Non-synonymous (Ka)/synonymous (Ks) substitution ratios for maize paralogous genes indicated that the number of duplicated genes increased under purifying selection. Additionally, the genetic diversity among 78 maize inbred and 22 wild maize lines was assessed using whole-genome sequencing, and tissue-specific NCS2 gene expression profiles in response to various stresses were examined. Finally, the subcellular localizations of two randomly selected NCS2/NAT proteins were determined. The data presented herein provide new insights into the evolution and functions of maize NCS2 genes.
Materials and Methods
Genome-Wide Identification of NCS2 Genes
Maize proteomes were downloaded from the MaizeGBD website (version 4). To better trace the origin of the NCS2 genes in the plant kingdom, complete proteomes of 26 plant species, including Chondrus crispus, Chlamydomonas reinhardtii, Physcomitrella patens, Selaginella moellendorffii, Amborella trichopoda, Elaeis guineensis, Musa acuminata, Zea mays, Sorghum bicolor, Setaria italic, Brachypodium distachyon, Oryza sativa, Nelumbo nucifera, Solanum tuberosum, Solanum lycopersicum, Vitis vinifera, Medicago truncatula, Glycine max, Fragaria vesca, Malus domestica, Manihot esculenta, Populus trichocarpa, Eucalyptus grandis, A. thaliana, Gossypium raimondii, Theobroma cacao and Citrus sinensis were downloaded from the Phytozome website (Version 11)1. The proteome of Picea asperata was downloaded from Spruce Genome Project2. To better detect the candidate NCS2 genes, which encode a Xan_ur_permease (PF00860) domain, a pfam_scan perl script in HMMER3.1 was applied to query all of the surveyed proteomes against the Pfam library (Bateman et al., 1999). The molecular weight (Mw) and isoelectric point (pI) of each gene product were estimated using the pI/Mw tool on the ExPASy website3 (Gasteiger et al., 2003). The putative transmembrane regions in each maize NCS2 protein were predicted using the default settings of the TMHMM Server (version 2.0)4.
Phylogenetic Analysis and Identification of Conserved Motifs
A phylogenetic species tree was constructed using the Taxonomy Browser online program5. The full-length amino acid sequences of all NCS2 proteins were aligned using the MAFFT online program with the auto strategy (Kuraku et al., 2013)6. Gaps in aligned sequences were deleted by TrimAL3.0 using -automated1 and -strictplus for maximum-likelihood (ML) and neighbor-joining (NJ) trees, respectively. Then, sequences that completely overlapped others were deleted manually. The resulting alignment file was first used to construct an unrooted phylogenetic tree based on the NJ method in MEGA 7.0 with the JTT mode and pairwise deletion (Kumar et al., 2016). A bootstrap analysis was completed using 1,000 replicates. To construct ML and Bayesian trees, the resulting alignment sequences were submitted to Prottest 3.4 to select best-fit models (Darriba et al., 2011). According to the results, the estimated most appropriate model was the LG+G+F model (with an -lnL 39574.56) based on the Corrected Akaike Information Criterion. We applied this model and other criteria of the Prottest results in PhyML 3.1 to generate a ML tree (Guindon and Gascuel, 2003). We used MrBayes v.3.1.2 to construct a Bayesian tree with the alignment sequences. Because the LG model was not supported in MrBayes and no other models had an Corrected Akaike Information Criterion weight greater than 0.01, two independent 13,000,000-generation runs of five chains using the related WAG model were executed (prset aamodelpr = fixed(WAG); lset rates = gamma; mcmc ngen = 13,000,000; samplefreq = 1000; printfreq = 500; diagnfreq = 5,000; sump burnin = 3,250; contype = allcompat) (Le and Gascuel, 2008). The NJ and ML trees were further edited with MEGA 7.0, while the Bayesian tree was edited in Figtree v1.4.3 (Rambaut, 2012)7. Protein sequence motifs were identified using the default settings of the MEME motif search tool8.
Mapping of ZmNCS2 Genes and Analyses of Gene Duplications
The ZmNCS2 genes were named based on their positions from the top to the bottom of the chromosomes. The chromosomal positions of the ZmNCS2 genes were determined based on the information available in the Phytozome database9 and were visualized using a Perl script. Duplication events were identified based on sequence alignments. Sequences resulting from SDs were aligned with the ClustalX 2.0 program. The aligned sequences were analyzed using DnaSP6 to estimate the Ks and Ka substitution rates. The divergence time (T) was calculated based on the Ks value and the number of substitutions per synonymous locus per year as follows: T = Ks/2λ × 10-6 (where λ = 6.5 × 10⁻⁹ for grasses).
Detection of Orthologous Gene Pairs
A Perl script was used to mark the chromosomal positions of the NCS2 genes in maize, S. bicolor (sorghum), and O. sativa (rice). The orthologous NCS2 genes in A. thaliana, maize, rice, and sorghum were identified using OrthoMCL10. The relationships between orthologous gene pairs among the three species were plotted using Circos11.
Microarray Analysis of ZmNCS2
The expression profiles for ZmNCS2 genes were obtained using publicly available transcriptome data (Stelpflug et al., 2016). Ten ZmNCS2 genes were used as queries to search the transcriptome data. A heat map was generated using the heatmap function of R12.
Plant Materials and Stress Treatments
Three-week-old seedlings (three-leaf stage) of maize inbred line B73 were used to examine the ZmNCS2 expression patterns in response to different stress treatments. Maize plants were grown in a greenhouse (14-h light/10-h dark photoperiod; 28 ± 2°C). The treatments were independent exposures to 10 mM abscisic acid (ABA), 4°C, 42°C, 20 mM NaCl, and 20% polyethylene glycol (PEG). Seedlings were irrigated prior to the spray treatments. Leaves harvested 1 h after the treatments were immediately frozen in liquid N2 and stored at -80°C for subsequent RNA extractions. Analyses at all developmental stages were completed, with at least three biological replicates per sample.
RNA Extraction and Quantitative Real-Time PCR (qRT-PCR) Analysis
Total RNA was isolated from each frozen sample using RNAiso Plus (TaKaRa, Japan). The quality of the extracted RNA was assessed in a 1.2% agarose gel. First-strand cDNA was synthesized using 1 μg RNA and the ReverTra Ace qPCR RT Master Mix with gDNA Remover (Toyobo, Japan). A qRT-PCR assay was conducted using the RT-PCR Quick Master Mix. Each reaction was completed in a final volume of 20 μl, containing 10 μl SYBR Green Master Mix, 2.0 μl diluted cDNA sample, and 400 nM gene-specific primers. The Primer Express 3.0 program was used to design gene-specific primers for amplifying 90–150-bp products. Details regarding the primers are provided in Supplementary Table S1. The qRT-PCR program was as follows: 95°C for 10 min and 40 cycles at 95°C for 15 s and 60°C for 1 min. The specificities of the reactions were verified by melting curve analyses. The maize actin1 gene was used as an internal reference. The relative mRNA level for each gene was calculated according to the 2-ΔΔCT method. The qRT-PCR assay was conducted at least three times under identical conditions.
Subcellular Localizations of ZmNCS2-16 and ZmNCS2-23
Plant-mPLoc13 was used to predict the subcellular localizations of ZmNCS2-16 and ZmNCS2-23. The ZmNCS2-16 and ZmNCS2-23 full-length open reading frames were amplified by PCR using the following gene-specific primer pairs that eliminated the termination codon: ZmNCS2-16-F: 5′-ATGGATGAACTATACAAAGGGATGTACCTGCCACATGCTGTTCA-3′ and ZmNCS2-16-R: 5′-AACATATCCAGTCACTATGGGGACCGATGGGAAGAACTTATTCA-3′; and ZmNCS2-23-F: 5′-ATGGATGAACTATACAAAGGGATGATAATAGTTTCTCTGGTTGC-3′ and ZmNCS2-23-R: 5′-AACATATCCAGTCACTATGGGGATGCCGACACACTTTGCC-3′, respectively. After verifying the accuracy of the amplified sequences, the PCR products were independently inserted into the pMDC43-GFP vector using the ClonExpress II One Step Cloning Kit (Vazyme). The ZmNCS2–16 and ZmNCS2–23 sequences were placed under the control of the cauliflower mosaic virus 35S promoter. The pMDC43-GFP-ZmNCS2–16 and pMDC43-GFP-ZmNCS2–23 plasmids, and the control vector (pMDC43-GFP), were independently inserted into tobacco cells using an Agrobacterium tumefaciens-mediated transformation method.
Calling of Single Nucleotide Polymorphisms (SNPs) and Population Genetic Analysis
We mapped all the reads of maize re-sequencing data (unpublished) against the reference maize v3.0 genome by BWA using default parameters(Li and Durbin, 2009). Picard-MarkDuplicates14 and GATK – IndelRealigner were used to correct mapping results(Mckenna et al., 2010). Finally, GATK-UnifiedGenotyper was utilized to detect SNPs in each maize individual at corresponding gene loci. Nucleotide variation was estimated as the ratio between SNP numbers and corresponding CDS length. Pair-wise fixation index (Fst) and Tajima’ D were calculated by Arlequin31(Excoffier and Lischer, 2010).
Results
Identification of NCS2 Genes in Maize and Other Species
Twenty-four candidate NCS2 genes were identified in maize based on a search of the Pfam database (Table 1). We named all NCS2 genes from ZmNCS1–1 to ZmNCS2–24 according to their positions on the chromosomes. These ZmNCS2 genes were distributed unevenly among nine chromosomes, with none on chromosome 9. Chromosomes 1, 2, and 7 each had four ZmNCS2 genes, while chromosomes 4 and 8 each had two and chromosomes 3, 5, 6, and 10 each had one chromosome. The lengths of the encoded proteins ranged from 192 to 795 amino acids, with an average of 468 amino acids. The Mw of these proteins ranged from 21 to 85.4 kDa, while the pI values were between 6.4 and 9.61.
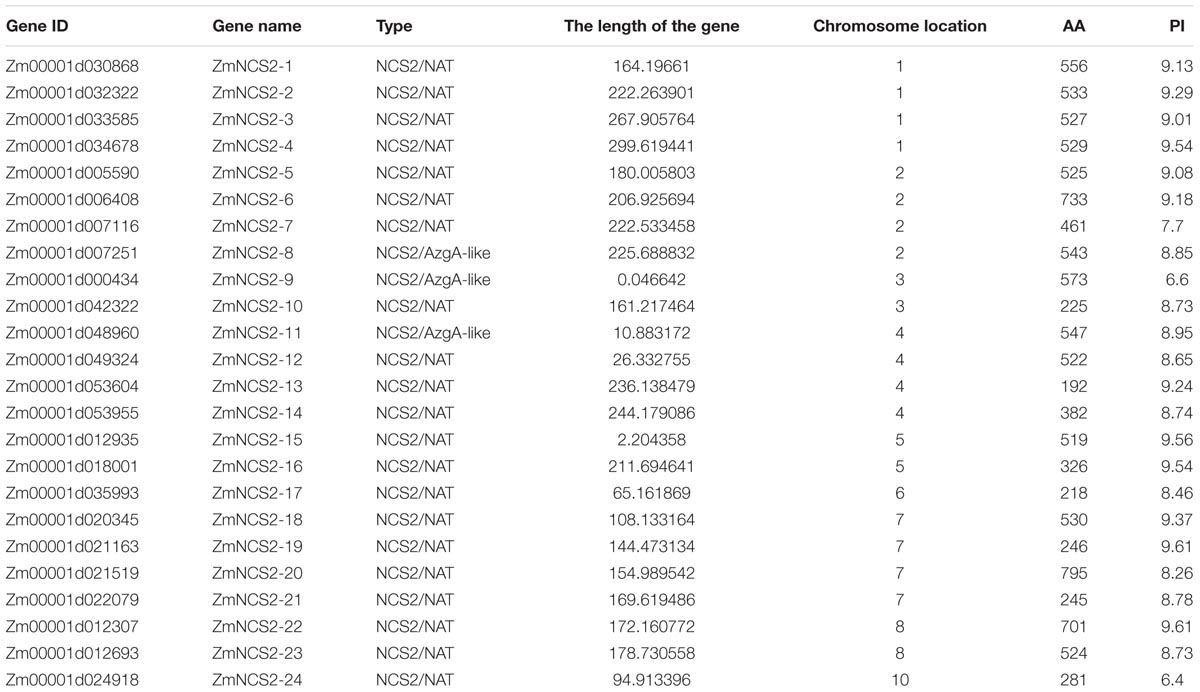
TABLE 1. Details of the 24 ZmNCS2 genes and their encoded proteins.
We also characterized the NCS2 homologs from 27 other plant species, ranging from single-celled aquatic plants to higher angiosperms (Figure 1 and Table 2). A total of 441 NCS2 genes were identified, with 1–37 per species (Stelpflug et al., 2016). Additionally, only one and seven homologs were detected in the algae C. crispus and C. reinhardtii, respectively. In contrast, 11 and 14 NCS2 homologs were detected in the basal land plant species P. patens and S. moellendorffii, respectively. Additionally, 14 NCS2 homologs were found in P. asperata, which is a gymnosperm, and 9 NCS2 homologs were detected in A. trichopoda, which is an ancestor of the flowering plant lineage. The number of NCS2 genes in angiosperms ranged from 9 to 37, with considerable gene expansion observed in several species. Specifically, M. acuminata, Z. mays, and G. max contained as many as 26, 24, and 37 NCS2 genes, respectively. Finally, an analysis of the linear correlations between the numbers of NCS2 genes and the total numbers of genes in the genomes of all surveyed species revealed a weak association (R2 = 0.6642, p = 5.9327E-15; Supplementary Figure S1). Thus, the number of NCS2 genes was not proportional to the number of gene loci, which may be a consequence of the evolution of the NCS2 gene family.
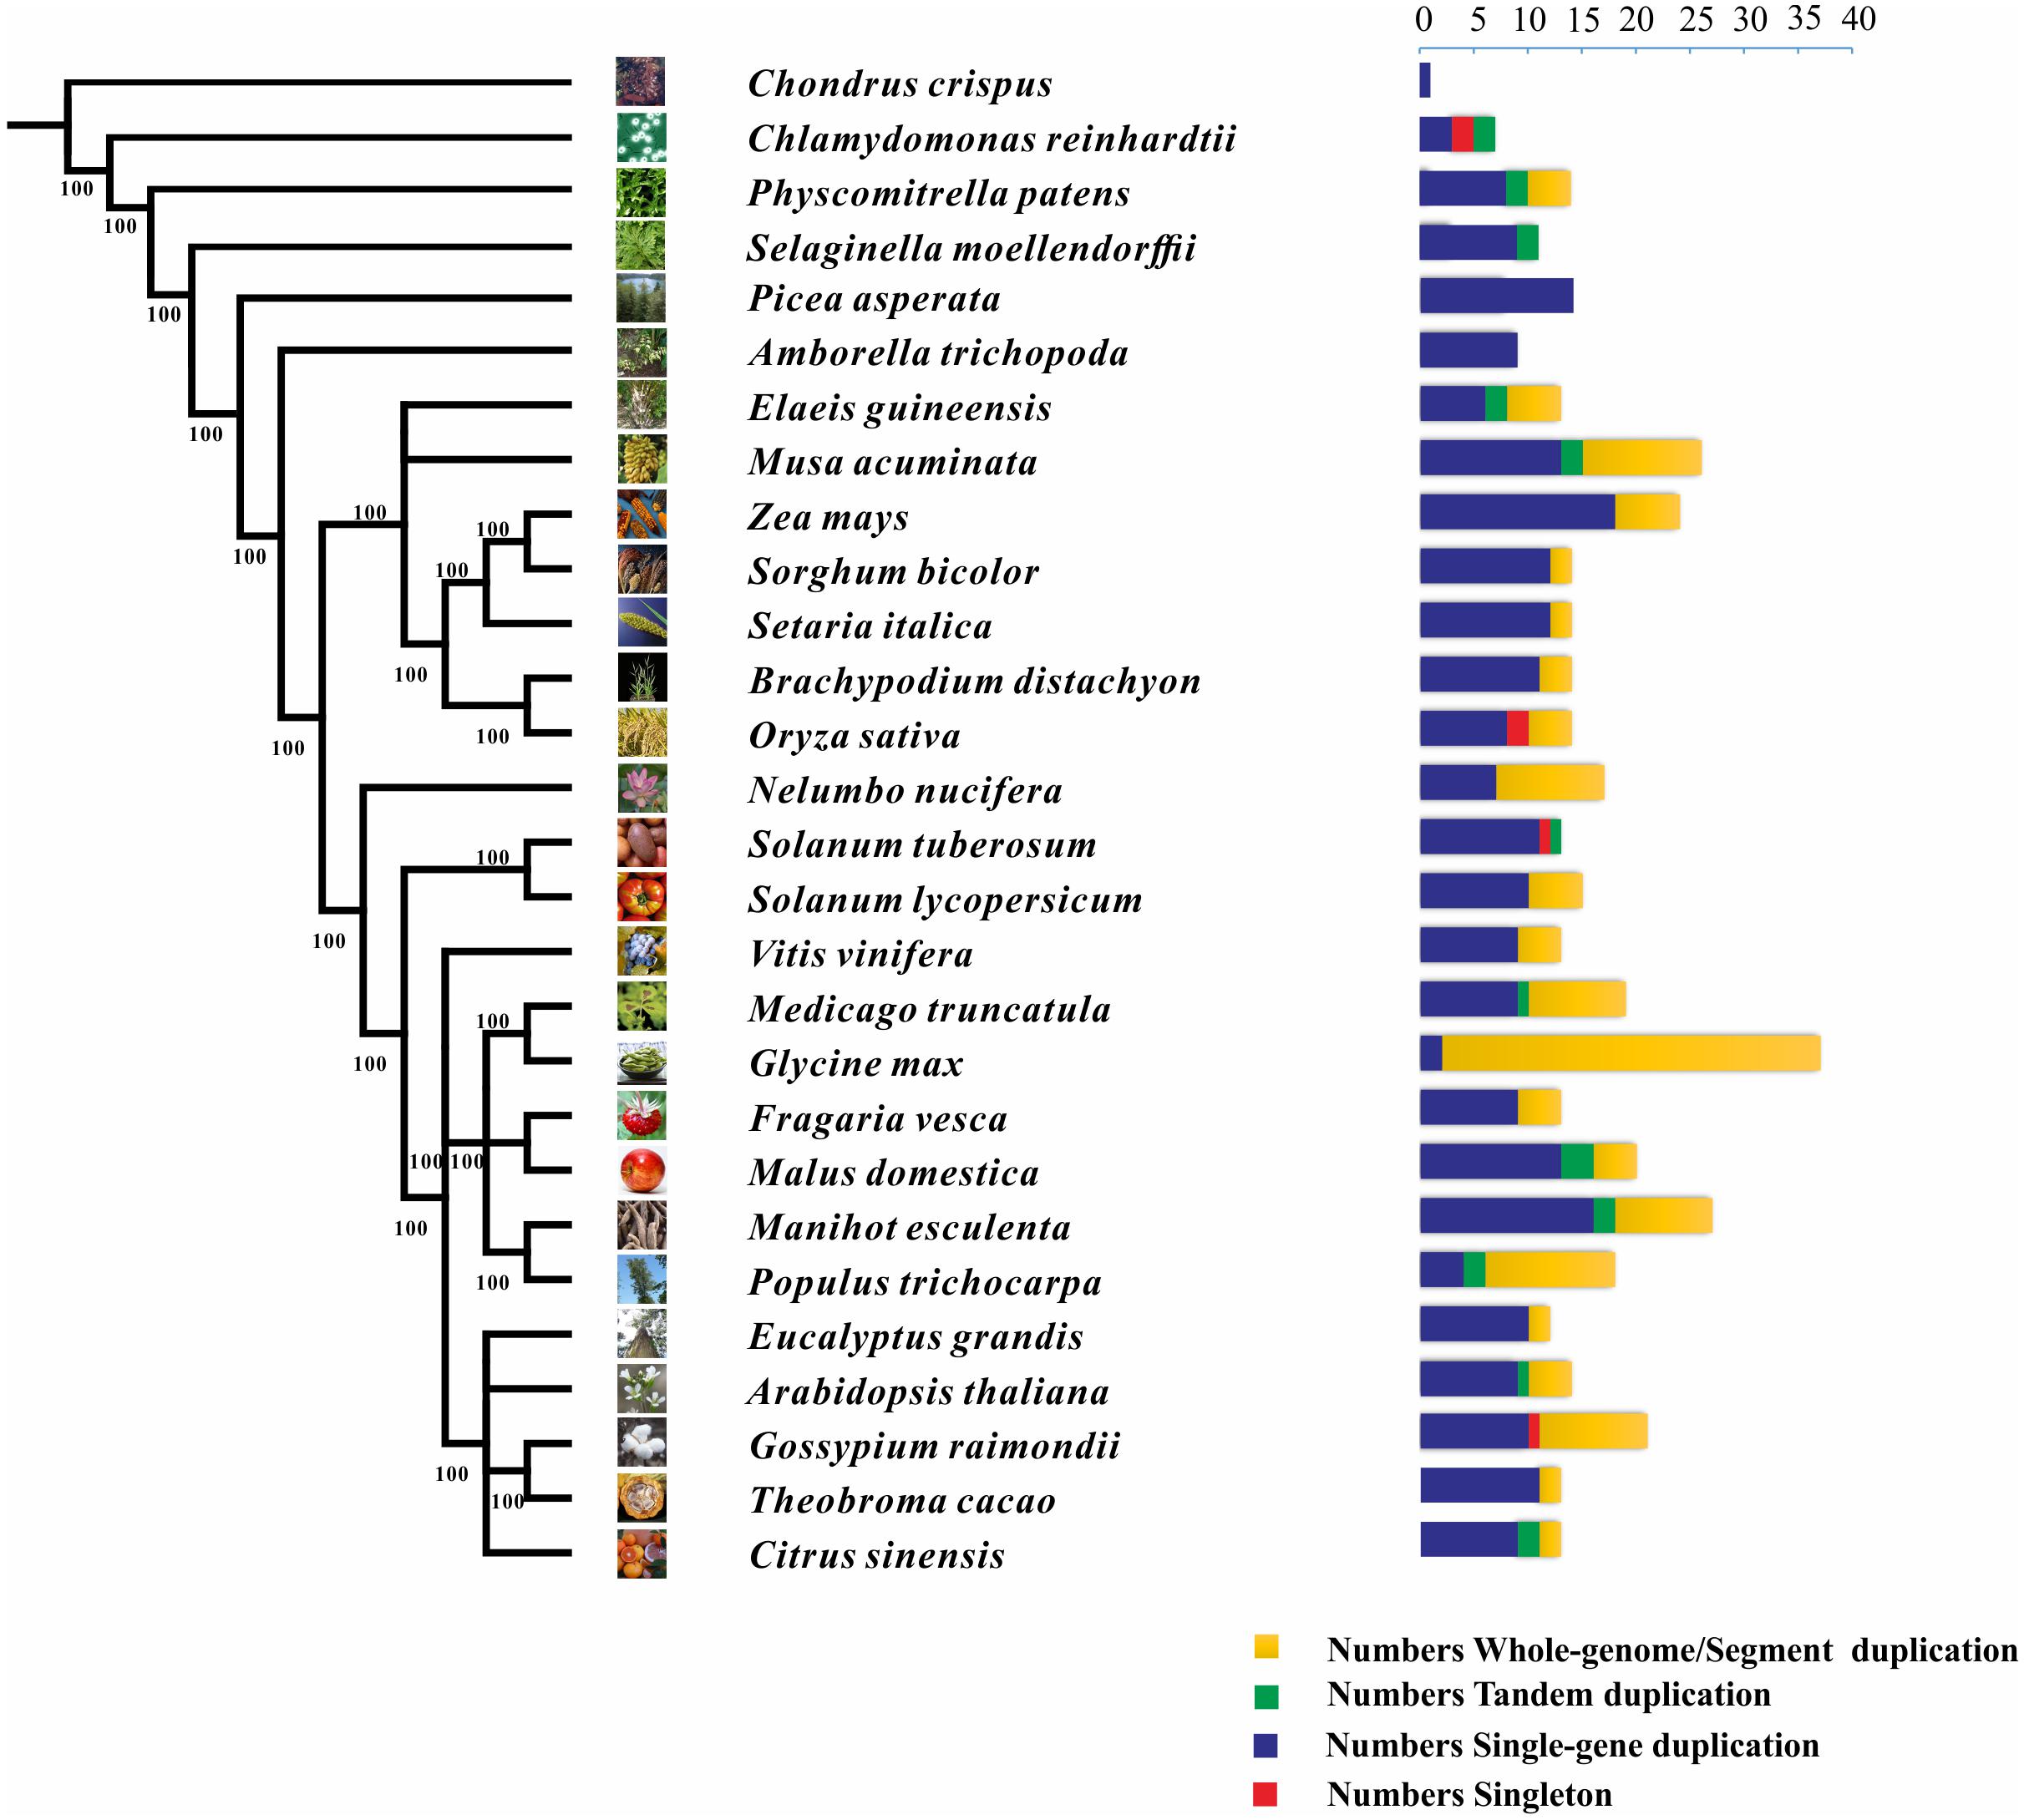
FIGURE 1. Phylogenetic relationships among 26 species and the duplication modes of the NCS2 gene family. Green, red, yellow, and blue represent tandem, singleton, whole-genome/segmental, and single-gene duplication modes, respectively.
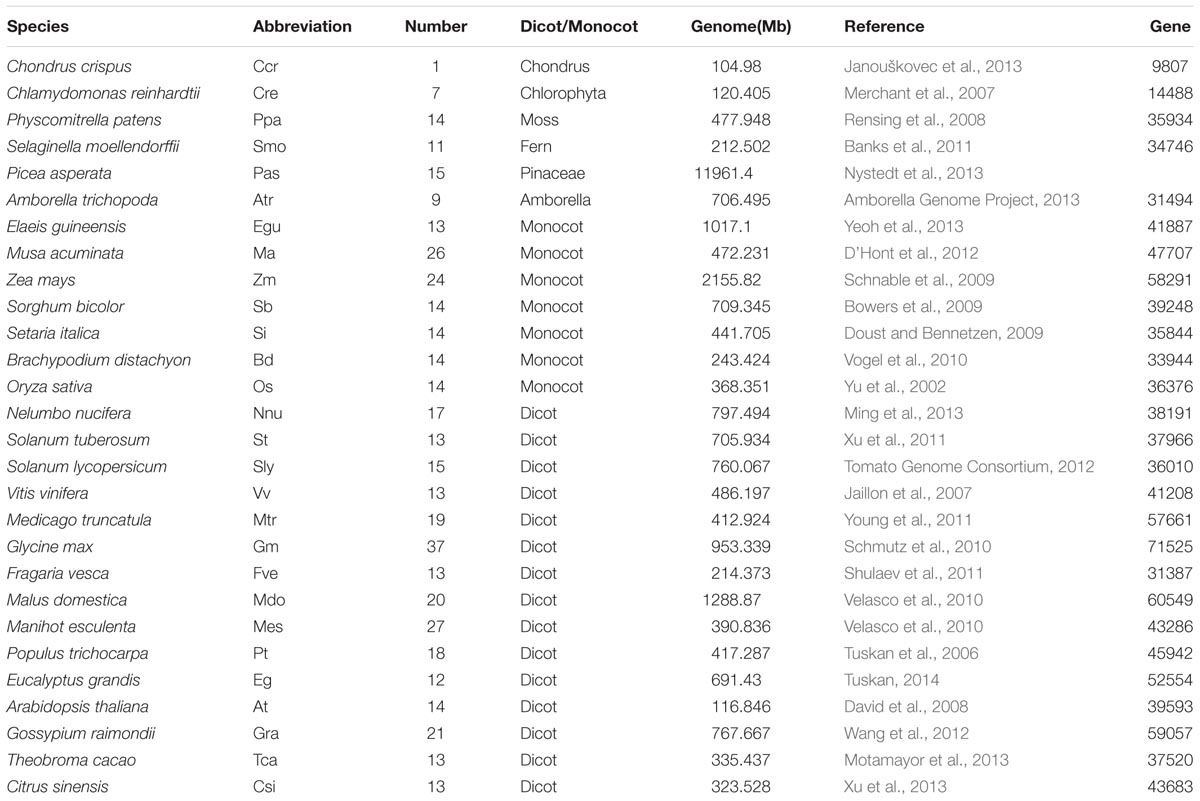
TABLE 2. Details of the 28 analyzed species.
Duplication Modes Involved in the Expansion of the NCS2 Gene Family
Diverse modes of gene duplication, especially WGDs and tandem duplications, were important in increasing the number of early diverging groups of land plants (Du et al., 2015). The duplication modes associated with the NCS2 genes were analyzed to characterize the expansion and variability of NCS2 homologs in the surveyed plants. Duplicated types of NCS2 genes were elucidated from the PLAZA website15. The NCS2 genes underwent WGD and/or tandem duplication events in all of the surveyed plant species, with the exception of C. crispus, P. asperata, and A. trichopoda. In G. max, which contained the greatest number of NCS2 genes, 33 of 35 NCS2 homologs were generated from WGD events. Tandem duplications were important for the expansion of the NCS2 gene family in some species, including S. lycopersicum, C. reinhardtii, and S. moellendorffii. Additionally, WGD events were critical for NCS2 gene family expansion in species such as N. nucifera, G. max, and G. raimondii. Furthermore, tandem duplication and WGD events contributed to the expansion of the NCS2 gene family in some species, including A. thaliana, P. patens, E. guineensis, M. acuminata, and P. trichocarpa. An analysis of the NCS2 gene family’s expansion in maize revealed a lack of tandem duplication events. However, six NCS2 genes resulted from WGD events and 18 NCS2 genes were the product of single-gene duplications (Paterson, 2012). Our results indicated that WGD (or SD) events and single-gene duplications were primarily responsible for the expansion of the ZmNCS2 family.
We also investigated the chromosomal synteny among maize NCS2 genes and in three other plant species (Figure 2). A comparative analysis was used to identify orthologous NCS2 genes among A. thaliana, maize, rice, and sorghum. We identified 69 syntenic gene pairs between maize and sorghum and 12 syntenic gene pairs between maize and rice (Figure 2), suggesting that maize is more closely related to sorghum than to rice (Tikhonov et al., 1999). These results are also consistent with an earlier study, which concluded that sorghum and maize diverged 11.9 million years ago, while rice diverged from the common ancestor of maize and sorghum 50 million years ago (Lai et al., 2004). Interestingly, we detected only one collinear gene pair between A. thaliana and maize.
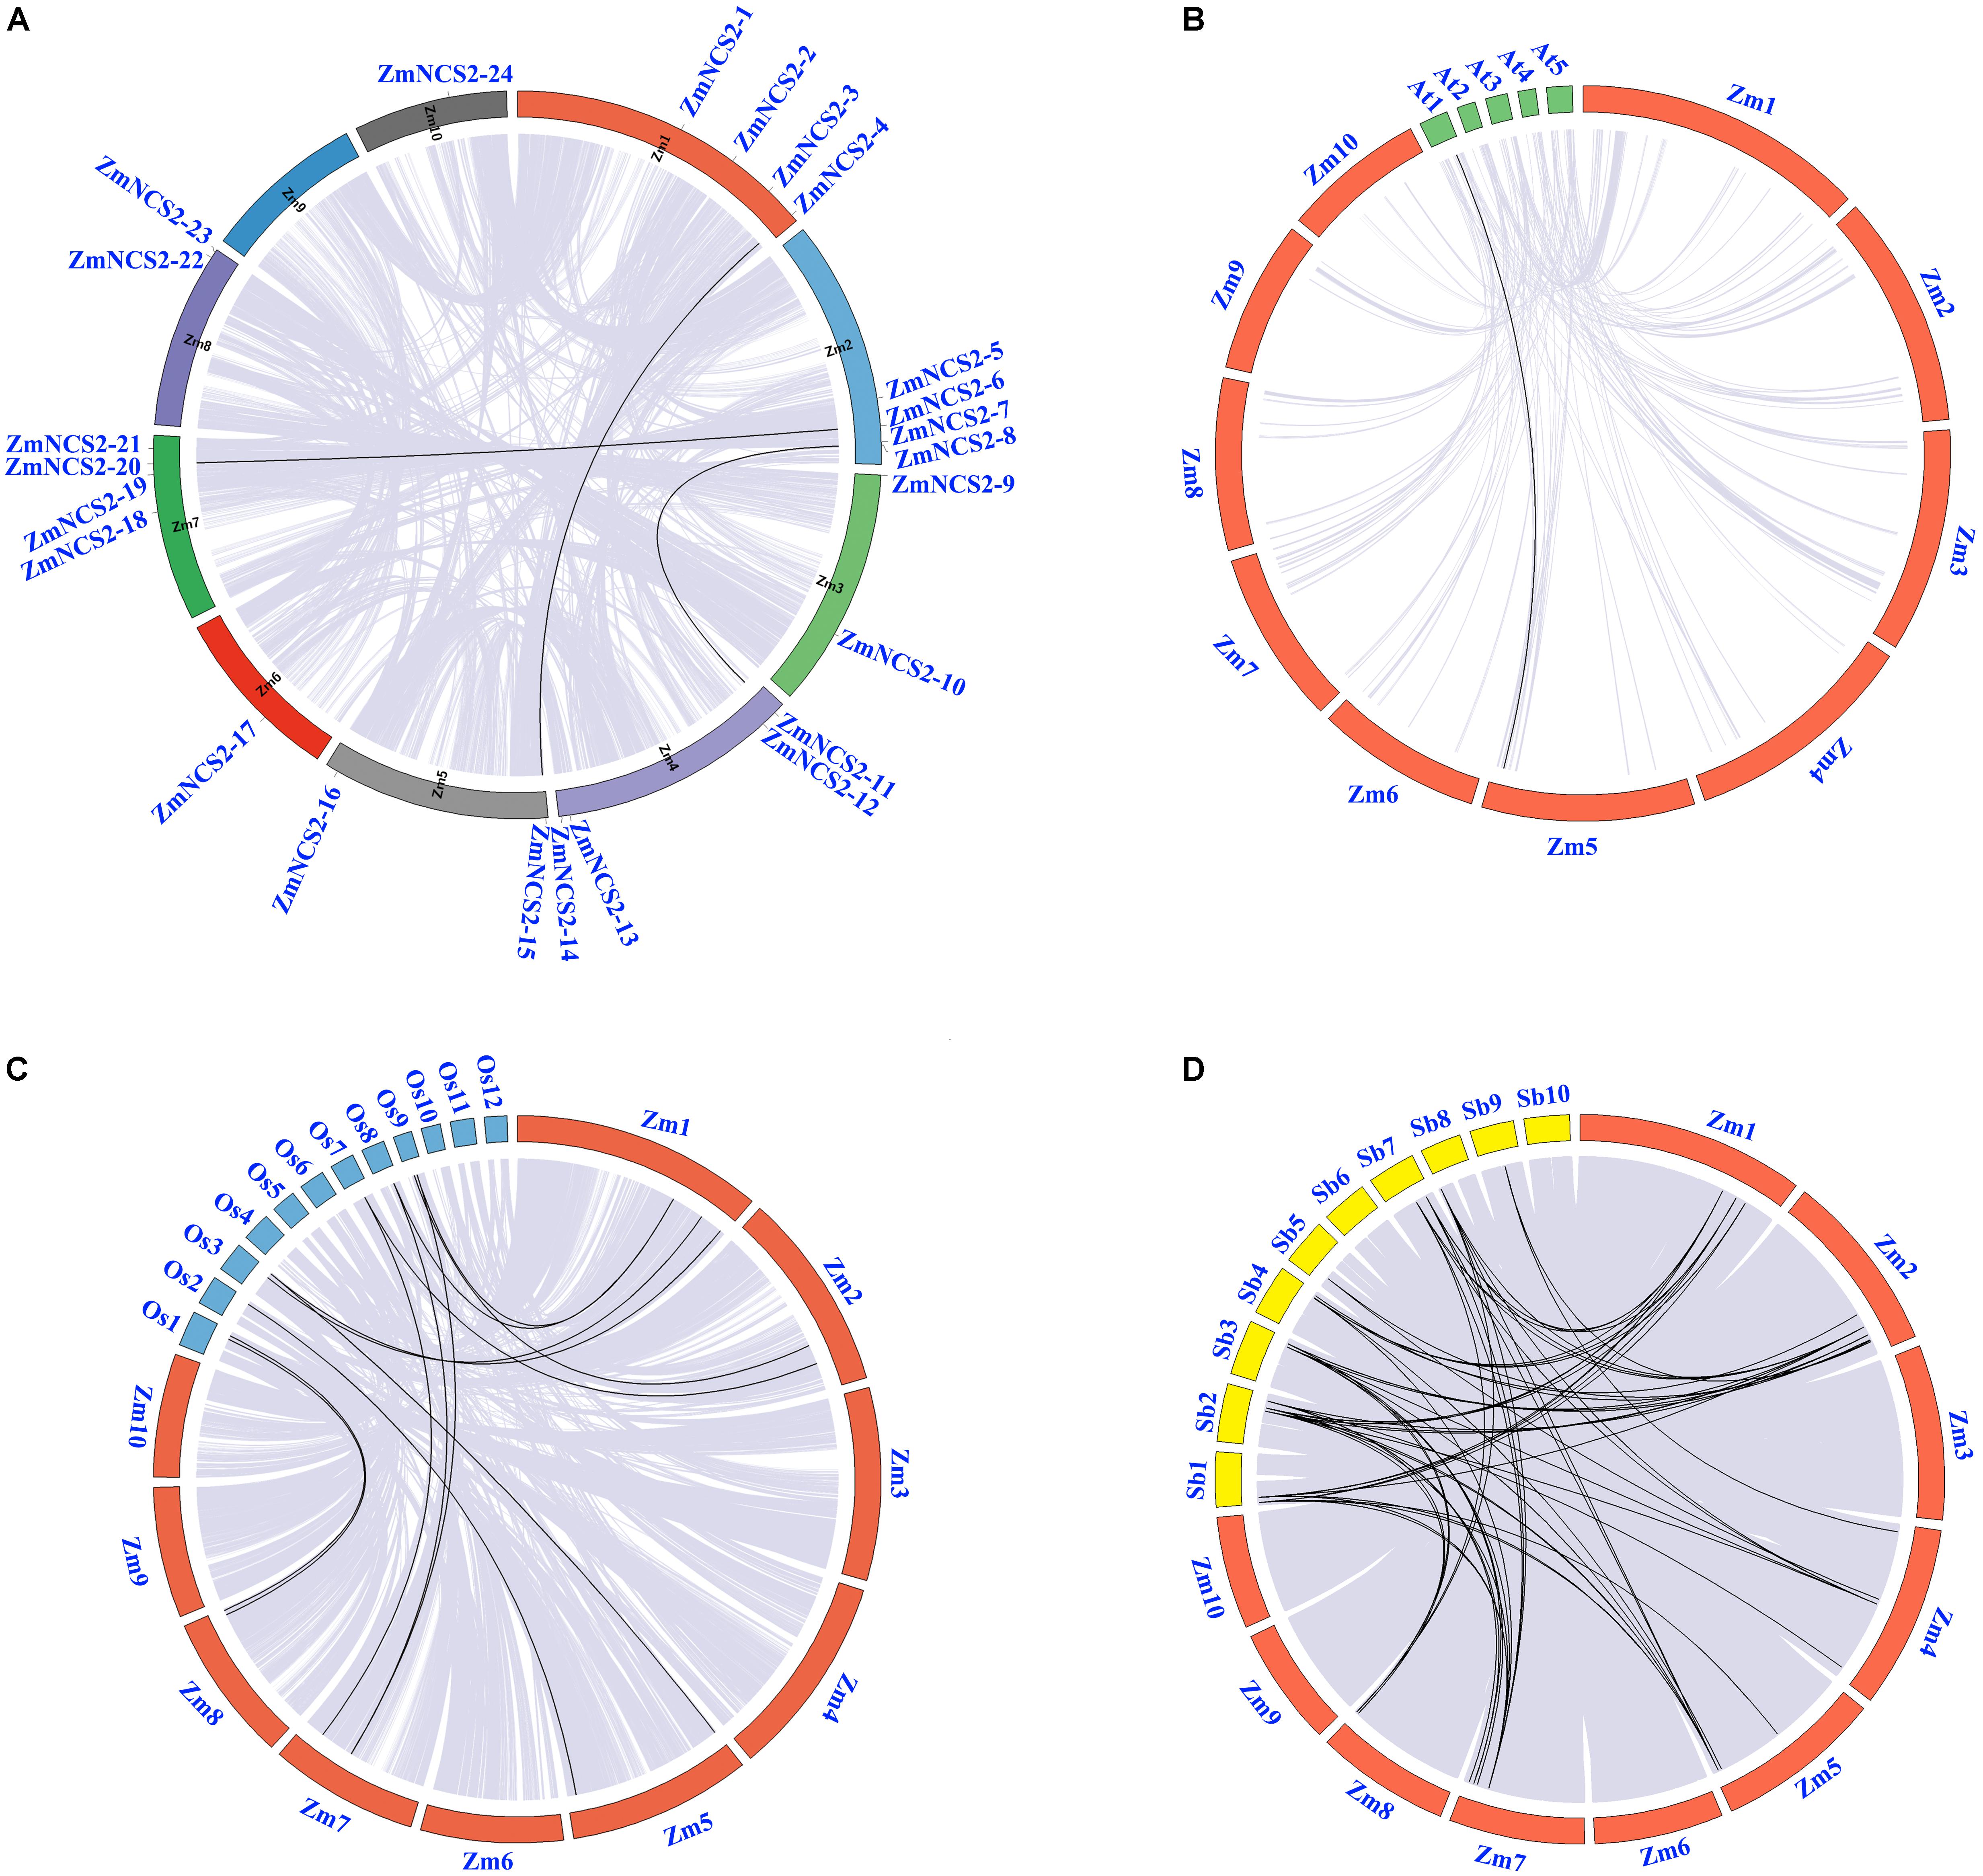
FIGURE 2. Microsyntenic relationships among the NCS2 regions in Zea mays, Sorghum bicolor, and Oryza sativa. (A) Chromosomal locations of ZmNCS2 genes and WGD paralogous genes in maize. (B–D) Zea mays (Zm), Sorghum bicolor (Sb), and Oryza sativa (Os) chromosomes are presented in different colors. Black lines represent syntenic relationships between NCS2 regions.
Phylogenetic Analysis of NCS2 Genes in Different Species
To clarify the evolutionary history of NCS2 homologs in different plant lineages, we examined the phylogenetic relationships among 255 NCS2 genes from 20 species representing most of the plant kingdom. These included two aquatic species (C. crispus and C. reinhardtii), one moss (P. patens), one fern (S. moellendorffii), one gymnosperm (P asperata), one Amborellales (A. trichopoda), seven monocots (B. distachyon, O. sativa, S. italica, S. bicolor, Z. mays, E. guineensis, and M. acuminata) and seven dicots (A. thaliana, S. tuberosum, S. lycopersicum, T. cacao, V vinifera, P. trichocarpa, and N. nucifera). Unrooted phylogenetic trees were constructed based on the NJ, ML and Bayesian methods (Figure 3, Supplementary Figure S2, and Supplementary Table S2, respectively). Because of the similarity in the tree topologies, only the NJ phylogenetic tree was used for further analysis. According to the topological relationships and bootstrap values, our phylogenetic tree comprised three subfamilies (Table 3), each with a different number of NCS2 homologs. Subfamilies I and III consisted of 54 and 47 genes, respectively, while subfamily II included as many as 154 genes (Table 3), indicative of considerable gene expansion. In particular, based on the homology levels of NCS2 genes with functionally characterized members, two identified NCS2/AzgA-like genes, AtAzg1 and AtAzg2, clustered within subfamily I, and the genes in subfamily I belonged to the NCS2/AzgA-like family. All of the identified NCS2/NAT genes clustered within subfamilies II and III, and their members were further classified as NCS/NAT genes (Supplementary Table S3). Additionally, the C. crispus (red alga) NCS2 gene was included in subfamily I, while the C. reinhardtii (green alga) NCS2 genes clustered in subfamilies I and II. All of the remaining analyzed species possessed NCS2 genes from all three subfamilies. These data were consistent with the ancient origins of the subfamily I NCS2/AzgA-like homologs and the more recent origin of the subfamily III NCS2/NAT members. Moreover, the fact that subfamily II contained the most NCS2 genes suggested that recent duplications occurred after species diverged from a common ancestor.
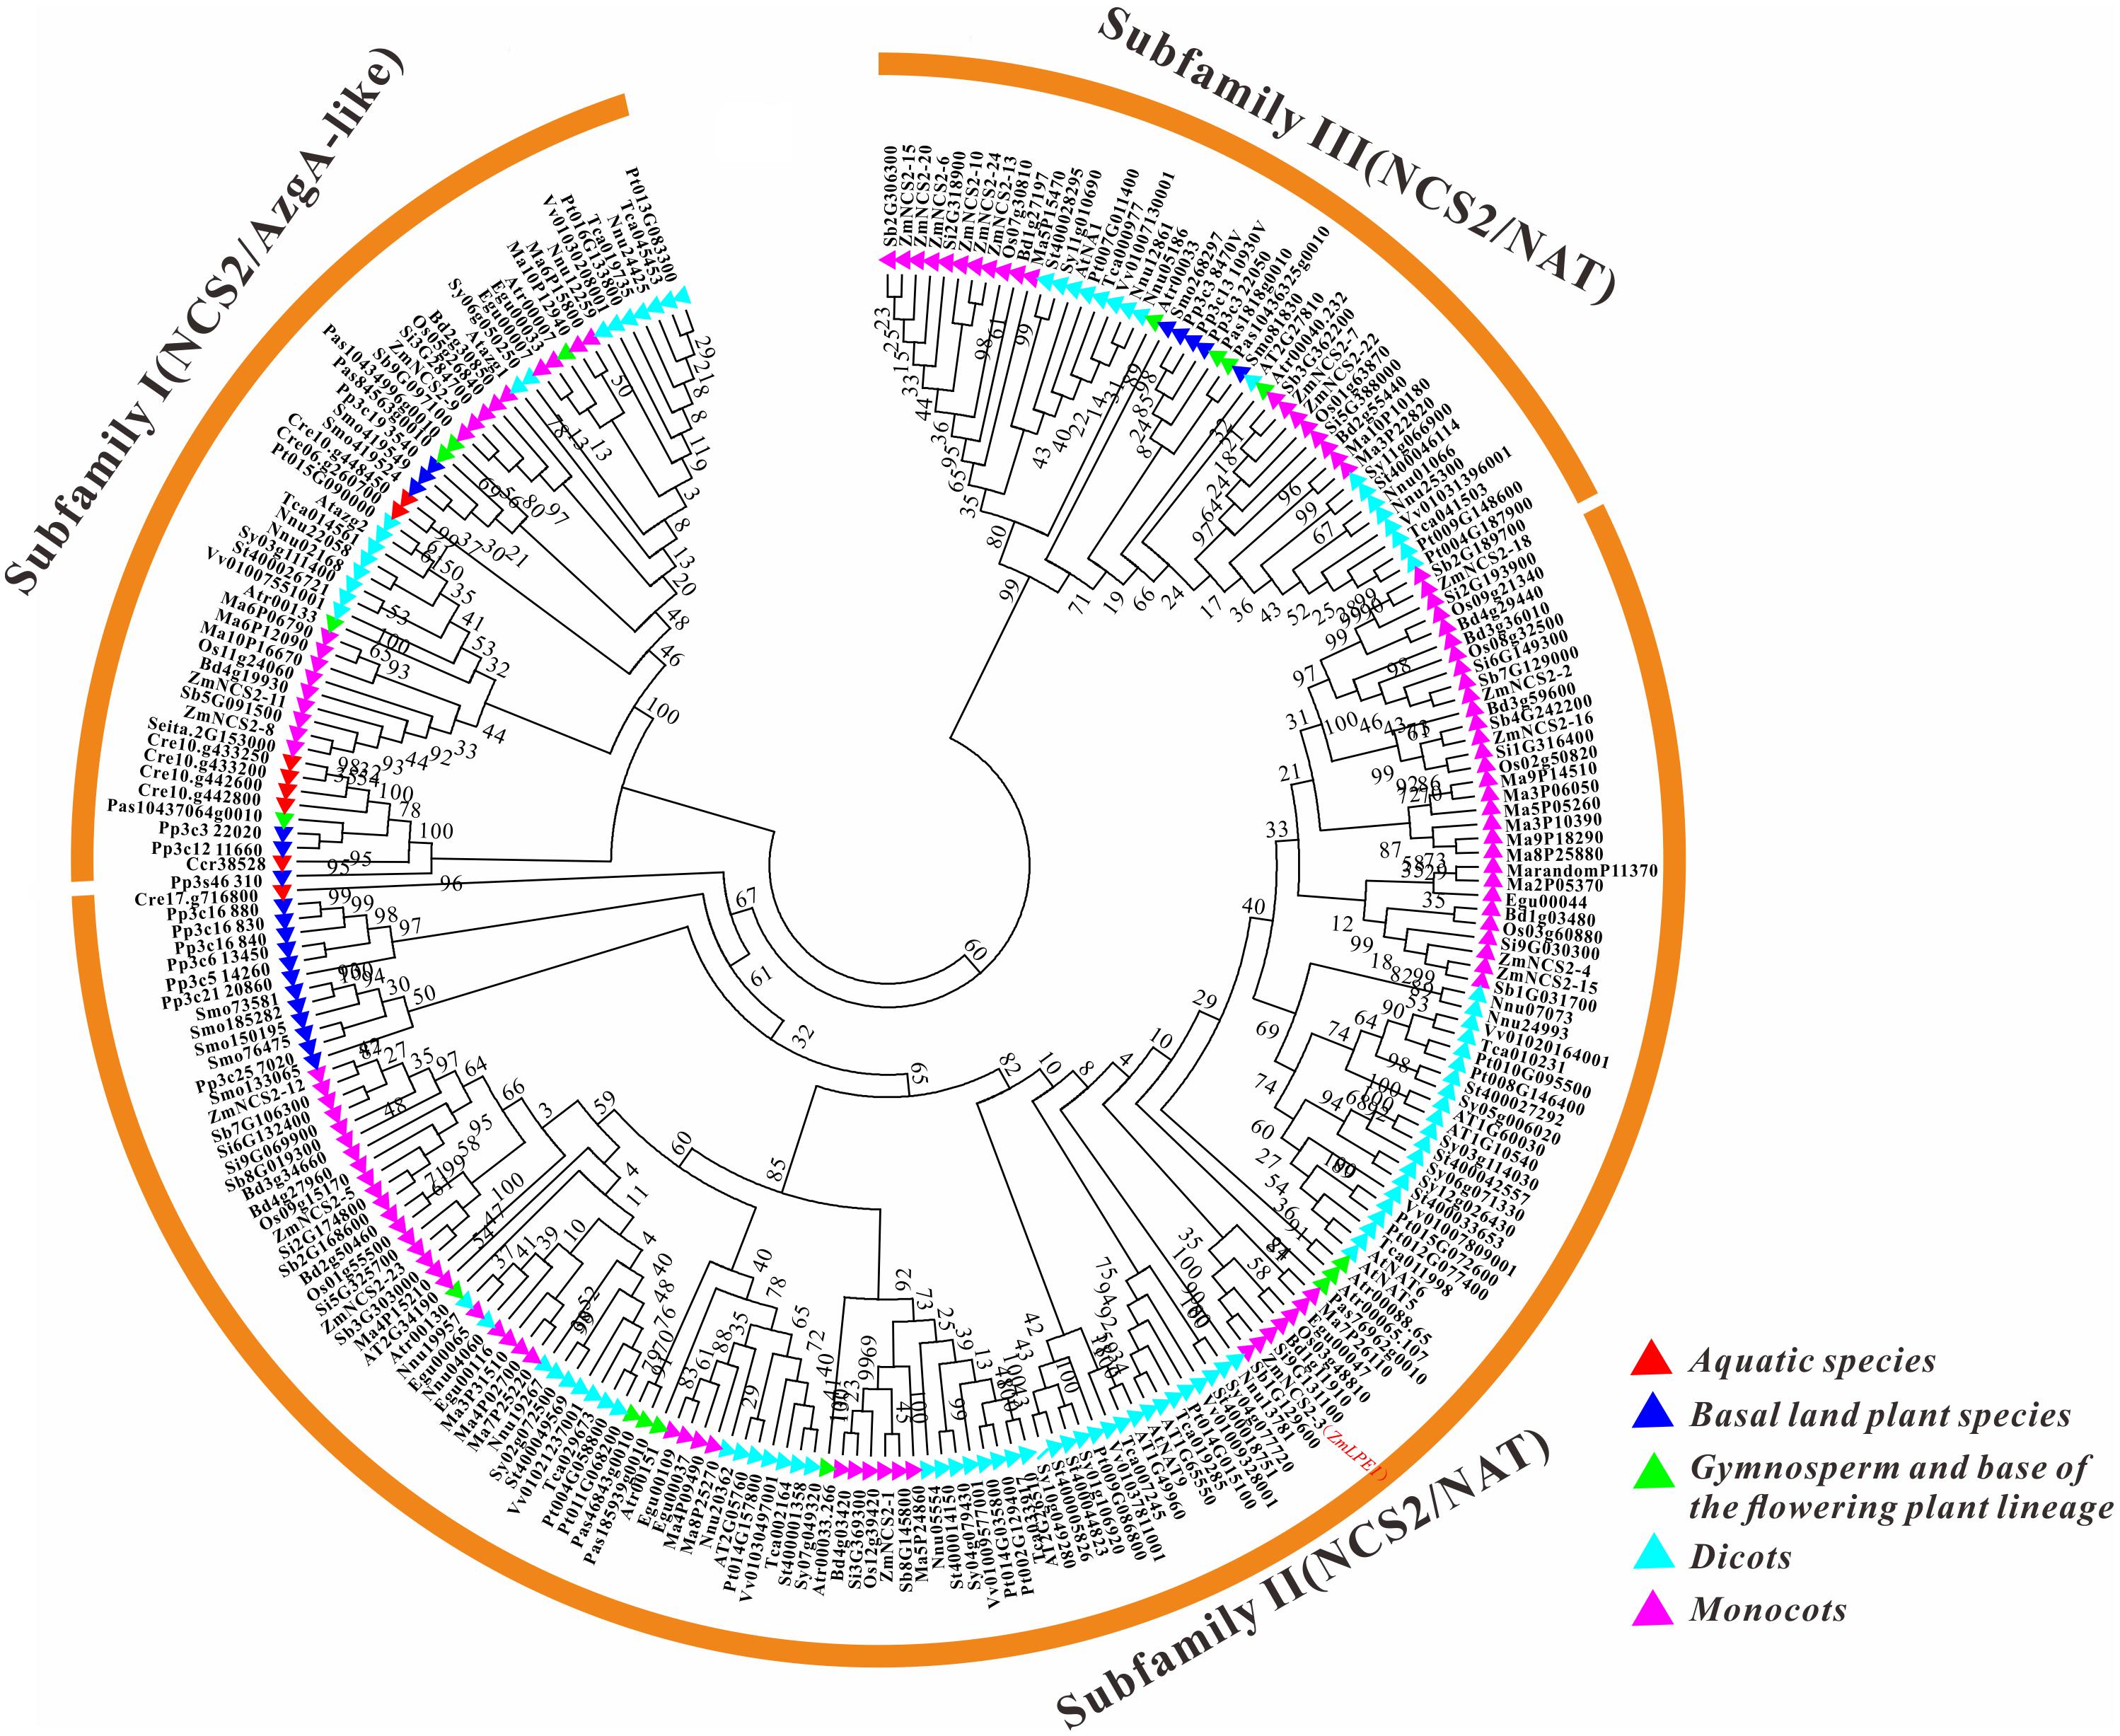
FIGURE 3. Phylogenetic analysis of NCS2 genes in 20 species. A phylogenetic tree containing proteins encoded by all of the NCS2 genes from 20 species was constructed using the neighbor-joining method after the full-length protein sequences were aligned. Red: aquatic plants (Chondrus crispus and Chlamydomonas reinhardtii); blue: early diverging plants (Physcomitrella patens and Selaginella moellendorffii); green: gymnosperm (spruce) and a flowering plant (Amborella trichopoda); light blue: dicots (Theobroma cacao, Arabidopsis thaliana, Nelumbo nucifera, Solanum lycopersicum, Vitis vinifera, Populus trichocarpa, and Solanum tuberosum); and purple: monocots (Musa acuminata, Elaeis guineensis, Zea mays, Sorghum bicolor, Setaria italica, Brachypodium distachyon, and Oryza sativa).
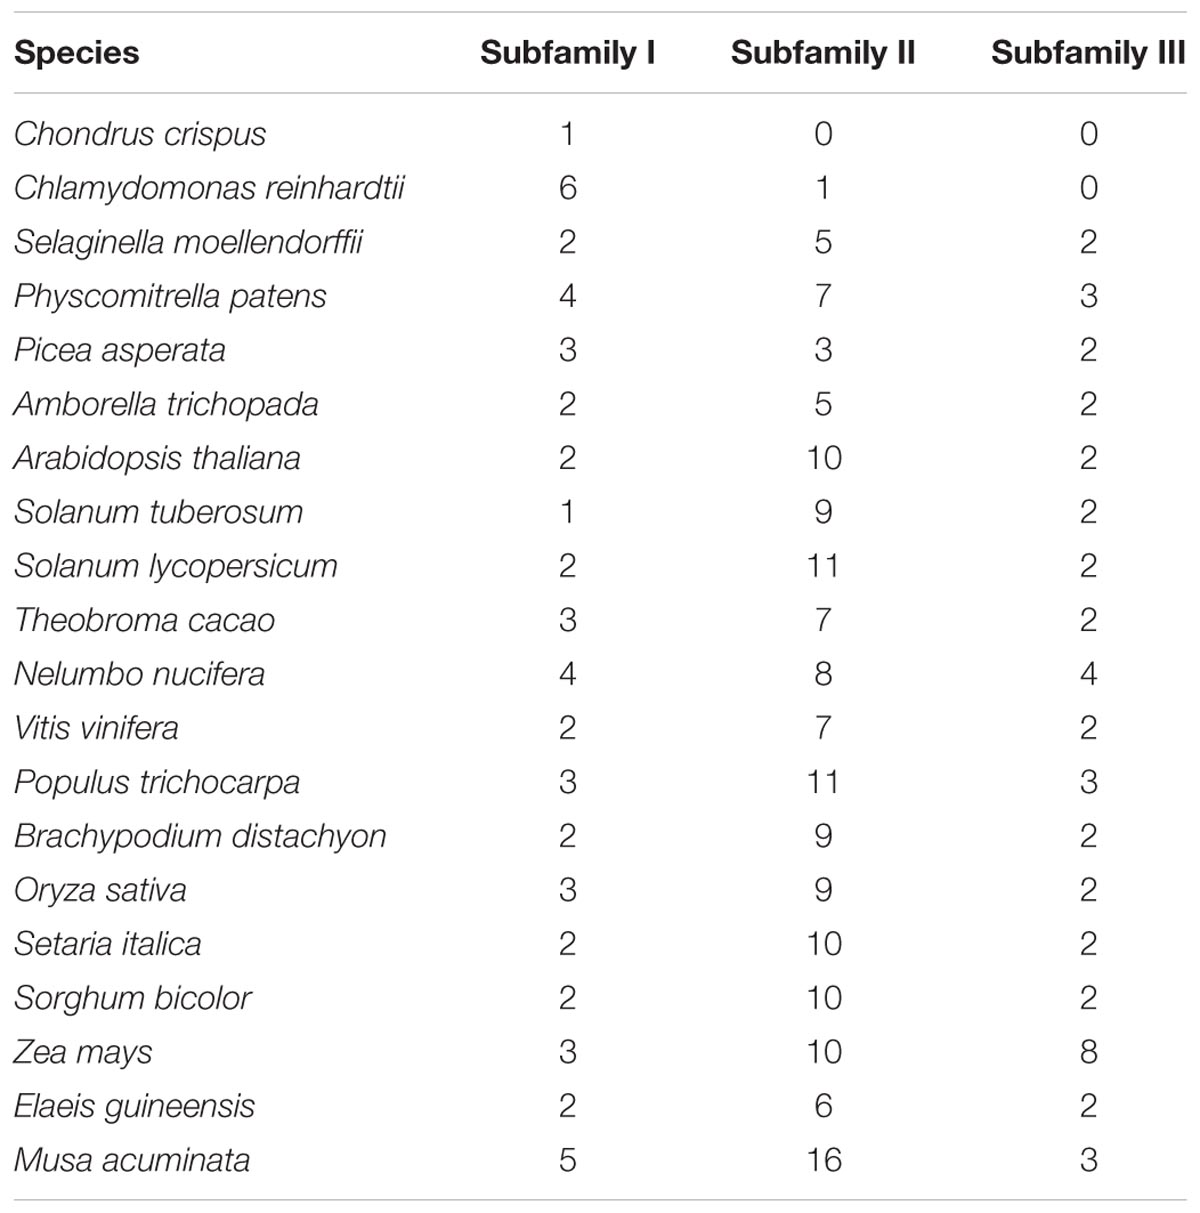
TABLE 3. The istribution of NCS2 genes in different subfamilies.
Subsequently, we examined the motif compositions of the NCS2 proteins encoded by genes in different clades. Five putative motifs appeared to correspond to a typical NCS2 domain (xanthine/uracil/vitamin C permease) (Figure 4). Motifs 1 and 4 were annotated with the xanthine/uracil/vitamin C permease domains, which are associated with transporter activities. Additionally, motif 4 included the core region of the NCS2/NAT domain “ENXGLLGLTR.” The NCS2 proteins clustered within the same subfamily shared similar motif compositions. Almost all of the subfamily I NCS2/AzgA-like proteins from land plants contained only motifs 1, 2, and 3, which is consistent with previous studies (Amillis and Koukaki, 2001; Cecchetto et al., 2004; Mansfield et al., 2009). The C. crispus NCS2 protein contained motifs 4 and 5. Most of the proteins in subfamilies II and III harbored all five motifs and a complete NCS2/NAT domain.
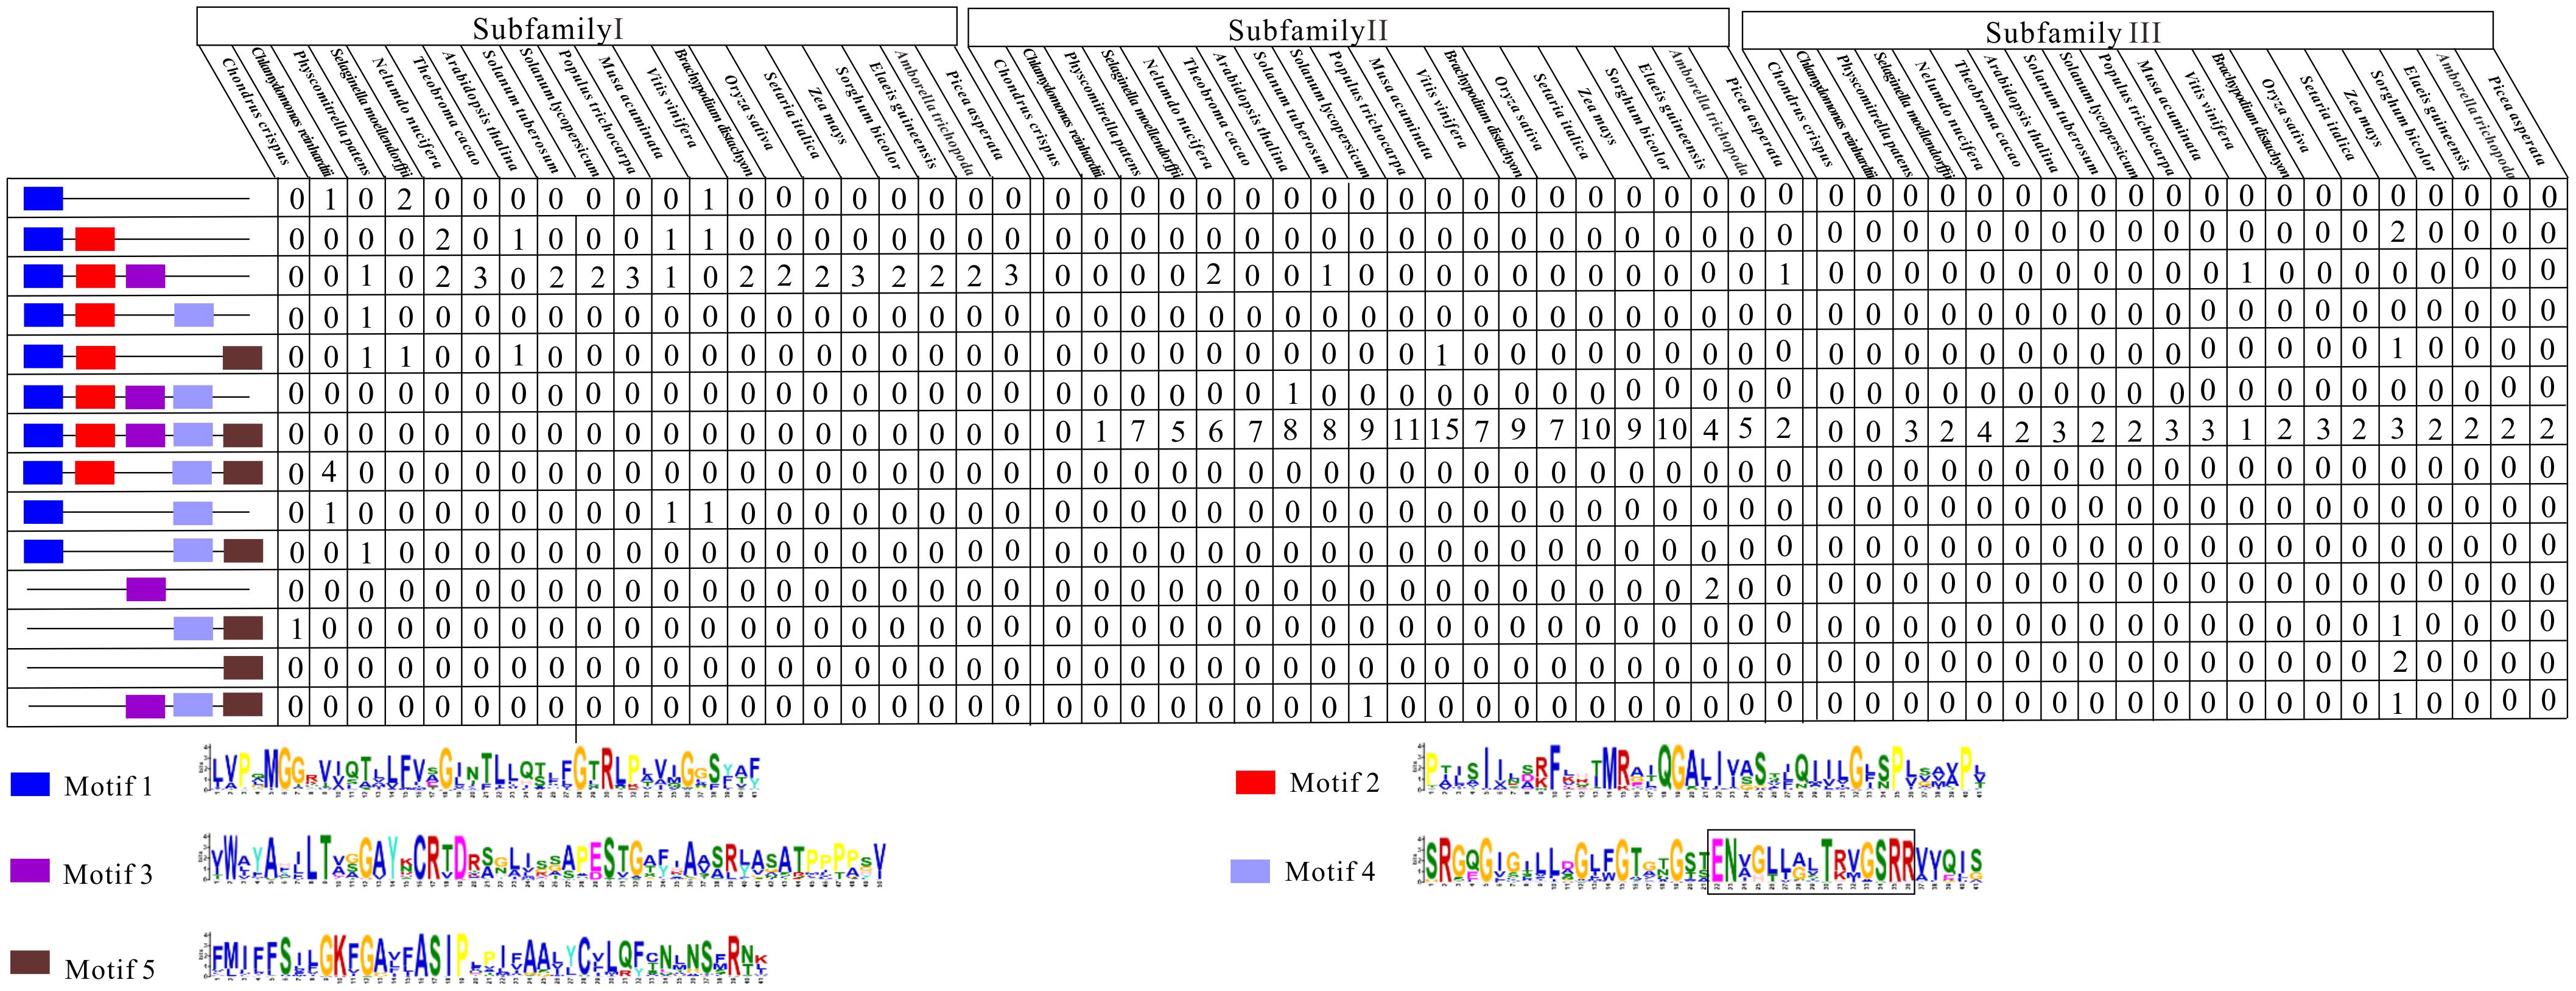
FIGURE 4. Conserved motifs of NCS2 family proteins in 20 species. Conserved protein motifs in NCS2 proteins were identified using the MEME program. Motifs are indicated with different colors. Motif 4 includes the core region of the NCS2/NAT domain “ENXGLLGLTR”.
Maize NCS2 Gene Evolution Was Driven by Purifying Selection
The molecular evolution rate was estimated to further characterize the evolution of the maize NCS2 genes. The ratio of Ka to Ks substitutions is an essential parameter of molecular evolution. A Ka/Ks value greater than 1 generally indicates positive selection, while a value less than 1 indicates negative or purifying selection. We calculated the Ka/Ks values for the Z. mays paralogs. For a thorough examination of maize paralog pairs, we constructed an NJ tree based only on maize proteins (Figure 5). Genes with more than 50% homology were considered to be paralog pairs. Twenty-eight maize paralog pairs were identified, and their Ka/Ks values (Table 4 and Supplementary Figure S3) were less than 1, corresponding to a strong purifying selection. The average Ka/Ks value (0.0432) of the WGD pairs was much lower than that of the single-gene duplication pairs (0.218). However, a sliding-window analysis indicated that some Ka/Ks values were greater than 1, which was consistent with positive selection (Supplementary Figure S3). For example, the Ka/Ks value of the ZmNCS2–8/11 pair was only 0.0409, but two regions in these genes had high Ka/Ks values, indicating the regions were under positive selection. Finally, based on a substitution rate of 6.5 × 10⁻⁹ substitutions per locus per year in grass species, the duplication events associated with 28 paralog pairs were estimated to have occurred 4.6–486 million years ago.
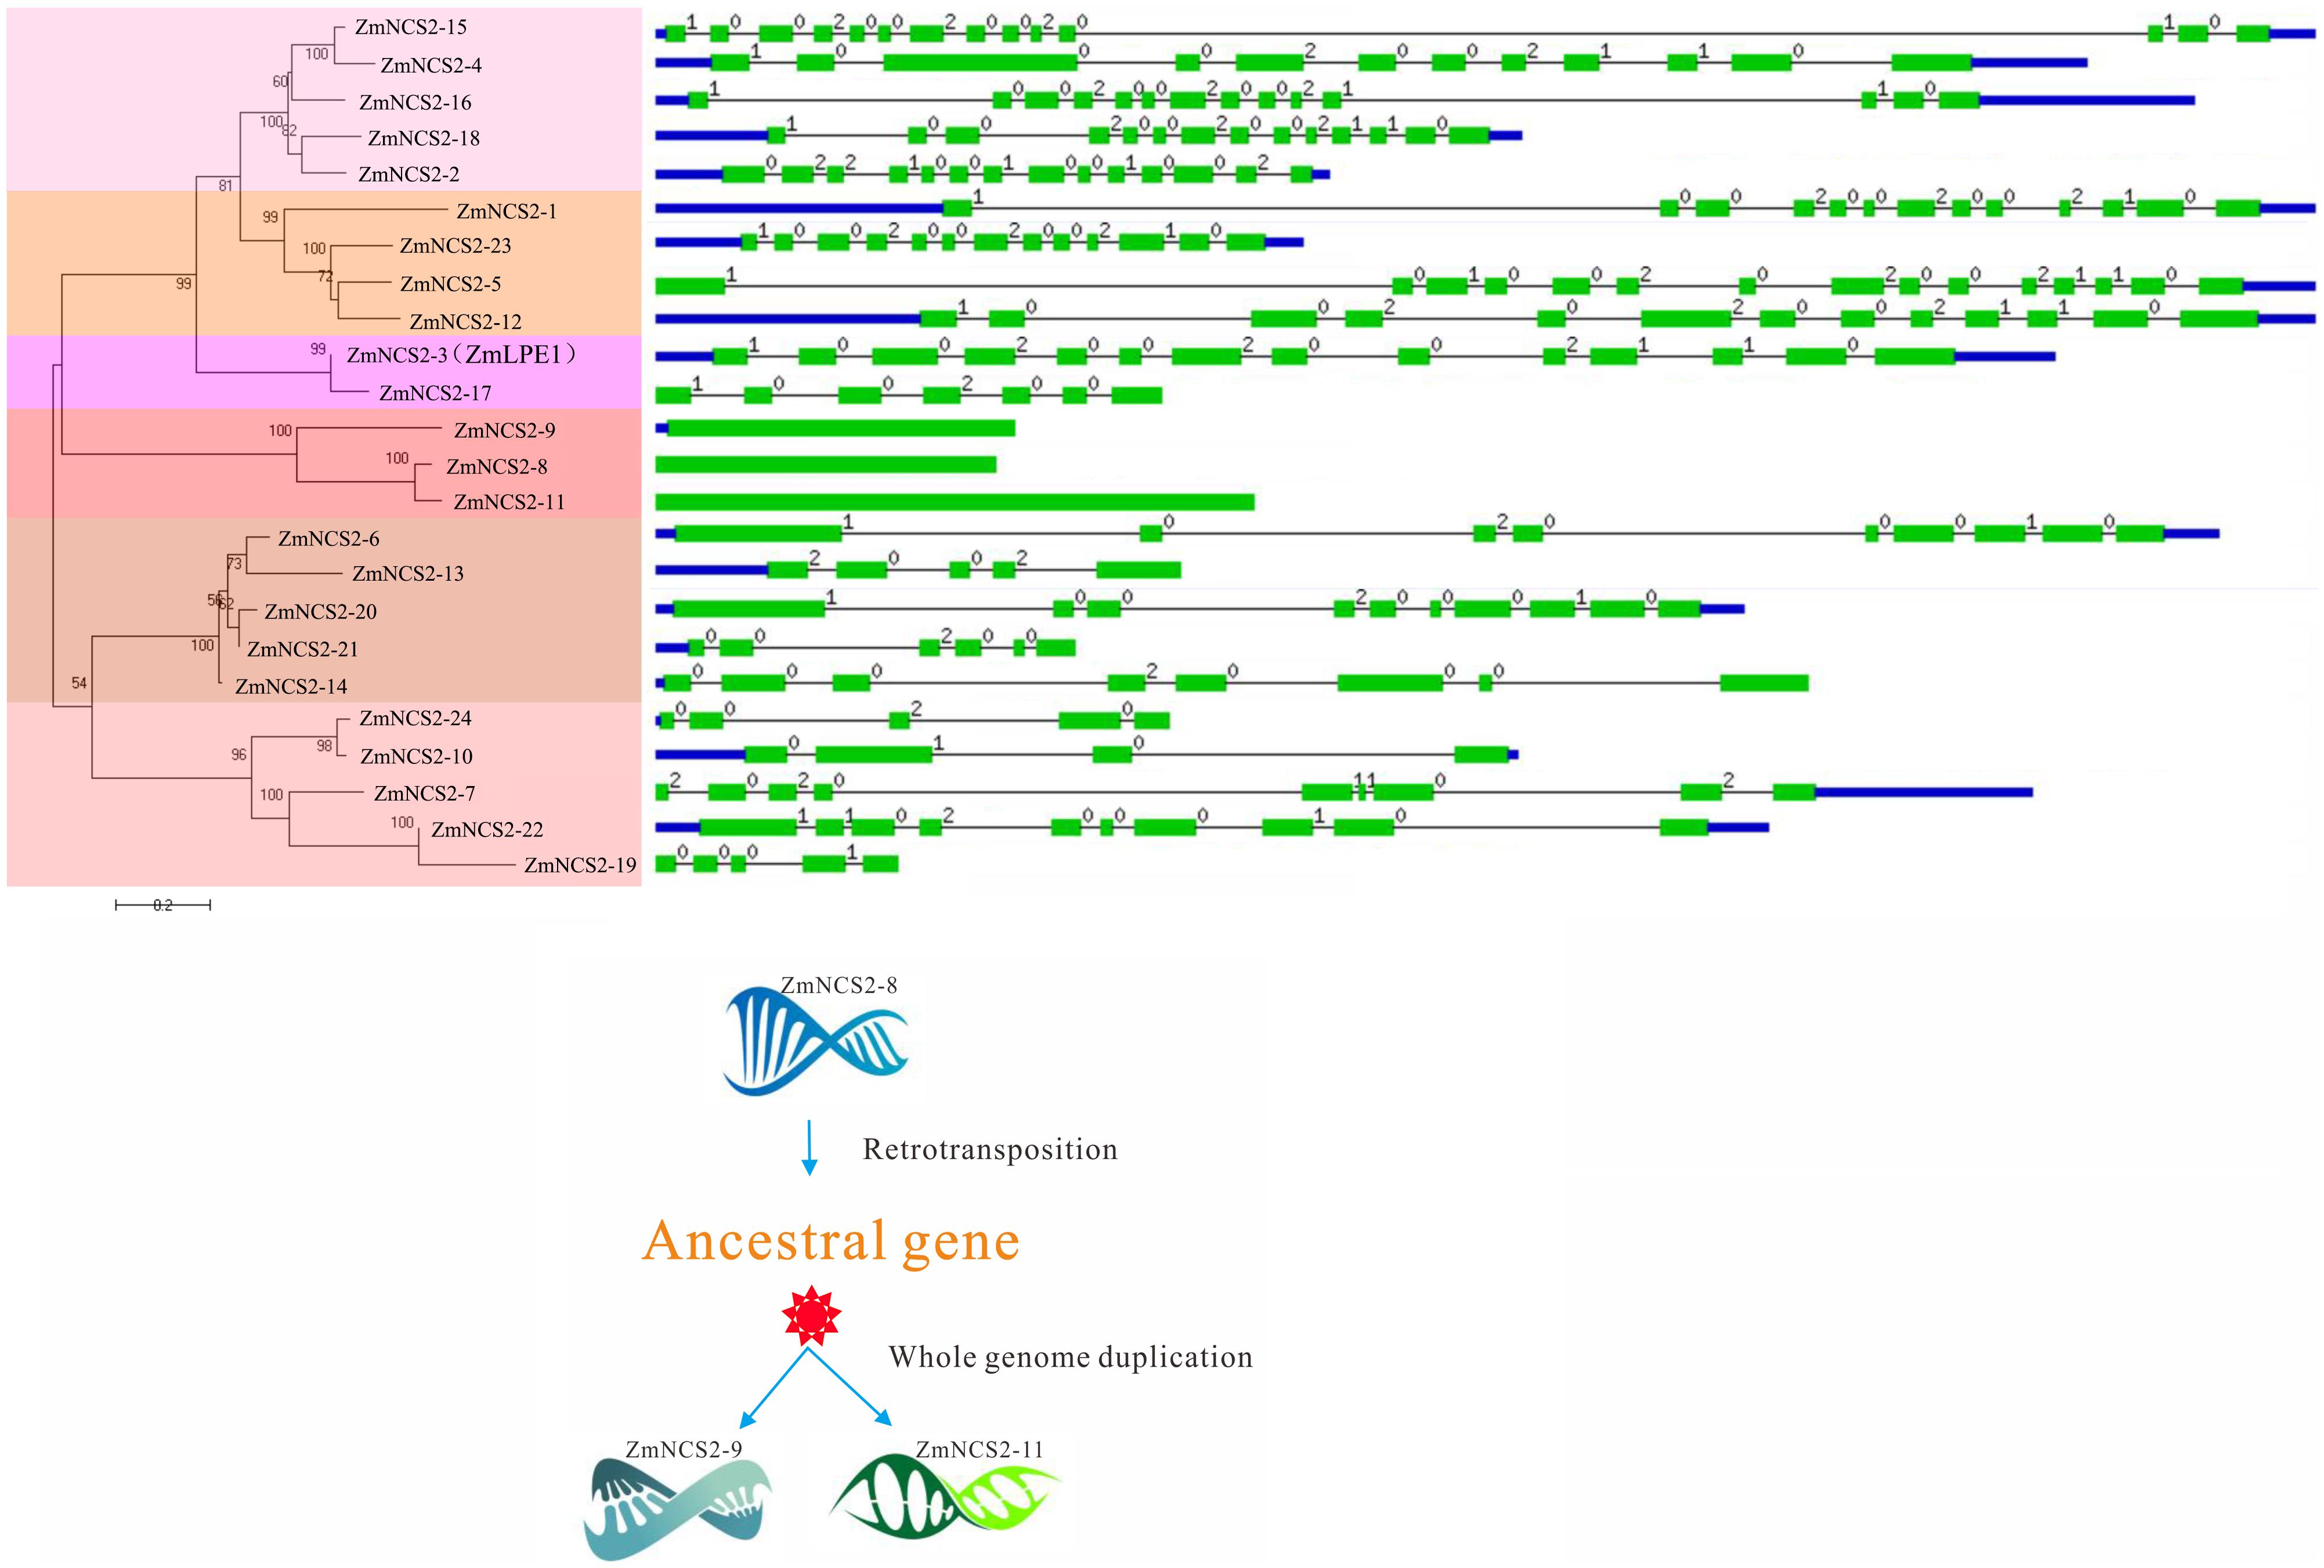
FIGURE 5. Phylogenetic and gene structural analyses of the maize NCS2 family. Phylogenetic tree of all Zea mays NCS2 genes, intron/exon structures of 24 NCS2 genes, and duplication of an intronless gene caused by retrotransposition.
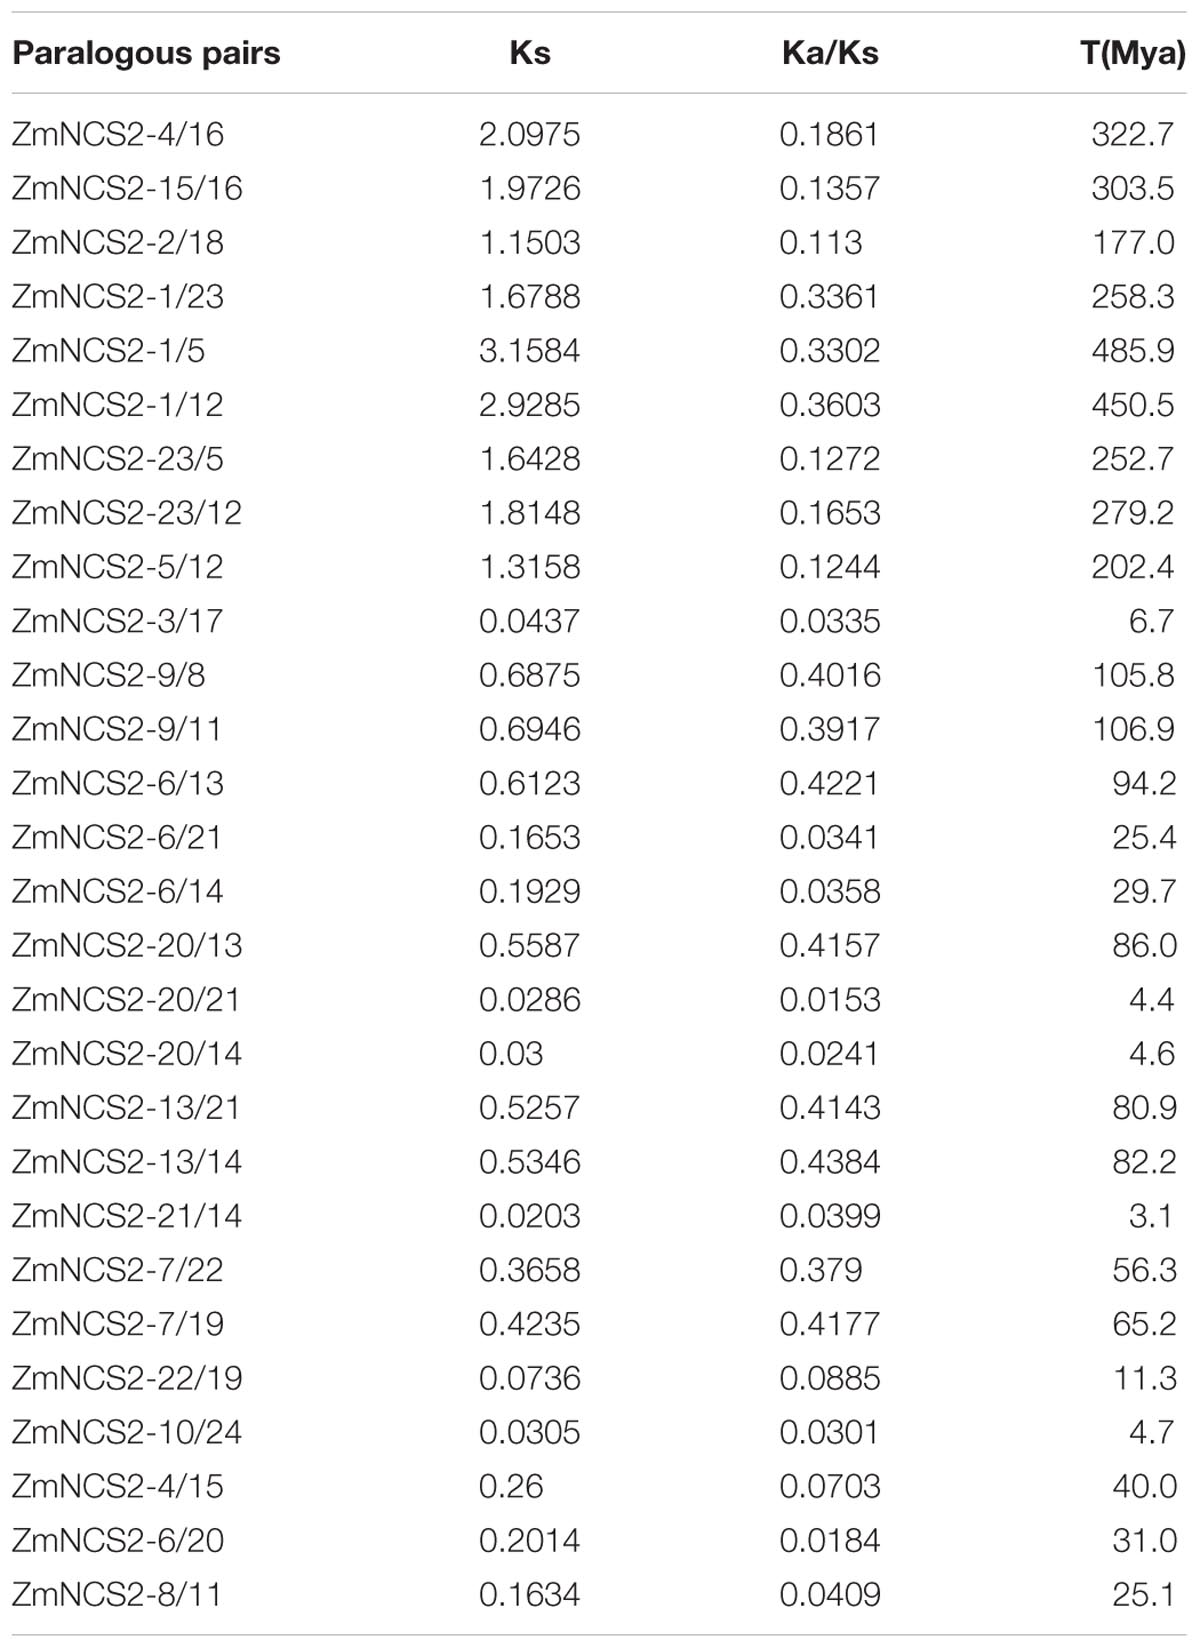
TABLE 4. Ka/Ks values and the estimated divergence times for the duplicated NCS2 paralogs in Zea mays.
Population Genetic Analysis of NCS2 Genes in 78 Inbred and 22 Wild Maize Lines
Genome resequencing data for 78 inbred and 22 wild maize lines were used to investigate NCS2 gene polymorphisms (data not published). The average nucleotide divergence of NCS2 genes in the wild lines was greater than that in the inbred lines. Additionally, for all NCS2 genes, nucleotide divergence was greater in the wild lines than in the inbred lines, implying that the NCS2 genes in the inbred lines were relatively conserved (Table 5). Additionally, the fixation index (Fst) values were calculated to determine the genetic differentiation between the inbred and wild maize populations, which was influenced by several evolutionary processes, including genetic drift and/or natural selection. Most of the Fst values were close to 0, with only ZmNCS2–2, ZmNCS2–19, ZmNCS2–20, and ZmNCS2–21 having Fst values approaching 1 (i.e., greater genetic differentiation). Finally, Tajima’s D value was used to estimate the evolutionary dynamics. Values of 0, >0, and <0 indicated the selection pressure of a sudden population contraction and a population expansion after a recent bottleneck, respectively. Tajima’s D values in the wild maize lines were <0 for all NCS2 genes, except for ZmNCS2–8, which had a Tajima’s D value of 0. In the inbred maize lines, Tajima’s D value was <0 for ZmNCS2–2, –12, –15, –16, –18, and –21, but >0 for ZmNCS2–1, –3, –4, –5, –8, –11, –19, –20, and –23.
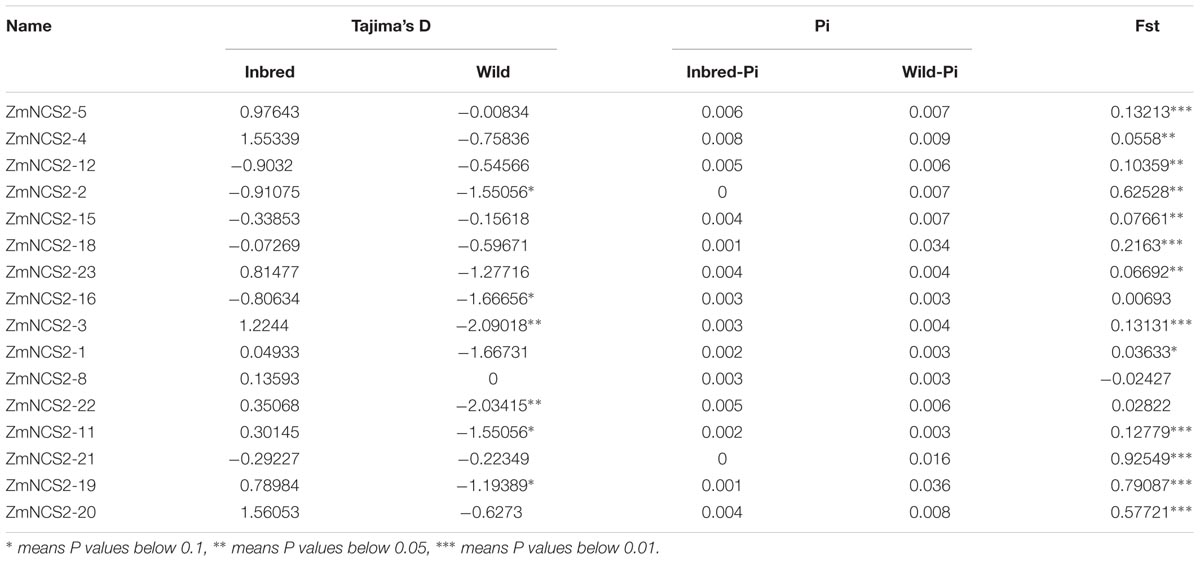
TABLE 5. Summary of Tajima’s D, Fst, and Pi values in 78 inbred and 22 wild maize lines.
Expression Characteristics of ZmNCS2 Genes Based on Transcriptome and qRT-PCR Analyses
To gain insights into their possible functions, we comprehensively examined the expression patterns of all ZmNCS2 genes using microarray data and a qRT-PCR analysis. We first analyzed the ZmNCS2 expression profiles in different tissues based on published data for 18 NCS2 genes (Stelpflug et al., 2016) (Figure 6). Genes clustered together with similar expression profiles belonged to the same clade in the phylogenetic tree. For example, the expression levels of NCS2–10, NCS2–19, and NCS2–21, which belonged to subfamily III, were almost undetectable in different maize tissues. Additionally, four members of subfamily II (NCS2–15, NCS2–4, NCS2–16, and NCS2–23) were expressed more highly in the roots than in the leaves. The three WGD pairs exhibited similar expression profiles. We observed that NCS2–6 and NCS2–20 were highly expressed in all surveyed tissues, while NCS2–8 and NCS2–11 were highly expressed in the roots, but were seldom expressed in the leaves, internodes, flowers, seeds, or endosperm. Differences in the ZmNCS2 expression patterns suggested that the encoded proteins may exhibit diverse or novel functions, which is consistent with the results of the phylogenetic and protein motif analyses.
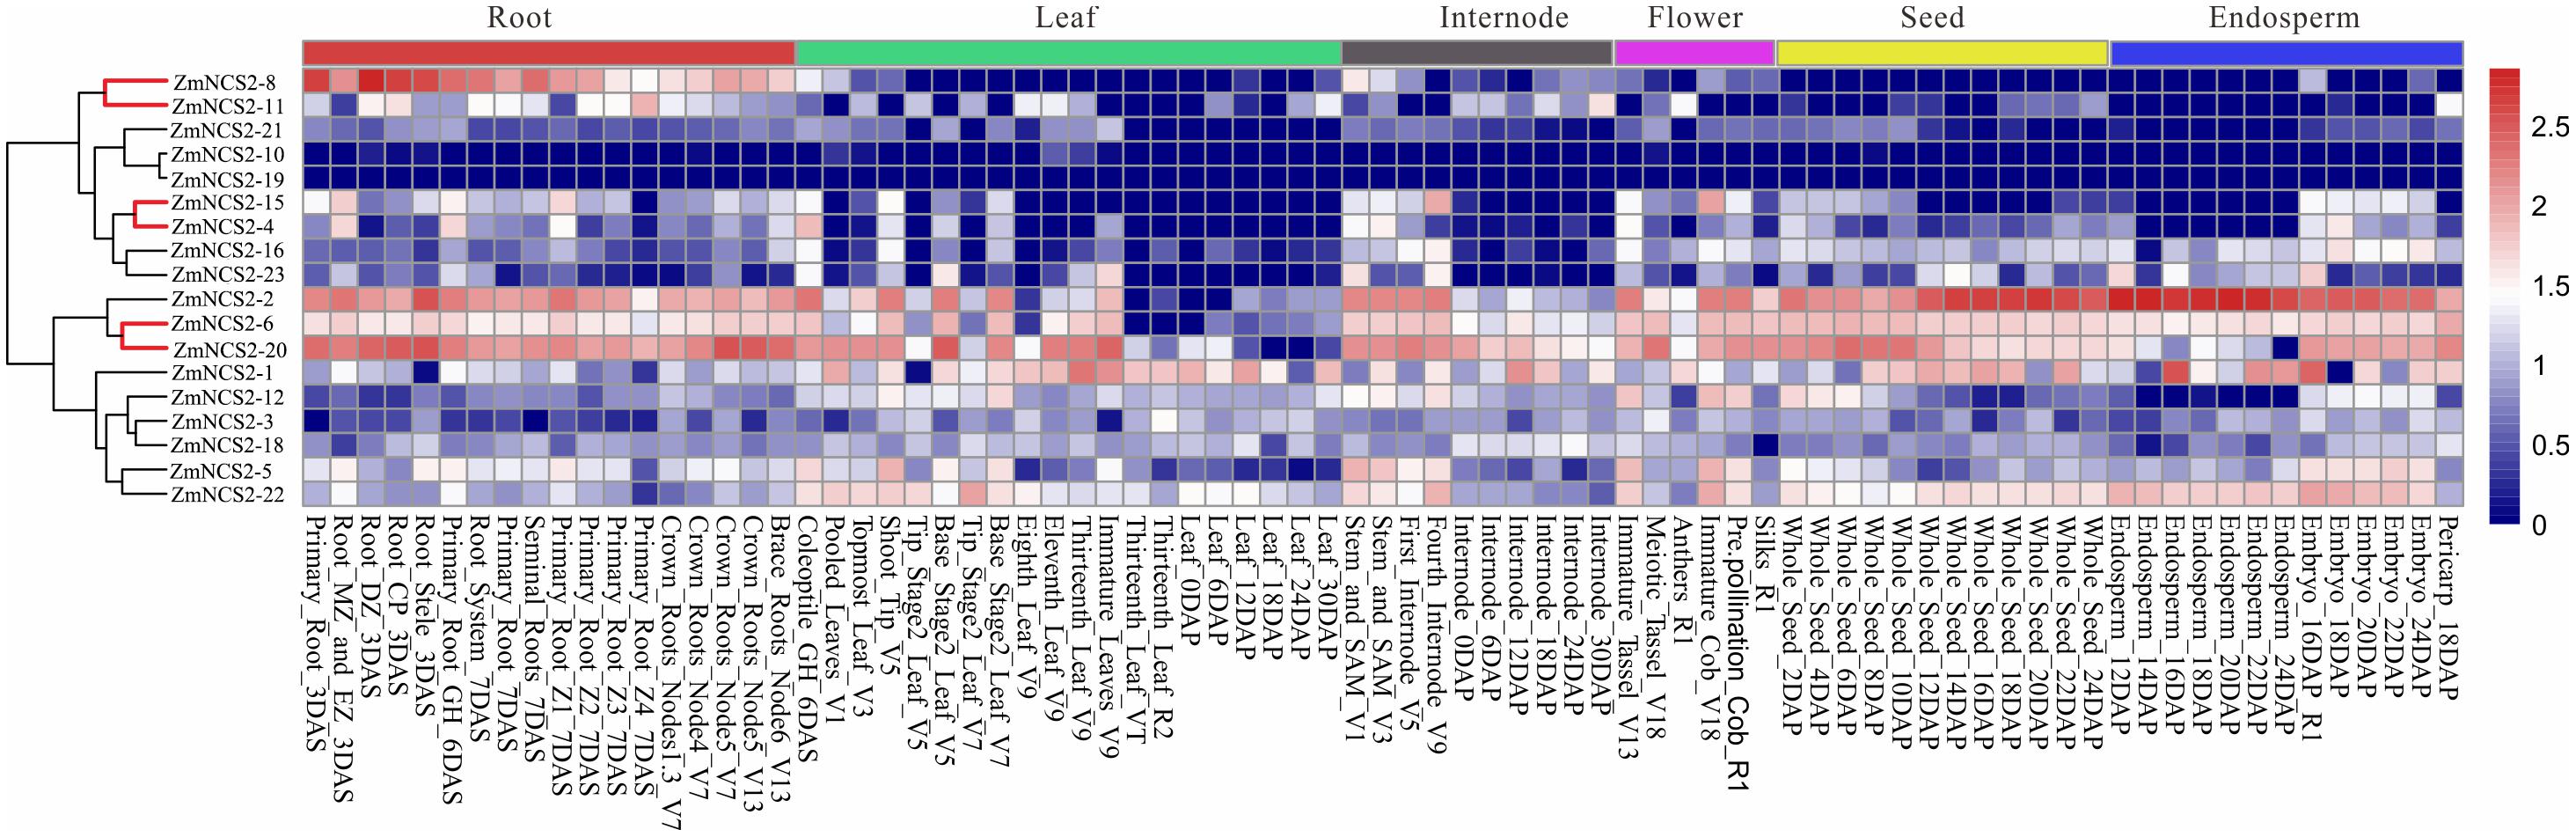
FIGURE 6. Expression profiles of NCS2 genes in different tissues. Gene expression was analyzed in the roots, leaves, internodes, flowers, seeds, and endosperm. Genome-wide microarray data were obtained from the NimbleGen microarray provided by Stelpflug et al. (2016).
Nucleobase derivatives are critical for cell signaling, nutrition, stress responses, and cell homeostasis. Additionally, soil salinity can decrease L-ascorbic acid contents in wheat (Shalata et al., 2001; Sairam and Srivastava, 2002). Therefore, elucidating the regulatory pathways involved in stress adaptations may be useful for improving crop production. We further investigated the ZmNCS2 expression levels in response to abiotic stresses by treating leaves of 3-week-old seedlings with ABA, salt, simulated drought, cold, and heat stresses (Figure 7). The analyzed genes were differentially expressed in the leaves under different abiotic stress conditions. The null treatment (0 h) was normalized to an expression level of 1. The ZmNCS2–5 and ZmNCS2–15 expression levels were considerably down-regulated under all abiotic stresses, while the ZmNCS2–12 expression level was significantly up-regulated in response to all treatments. Under drought conditions, the ZmNCS2 genes were not expressed or were expressed at low levels, except for ZmNCS2–4 and ZmNCS2–12, which had up-regulated expression levels following the PEG treatment. Additionally, the expression levels of some of the NCS2 genes were strongly up-regulated during the heat stress treatment (ZmNCS2–1, ZmNCS2–2, ZmNCS2–4, ZmNCS2–12, and ZmNCS2–16), while the expression levels of other NCS2 genes were up-regulated by ABA (ZmNCS2–2, ZmNCS2–3, ZmNCS2–4, ZmNCS2–12, ZmNCS2–16, and ZmNCS2–23). Furthermore, the expression levels of ZmNCS2–4 and ZmNCS2–23 were sensitive to the 4°C treatment.
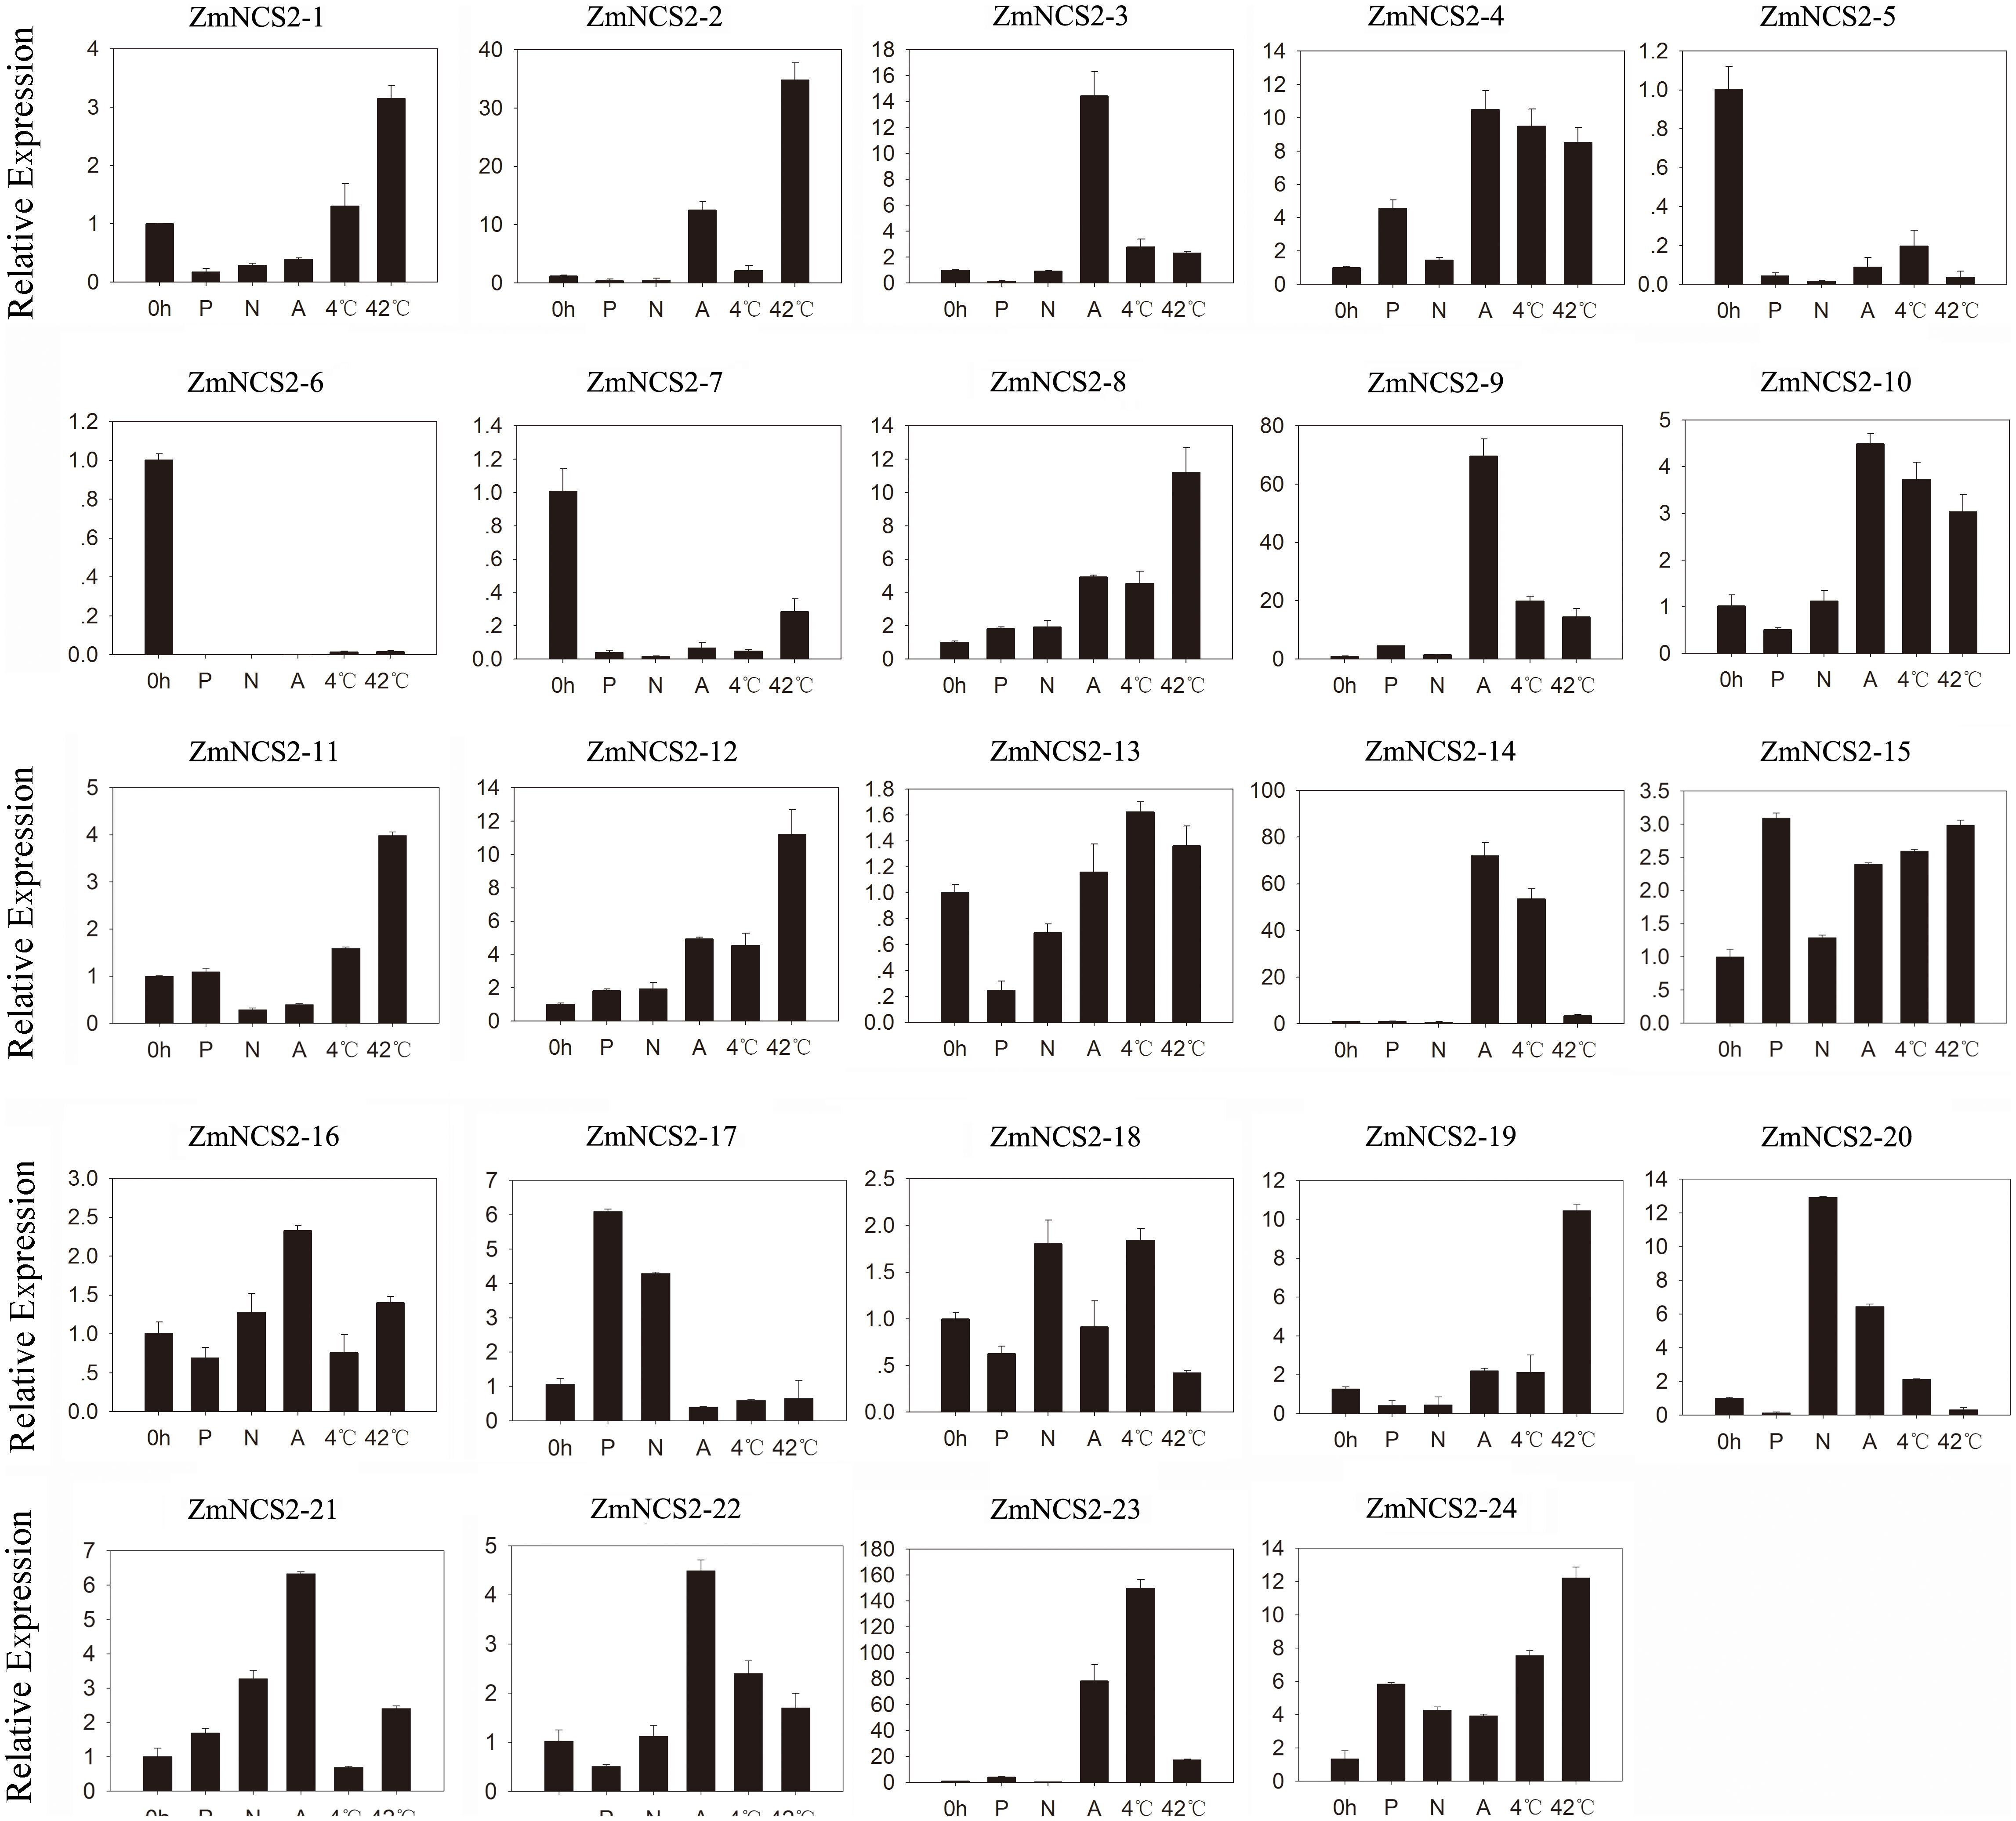
FIGURE 7. Expression patterns of five stress-responsive ZmNCS2 genes in response to various stress treatments. Relative expression levels and stress treatments (PEG, ABA, NaCl, 4°C, and 42°C) are indicated on the y-axis and x-axis, respectively.
Subcellular Localizations of ZmNCS2–16 and ZmNCS2–23
The NCS2 proteins are highly hydrophobic. The number of putative membrane-spanning segments was calculated using the TMHMM Server (version 2.0). We predicted that maize NCS2 proteins include 5–11 membrane-spanning helices (Figure 8). We randomly selected two genes (ZmNCS2–16 and ZmNCS2–23) to determine whether the encoded proteins were present in the cell membrane. An in silico analysis of the NCS2 gene family indicated that ZmNCS2–16 and ZmNCS2–23 were localized in the cell membrane16. To experimentally confirm this prediction, we transiently expressed ZmNCS2–16-GFP and ZmNCS2–23-GFP under the control of the cauliflower mosaic virus 35S promoter in tobacco cells, which revealed that they were present in the cell membrane (Figure 9).
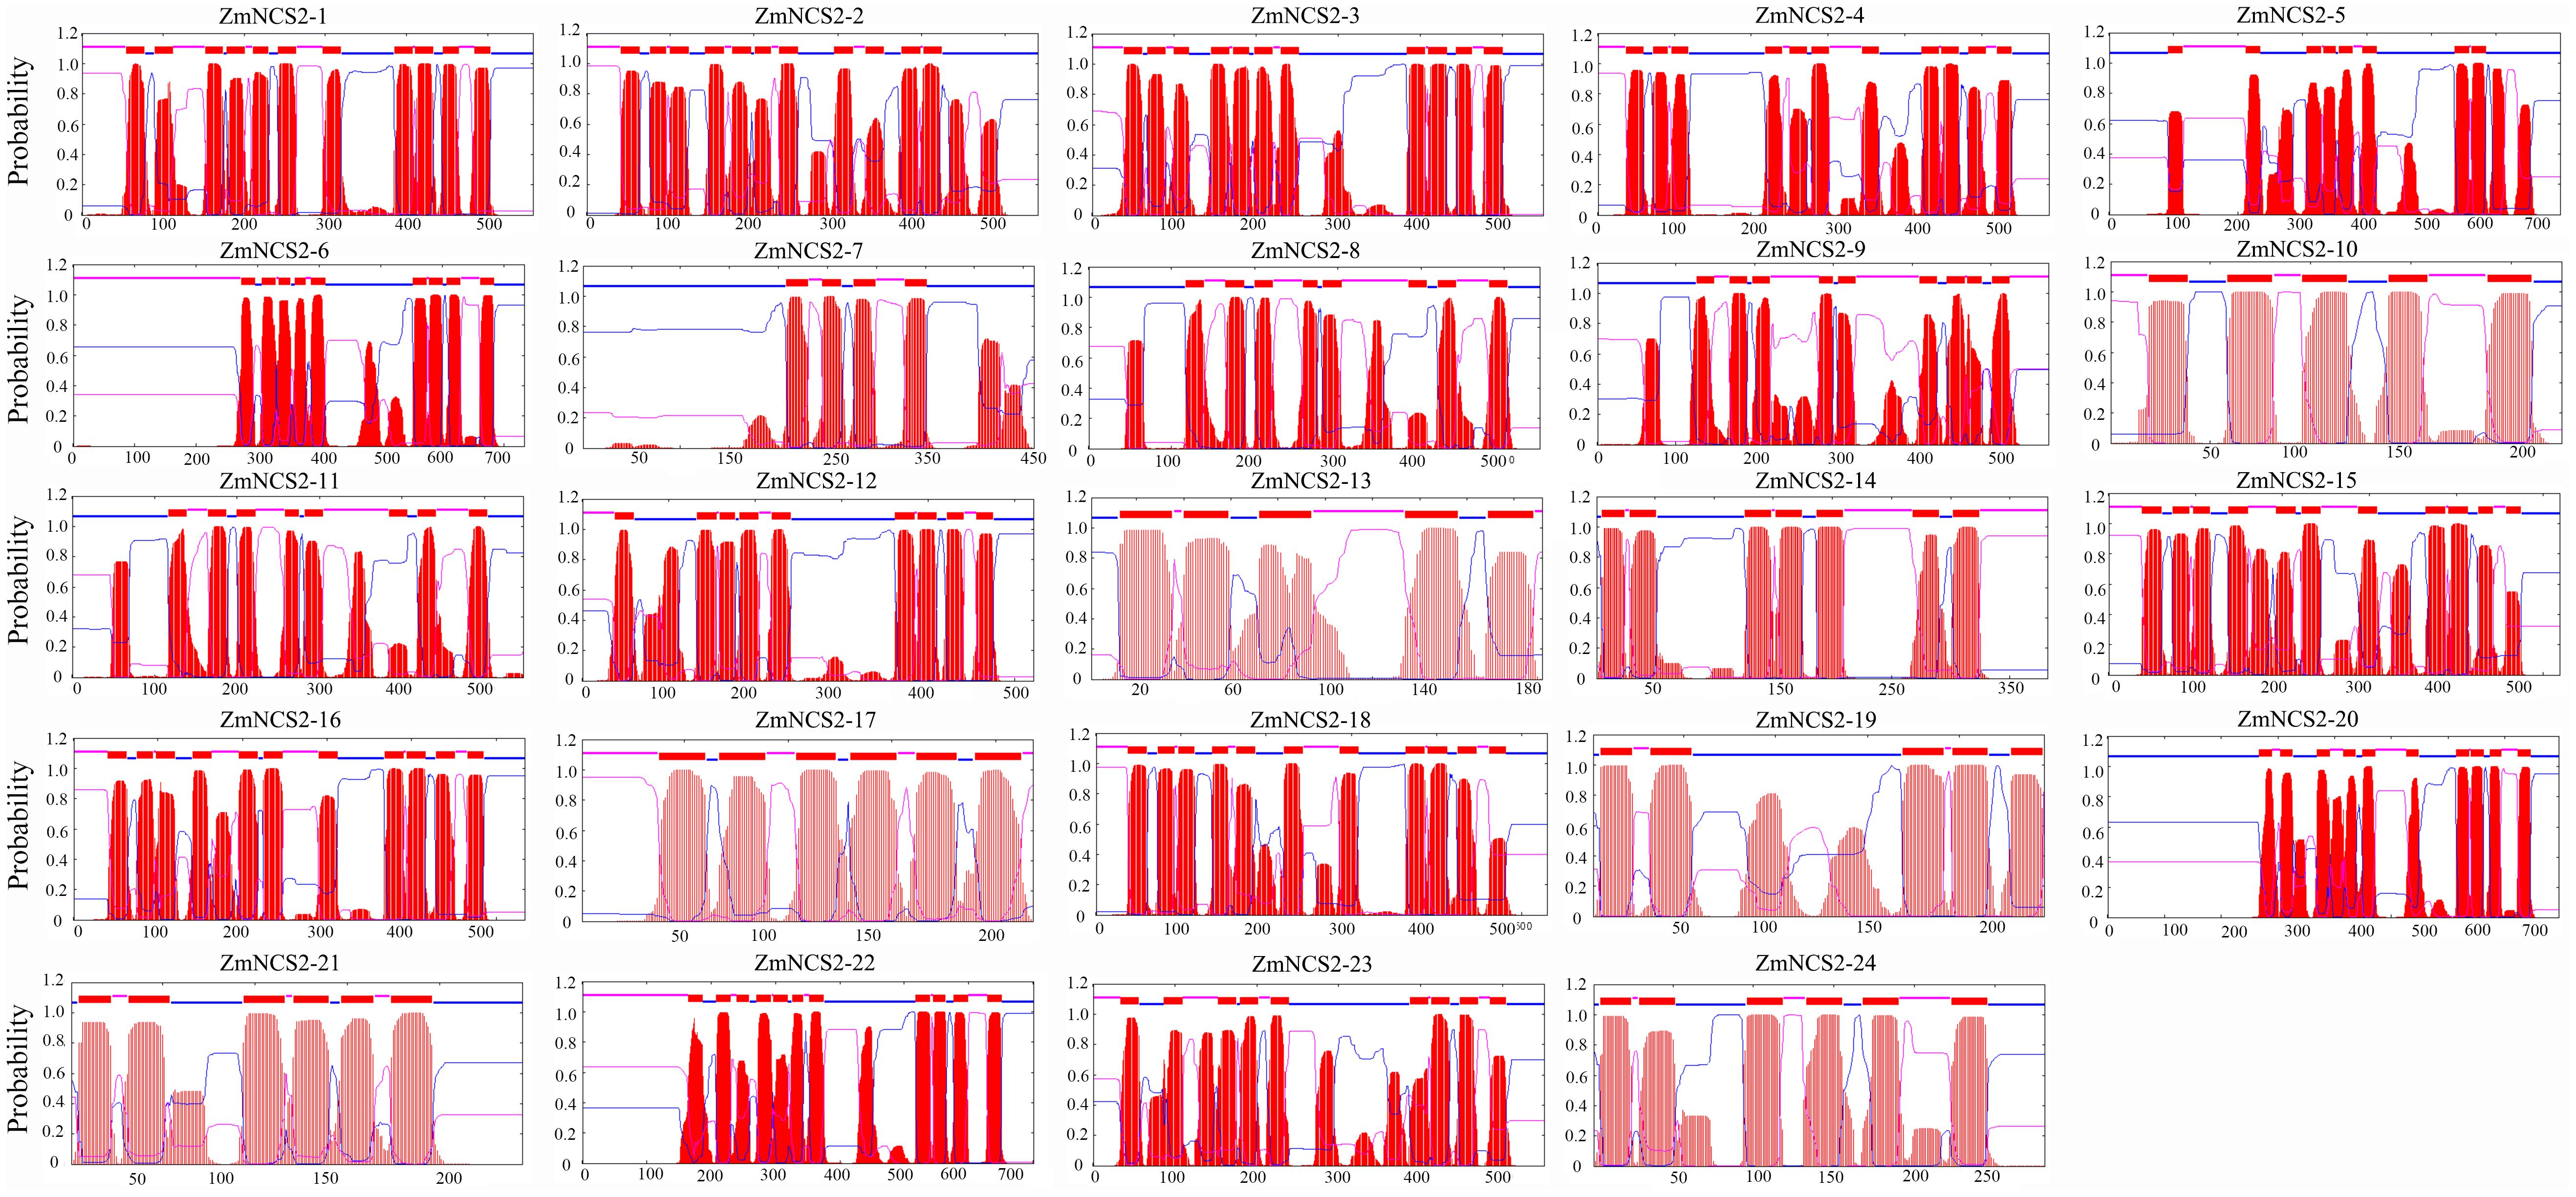
FIGURE 8. Predicted transmembrane regions of ZmNCS2 proteins. Transmembrane regions were predicted using the TMHMM Server (version 2.0) (http://www.cbs.dtu.dk/services/TMHMM/).
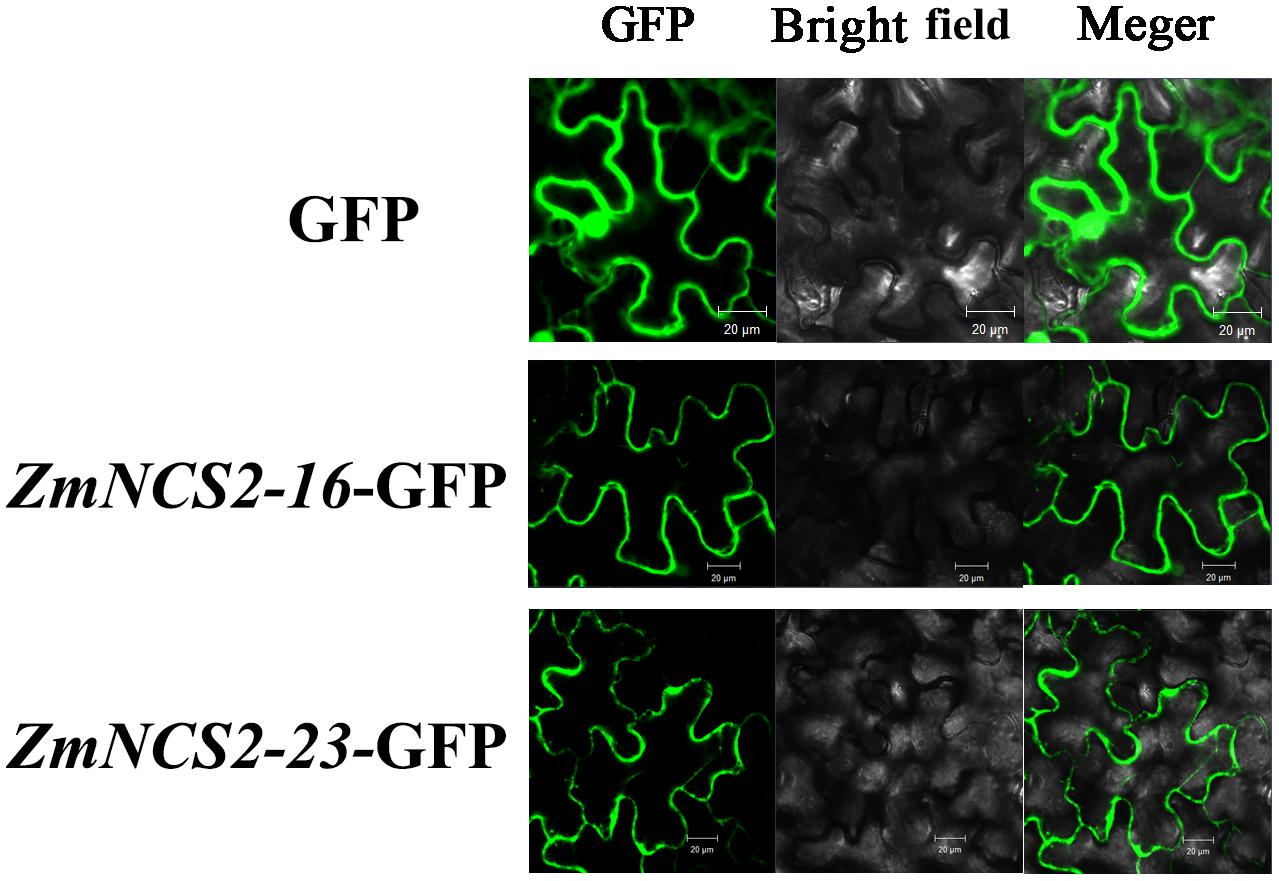
FIGURE 9. Subcellular localization of ZmNCS2–16 and ZmNCS2–23. The control (GFP alone) signal was detected throughout the cell, while the ZmNCS2–16-GFP and ZmNCS2–23-GFP signals were localized to the plasma membrane.
Discussion
Members of the NCS2 family have critical functions regarding the transport of free nucleobases (purines and pyrimidines). Despite the intriguing functional diversity and broad expansion of this gene family during evolution (de Koning and Diallinas, 2000; Frillingos, 2012), a genome-wide study of NCS2/NAT homologs has been reported for only a few species, including A. thaliana, S. lycopersicum, and M. domestica (Maurino et al., 2006; Cai et al., 2014; Sun et al., 2016). In the present study, we conducted a comprehensive investigation of the evolution and expression patterns of maize NCS2/NAT/AzgA-like superfamily genes. In total, 24 ZmNCS2 were found in Z. mays. Additionally, NCS2 genes were also detected in 27 other plant species, including two aquatic chlorophytes (C. crispus and C. reinhardtii), two early diverging land plant species (P. patens and S. moellendorffii), one gymnosperm (P. asperata), and one Amborellales (A. trichopoda), as well as 23 monocots and dicots. A total of 441 NCS2 genes were identified, implying that NCS2 homologs are evolutionarily conserved in the plant kingdom. We observed varying copy numbers among NCS2 homologs and a considerable expansion of the corresponding gene family from lower aquatic plants to angiosperms. The greater number of NCS2 genes in land plants than in C. crispus and C. reinhardtii suggested that the expansion of the gene families during speciation was the result of different gene duplication modes (i.e., WGD/SD, tandem duplication, and single-gene duplication). An examination of the duplication modes associated with NCS2 genes revealed that one or more duplication modes were primarily responsible for the expansion of the plant NCS2 gene families. We also attempted to trace the evolutionary history of NCS2 genes among diverse plant species, from a red alga to angiosperms. Three subfamilies were identified based on the phylogenetic analyses. According to the distribution of previously functionally characterized maize NCS2 genes, we found that AzgA genes clustered only within subfamily I, while all of the previously reported NAT genes clustered within subfamilies II and III. NCS2 genes in subfamily I were classified as NCS2/AzgA-like genes, while those in subfamilies II and III were classified as NCS2/NAT genes. There were three ZmNCS2/AzgA-like and 21 ZmNCS2/NAT genes (Table 1). All of the surveyed species contained at least one subfamily I NCS2 gene, suggesting the ancient origins of these genes. In contrast, subfamily III NCS2 genes were present only in land plant species, indicating that these NCS2 genes diverged from the early diverging land plants, such as P. patens and S. moellendorffii, which represent ancient lineages that diverged from aquatic organisms. Furthermore, subfamily II contained the greatest number of NCS2 genes, possibly because of recent duplication events that resulted in neofunctionalization. An examination of motifs revealed that NCS2 proteins from different subfamilies had conserved and analogous structural features. The typical NCS2 domain may be represented by five putative motifs. The proteins encoded by the NCS2 genes in subfamily I contain motifs 1, 2, and 3, while proteins encoded by subfamily II and III genes contain motifs 1–5, which is consistent with the phylogenetic results. Based on the deduced origins of these three subfamilies, that ancient NCS2/NAT domains may have been relatively short and harbored only a few motifs. During evolution, gene fusions or chromosomal recombination occurred that enlarged the NCS2 domain, ultimately producing the typical domain with five motifs.
In maize, WGD and single-gene duplication events, but not tandem duplications, were likely important for the NCS2 gene family’s expansion. Moreover, the intronless structure of all the three maize NCS2/AzgA-like (ZmNCS2–9, ZmNCS2–8, and ZmNCS2–11) genes implied that a retrotransposition duplication of ZmNCS2–9 resulted in the ancestral gene of ZmNCS2–8 and ZmNCS2–11, which were then generated by a WGD (Figure 5). Paralogous maize NCS2 gene pairs were identified, and the corresponding Ka/Ks values revealed that purifying selection may have been largely responsible for the increase in the functional diversity of the NCS2 gene family. Moreover, the Ka/Ks values were lower for the WGD gene pairs than for the single-gene duplication gene pairs. The duplication of three paralogous gene pairs was estimated to have occurred 4.6–486 million years ago. A phylogenetic analysis revealed that the genes from the monocot and dicot species clustered separately, suggesting that the expansion of the NCS2 gene family differed between monocotyledons and dicotyledons. A previous comparative genomics study concluded that euchromatic regions are highly conserved between rice and maize (Wei et al., 2007). We observed that the number of orthologous genes was greater between maize and sorghum than between maize and rice, which is consistent with previous studies that suggested sorghum and maize progenitors diverged after rice diverged from the common ancestor of maize and sorghum. Our results may be useful for clarifying the evolution of the NCS2 multigene families in different species.
Plant growth and productivity are frequently threatened by abiotic stresses, including drought, high salinity, and extreme temperatures. The expression levels of many stress-related genes may be induced by abiotic stresses. Our qRT-PCR analysis confirmed that ZmNCS2 genes are differentially expressed in response to abiotic stresses. An earlier study concluded that drought stress can decrease the production of L-ascorbic acid (Li et al., 1998), while also down-regulating the expression of NCS2 genes, including ZmNCS2–1, ZmNCS2–5, and ZmNCS2–15. The expression levels of two genes were down-regulated by PEG, NaCl, and ABA, as well as low (4°C) and high (42°C) temperatures. Additionally, the expression levels of ZmNCS2–2, ZmNCS2–3, ZmNCS2–4, and ZmNCS2–23 were strongly up-regulated by ABA, suggesting that these genes are important for the ABA stress-related regulatory network. Meanwhile, the expression levels of ZmNCS2–4 and ZmNCS2–23 were up-regulated by exposure to 4°C, suggesting that these two genes may help mediate cold tolerance. Environmental stresses frequently threaten maize growth and productivity. Many NCS2 genes are involved in cellular processes that protect various plant species, including maize and tomato, against environmental stresses (Li et al., 1998; Cai et al., 2014). The subcellular localizations of ZmNCS2–16-GFP and ZmNCS2–23-GFP in the plasma membrane suggests that ZmNCS2–16 and ZmNCS2–23 may be involved in the transport of free nucleobases.
Conclusion
Our study traced the evolutionary fate of NCS2 genes in 28 plant species, ranging from single aquatic algae to higher angiosperms, with a major emphasis on Z. mays for the first time. Phylogenetic analysis of NCS2 genes in maize and 27 other species was performed to help better classify and characterize NCS2 genes in maize and plant kingdoms. As a result, three subfamilies were identified. Members in subfamily I were NCS2/AzgA-like genes, while members in subfamilies II and III were NCS2/NAT genes. The motif compositional analysis showed one symbolic motif (motif 4) of the NCS2/NAT genes was absent in subfamily I NCS2/AzgA-like genes. In maize, there were three ZmNCS2/AzgA-like and 21 ZmNCS2/NAT genes. WGD and single-gene duplication events, but not tandem duplications, were likely important for the maize NCS2 gene family’s expansion. In addition, ZmNCS2 genes experienced purifying selection, and those with related evolutionary relationships had similar expression patterns in different tissues or under diverse abiotic stresses, strongly suggesting functional redundancy. Thus, the present study utilized comparative genomics, population genetics and gene expression profiling analysis and provided new insights to better understand the complexity of NCS2 genes in maize. Their genetic evolutionary relationship and gene expression patterns at diverse developmental stage and under diverse abiotic stress, will benefit further functional analyses of ZmNCS2 genes.
Author Contributions
WC and XP conceived and designed this research. WC and WS performed the experiment. WC, BL, YL, and HJ analyzed the data. WC, KZ, ZZ, and JW contributed reagents, materials, and analysis tools. WC wrote the manuscript. All the authors read and approved the manuscript.
Funding
This work was supported by the National Key Research and Development Plan (2016YFD0101002), Anhui Natural Science Foundation of the Colleges and Universities (KJ2017A147), and National Natural Science Foundation of China (31571685).
Conflict of Interest Statement
The authors declare that the research was conducted in the absence of any commercial or financial relationships that could be construed as a potential conflict of interest.
Acknowledgments
We thank members of the National Engineering Laboratory of Crop Stress Resistance Breeding for their suggestions on experimental design and data processing. We also thank Lesley Benyon, Ph.D., from Liwen Bianji, Edanz Group China (www.liwenbianji.cn/ac), for editing the English text of a draft of this manuscript.
Supplementary Material
The Supplementary Material for this article can be found online at: https://www.frontiersin.org/articles/10.3389/fpls.2018.00856/full#supplementary-material
FIGURE S1 | Correlation between the number of NCS2 genes and the total number of genes in a genome.
FIGURE S2 | Analysis of NCS2 genes from 20 species based on phylogenetic trees constructed using the maximum-likelihood and Bayesian methods. (A) Maximum-likelihood tree; (B) Bayesian tree.
FIGURE S3 | Sliding-window plots of representative duplicated NCS2 genes in maize. The window and step sizes are 150 and 9 bp, respectively. Nucleotide positions and Ka/Ks ratios are indicated on the x-axis and y-axis, respectively.
TABLE S1 | Gene-specific primers for the qRT-PCR analysis of maize NCS2 genes
TABLE S2 | Protein sequences for the phylogenetic trees constructed using the neighbor-joining, maximum-likelihood and Bayesian methods.
TABLE S3 | The genes in different NCS2 subfamilies.
Footnotes
- ^ www.phytozome.org
- ^ http://www.Congenie.org
- ^ http://www.expasy.org/tools/
- ^ http://www.cbs.dtu.dk/services/TMHMM/
- ^ https://www.ncbi.nlm.nih.gov/Taxonomy/CommonTree/wwwcmt.cgi
- ^ https://mafft.cbrc.jp/alignment/server/
- ^ http://tree.bio.ed.ac.uk/software/figtree/
- ^ http://meme-suite.org/
- ^ https://phytozome.jgi.doe.gov/pz/portal.html
- ^ http://orthomcl.org/orthomcl/
- ^ http://circos.ca/
- ^ http://www.bioconductor.org/
- ^ http://www.csbio.sjtu.edu.cn/bioinf/plant-multi/
- ^ http://broadinstitute.github.io/picard/
- ^ https://bioinformatics.psb.ugent.be/plaza/
- ^ http://www.csbio.sjtu.edu.cn/bioinf/plant-multi/
References
Amborella Genome Project (2013). The Amborella genome and the evolution of flowering plants. Science 342:1241089. doi: 10.1126/science.1241089
Amillis, S., and Koukaki, M. G. (2001). Substitution F569S converts UapA, a specific uric acid-xanthine transporter, into a broad specificity transporter for purine-related solutes 1. J. Mol. Biol. 313, 765–774. doi: 10.1006/jmbi.2001.5087
Argyrou, E., and Diallinas, G. (2001). Functional characterization of a maize purine transporter by expression in Aspergillus nidulans. Plant Cell 13, 953–964. doi: 10.1105/tpc.13.4.953
Banks, J. A., Nishiyama, T., Hasebe, M., Bowman, J. L., Gribskov, M., Depamphilis, C., et al. (2011). The selaginella genome identifies genetic changes associated with the evolution of vascular plants. Science 332, 960–963. doi: 10.1126/science.1203810
Bateman, A., Birney, E., Durbin, R., Eddy, S. R., Finn, R. D., and Sonnhammer, E. L. (1999). Pfam 3.1: 1313 multiple alignments and profile HMMs match the majority of proteins. Nucleic Acids Res. 27, 260–262. doi: 10.1093/nar/27.1.260
Bowers, J. E., Bruggmann, R., Dubchak, I., Grimwood, J., Gundlach, H., Haberer, G., et al. (2009). The Sorghum bicolor genome and the diversification of grasses. Nature 457, 551–556. doi: 10.1038/nature07723
Cai, X., Ye, J., Hu, T., Zhang, Y., Ye, Z., and Li, H. (2014). Genome-wide classification and expression analysis of nucleobase–ascorbate transporter (NAT) gene family in tomato. Plant Growth Regul. 73, 19–30. doi: 10.1007/s10725-013-9864-x
Cecchetto, G., Amillis, S., Diallinas, G., Scazzocchio, C., and Drevet, C. (2004). The AzgA purine transporter of Aspergillus nidulans. Characterization of a protein belonging to a new phylogenetic cluster. J. Biol. Chem. 279, 3132–3141. doi: 10.1074/jbc.M308826200
D’Hont, A., Denoeud, F., Aury, J. M., Baurens, F. C., Carreel, F., Garsmeur, O., et al. (2012). The banana (Musa acuminata) genome and the evolution of monocotyledonous plants. Nature 488, 213–217. doi: 10.1038/nature11241
Darriba, D., Taboada, G. L., Doallo, R., and Posada, D. (2011). ProtTest 3: fast selection of best-fit models of protein evolution. Bioinformatics 27, 1164–1165. doi: 10.1093/bioinformatics/btr088
David, S., Christopher, W., Philippe, L., Berardini, T. Z., Margarita, G. H., Hartmut, F., et al. (2008). The Arabidopsis Information Resource (TAIR): gene structure and function annotation. Nucleic Acids Res. 36, D1009–D1014.
de Koning, H., and Diallinas, G. (2000). Nucleobase transporters. Mol. Membr. Biol 17, 75–94. doi: 10.1080/09687680050117101
Diallinas, G., Valdez, J., Sophianopoulou, V., Rosa, A., and Scazzocchio, C. (1998). Chimeric purine transporters of Aspergillus nidulans define a domain critical for function and specificity conserved in bacterial, plant and metazoan homologues. EMBO J. 17, 3827–3837. doi: 10.1093/emboj/17.14.3827
Doust, A. N., and Bennetzen, J. L. (2009). Foxtail millet: a sequence-driven grass model system. Plant Physiol. 149, 137–141. doi: 10.1104/pp.108.129627
Du, H., Liang, Z., Zhao, S., Nan, M. G., Tran, L. S., Lu, K., et al. (2015). The evolutionary history of R2R3-MYB proteins across 50 eukaryotes: new insights into subfamily classification and expansion. Sci. Rep. 5: 11037. doi: 10.1038/srep11037
Excoffier, L., and Lischer, H. E. (2010). Arlequin suite ver 3.5: a new series of programs to perform population genetics analyses under Linux and Windows. Mol. Ecol. Resour. 10, 564–567. doi: 10.1111/j.1755-0998.2010.02847.x
Freeling, M. (2009). Bias in plant gene content following different sorts of duplication: tandem, whole-genome, segmental, or by transposition. Annu. Rev. Plant Biol. 60, 433–453. doi: 10.1146/annurev.arplant.043008.092122
Frillingos, S. (2012). Insights to the evolution of Nucleobase-Ascorbate Transporters (NAT/NCS2 family) from the Cys-scanning analysis of xanthine permease XanQ. Int. J. Biochem. Mol. Biol. 3, 250–272.
Gasteiger, E., Gattiker, A., Hoogland, C., Ivanyi, I., Appel, R. D., and Bairoch, A. (2003). Expasy: the proteomics server for in-depth protein knowledge and analysis. Nucleic Acids Res. 31, 3784–3788. doi: 10.1093/nar/gkg563
Girke, C., Daumann, M., Niopekwitz, S., and Möhlmann, T. (2014). Nucleobase and nucleoside transport and integration into plant metabolism. Front. Plant Sci. 5, 443. doi: 10.3389/fpls.2014.00443
Gournas, C., Papageorgiou, I., and Diallinas, G. (2008). The nucleobase-ascorbate transporter (NAT) family: genomics, evolution, structure-function relationships and physiological role. Mol. Biosyst. 4, 404–416. doi: 10.1039/b719777b
Guindon, S., and Gascuel, O. (2003). A simple, fast, and accurate algorithm to estimate large phylogenies by maximum likelihood. Syst. Biol. 52, 696–704. doi: 10.1080/10635150390235520
Jaillon, O., Aury, J. M., Noel, B., Policriti, A., Clepet, C., Casagrande, A., et al. (2007). The grapevine genome sequence suggests ancestral hexaploidization in major angiosperm phyla. Nature 449, 463–467. doi: 10.1038/nature06148
Janouškovec, J., Liu, S. L., Martone, P. T., Carré, W., Leblanc, C., Collén, J., et al. (2013). Evolution of red algal plastid genomes: ancient architectures, introns, horizontal gene transfer, and taxonomic utility of plastid markers. PLoS One 8:e59001. doi: 10.1371/journal.pone.0059001
Karatza, P., and Frillingos, S. (2005). Cloning and functional characterization of two bacterial members of the NAT/NCS2 family in Escherichia coli. Mol. Membr. Biol. 22, 251–261. doi: 10.1080/09687860500092927
Kohler, A., Rinaldi, C., Duplessis, S., Baucher, M., Geelen, D., Duchaussoy, F., et al. (2008). Genome-wide identification of NBS resistance genes in Populus trichocarpa. Plant Mol. Biol. 66, 619–636. doi: 10.1007/s11103-008-9293-9
Koukaki, M., Vlanti, A., Goudela, S., Pantazopoulou, A., Gioule, H., Tournaviti, S., et al. (2005). The nucleobase-ascorbate transporter (NAT) signature motif in UapA defines the function of the purine translocation pathway. J. Mol. Biol. 350, 499–513. doi: 10.1016/j.jmb.2005.04.076
Kumar, S., Stecher, G., and Tamura, K. (2016). MEGA7: Molecular Evolutionary Genetics Analysis Version 7.0 for Bigger Datasets. Mol. Biol. Evol. 33, 1870–1874. doi: 10.1093/molbev/msw054
Kuraku, S., Zmasek, C. M., Nishimura, O., and Katoh, K. (2013). aLeaves facilitates on-demand exploration of metazoan gene family trees on MAFFT sequence alignment server with enhanced interactivity. Nucleic Acids Res. 41, W22–W28. doi: 10.1093/nar/gkt389
Lai, J., Ma, J., Swigonová, Z., Ramakrishna, W., Linton, E., Llaca, V., et al. (2004). Gene loss and movement in the maize genome. Genome Res. 14, 1924–1931. doi: 10.1101/gr.2701104
Le, S. Q., and Gascuel, O. (2008). An improved general amino acid replacement matrix. Mol. Biol. Evol. 25, 1307–1320. doi: 10.1093/molbev/msn067
Leister, D. (2004). Tandem and segmental gene duplication and recombination in the evolution of plant disease resistance gene. Trends Genet. 20, 116–122. doi: 10.1016/j.tig.2004.01.007
Li, H., and Durbin, R. (2009). Fast and Accurate Short Read Alignment With Burrows–Wheeler Transform. Oxford: Oxford University Press.
Li, L., Van Staden, J., and Jäger, A. (1998). Effects of plant growth regulators on the antioxidant system in seedlings of two maize cultivars subjected to water stress. Plant Growth Regul. 25, 81–87. doi: 10.1023/A:1010774725695
Li, Z., Jiang, H., Zhou, L., Deng, L., Lin, Y., Peng, X., et al. (2014). Molecular evolution of the HD-ZIP I gene family in legume genomes. Gene 533, 218–228. doi: 10.1016/j.gene.2013.09.084
Lin, Y., Cheng, Y., Jin, J., Jin, X., Jiang, H., Yan, H., et al. (2014). Genome duplication and gene loss affect the evolution of heat shock transcription factor genes in legumes. PLoS One 9:e102825. doi: 10.1371/journal.pone.0102825
Lu, F., Li, S., Jiang, Y., Jiang, J., Fan, H., Lu, G., et al. (2011). Structure and mechanism of the uracil transporter UraA. Nature 472, 243–246. doi: 10.1038/nature09885
Mansfield, T. A., Schultes, N. P., and Mourad, G. S. (2009). AtAzg1 and AtAzg2 comprise a novel family of purine transporters in Arabidopsis. FEBS Lett. 583, 481–486. doi: 10.1016/j.febslet.2008.12.048
Maurino, V. G., Grube, E., Zielinski, J., Schild, A., Fischer, K., and Flügge, U. I. (2006). Identification and expression analysis of twelve members of the nucleobase–ascorbate transporter (NAT) gene family in Arabidopsis thaliana. Plant Cell Physiol. 47, 1381–1393. doi: 10.1093/pcp/pcl011
Mckenna, A., Hanna, M., Banks, E., Sivachenko, A., Cibulskis, K., Kernytsky, A., et al. (2010). The genome analysis toolkit: a mapreduce framework for analyzing next-generation DNA sequencing data. Genome Res. 20, 1297–1303. doi: 10.1101/gr.107524.110
Merchant, S. S., Prochnik, S. E., Vallon, O., Harris, E. H., Karpowicz, S. J., Witman, G. B., et al. (2007). The Chlamydomonas genome reveals the evolution of key animal and plant functions. Science 318, 245–250. doi: 10.1126/science.1143609
Ming, R., Vanburen, R., Liu, Y., Yang, M., Han, Y., Li, L. T., et al. (2013). Genome of the long-living sacred lotus (Nelumbo nucifera Gaertn.). Genome Biol. 14:R41. doi: 10.1186/gb-2013-14-5-r41
Motamayor, J. C., Mockaitis, K., Schmutz, J., Haiminen, N., Livingstone, L. III, Cornejo, O., et al. (2013). The genome sequence of the most widely cultivated cacao type and its use to identify candidate genes regulating pod color. Genome Biol. 14:r53. doi: 10.1186/gb-2013-14-6-r53
Niopek-Witz, S., Deppe, J., Lemieux, M. J., and Möhlmann, T. (2014). Biochemical characterization and structure-function relationship of two plant NCS2 proteins, the nucleobase transporters NAT3 and NAT12 from Arabidopsis thaliana. Biochim. Biophys. Acta 1838, 3025–3035. doi: 10.1016/j.bbamem.2014.08.013
Nystedt, B., Street, N. R., Wetterbom, A., Zuccolo, A., Lin, Y. C., Scofield, D. G., et al. (2013). The Norway spruce genome sequence and conifer genome evolution. Nature 497, 579–584. doi: 10.1038/nature12211
Pantazopoulou, A., and Diallinas, G. (2006). The first transmembrane segment (TMS1) of UapA contains determinants necessary for expression in the plasma membrane and purine transport. Mol. Membr. Biol. 23, 337–348. doi: 10.1080/09687860600738239
Pantazopoulou, A., Lemuh, N. D., Hatzinikolaou, D. G., Drevet, C., Cecchetto, G., Scazzocchio, C., et al. (2007). Differential physiological and developmental expression of the UapA and AzgA purine transporters in Aspergillus nidulans. Fungal Genet. Biol. 44, 627–640. doi: 10.1016/j.fgb.2006.10.003
Papakostas, K., Botou, M., and Frillingos, S. (2013). Functional identification of the hypoxanthine/guanine transporters YjcD and YgfQ and the adenine transporters PurP and YicO of Escherichia coli K-12. J. Biol. Chem. 288, 36827–36840. doi: 10.1074/jbc.M113.523340
Papakostas, K., and Frillingos, S. (2012). Substrate selectivity of YgfU, a uric acid transporter from Escherichia coli. J. Biol. Chem. 287, 15684–15695. doi: 10.1074/jbc.M112.355818
Paterson, A. H. (2012). Genome and gene duplications and gene expression divergence: a view from plants. Ann. N. Y. Acad. Sci. 1256, 1–14. doi: 10.1111/j.1749-6632.2011.06384.x
Rensing, S. A., Lang, D., Zimmer, A. D., Terry, A., Salamov, A., Shapiro, H., et al. (2008). The Physcomitrella genome reveals evolutionary insights into the conquest of land by plants. Science 319, 64–69. doi: 10.1126/science.1150646
Rody, H. V. S., Baute, G. J., Rieseberg, L. H., and Oliveira, L. O. (2017). Both mechanism and age of duplications contribute to biased gene retention patterns in plants. BMC Genomics 18:46. doi: 10.1186/s12864-016-3423-6
Rapp, M., Schein, J., Hunt, K. A., Nalam, V., Mourad, G. S., and Schultes, N. P. (2015). The solute specificity profiles of nucleobase cation symporter 1 (ncs1) from Zea mays and Setaria viridis illustrate functional flexibility. Protoplasma 253, 611–623. doi: 10.1007/s00709-015-0838-x
Sairam, R. K., and Srivastava, G. C. (2002). Changes in antioxidant activity in sub-cellular fractions of tolerant and susceptible wheat genotypes in response to long term salt stress. Plant Sci. 162, 897–904. doi: 10.1016/S0168-9452(02)00037-7
Schmutz, J., Cannon, S. B., Schlueter, J., Ma, J. X., Mitros, T., Nelson, W., et al. (2010). Genome sequence of the palaeopolyploid soybean. Nature 463, 178–183. doi: 10.1038/nature08670
Schnable, P. S., Ware, D., Fulton, R. S., Stein, J. C., Wei, F., Pasternak, S., et al. (2009). The B73 maize genome: complexity, diversity, and dynamics. Science 326, 1112–1115. doi: 10.1126/science.1178534
Sémon, M., and Wolfe, K. H. (2007). Consequences of genome duplication. Curr. Opin. Genet. Dev. 17, 505–512. doi: 10.1016/j.gde.2007.09.007
Senecoff, J. F., Mckinney, E. C., and Meagher, R. B. (1996). De novo purine synthesis in Arabidopsis thaliana: II. The PUR7 gene encoding 5′-phosphoribosyl-4-(n-succinocarboxamide)-5-aminoimidazole synthetase is expressed in rapidly dividing tissues. Plant Physiol. 112, 905–917. doi: 10.1104/pp.112.3.905
Shalata, A., Mittova, V., Volokita, M., Guy, M., and Tal, M. (2001). Response of the cultivated tomato and its wild salt-tolerant relative Lycopersicon pennellii to salt-dependent oxidative stress: the root antioxidative system. Physiol. Plant. 112, 487–494. doi: 10.1034/j.1399-3054.2001.1120405.x
Shulaev, V., Sargent, D. J., Crowhurst, R. N., Mockler, T. C., Folkerts, O., Delcher, A. L., et al. (2011). The genome of woodland strawberry (Fragaria vesca). Nat. Genet. 43, 109–116. doi: 10.1038/ng.740
Stelpflug, S. C., Sekhon, R. S., Vaillancourt, B., Hirsch, C. N., Buell, C. R., De, L. N., et al. (2016). An expanded maize gene expression atlas based on RNA sequencing and its use to explore root development. Plant Genome 9, 1–16. doi: 10.3835/plantgenome2015.04.0025
Sun, T., Jia, D., Huang, L., Shao, Y., and Ma, F. (2016). Comprehensive genomic identification and expression analysis of the nucleobase-ascorbate transporter (NAT) gene family in apple. Sci. Hortic. 198, 473–481. doi: 10.1016/j.scienta.2015.09.034
Tikhonov, A. P., Sanmiguel, P. J., Nakajima, Y., Gorenstein, N. M., and Avramova, B. Z. (1999). Colinearity and its exceptions in orthologous adh regions of maize and sorghum. Proc. Natl. Acad. Sci. U.S.A. 96, 7409–7414. doi: 10.1073/pnas.96.13.7409
Tomato Genome Consortium (2012). The tomato genome sequence provides insights into fleshy fruit evolution. Nature 485, 635–641. doi: 10.1038/nature11119
Tuskan, G. A. (2014). The genome of Eucalyptus grandis. Nature 510, 356–362. doi: 10.1038/nature13308
Tuskan, G. A., Difazio, S., Jansson, S., Bohlmann, J., Grigoriev, I., Hellsten, U., et al. (2006). The genome of black cottonwood, Populus trichocarpa (Torr. & Gray). Science 313, 1596–1604. doi: 10.1126/science.1128691
Vastermark, A., Wollwage, S., Houle, M. E., Rio, R., and Saier, M. H. Jr. (2015). Expansion of the APC superfamily of secondary carriers. Proteins 82, 2797–2811. doi: 10.1002/prot.24643
Velasco, R., Zharkikh, A., Affourtit, J., Dhingra, A., Cestaro, A., Kalyanaraman, A., et al. (2010). The genome of the domesticated apple (Malus × domestica Borkh.). Nat. Genet. 42, 833–839. doi: 10.1038/ng.654
Vogel, J. P., Garvin, D. F., Mockler, T. C., Schmutz, J., Dan, R., Bevan, M. W., et al. (2010). Genome sequencing and analysis of the model grass Brachypodium distachyon. Nature 463, 763–768. doi: 10.1038/nature08747
Wang, K., Wang, Z., Li, F., Ye, W., Wang, J., Song, G., et al. (2012). The draft genome of a diploid cotton Gossypium raimondii. Nat. Genet. 44, 1098–1103. doi: 10.1038/ng.2371
Wei, F., Coe, E., Nelson, W., Bharti, A. K., Engler, F., Butler, E., et al. (2007). Physical and genetic structure of the maize genome reflects its complex evolutionary history. PLoS Genet. 3:e123. doi: 10.1371/journal.pgen.0030123
Wendel, J. F. (2000). Genome evolution in polyploids. Plant Mol. Biol. 42, 225–249. doi: 10.1023/A:1006392424384
Xu, Q., Chen, L. L., Ruan, X., Chen, D., Zhu, A., Chen, C., et al. (2013). The draft genome of sweet orange (Citrus sinensis). Nat. Genet. 45, 59–66. doi: 10.1038/ng.2472
Xu, X., Pan, S., Cheng, S., Zhang, B., Mu, D., Ni, P., et al. (2011). Genome sequence and analysis of the tuber crop potato. Nature 475, 189–195. doi: 10.1038/nature10158
Yeoh, K. A., Othman, A., Meon, S., Abdullah, F., and Ho, C. L. (2013). Sequence analysis and gene expression of putative oil palm chitinase and chitinase-like proteins in response to colonization of Ganoderma boninense and Trichoderma harzianum. Mol. Biol. Rep. 40, 147–158. doi: 10.1007/s11033-012-2043-8
Young, J. D., Yao, S. Y., Baldwin, J. M., Cass, C. E., and Baldwin, S. A. (2013). The human concentrative and equilibrative nucleoside transporter families, SLC28 and SLC29. Mol. Aspects Med. 34, 529–547. doi: 10.1016/j.mam.2012.05.007
Young, N. D., Debellé, F., Oldroyd, G. E. D., Geurts, R., Cannon, S. B., Udvardi, M. K., et al. (2011). The Medicago genome provides insight into the evolution of rhizobial symbioses. Nature 480, 520–524. doi: 10.1038/nature10625
Keywords: NCS2, evolution, gene duplication, population genetic, expression, abiotic stress, subcellular localization
Citation: Chai W, Peng X, Liu B, Wang J, Zhu Z, Liu Y, Zhao K, Cheng B, Si W and Jiang H (2018) Comparative Genomics, Whole-Genome Re-sequencing and Expression Profile Analysis of Nucleobase:Cation Symporter 2 (NCS2) Genes in Maize. Front. Plant Sci. 9:856. doi: 10.3389/fpls.2018.00856
Received: 16 February 2018; Accepted: 01 June 2018;
Published: 28 June 2018.
Edited by:
Omar Borsani, University of the Republic, UruguayReviewed by:
Dominique Job, Centre National de la Recherche Scientifique (CNRS), FranceJin Chen, University of Kentucky, United States
Copyright © 2018 Chai, Peng, Liu, Wang, Zhu, Liu, Zhao, Cheng, Si and Jiang. This is an open-access article distributed under the terms of the Creative Commons Attribution License (CC BY). The use, distribution or reproduction in other forums is permitted, provided the original author(s) and the copyright owner are credited and that the original publication in this journal is cited, in accordance with accepted academic practice. No use, distribution or reproduction is permitted which does not comply with these terms.
*Correspondence: Weina Si, Weinasi@ahau.edu.cn Haiyang Jiang, hyjiang@ahau.edu.cn
†These authors have contributed equally to this work.