 Siegbert Versümer
 Jochen Steffens
 Patrick Blättermann
 Jörg Becker-Schweitzer
- Institute of Sound and Vibration Engineering, University of Applied Sciences Düsseldorf, Düsseldorf, Germany
Human sound evaluations not only depend on the characteristics of the sound but are also driven by factors related to the listener and the situation. Our research aimed to investigate crucial factors influencing the perception of low-level sounds as they—in addition to the often-researched loud-level sounds—might be decisive to people’s quality of life and health. We conducted an online study in which 1,301 participants reported on up to three everyday situations in which they perceived low-level sounds, resulting in a total of 2,800 listening situations. Participants rated the sounds’ perceived loudness, timbre, and tonality. Additionally, they described the listening situations employing situational eight dimensions and reported their affective states. All sounds were then assigned to the categories natural, human, and technical. Linear models suggest a significant difference of annoyance ratings across sound categories for binary loudness levels. The ability to mentally fade-out sound was the most crucial situational variable after valence, arousal, and the situation dimensions positivity and negativity. We ultimately selected the most important factors from a large number of independent variables by applying the percentile least absolute shrinkage and selection operator (Lasso) regularization method. The resulting linear regression showed that this novel machine-learning variable-selection technique is applicable in hypothesis testing of noise effects and soundscape research. The typical problems of overfitting and multicollinearity that occur when many situational and personal variables are involved were overcome. This study provides an extensive database of evaluated everyday sounds and listening situations, offering an enormous test power. Our machine learning approach, whose application leads to comprehensive models for the prediction of sound perception, is available for future study designs aiming to model sound perception and evaluation.
Introduction
Myriad research has shown that annoyance reactions to unpleasant sounds can cause psychological stress (Gunn et al., 1975; Wolsink et al., 1993; Lercher, 1996; Stallen, 1999) that consequently affects cognition and health (Serrou, 1995; Babisch, 2002; World Health Organization, 2011; Beutel et al., 2016; Klatte et al., 2017). While the majority of studies have focused on the perception, evaluation, and effects of medium or loud sounds generated by road traffic (Aletta et al., 2018; Riedel et al., 2019) and aircraft noise (Kroesen et al., 2008; Schreckenberg et al., 2016), annoyance has also been found in response to low-level sounds—for example, noise from wind turbines (Wolsink et al., 1993; Crichton et al., 2015; Klatte et al., 2017; van Renterghem, 2019). Since research to date in the field of wind turbine noise has focused on low frequencies, we aimed to investigate the evaluation of low-level day-to-day sounds in general and to establish comprehensive models including situational, sound-related, and person-related factors to predict the perception of environmental sounds in both low- and mid/high-level scenarios. Moreover, we investigated which influencing factors had a substantial impact on the evaluation of low-level sounds when taking into account multiple variables. To address these research aims, we conducted an online study wherein 1,301 participants reported on up to three everyday situations (including 32 relevant sound-related, situational, and person-related variables) in which they perceived low-level sounds. To handle this large number of variables, we implemented the percentile least absolute shrinkage and selection operator (Lasso) method, a linear machine learning approach, to select the crucial variables associated with annoyance ratings and to establish comprehensive models which overcome problems associated with overfitting and can predict annoyance for new data that were not involved in the model training and validation.
Previous research on soundscape perception and reactions to noise has identified several influencing factors related to sound, situation, and perception. Besides exposure level (Wolsink et al., 1993; Basner et al., 2014; Guski et al., 2017), these factors include many non-auditory variables, such as sensitivity to noise (Fields, 1993; Job, 1996; Schreckenberg et al., 2010; Hill et al., 2014; Shepherd et al., 2015; Park et al., 2016; Kim et al., 2017), extraversion and neuroticism with contradictory evidence for the relevance of this factor (Lercher, 1996), attitude toward the source or the authorities that operate the sound source (Stallen, 1999; Job et al., 2007; Kroesen et al., 2008), perceived disturbance (Stallen, 1999; Kroesen et al., 2008), fear of the noise source (Miedema and Vos, 1999), and the failure to cope with the environment which leads to stress (Guski, 1999). Many objective situational variables, including the presence of other people, the location of the perceiver, the sound insulation of dwellings, the visibility of the source, economic benefit through the source, exposure time, or ambient noise level (Fields, 1993; Wolsink et al., 1993; Bangjun et al., 2003; Janssen et al., 2011; Steffens et al., 2017) have also been identified as relevant factors.
Psychological Situations and Situational Characteristics
Situations can be seen as “fluctuating, dynamic, and dependent upon different perspectives” (Rauthmann, 2015, p. 177). Since situational factors are known to be essential predictors of human perception and behavior, they have been the subject of many studies. Nevertheless, these factors, interpreted as “situational,” have mostly been physical, objective, easily measurable, and (in a laboratory setting) controllable quantities: exposure time, noise insulation of dwellings, and ambient noise (Fields, 1993); age, benefit, and visibility of the source (Bangjun et al., 2003; Janssen et al., 2011); or exposure level, buildings, trees, and fences (Wolsink et al., 1993). Situations may be defined by the actual objective environment (E) and the momentary mental and affective state of the person (P) perceiving the specific situation (S). Lewin (1936) described a person’s behavioral states (B) driven by a function of the perception of that situation as B = f(P, E) = f(S). Following this theory, situations can be split up into cues, characteristics, and classes (Rauthmann et al., 2015). The objective physical quantities mentioned above can be seen as the situational cues from which people derive situational characteristics and psychological meaning during the evaluation processes. Finally, situational classes group situations that have similar characteristics or cues.
This view of situations is in line with the model of the “cognitive–motivational–emotive system” discussed by Smith and Lazarus (1990, p. 622). In that model, objective conditions—the cues—are individually interpreted by the person through imprinting his or her personality, including individual needs, commitments, goals, knowledge, attitudes, and beliefs. The resulting subjective situational construal—the characteristics—ultimately serves as the basis for the subsequent appraisal processes that mediate a person’s emotional response. For example, imagine a bike path parallel to a highly frequented 8-lane road surrounded by tall trees in full leaf. Cyclists who were highly skeptical of the greenery’s capability to attenuate traffic noise, improve air quality, or enhance health reported lower soundscape quality (Aletta et al., 2018).
The importance of taking psychological and situational characteristics into account is evident, as they reflect situational social aspects and people’s cognitive and emotional perceptions of their environments. To propose a taxonomy for measuring and describing psychological situations, Rauthmann et al. (2015) developed the DIAMONDS model through measuring individual differences in situation perception. This model consists of eight situational dimensions: “Duty (does something need to be done?), Intellect (is deep information processing required?), Adversity (is someone being overtly threatened?), Mating (is the situation sexually and/or romantically charged?), pOsitivity (is the situation pleasant?), Negativity (do negative things taint the situation?), Deception (is someone deceptive?) and Sociality (is social interaction and relationship formation possible, desired, or necessary?)” (Rauthmann et al., 2015, p. 364). The DIAMONDS model follows the principle of personality research that “individuals [may] think about situational characteristics in much the same way they think about personal characteristics” (Halevy et al., 2019, p. 4). Interestingly, to the best of our knowledge, such a model has not yet been used to investigate sound evaluation in terms of differences in individual situation perception. Therefore, we included the assessment of psychological situations in our study and hypothesized that psychological situation characteristics would significantly be associated with annoyance ratings of environmental sounds.
Stress and Its Precursors as Pivotal Points in Human Perception
In addition to the psychological situations that might play an essential role in human perception of sound, perceived control was assumed to be “the most important non-acoustical determinant of environmental noise annoyance” in the stress–annoyance model developed by Stallen (1999, p. 77), which interpreted annoyance as stress. He hypothesized that annoyance is driven by three main factors: perceived disturbance, perceived control, and coping with annoyance.
The first factor, perceived disturbance, depends on the sound of the sources and an initial cognitive–emotive appraisal process (Lazarus, 1966; Stallen, 1999). Disturbance occurs when people are hindered from achieving their goals (e.g., concentration, relaxation, sleep, communication). It is linked to annoyance both directly (Stallen, 1999; Kroesen et al., 2008) and indirectly through a mediated path via coping strategies (Park et al., 2016). Disturbance is also influenced by the personality trait noise sensitivity (Park et al., 2016).
The second factor, perceived control, is not associated with disturbance or noise (Stallen, 1999). Instead, it has been hypothesized that perceived control is driven by the noise management of the source—not the source itself—and that it directly affects annoyance through a secondary path (Lazarus, 1966; Stallen, 1999; Park et al., 2016). Kroesen et al. (2008) followed the approach of Stallen’s stress model in investigating annoyance induced by aircraft noise (Stallen, 1999). Perceived control and coping capacity were together shown to be the most important variables after concerns about adverse health effects and perceived disturbance.
Coping can be defined as “constantly changing cognitive and behavioral efforts to manage specific external and/or internal demands that are appraised as taxing or exceeding the resources of the person” (Lazarus and Folkman, 1984, p. 141). Coping is driven by “the belief and confidence of an affected person that he/she will somehow manage the problem” (Guski, 1999, p. 51). Coping with stress in general or annoyance in particular can be seen as a reappraisal of a person’s environment (Gunn et al., 1975; Smith and Lazarus, 1990; Stallen, 1999). Botteldooren and Lercher (2004), as well as Glass et al. (1972), assumed that annoyance is a prerequisite for coping. Park et al. (2016) reported an additional mediation effect of coping on the relationship between disturbance and annoyance that was not present in the model by Kroesen et al. (2008).
Personality Traits and Demographic Factors
In contrast to the aforementioned dynamic situational factors, stable personality traits change little in adulthood. The Big Five dimensions of personality, for example, were derived through a lexical approach, meaning that all relevant aspects of personality will develop and be found in the language of a community: Neuroticism, Extraversion, Openness to experience, Agreeableness, and Conscientiousness have been consistently reported to be important and sufficient descriptors of human personality (for an overview, see Digman, 1990; Costa and McCrae, 2008). Though Extraversion and Neuroticism (as well as all demographic variables) have often been discussed in relation to human sound evaluation, the results have been controversial (see the review by Fields, 1993). Even when all Big Five dimensions are considered together, a recent study by Lindborg and Friberg (2016) showed only small, albeit significant, effects.
Noise sensitivity seems to play an essential role in moderating or mediating the effect of sound on annoyance (Miedema and Vos, 2003; van Kamp et al., 2004) and health (Job, 1996). Shepherd et al. (2015) analyzed the effect of (other) personality traits on sensitivity to noise and revealed that extraversion acted as a major predictor. In their study, all Big Five dimensions showed linear and independent effects on noise sensitivity and together accounted for 33% of variance. Similarly, Lindborg and Friberg (2016) reported that noise sensitivity can be predicted by extraversion and conscientiousness. Belojević and Jakovjlevic (2001) also investigated factors influencing sensitivity to noise and found that neuroticism was the only significant person-related factor in noisy environments but had no significant effect in quiet areas. Since noise sensitivity plays a vital role in sound perception and since extraversion and neuroticism may influence noise sensitivity, extending existing findings by investigating these variables for low-level sounds seems worthwhile.
Demographic variables have often been investigated in noise annoyance research, showing only a small or generally insignificant effect (Yu and Kang, 2008). Miedema and Vos (1999) reported that people between 20 and 70 years of age showed higher annoyance compared to younger or older people. Gender was not significant, but education level showed a small effect of increased annoyance with increasing years of education. The hypothesis that people with higher education, and thus higher income, experience less annoyance by seeking less noisy living environments seems to apply only to residents of small or medium-sized cities, with income not significantly moderating annoyance (Fyhri and Klćboe, 2006).
Aims and Hypotheses
Many of the studies mentioned above have focused on a small number of variables associated with sound evaluations and annoyance reactions. Our study, in contrast, combined a high number of relevant sound-related, situational, and person-related variables in a comprehensive model to predict low- and mid/high-level sounds in everyday life. We therefore attempted to identify the most relevant predictors. Based on previous research, we assumed that situational variables, as opposed to person-related factors, would have higher explanatory potential in predicting annoyance ratings of both low- and mid/high-level sounds. We further hypothesized that the category of a sound (natural vs. technical vs. human) would play a decisive role in evaluating environmental sounds. We included demographic factors to investigate the extent to which previous results are reproducible in a retrospective online study. Finally, we explored which low-level sounds participants perceived as particularly pleasant or annoying and how often these sounds occurred in day-to-day life.
Materials and Methods
Participants
Initially, we defined 18 quotas of 100 participants each. The quotas were established by combining three Age Classes (20–40, 41–60, and 61–80 years) with two Genders (female and male) and three Education Levels (International Standard Classification of Education (ISCED) levels 0–2 (up to lower secondary education), level 3 (upper secondary education), and levels 4–8 (university-level education); United Nations Educational, Scientific and Cultural Organization (UNESCO) UNESCO Institute for Statistics, 2015. For the application to the German education system (see Schneider, 2008). We commissioned the Cologne-based commercial market research company respondi AG1 to provide suitable participants from its online panel according to our quota targets defined above.
Of the 12,000 persons invited by email, 4,087 started the online questionnaire; 1,815 (54%) completed the questionnaire and reported and evaluated 5,445 sound situations. Of these, 514 (28%) reported no sound situations or gave implausible answers. Consequently, 2,645 datasets were excluded from the evaluation. We ultimately analyzed the data of 1,301 participants (630 men, mean age = 49.9, SD = 15.5; 671 women, mean age = 49.6, SD = 16.4), who reported on 2,800 sound situations. Education Level and Gender were evenly distributed (men: 223 level 3, 185 below, 222 above; women: 228 level 3, 196 below, 247 above). In addition to German subjects, the sample also included a few respondents of non-German Nationality (12 men; 13 women). Participants with any type of Hearing Impairment (n = 213; 16.4%) were included in the final dataset since the mean Annoyance ratings of all their reports did not differ significantly from the ratings by persons without a known hearing disability [Wilcoxon (W) = 530,871; p = 0.749; calculated on raw data]. Additionally, their Noise Sensitivity (M = 15.16; SD = 3.76; calculated on raw data) did not differ significantly (W = 107,813; p = 0.107) from participants without a known Hearing Impairment (M = 14.70; SD = 4.13).
Procedure
To address our research topics regarding the occurrence of low-level environmental sounds in everyday life and person-related and situational factors influencing their evaluations, we conducted a large-scale online study using the LimeSurvey2 software (see the questionnaire in the Supplementary Material). After reporting on sociodemographic and person-related variables, participants described and evaluated up to three sound situations they had experienced in the past, with no acoustic stimuli provided by us. (If a participant reported less than three sound situations, we provided one to three preset sound situations, so that each participant had three to evaluate. The situations we added were not taken into account in this analysis.) We let the participants decide how they understood “quiet” or “low-level” (in the sense of “not loud”). We further used the term “sound” to avoid bias toward negatively perceived sounds classified as “noise.” After finishing the questionnaire, the participants were automatically redirected to the panel operator respondi AG to receive monetary compensation for their participation.
Design and Questionnaire
In our online study, we asked the participants to remember and evaluate low-level sounds they had heard. Thus, we focused on sound immission and not on sound emission. Since perceived sound level decreases with increased distance from the source and can be changed in terms of frequency components, we believe that evaluating sound sources from a greater distance—e.g., through closed windows—will lead to biased, experience-driven judgments. The questionnaire we used in our study is provided as Supplementary Material.
Person-Related Variables
Besides the sociodemographic variables (i.e., Age, Gender, Education Level, and Nationality), participants reported other temporal stable variables, such as whether they were aware of having any Hearing Impairment. They further rated their living environment by answering the question, “How would you describe your living environment?” using the five-level bipolar item Liveliness, ranging from very lively (1) to very calm (5). They also reported on the number of Persons living in the household (1 to “6 or more”) and their household’s monthly disposable Net Income (German Federal Statistical Office, 2018). Moreover, since the person-related factors Extraversion, Neuroticism, and Noise Sensitivity have shown associations with sound evaluations in previous studies (Fields, 1993; Job, 1996; Lercher, 1996; Schreckenberg et al., 2010; Hill et al., 2014; Shepherd et al., 2015; Kim et al., 2017), we obtained those factors using the German 10 Item Big Five Inventory (BFI-10; Rammstedt and John, 2007; Rammstedt et al., 2012) and a nine-item Noise Sensitivity questionnaire (“Kurzform des Fragebogens zur Lärmempfindlichkeit,” LEF-K, developed by Zimmer and Ellermeier, 1998). Participants also answered the question “Are you generally able to mentally fade out sounds (even loud ones)?” using a five-level scale ranging from does not apply at all (0) to is absolutely right (4) for the item General Fade-out. To group the reports for each participant (see section “Statistical Analyses” for the random effect), we assigned a unique ID to each participant.
Sound-Related Variables
In addition to the temporally stable person-related variables, the following variables are assumed to change over time depending on the sound and its embedding situation. Participants responded to the item “Please remember sounds that you have classified as low-level in your environment in the past.” by reporting sounds in free-form text descriptions. They also rated the perceived Loudness of their sounds (“How do you rate the sound?”) on a five-level scale ranging from scarcely audible (1) to low-level (3) to middle and louder (5). The Loudness levels 4 and 5 were intended to check whether participants had indicated a low-level sound. The Timbre of the sound was assessed on a five-level bipolar scale ranging from deep, dull (1; German: “tief, dumpf”) to high, shrill (5; German: “hoch, schrill”) as well as the item Tonality based on the levels broadband noise (1; German: “rauschartig”) to tonal (5; German: “tonhaltig”).
They also used a German translation of the standard soundscape dimensions by responding to the question “Please indicate how much you consider the following characteristics to be a description of the sound.” These eight dimensions—namely Pleasant (“angenehm”), Vibrant/Exciting (“lebendig/pulsierend”), Eventful (“ereignisreich”), Chaotic (“chaotisch”), Annoying/Distracting (“lästig/störend”), Monotonous (“monoton”), Uneventful (“ereignislos”), and Calm (“ruhig”)—are measured on Likert scales ranging from strongly agree (1) to strongly disagree (5) and can be arranged in a circumplex model of soundscape perception (Axelsson et al., 2010; Lindborg and Friberg, 2016; following ISO/TS 12913-2, ISO, 2018). To obtain the dependent variable Annoyance that was relevant for our analyses, we computed the arithmetic mean across the ratings of Pleasant (inversed) and Annoying.
Situational Variables
Concerning the time-varying situational variables, participants responded to “For each sound, please mention a situation in which you have experienced this sound.” using free-form text descriptions. Participants’ affective state (“Please assess how you feel in this sound situation.”) was obtained in terms of Valence (negative-positive), Arousal (calm-excited), and the perceived Control over the sound situation (weak-strong). Here, we used the Self-Assessment Manikin (SAM), which consists of three sets of nine pictograms (see the questionnaire in Supplementary Material) representing the different states of the three affective dimensions (Lang, 1980; Bradley and Lang, 1994; PXLab: Irtel, 2007). The SAM has been shown to be quickly and consistently answerable by people of various nationalities and languages, by adults and children, and by people with language disorders (Bradley and Lang, 1994; Bynion and Feldner, 2017). It has also been demonstrated to be applicable to the evaluation of acoustic stimuli (IADS: Bradley and Lang, 2000) and therefore seemed suitable for our study. The use of the SAM can activate responses in any part of the emotional system, like physiological, behavioral, and emotional (Suk, 2006). Thus, the SAM seems to be a more profound measurement method than written scales, which must be processed via cognition. The pictograms can be modified or replaced with signs to achieve similar results (Affective Slider: Betella and Verschure, 2016). In many studies, the original SAM was adapted in terms of number of levels, number of pictograms, and manipulation of the pictograms (Bynion and Feldner, 2017; Bartosova et al., 2019). The semiotics of the pictograms and signs, although self-explanatory, are usually explained at the beginning of a test (Lang and Bradley, 1997; Suk, 2006). Võ et al. (2009) used the SAM to avoid the German translation for arousal (“Erregung”), which could have sexual associations. Since the SAM pictograms can be used for many attributes other than valence, arousal, and dominance (Suk, 2006), we believed that additional descriptions of the three affective variables were necessary. Because slightly modified words were successfully used in most studies, we added the adjectives given above to clarify the two anchors of each of these scales.
Participants further responded to the question “Can you mentally fade out this sound?” for the Specific Fade-out variable using a five-level Likert scale ranging from does not apply at all (0) to does fully apply (4). To assess participants’ Active Coping response to the sound situation, we asked “Suppose you feel disturbed by the sound 1 in situation a3. Would you take action to reduce the disturbing effect?” to which respondents answered yes or no. For a more detailed description of the situation and its psychological characteristics, we utilized an ultra-brief German measure of the situational eight-factor DIAMONDS model (S8-II; Rauthmann, 2018). Finally, participants reported the Frequency of occurrence of the described situation using six levels: less than once a year (0); once to four times per year (1); five to 11 times per year (2); once to three times monthly (3); once to three times weekly (4); four to seven times weekly (5); and more than once a day (6).
Data Analysis
Data Preparation
We first analyzed all sound descriptions and classified them into the three macro-level sound categories of natural, human, and technical sounds that have already been applied in previous studies (Axelsson et al., 2010; Bones et al., 2018) as well as the soundscape standard (ISO 12913-2, ISO, 2018).
We further established 38 micro-level sound categories (see Figure 3) in the course of a more detailed qualitative analysis. This categorization was mainly carried out using two processing loops. In the outer loop, an audio expert looked through the sound descriptions and searched for an often-mentioned sound or word. A category was then established for the sounds described by that word. This definition was based on the knowledge of sound properties, sound sources, and theories of sound perception. For example, the two categories Dogs and insects with possible threats and Dogs, insects, and other animals without possible threats were created, as an individual’s attitude to the sound source can change the perception of sound; e.g., a fly might be less annoying than a mosquito because one expects a possible painful mosquito bite. Another example was the Signals category, which includes all types of signals—such as ring tones, alarm clocks, and doorbells—that have a concrete meaning for the participant and urge the participant to take action. Some sounds have been combined, such as sounds caused by garbage collection and construction site noises, since participants usually have no direct influence on these sound sources. As a result, reduced perceived control and limited coping may emphasize annoyance.
In the inner loop, the data was then filtered by this word or iteratively for a part of the word (e.g., by omitting the word ending). The word was also modified or replaced by a synonym. If the context derived from the sound and situation descriptions of each filtered sound situation matched the noise category, all these reports were assigned to the selected category and excluded from further handling. By this exclusion, the number of remaining reports was reduced successively. If no further observation could be assigned to this category, the process was resumed with the outer loop and the next category was defined. These loops were repeated until all sound situations were categorized. Accordingly, there were numerous categories and no “undefined” group. Datasets which included responses with nonsensical terms (e.g., “fff”) or in a language other than German were excluded from the evaluation.
We also derived categories for the Location where participants experienced the described situations (see Table 1). In addition, we applied the Activity categories introduced by Greb et al. (2018), which we adapted slightly for our data, as shown in Table 1. Namely, we removed Making music, added Making a call, and assigned new activities to the existing categories when a similar evaluation distribution existed. Of the 13 Activity categories, the category Undefined was the largest due to 978 situation descriptions that contained no information about activities. We therefore excluded the Activities from further detailed analysis.
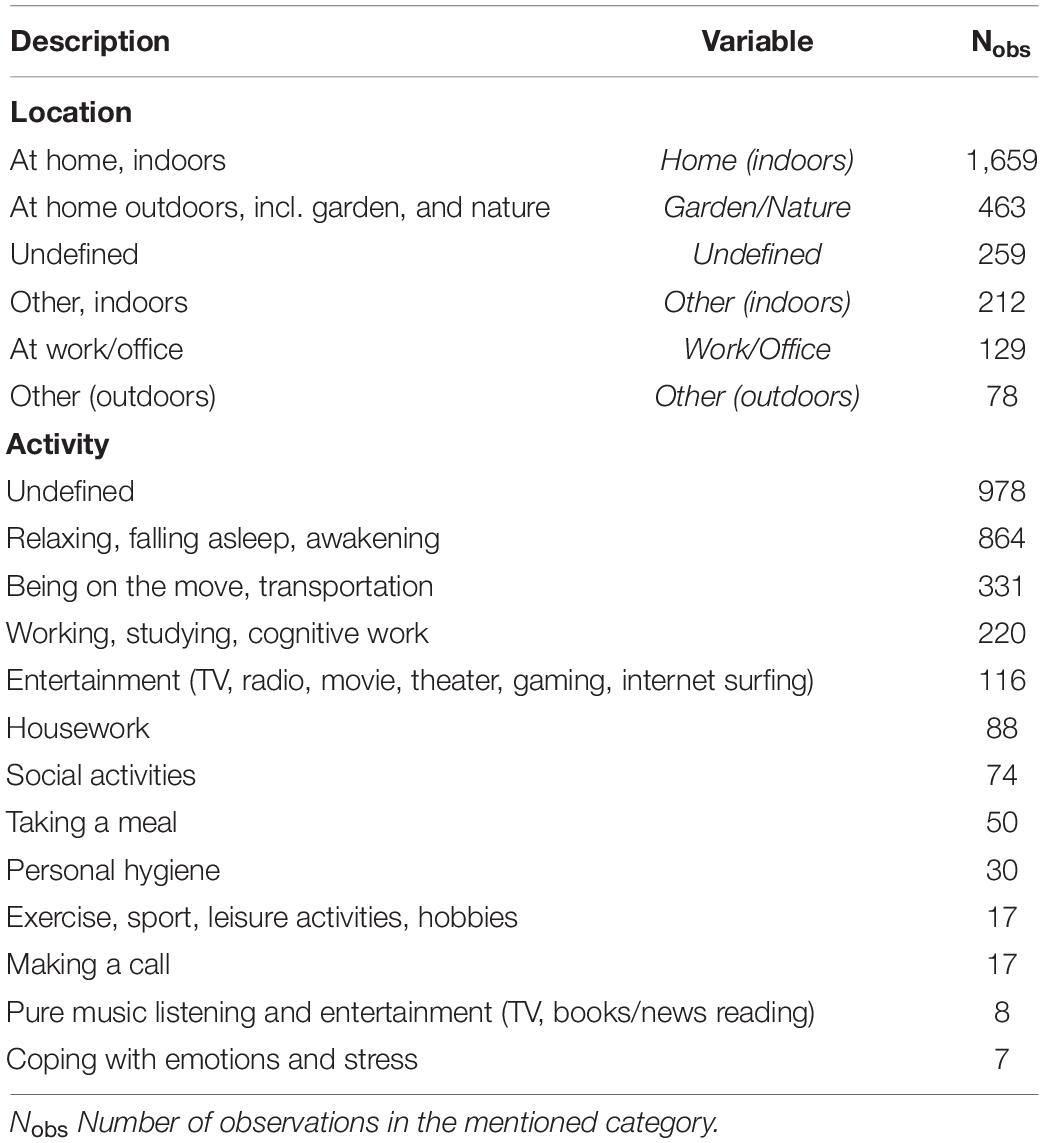
Table 1. Categories used for the variables Location and Activity.
To test the inter-rater reliability, a second rater assigned the sound situation descriptions to the micro-level sound categories. For 190 descriptions, none of these categories seemed reasonable. Again, reports with nonsensical sound and situation descriptions were marked for removal. The point estimate of Krippendorff’s alpha of 0.782 with bootstrapped 95% confidence intervals (CIs) [0.767, 0.796]4 were obtained by bootstrapping 1,000 samples (Zapf et al., 2016). This reliability lies between α = 0.667 and α = 0.800, which is why the micro-level sound categories should only be used for “drawing tentative conclusions” (Krippendorff, 2004, p. 241). According to Krippendorff, an α above 0.800 is considered reliable, which we observed for the macro-level sound categories (α = 0.877, CI [0.863, 0.891]5). Values for the Locations (α = 0.625, CI [0.599, 0.650]6) are below that threshold, which allows only tentative conclusions.
As we were particularly interested in the perception and evaluation of low-level sounds, we grouped all datasets according to their Loudness rating as low-level (Loudness levels [1–3]) or mid/high-level ([4–5]). The person-related variable describing the perceived Liveliness of the living environment was grouped into the category calm or lively through a median split (Mdnenvironment = 4). Finally, we assigned to each participant the mean value of the reported Net Income interval and combined two variables—number of Persons living in the household and monthly disposable household Net Income—to form a new variable: net Income per Person.
Statistical Analyses
All statistical analyses were performed with R 3.6.3 (R Core Team, 2020) and R-Studio (RStudio Team, 2019). To predict Annoyance assessments by person-related, situational, and sound-related variables, we calculated several hierarchical linear mixed-effect models, as such models can handle non-normally distributed data and take into account dependencies of the three observations (level 1) within the participants (level 2) while allowing for the inclusion of time-varying (i.e., situation-related) predictors. The participants, represented by their grouping ID, were included as a random factor in all models we used in this paper (see Table 2 for an overview of all models).
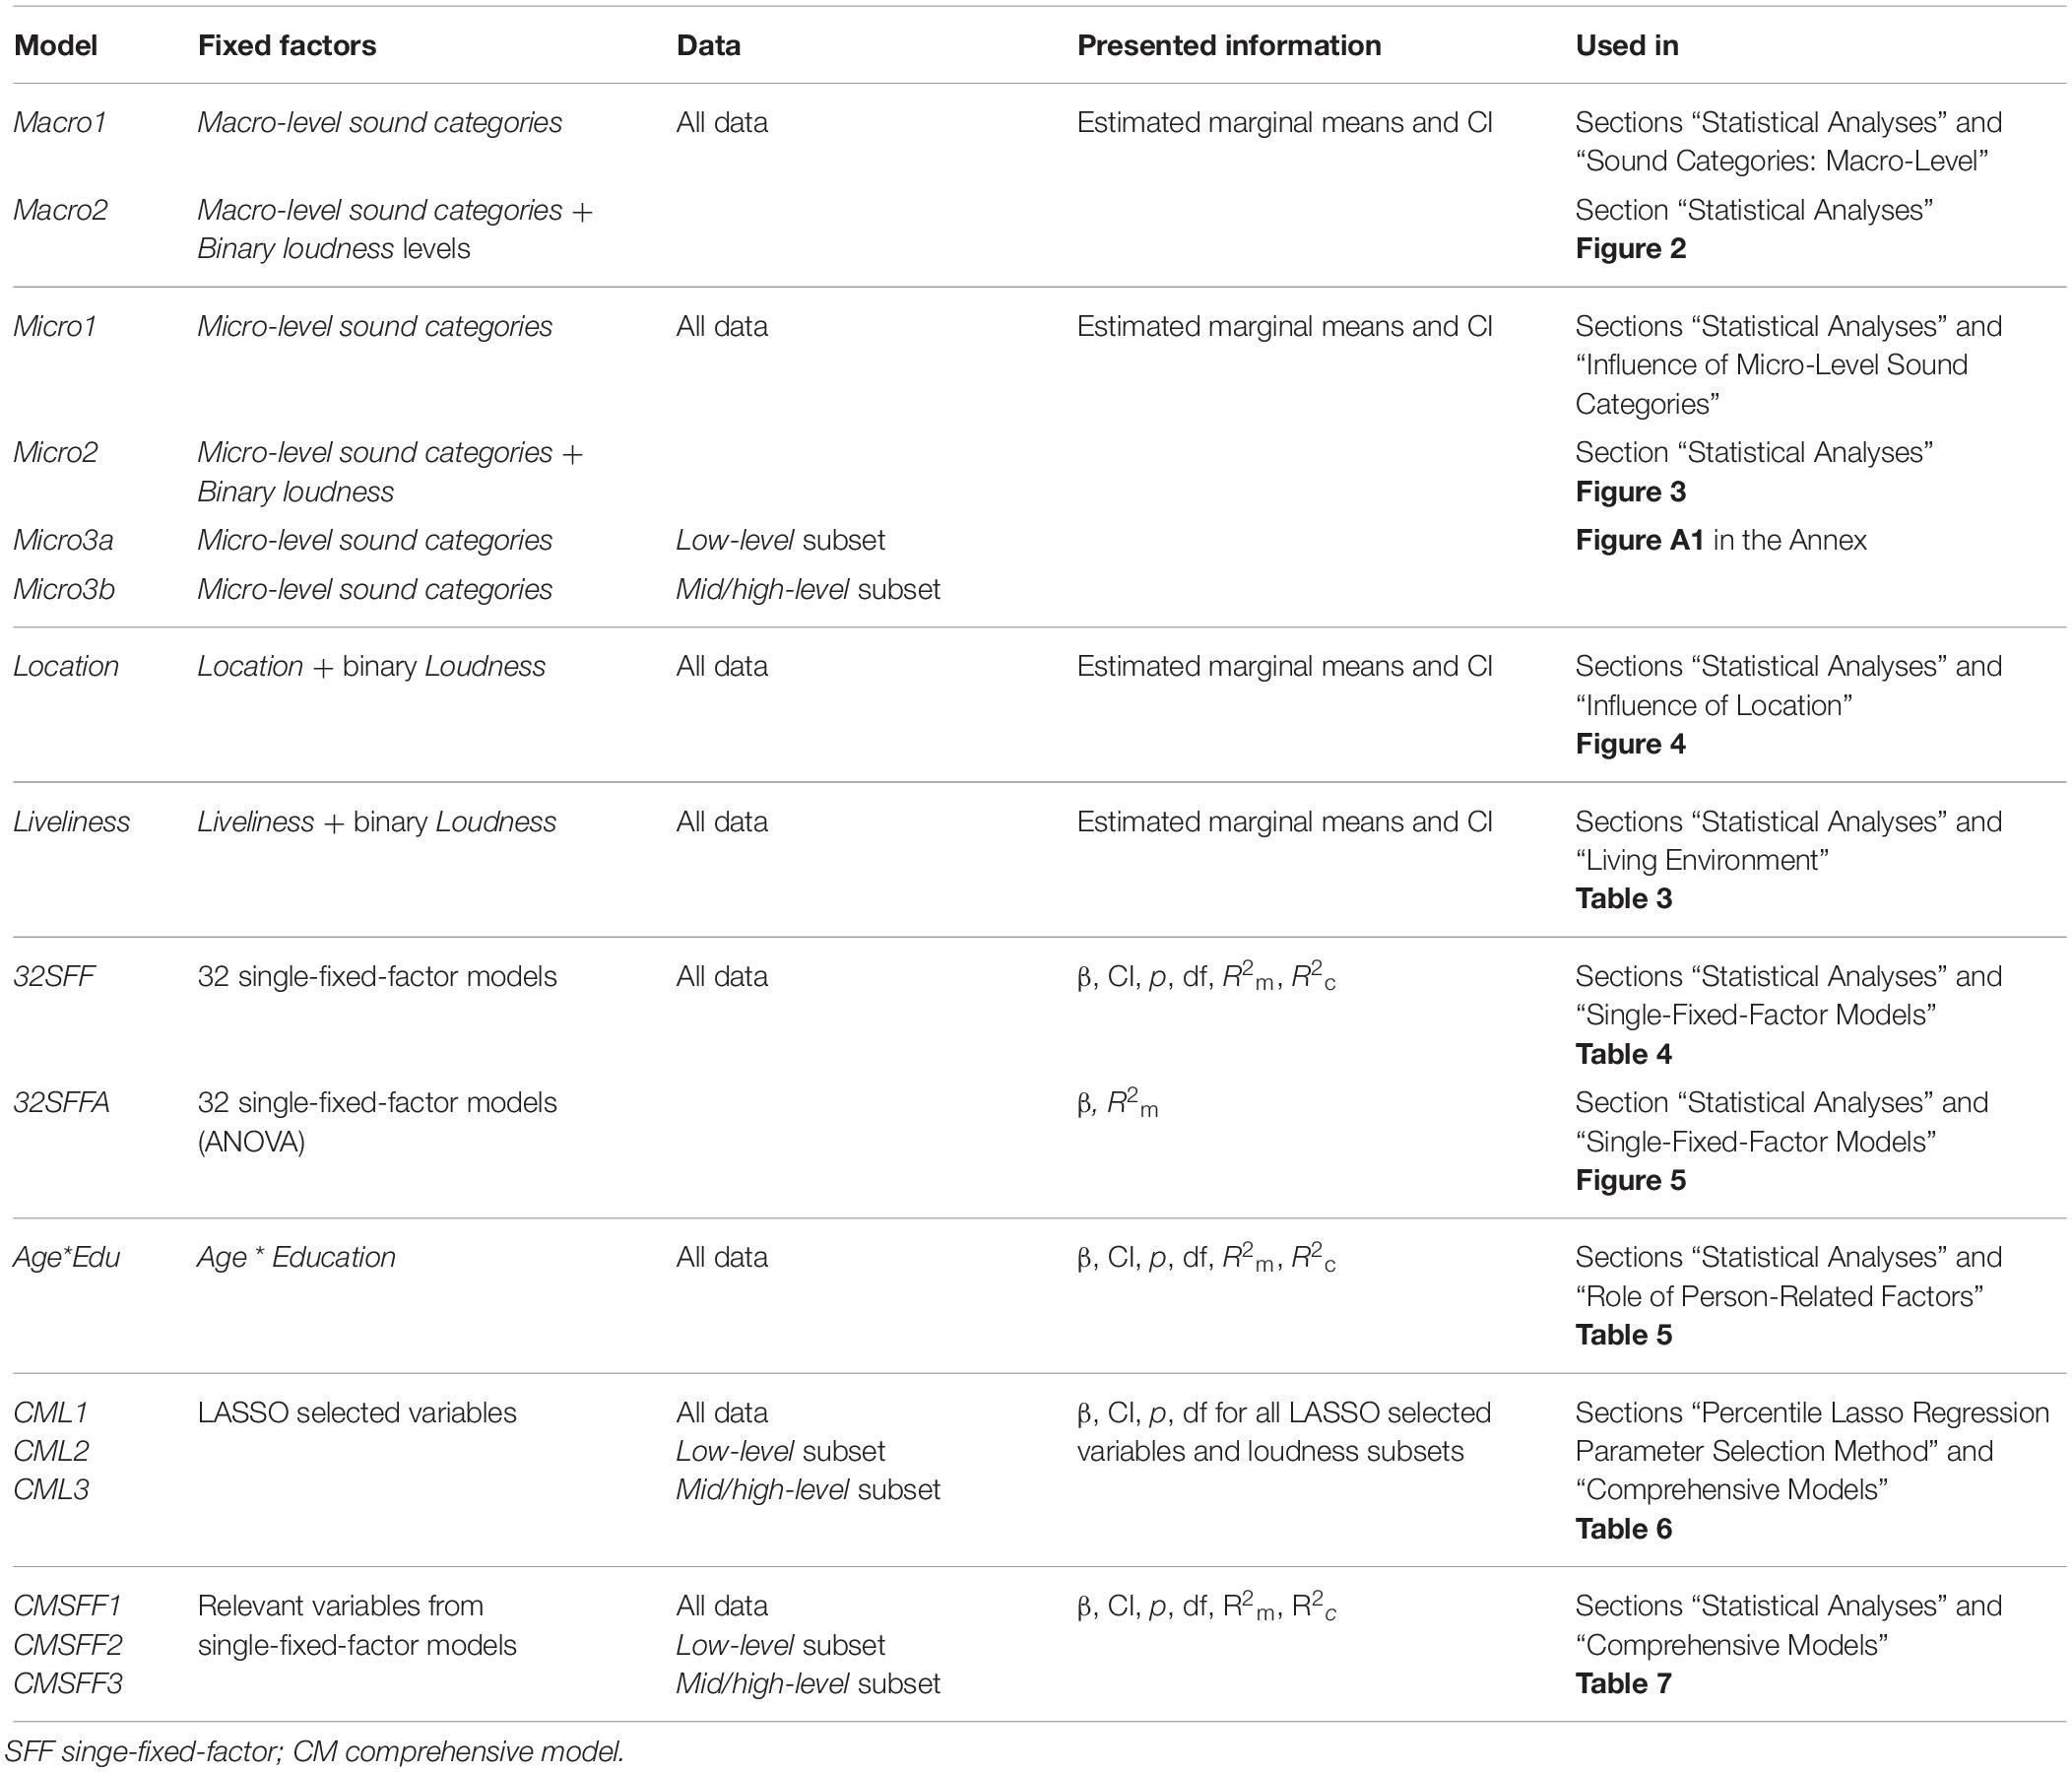
Table 2. Overview about the Models used in this contribution.
To calculate these models, we used two different approaches. First, we used the lme4 (Bates et al., 2015) and performance7 R packages to calculate the marginal and conditional coefficients of determination (R2m and R2c) as effect size measures (models 32SFF/32SFFA, Age∗Edu, and CMSFF1/2/3). R2m addresses the variance of Annoyance that is explained by fixed factors, whereas R2c represents the variance that is explained by both fixed and random factors (Nakagawa and Schielzeth, 2013). We derived probability values for each implemented variable and factor-level dummy using the lmerTest R package (Kuznetsova et al., 2017). To assess the influence of each variable of interest (see subsections of section “Design and Questionnaire”) on Annoyance, we built one single-fixed-factor model for each variable and dummy (Table 4, model 32SFF). We also derived one probability value for each variable (or, in the case of a factor, including the dummies of a factor) using ANOVA (Figure 5, model 32SFFA). Several publications have shown that ANOVA may be successfully applied to non-normally distributed data (Glass et al., 1972; Harwell et al., 1992; Lix et al., 1996). The probability values were calculated using Satterthwaite’s approximation of degrees of freedom. This approximation combined with restricted maximum likelihood estimation produces “the most consistent Type 1 error rates, being neither anti-conservative nor overly sensitive to sample size” (Luke, 2017, p. 1500).
Second, we used bootstrapping—drawing 50,000 samples—with the clusterBootstrap R package (Deen and de Rooij, 2020) to calculate the marginal means of Annoyance, including the 95% CIs for non-normally distributed data (models Macro1/2, Micro1/2/3a/b, Location, and Liveliness). This method uses linear models, is relatively free of assumptions, and is particularly well suited for hierarchical data. Non-normally distributed data were considered by resampling the observations at the individual level (within persons). This means that if one observation of a person was selected randomly, all other observations of this person were also included in the calculation (which is also the case for the Lasso regression method described in the next section).
We used β as a standardized regression coefficient only for independent variables that did not represent a physical quantity (such as age, income, and persons in the household). The factor levels represented by their dummy variables were also standardized. The dependent variable Annoyance was not standardized for a more intuitive interpretation.
When calculating CIs or probabilities, we accepted the inflation of Type I errors because applying a correction to the confidence levels and p-values for all models used in this paper would have resulted in many different confidence levels, complicating the interpretation. Additionally, reducing the family-related error rate using a correction method would have increased the probability of Type II errors and reduced the validity of the test. More importantly, the discussion of which correction should be used and how the family might be defined would be beyond the scope of this paper, as this is a very controversial topic in the research community (Rothman, 1990; Perneger, 1998; Bender and Lange, 2001). The same applies to the general use of probabilities in the context of linear mixed-effects regression models (Luke, 2017). Thus, all the probabilities and CIs given here should be interpreted in this context and should not be seen as a hard cut-off condition.
Percentile lasso regression parameter selection method
One of our aims was to establish a comprehensive model predicting the perceived Annoyance of low-level sounds by utilizing the most essential sound-related, situational, and person-related factors. To this end, we followed the work of Greb et al. (2018) and used the percentile-Lasso regression method (Roberts and Nowak, 2014) for multilevel linear regression modeling based on the measured data (models CML1/2/3). The Lasso method was first described by Tibshirani (1996) and has become a popular shrinkage method in the field of statistical learning algorithms. It adds a ℓ1 regularization term with a tuning parameter λ to linear regression models that controls the amount of shrinkage applied to the regression coefficients. Choosing a high λ value potentially sets all coefficients to zero, while λ = 0 results in a linear regression model without penalty (see Figure 1). This form of regularization can thus be used to extract important features from the data and reduce overfitting by excluding less important predictors from the model and therefore lowering its complexity. To achieve these advantages, the optimal compromise between retaining all contributing factors in the model (λ = 0) and excluding all variables (at λmax) must be found. Therefore, the loss function, minimized within the Lasso, is defined in Eq. 1.
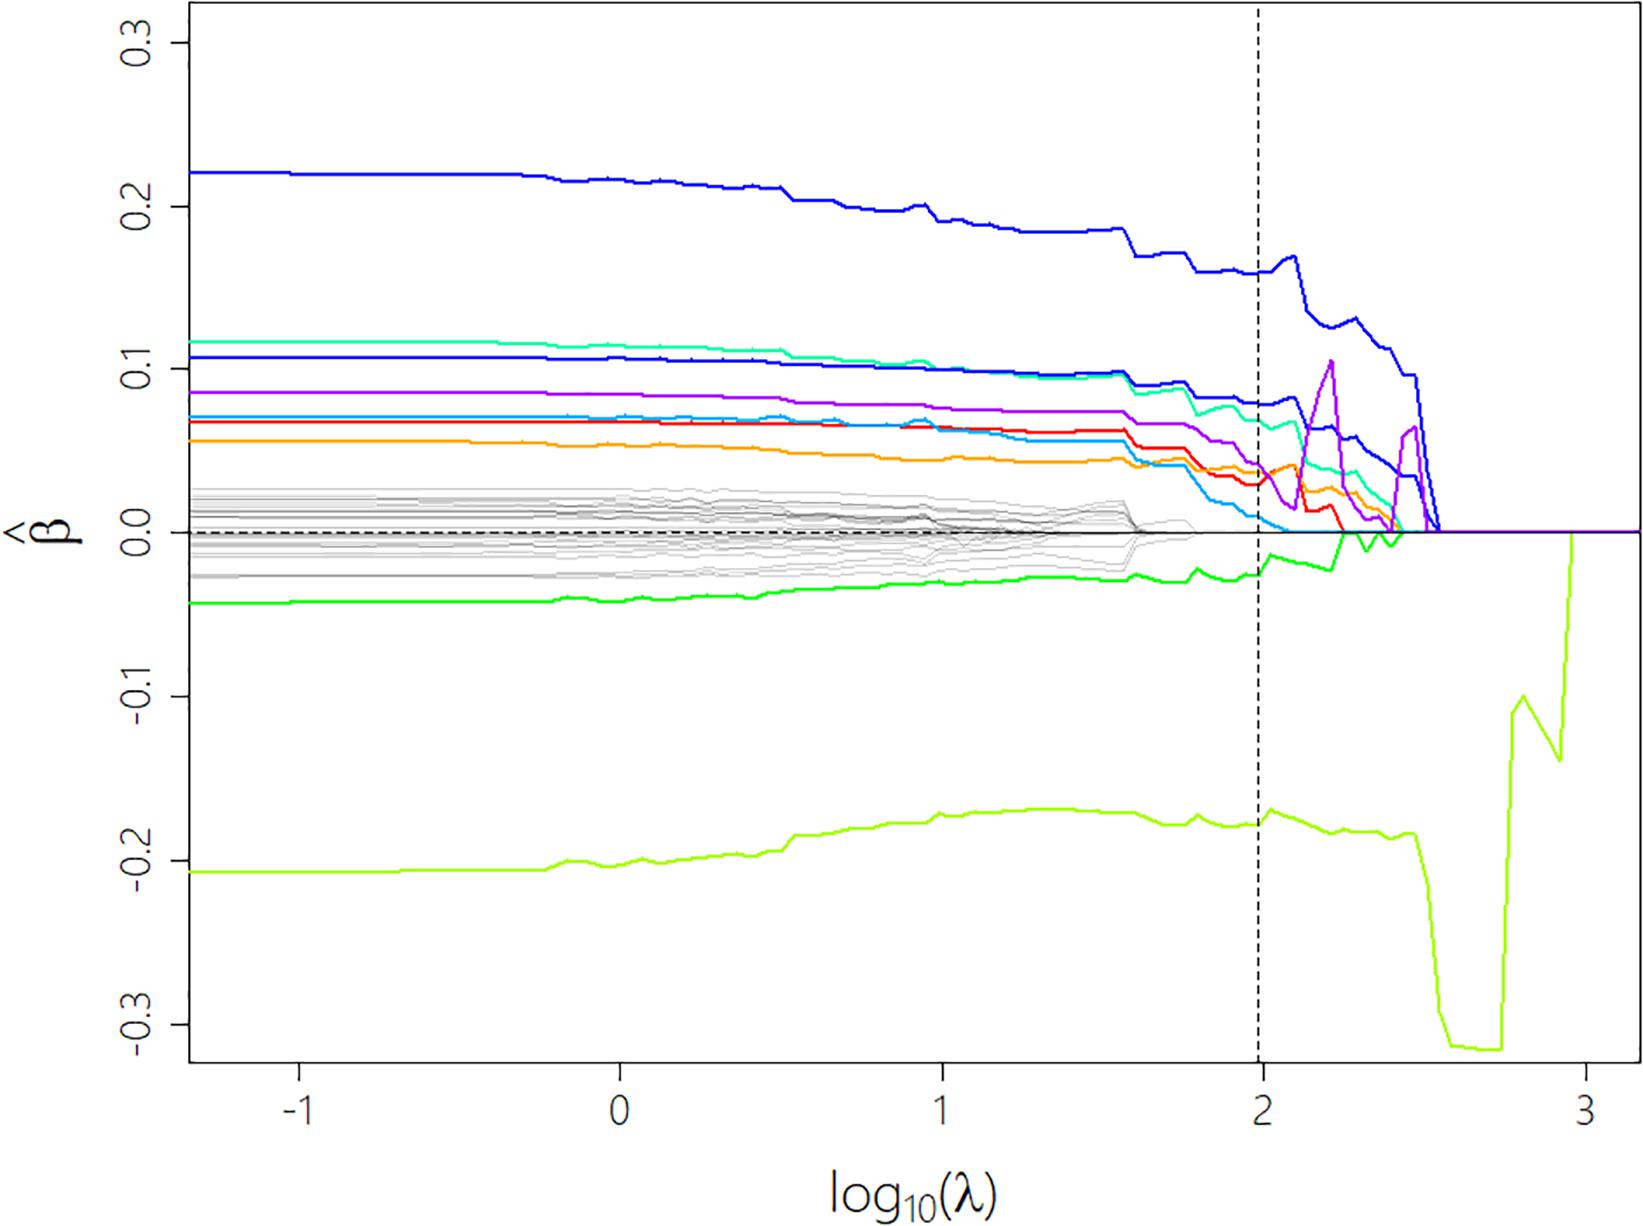
Figure 1. Progression of the coefficients as a function of the tuning parameter λ during the shrinking process. The colored lines show predictors that don’t get eliminated until the optimal λ (vertical dotted line) is reached. Dummy variables that constitute one factor variable share the same color. Most coefficients follow the expected decreasing trend while some (see light green curve) show a completely unexpected and sometimes even strongly transient progression which can be considered as regularization artifacts.
We chose five-fold cross-validation to find the optimal λ value that results in a parsimonious and generalized model with small prediction error. The technique of K-fold cross-validation involves randomly splitting the data into K nearly equally sized folds and using K–1 folds as training data. The remaining fold is used for validating the previously estimated statistical model and calculating the mean squared error (MSE) of the prediction on unseen data that was not involved in the training. This routine is repeated K times until every fold has been used as a validation set, resulting in a cross-validation error (CV) as the mean MSE calculated from all K repetitions. Our decision that K = 5 resulted from the number of observations—considering computational costs and a sensible amount of data in the validation sets—since research has noted that 5- and 10-fold cross-validation can be viewed as equally efficient with regards to the bias–variance tradeoff (Krstajic et al., 2014). The random fold assignment was—respecting the two-level structure of the measured data—based on the level of the participants to assure that all measurements of one participant were assigned to either the training or validation set for all repeatitions within the cross-validation.
A set of 100 λ values (grid) was used to build and validate models within every cross-validation cycle. As suggested by Greb et al. (2018), the grid had an exponential form to achieve a higher resolution of values toward zero. The value λmax was determined in advance by successively increasing λ until all regression coefficients were set to zero. As proposed by Hastie et al. (2009), the 1-SE8 rule was then applied to calculate the optimal λ value for every cross-validation cycle and to choose the most parsimonious model whose MSE was within one SE of the minimum cross-validation error.
To overcome the sensitivity of finding the optimal λ value to the cross-validation fold assignment (Krstajic et al., 2014), we repeated the process of cross-validation 100 times and selected the 95th percentile as the optimal λ value for the final fit. As reported by Roberts and Nowak (2014), the 95th percentile produces good and reliable results.
We used the glmmLasso R package (Groll, 2017) to implement the percentile-Lasso regression method. The package allowed us to calculate the generalized linear mixed effect models using a group Lasso estimator, as proposed by Groll and Tutz (2014), which applies the same amount of shrinkage to all dummy variables that constitute one factor variable. All factor variables in the dataset were coded as dummy variables. All predictor variables, including the dummy variables, were z-standardized to ensure a fair penalization and to compare their relative contributions to the Annoyance ratings. The factor levels containing the most observations were selected as the reference category for the dummy creation, as depicted in the caption of Table 6.
Results
Descriptive Statistics
Sound Categories: Macro-Level
Participants reported 904 natural (32%), 552 human (20%), and 1,344 technical sounds (48%) as well as 1,260 (45%) mid/high-level and 1,540 (55%) low-level sounds (separated by the binary perceived Loudness variable). The results of a linear mixed-effects model (Macro1) revealed that predicted mean Annoyance of the three macro-level sound categories differed significantly according to the bootstrapped CIs (model Macro1): Mnatural = 1.87, CI [1.79, 1.95]; Mhuman = 3.06, CI [2.94, 3.19]; Mtechnical = 3.41, CI [3.33, 3.48]. Figure 2 shows the estimated marginal means and CIs for both levels of perceived Loudness, indicating significant differences between all means (model Macro2). The differences of the estimated marginal mean values in relation to the Loudness levels were the same for all three sound categories due to the addition of Loudness levels as a second fixed factor. Figure 2 also displays the underlying distributions of the measured data for the subsets shown. The distributions for the macro-level sound categories human and technical differed across Loudness levels. As expected, more mid/high-level sounds were reported at higher levels of Annoyance. The low-level human sounds were in the opposite direction, and low-level technical sounds were normally distributed.
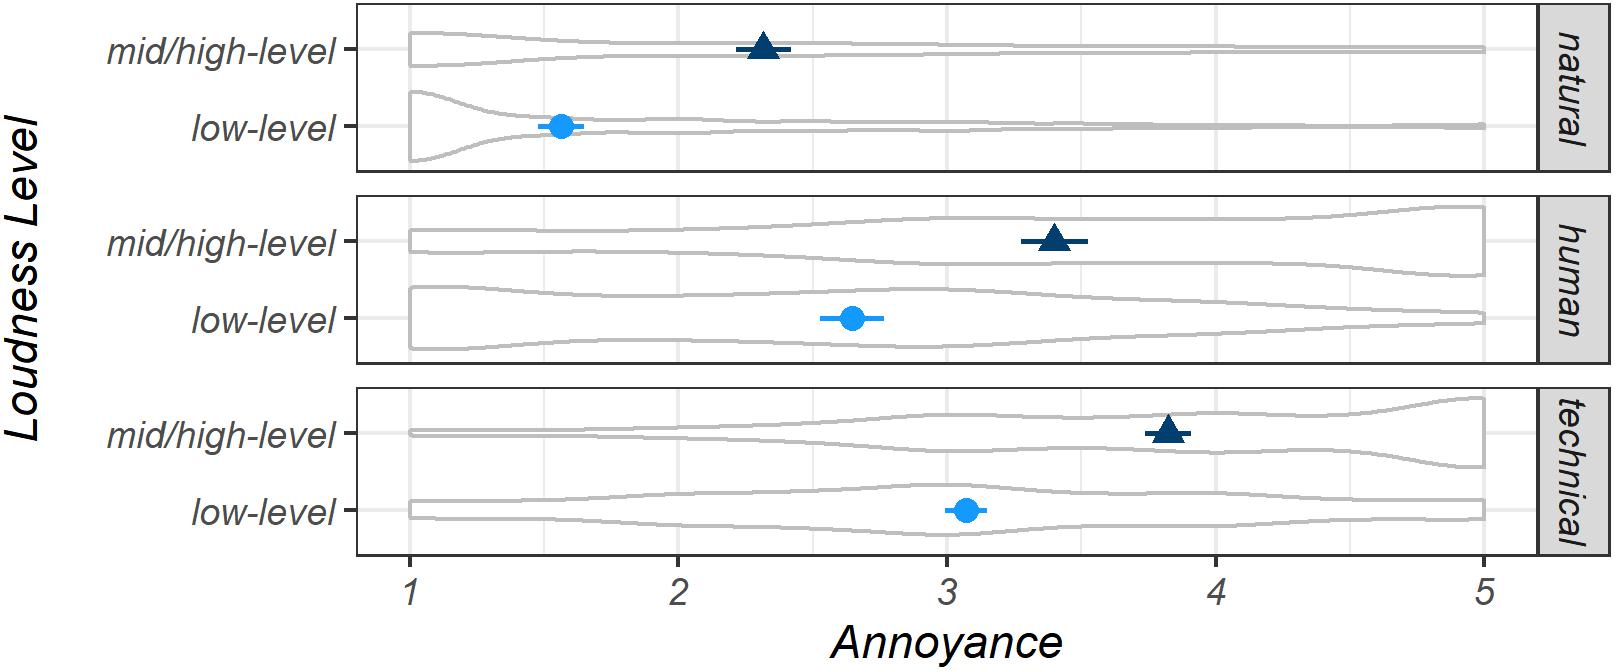
Figure 2. Estimated marginal means for Annoyance for natural, human, and technical sounds, separated by binary Loudness levels, displayed with 95% confidence intervals, both determined by bootstrapping. Very pleasant = 1, very annoying = 5. Distributions of the underlying measured Annoyance judgments are presented in gray. Model Macro2.
Influence of Micro-Level Sound Categories
Participants reported a total of 2,800 sounds that were merged into 38 micro-level sound categories (see Figure 3 with data from model Micro2). Similar to the sound categories at the macro-level shown in Figure 2, the estimated mean values for the categories at the micro-level presented in Figure 3 were equally spaced between the two Loudness levels. Since the distributions of the measured data (not shown here) differed for the micro-level categories even more than for the macro-level categories, the estimated marginal mean values and CIs must be interpreted with the information given above. To provide a more realistic view of these differences, we calculated two different models for both Loudness subsets that are not discussed in detail here (models Micro3a/b; Figure A1 in the Appendix).
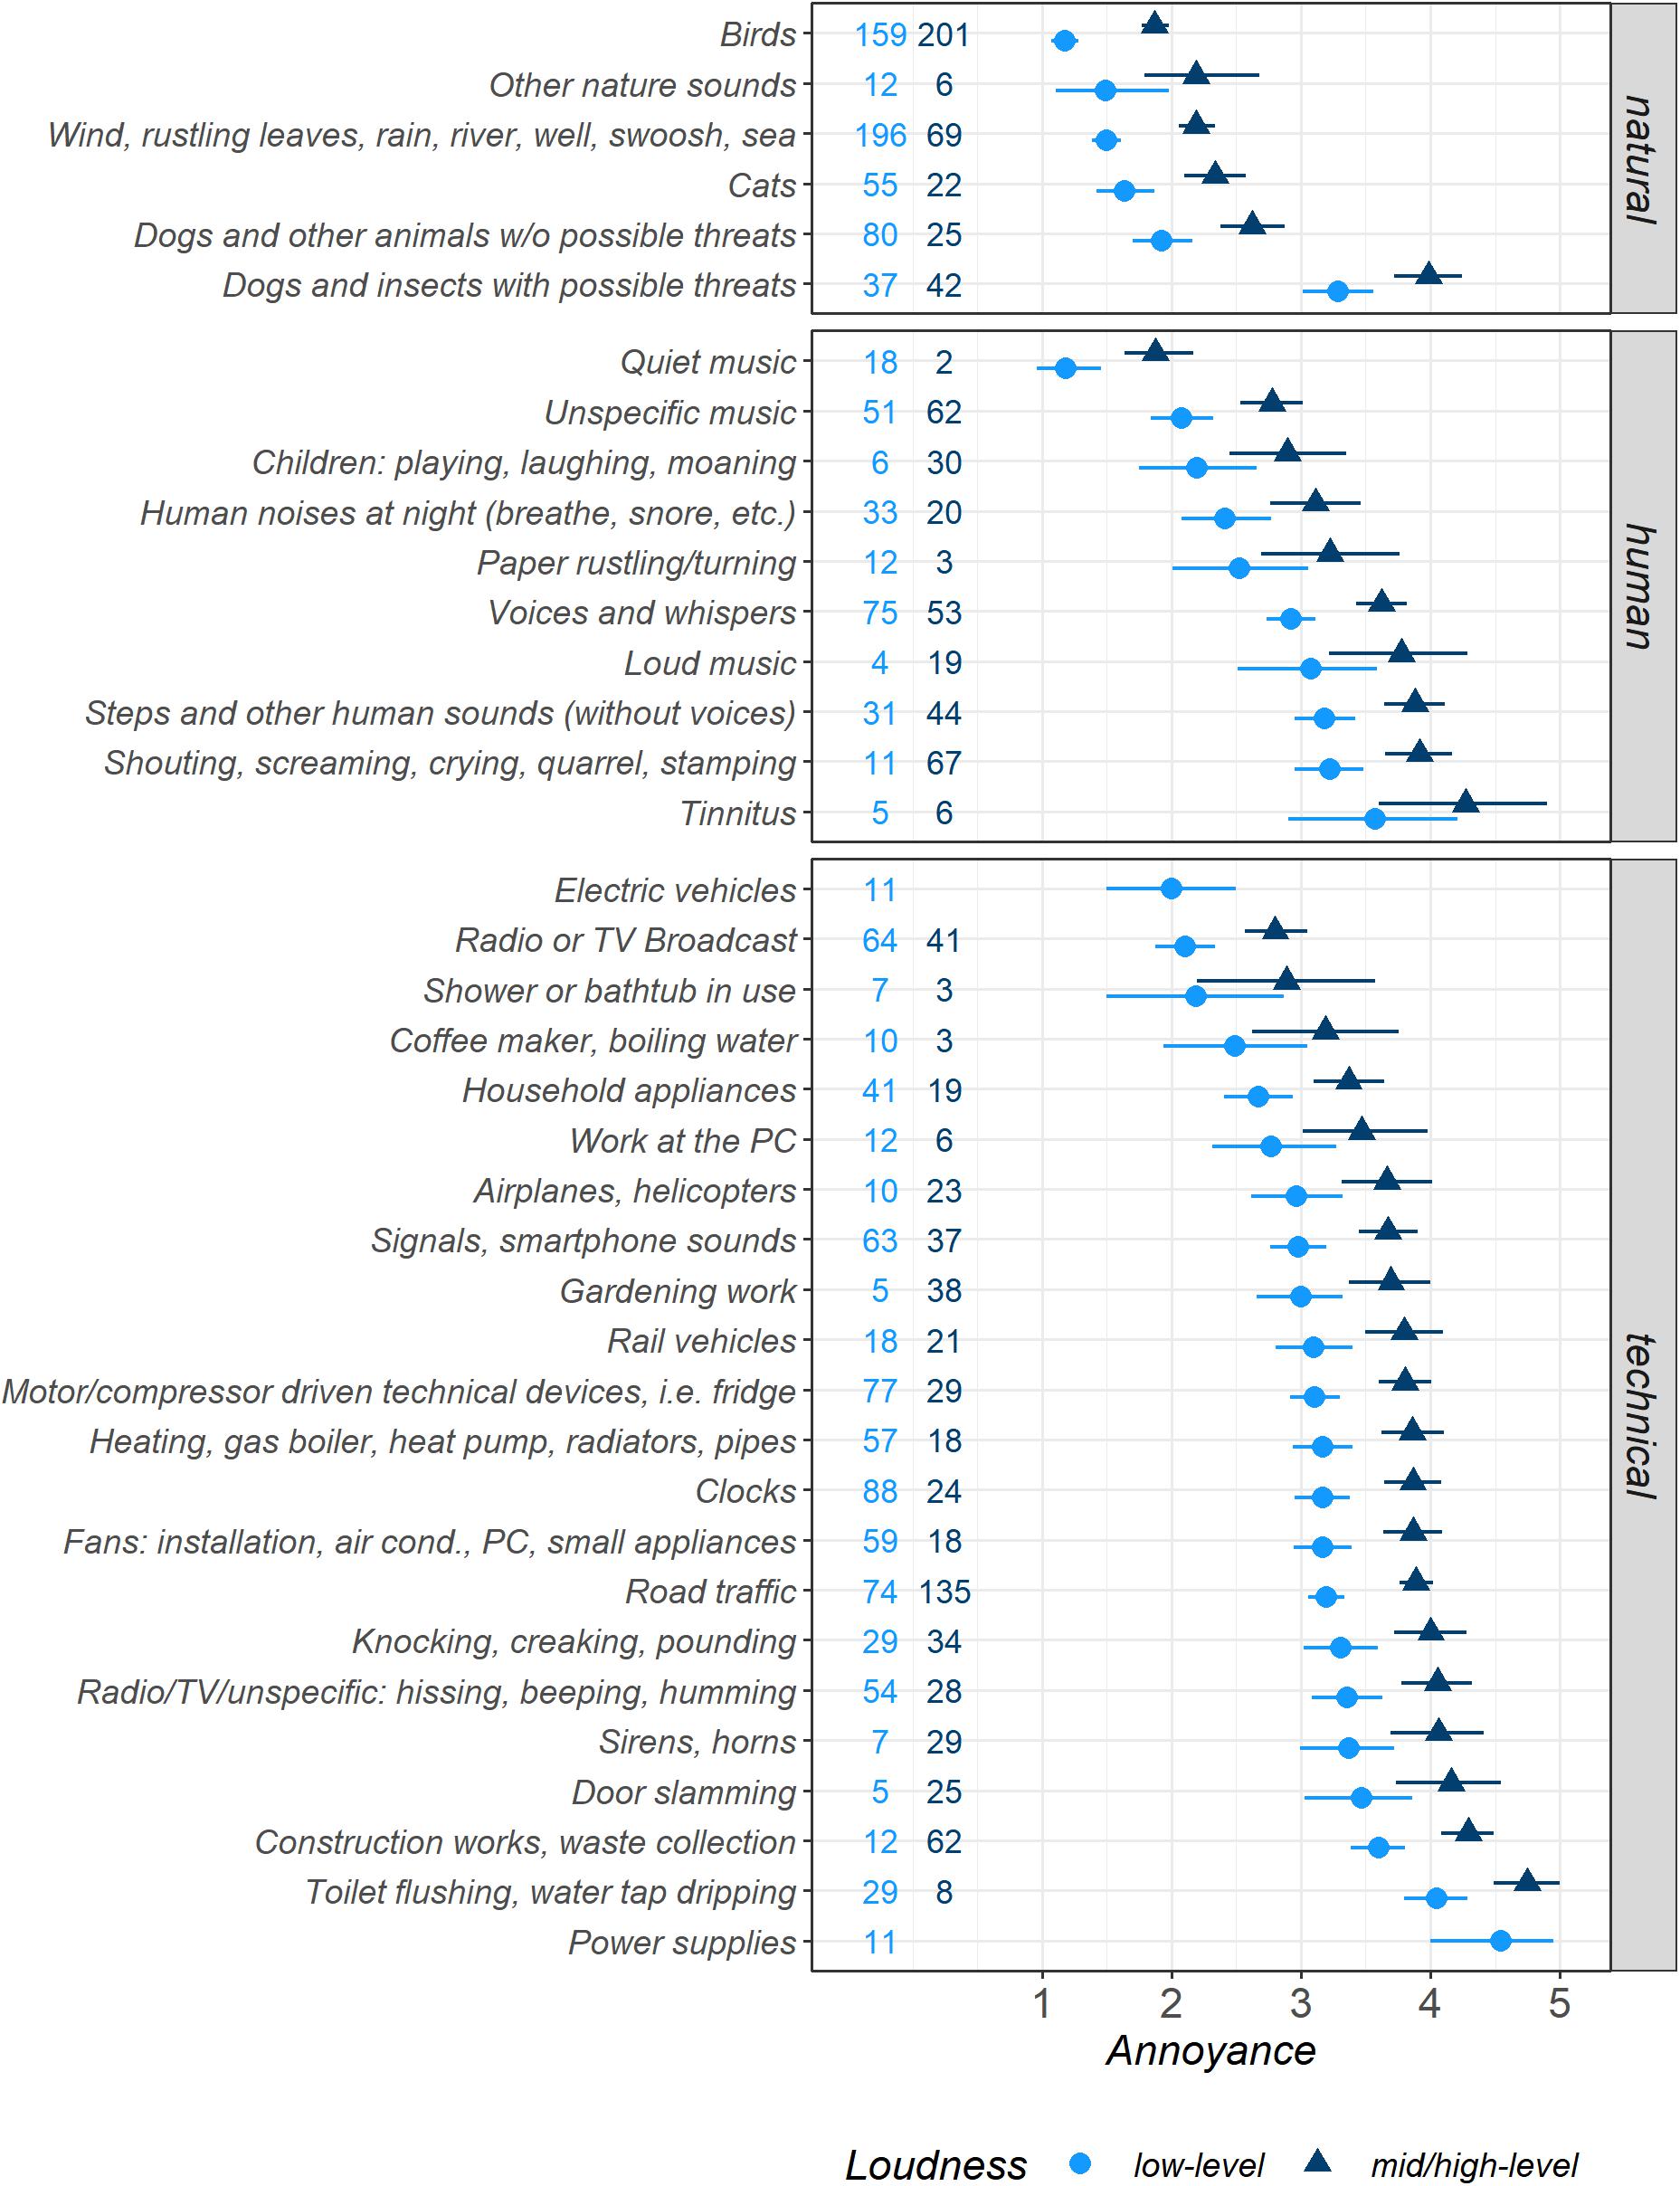
Figure 3. Estimated marginal means for Annoyance for sounds from 38 micro-level sound categories, separated by binary Loudness levels, displayed with 95% confidence intervals (both determined by bootstrapping) and the numbers of observations per category and Loudness level subsets. Very pleasant = 1, very annoying = 5. Model Micro2.
In addition to the Loudness-dependent results shown in Figure 3, we now discuss the Loudness-independent estimated marginal means (model Micro1). The reports comprised 360 sounds from Birds, which constituted the most pleasant natural category (i.e., that with the lowest Annoyance ratings), and overall the category with the highest number of reports (Annoyance M = 1.56, CI [1.47, 1.66]). With low Loudness values, 44% of these sounds were classified as low-level. By contrast, Dogs and insects with possible threats were the category of natural sounds that participants found most annoying on average (M = 3.66, CI [3.38, 3.93]; 47% low-level sounds). The remaining natural categories fell close together between the Birds value and the neutral/ambiguous Annoyance value 3. The second-highest occurrence was reports of noisy, non-tonal sounds like Wind, rustling leaves, rain, […], sea (M = 1.68, CI [1.56, 1.80]; 74% low-level), and Cats (M = 1.84, CI [1.69, 2.09]; 71% low-level), which they perceived as pleasant.
The human sound category Quiet music was the most pleasant of all micro-level sound categories, with 20 reports (M = 1.25, CI [1.05 1.50]; 90% low-level). The remaining human sound categories hovered around the neutral/ambiguous Annoyance value 3 between the second most common human category Unspecific music (M = 2.46, CI [2.21, 2.71]; 45% low-level; making music, radio play, movie) and the most annoying human category Tinnitus with 11 reports (M = 3.95, CI [3.21, 5.62]; 46% low-level). The category Human noises at night (M = 2.68, CI [2.29, 3.08]; 33% low-level) was followed by Voices and whispers with the highest number of human sounds (M = 3.21, CI [3.03, 3.40]; 59% low-level).
The most pleasant technical category consisted of 11 sounds from Electric vehicles (M = 2.00, CI [1.50, 2.50]; 100% low-level). For neutral/ambiguous Annoyance ratings (value 3), there were reports of Household appliances, such as washing machines and dishwashers (M = 2.89, CI [2.60, 3.20]; 68% low-level). Most other technical sound categories mainly fell above the Annoyance value 3, comprising 112 reports of Clocks (M = 3.32, CI [3.09, 3.54]; 77% low-level) and 106 sounds from motor- or compressor-driven fridges and freezers (M = 3.30, CI [3.10, 3.50]; 73% low-level). Road traffic was the most frequently mentioned technical category (M = 3.64, CI [3.50, 3.79]; 35% low-level).
Influence of Location
We evaluated the situation descriptions regarding the categorization of the Location in which participants experienced the sound (see Table 1 for the numbers of observations per Location) and established six categories: Garden/Nature; Home (indoors); Work/Office; Other (indoors), such as driving in a car or being in a cinema; Other (outdoors), including walking or riding a bike; and Undefined.
Figure 4 shows the marginal means for Annoyance separated by the binary Loudness levels for the six locations given above (model Location). Mid/high-level sounds were only rated as pleasant for the Location Garden/Nature (M = 2.33, CI [2.20, 2.47]). In contrast, mid/high-level sounds in all other locations were, on average, reported as neutral or slightly annoying (Home (indoors): M = 3.48, CI [3.38, 3.57]; Work/Office: M = 3.64, CI [3.42, 3.86]; Other (indoors): M = 3.38, CI [3.20, 3.56]; Other (outdoors): M = 3.12, CI [2.83, 3.42]; and Undefined: M = 3.46, CI [3.30, 3.62]). Unsurprisingly, the average estimated Annoyance means for low-level sounds from all locations showed less Annoyance and were rated from neutral (Work/Office: M = 2.85, CI [2.64, 3.06]; Other (indoors): M = 2.59; CI [2.41, 2.76]; Home (indoors): M = 2.68, CI [2.60, 2.76]; Undefined: M = 2.67, CI [2.51, 2.83]) to pleasant (Other (outdoors): M = 2.33, CI [2.04, 2.62]), with Garden/Nature having the most pleasant ratings on average by far (M = 1.54, CI [1.42, 1.65]). The indoor locations and the Undefined category showed similar patterns.
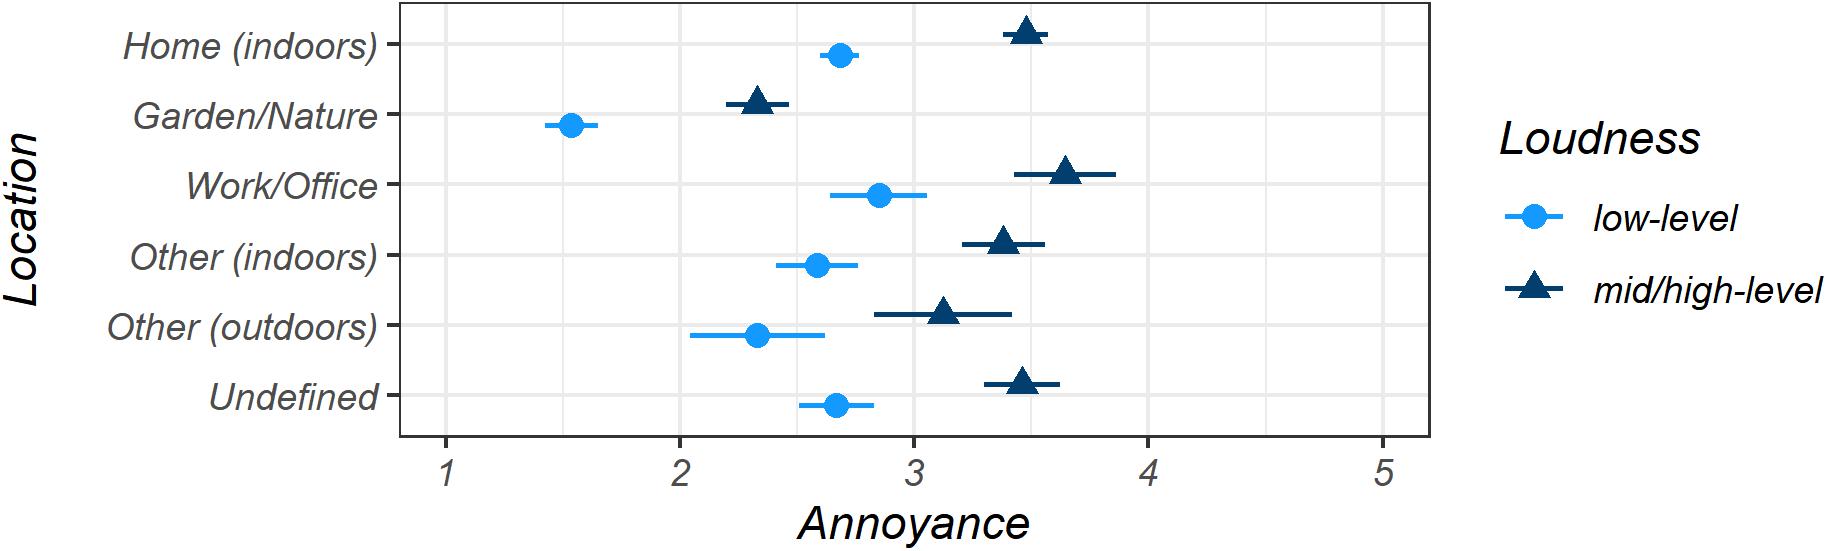
Figure 4. Estimated marginal means for Annoyance for all Location categories, separated by binary Loudness levels, displayed with 95% confidence intervals, both determined by bootstrapping. Very pleasant = 1, very annoying = 5. Model Location.
Most of the estimated Annoyance means for all Loudness levels together (not displayed in Figure 4 for better readability) were rated as neutral or ambiguous (Other (outdoors): M = 2.61, CI [2.13, 3.20]; Home (indoors): M = 3.04, CI [2.96, 3.12; Work/Office: M = 3.15, CI [2.94, 3.36]; Other (indoors): M = 2.92, CI [2.75, 3.08]); Undefined: M = 3.15, CI [2.98, 3.31]) except for sounds from Garden/Nature, which had the only pleasant mean value (M = 1.87, CI [1.76, 1.99]).
Living Environment
Of all participants, 63.6% stated that they lived in a calm or very calm area. They reported 63.3% of all assessed sound situations and 64.4% of all low-level sounds, as depicted in Table 3. The bootstrapped estimated marginal means of all subsets differed significantly regarding both Loudness and Liveliness levels, as indicated by their CIs (model Liveliness).
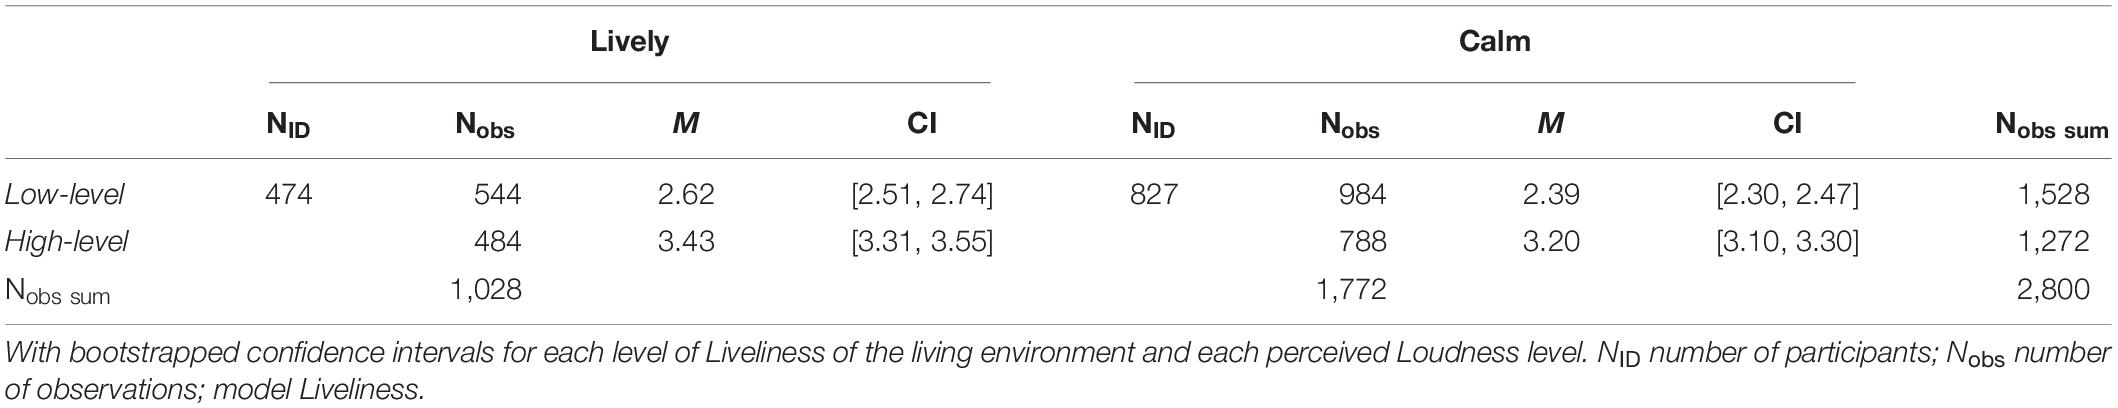
Table 3. Frequencies of observations and estimated marginal means for Annoyance judgments, differentiated by the Liveliness of the living environment.
Single-Fixed-Factor Models
In this section, we present the results of several linear mixed-effects models, each including only one fixed factor, to investigate the effect sizes and directions of the single bivariate relationships related to perceived Annoyance of low-level sounds (see Table 4, model 32SFF). Figure 5 (model 32SFFA) depicts the R2m and probability values for all variables assessed (except for the soundscape dimensions, which were correlated with our target variable Annoyance and thus would lead to tautological findings). Among the crucial variables that explained a substantial amount of variance (own criterion of R2m ≥ 0.05) were eight situational factors (the affective Valence, Arousal, Control, the Positivity and Negativity DIAMONDS dimensions, the Specific Fade-out ability, the Location, and Active Coping reaction) and three sound-related factors (macro-level and micro-level sound category as well as Loudness) but no person-related factor. These relevant variables will be examined in more detail in the following sections.
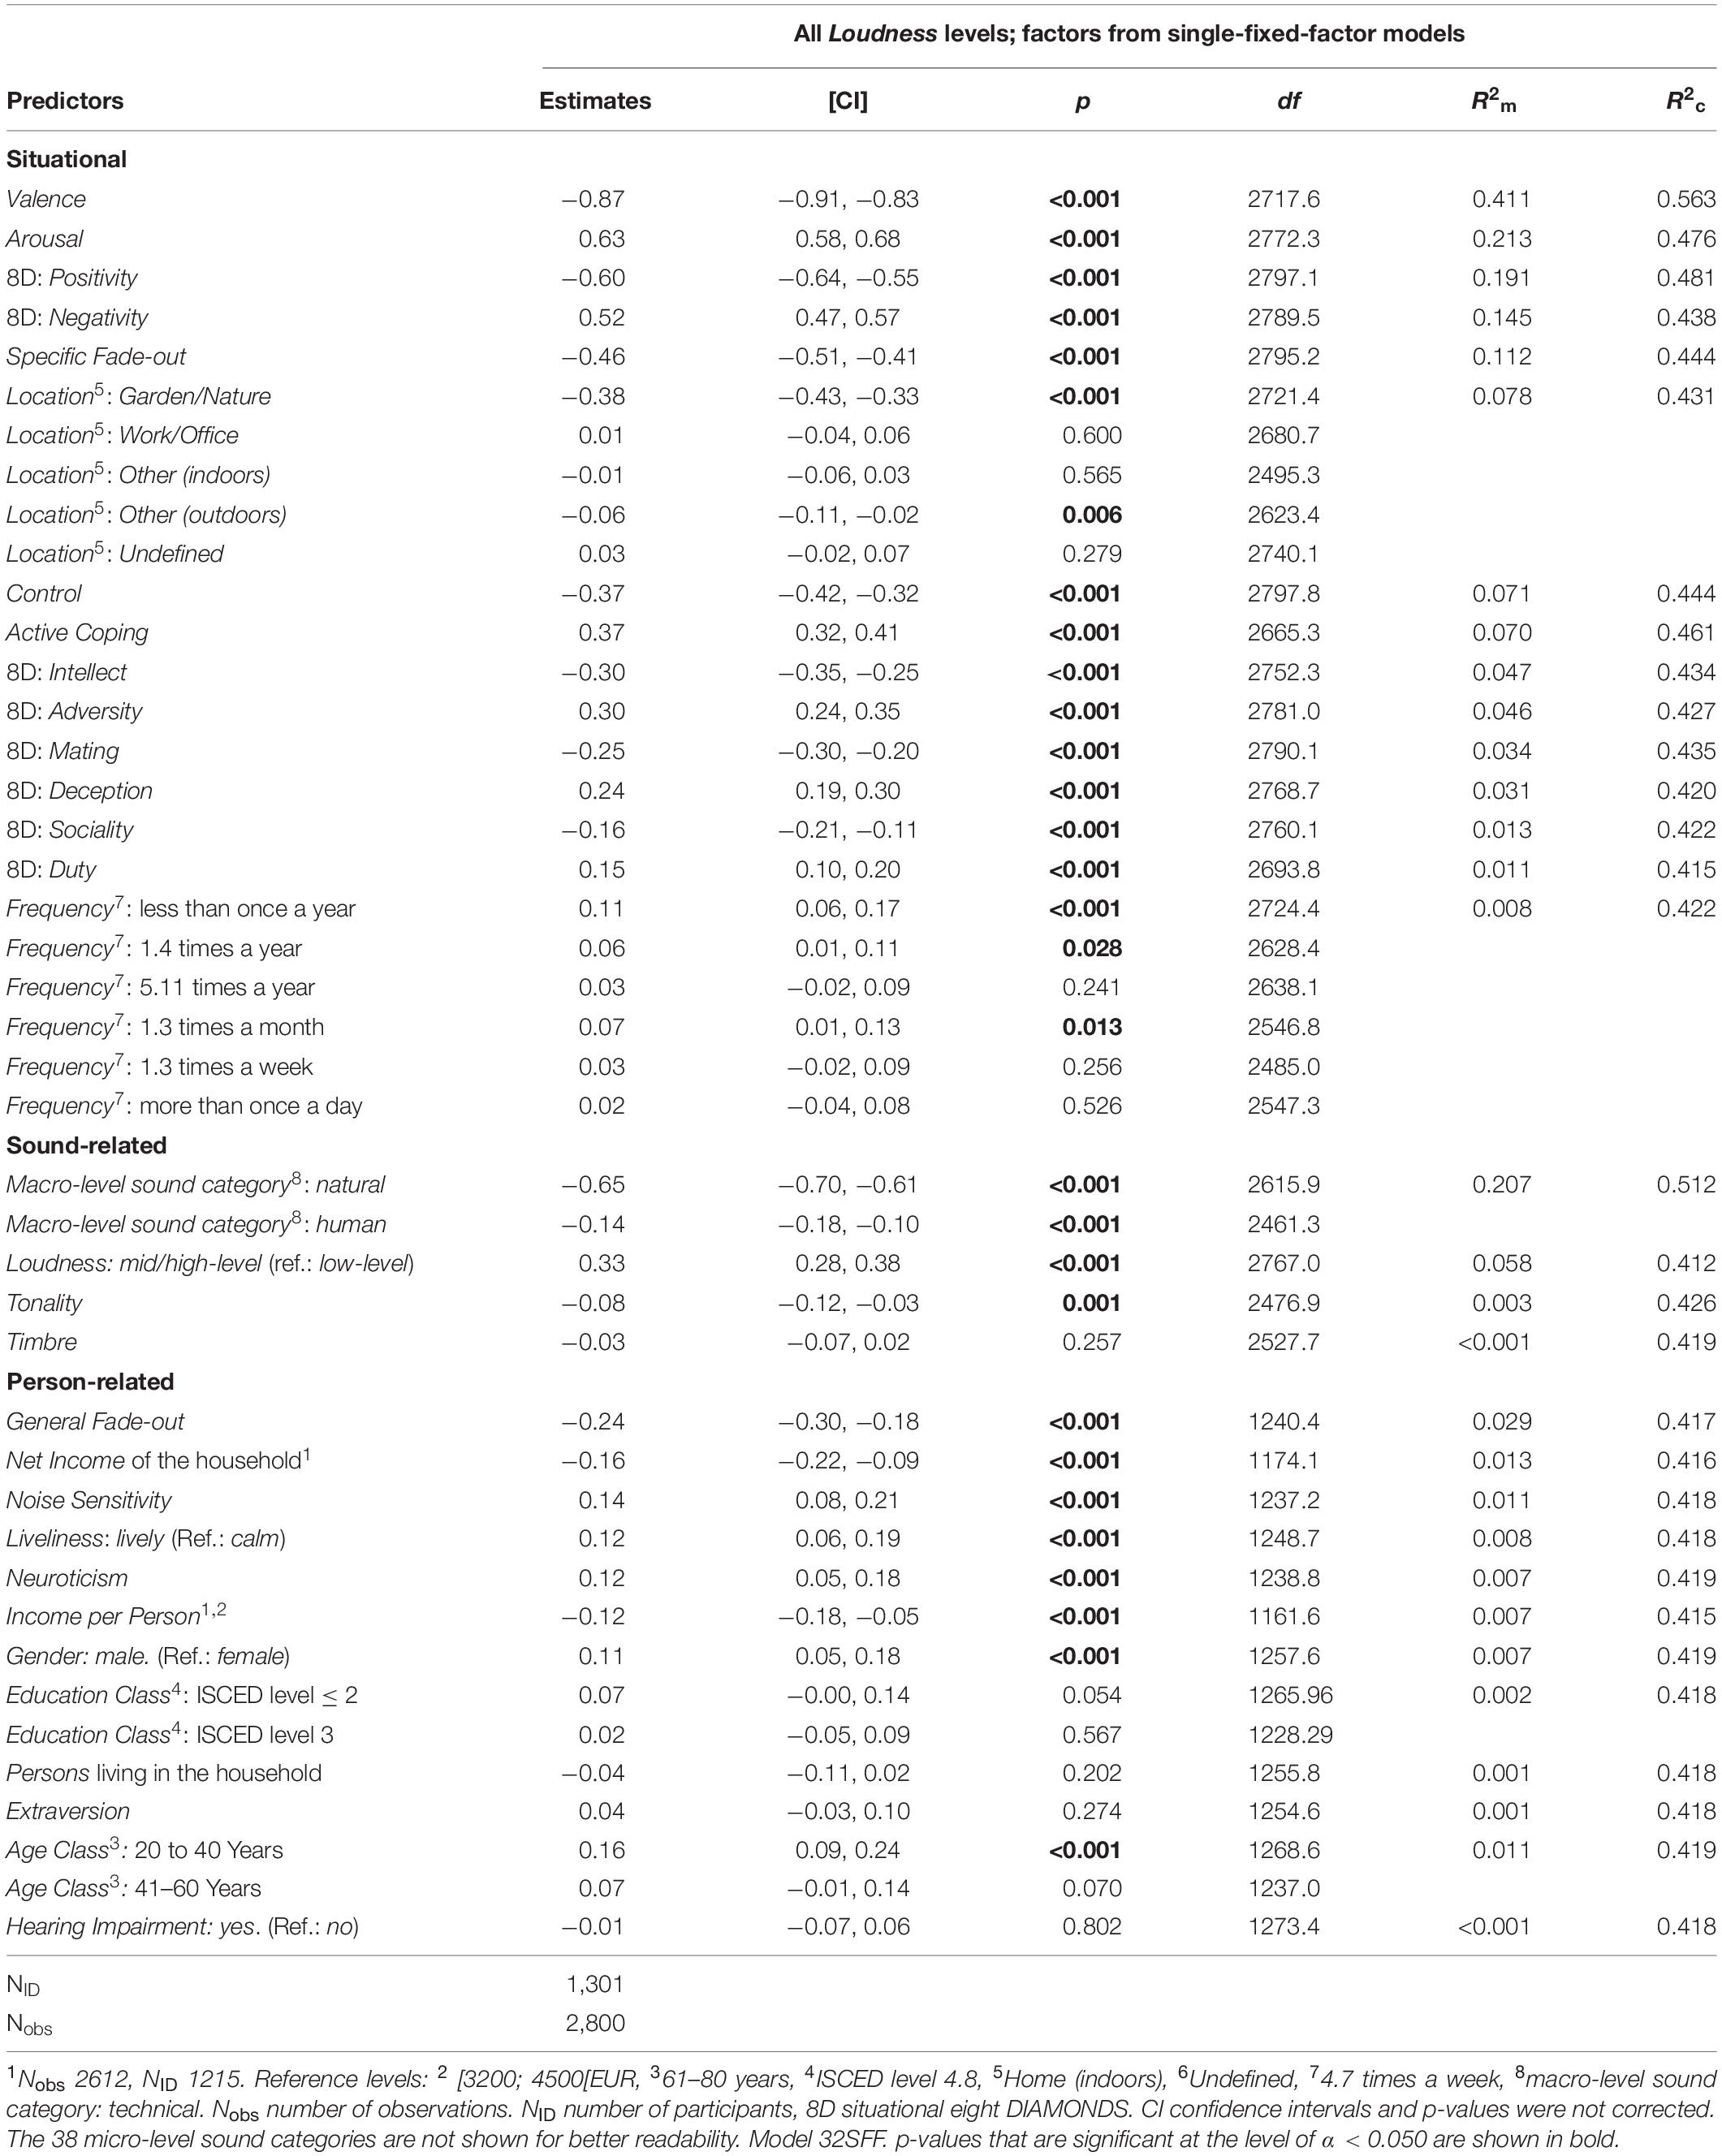
Table 4. Annoyance estimates of bivariate single-fixed-factor models including dummy variables of each factor.
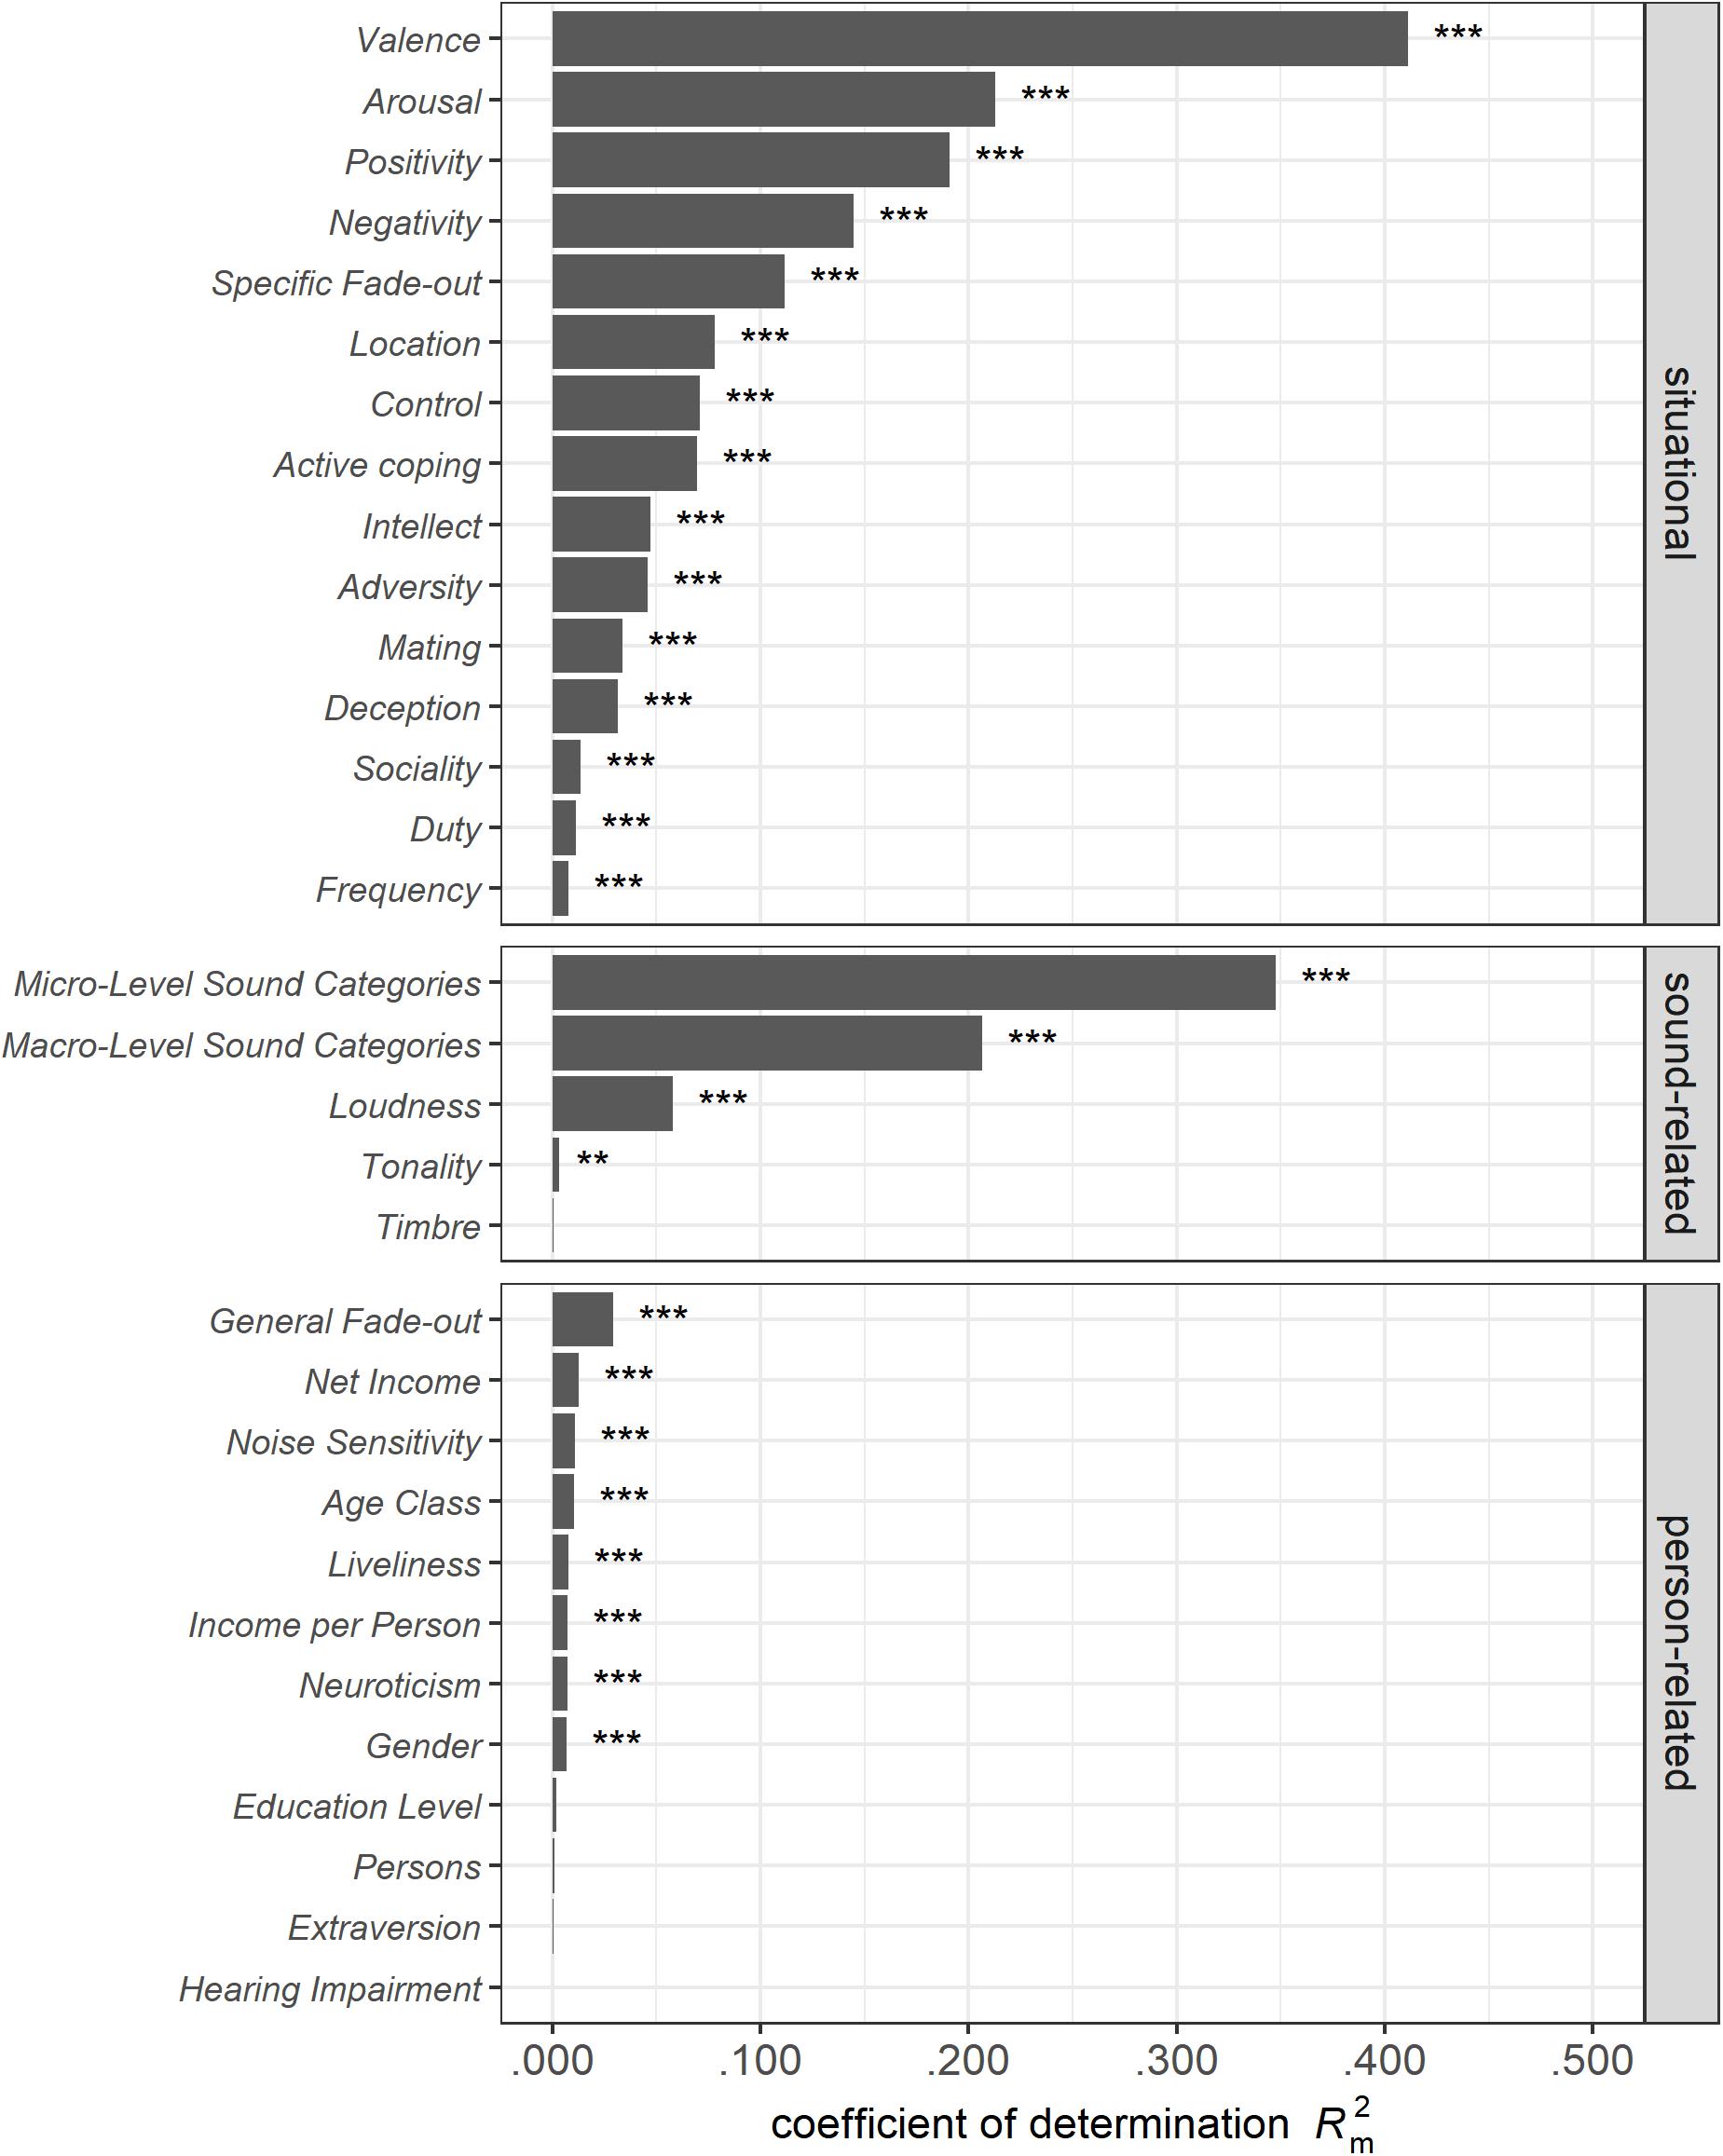
Figure 5. R2m and probabilities for the assessed variables determined by bivariate analyses of the single-fixed-factor models. Probabilities are given as ∗∗∗p < 0.001; ∗∗p < 0.010; ∗p < 0.050. Model 32SFFA.
Role of Situational Factors
Of the situational variables, Valence explained the most variance in the Annoyance evaluations (β = −0.87; R2m = 0.411), followed by Arousal, which had a lower but still substantial explanation of variance (β = 0.63; R2m = 0.213). While positive Valence was associated with higher pleasantness (less Annoyance), high Arousal was related to higher Annoyance judgments. Among the situational DIAMONDS dimensions, Positivity (β = −0.60; R2m = 0.191) and Negativity (β = 0.52; R2m = 0.145) revealed the most substantial associations with Annoyance. The Specific Fade-out ability (β = −0.46; R2m = 0.112) was followed by several minor effects: Concerning the Location (R2m = 0.078) variable, being in the garden or nature (β = −0.38) instead of staying at home (reference level) was associated with more pleasant sounds. Active Coping reactions (β = 0.37; R2m = 0.070) and perceived Control (β = −0.37; R2m = 0.071) showed similar variance explanations and similar effects but in opposite directions: More Active Coping was associated with greater Annoyance, while higher levels of perceived Control were linked to less annoying sound evaluations. The other situation dimensions, in contrast, revealed R2m values below 0.050.
Role of Sound-Related Factors
Among sound-related variables, both the three macro-level (R2m = 0.207) and 38 micro-level sound categories (R2m = 0.330) explained a substantial amount of variance in the Annoyance ratings. Both natural (β = −0.65) and human (β = −0.14) macro-level sound categories had more pleasant sound evaluations compared to the technical category. They were followed by perceived Loudness (β = 0.33; R2m = 0.058). Whereas the sound characteristic Tonality was significant (β = −0.08; R2m = 0.003; p = 0.001), Timbre was not (β = −0.03; R2m < 0.001; p = 0.257). However, both variables showed a negligible effect size (|β| ≤ 0.08; R2m ≤ 0.003).
Role of Person-Related Factors
The General Fade-out ability showed the highest, albeit still quite small, variance explanation (R2m = 0.029) and was negatively associated with Annoyance judgments (β = −0.24). The Net Income of the household as well as the Income per Person revealed very little variance explanation but similar negative effects, suggesting that higher income was associated with more pleasant sound situations. By contrast, the personality traits Noise Sensitivity (β = 0.14) and Neuroticism (β = 0.12) were significant positive predictors of Annoyance judgments but showed minimal R2m values below 0.010. Moreover, Extraversion (β = 0.04) did not show a significant effect at all (p = 0.274; R2m = 0.001). All other demographic variables and the Liveliness of the living environment showed minimal R2m values (<0.010) and/or were insignificant. For Liveliness (β = 0.12), a more lively living environment was associated with higher Annoyance in sound evaluation. A model for the interaction effect of Age Class and Education Class on our measured data (model Age∗Edu, Table 5) confirmed the findings of Miedema and Vos (1999) with these significant influences on annoyance: Younger people (20–40 years) reported less annoying sound situations (β = −0.26) than older people (61–80 years; reference dummy level). Participants with no or up to a lower secondary–level education were slightly less annoyed (β = −0.12) than people with a university-level education (reference dummy level). Finally, only one of the four interactions was significant, showing that young people with an upper secondary–level education experience less annoying sound situations than older people with a university-level education (β = −0.22).
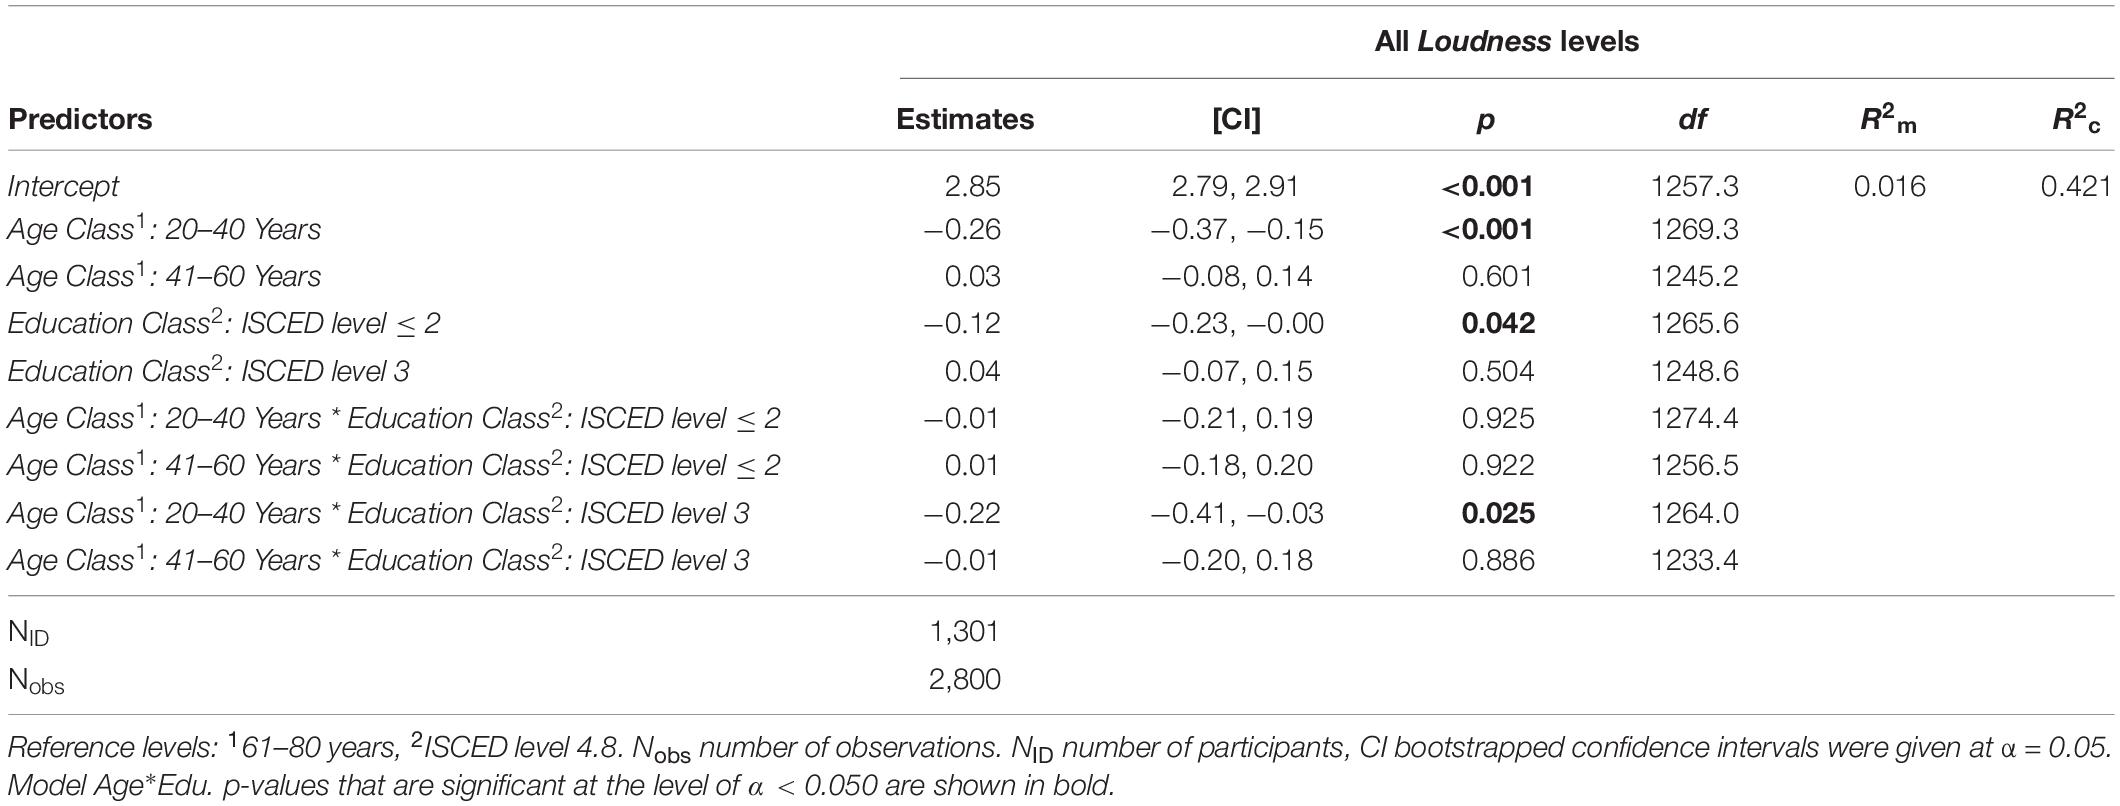
Table 5. Annoyance estimates of the Age Class and Education Class interaction effect model including all dummy variables of each factor.
Comprehensive Models
In this section, we present the comprehensive model CML1 predicting Annoyance ratings derived from the Lasso regression method for variable selection. Some variables had not been processed due to missing values (Net Income and Income per Person)—which were not allowed for the regularization method—or having too many factor levels (Micro Sound Categories). The minimum cross-validation error (CV = 0.81) was reached at a tuning parameter value of λ opt = 96.0 (see dashed line in Figure 1). This optimal compromise between a model in which all our variables were retained as contributors and a model without any fixed factors left over (at a λ max = 2,256) incorporated the most important variables shown in Table 6. This prediction model explained over half of the variance of the Annoyance evaluations (R2m = 0.570).
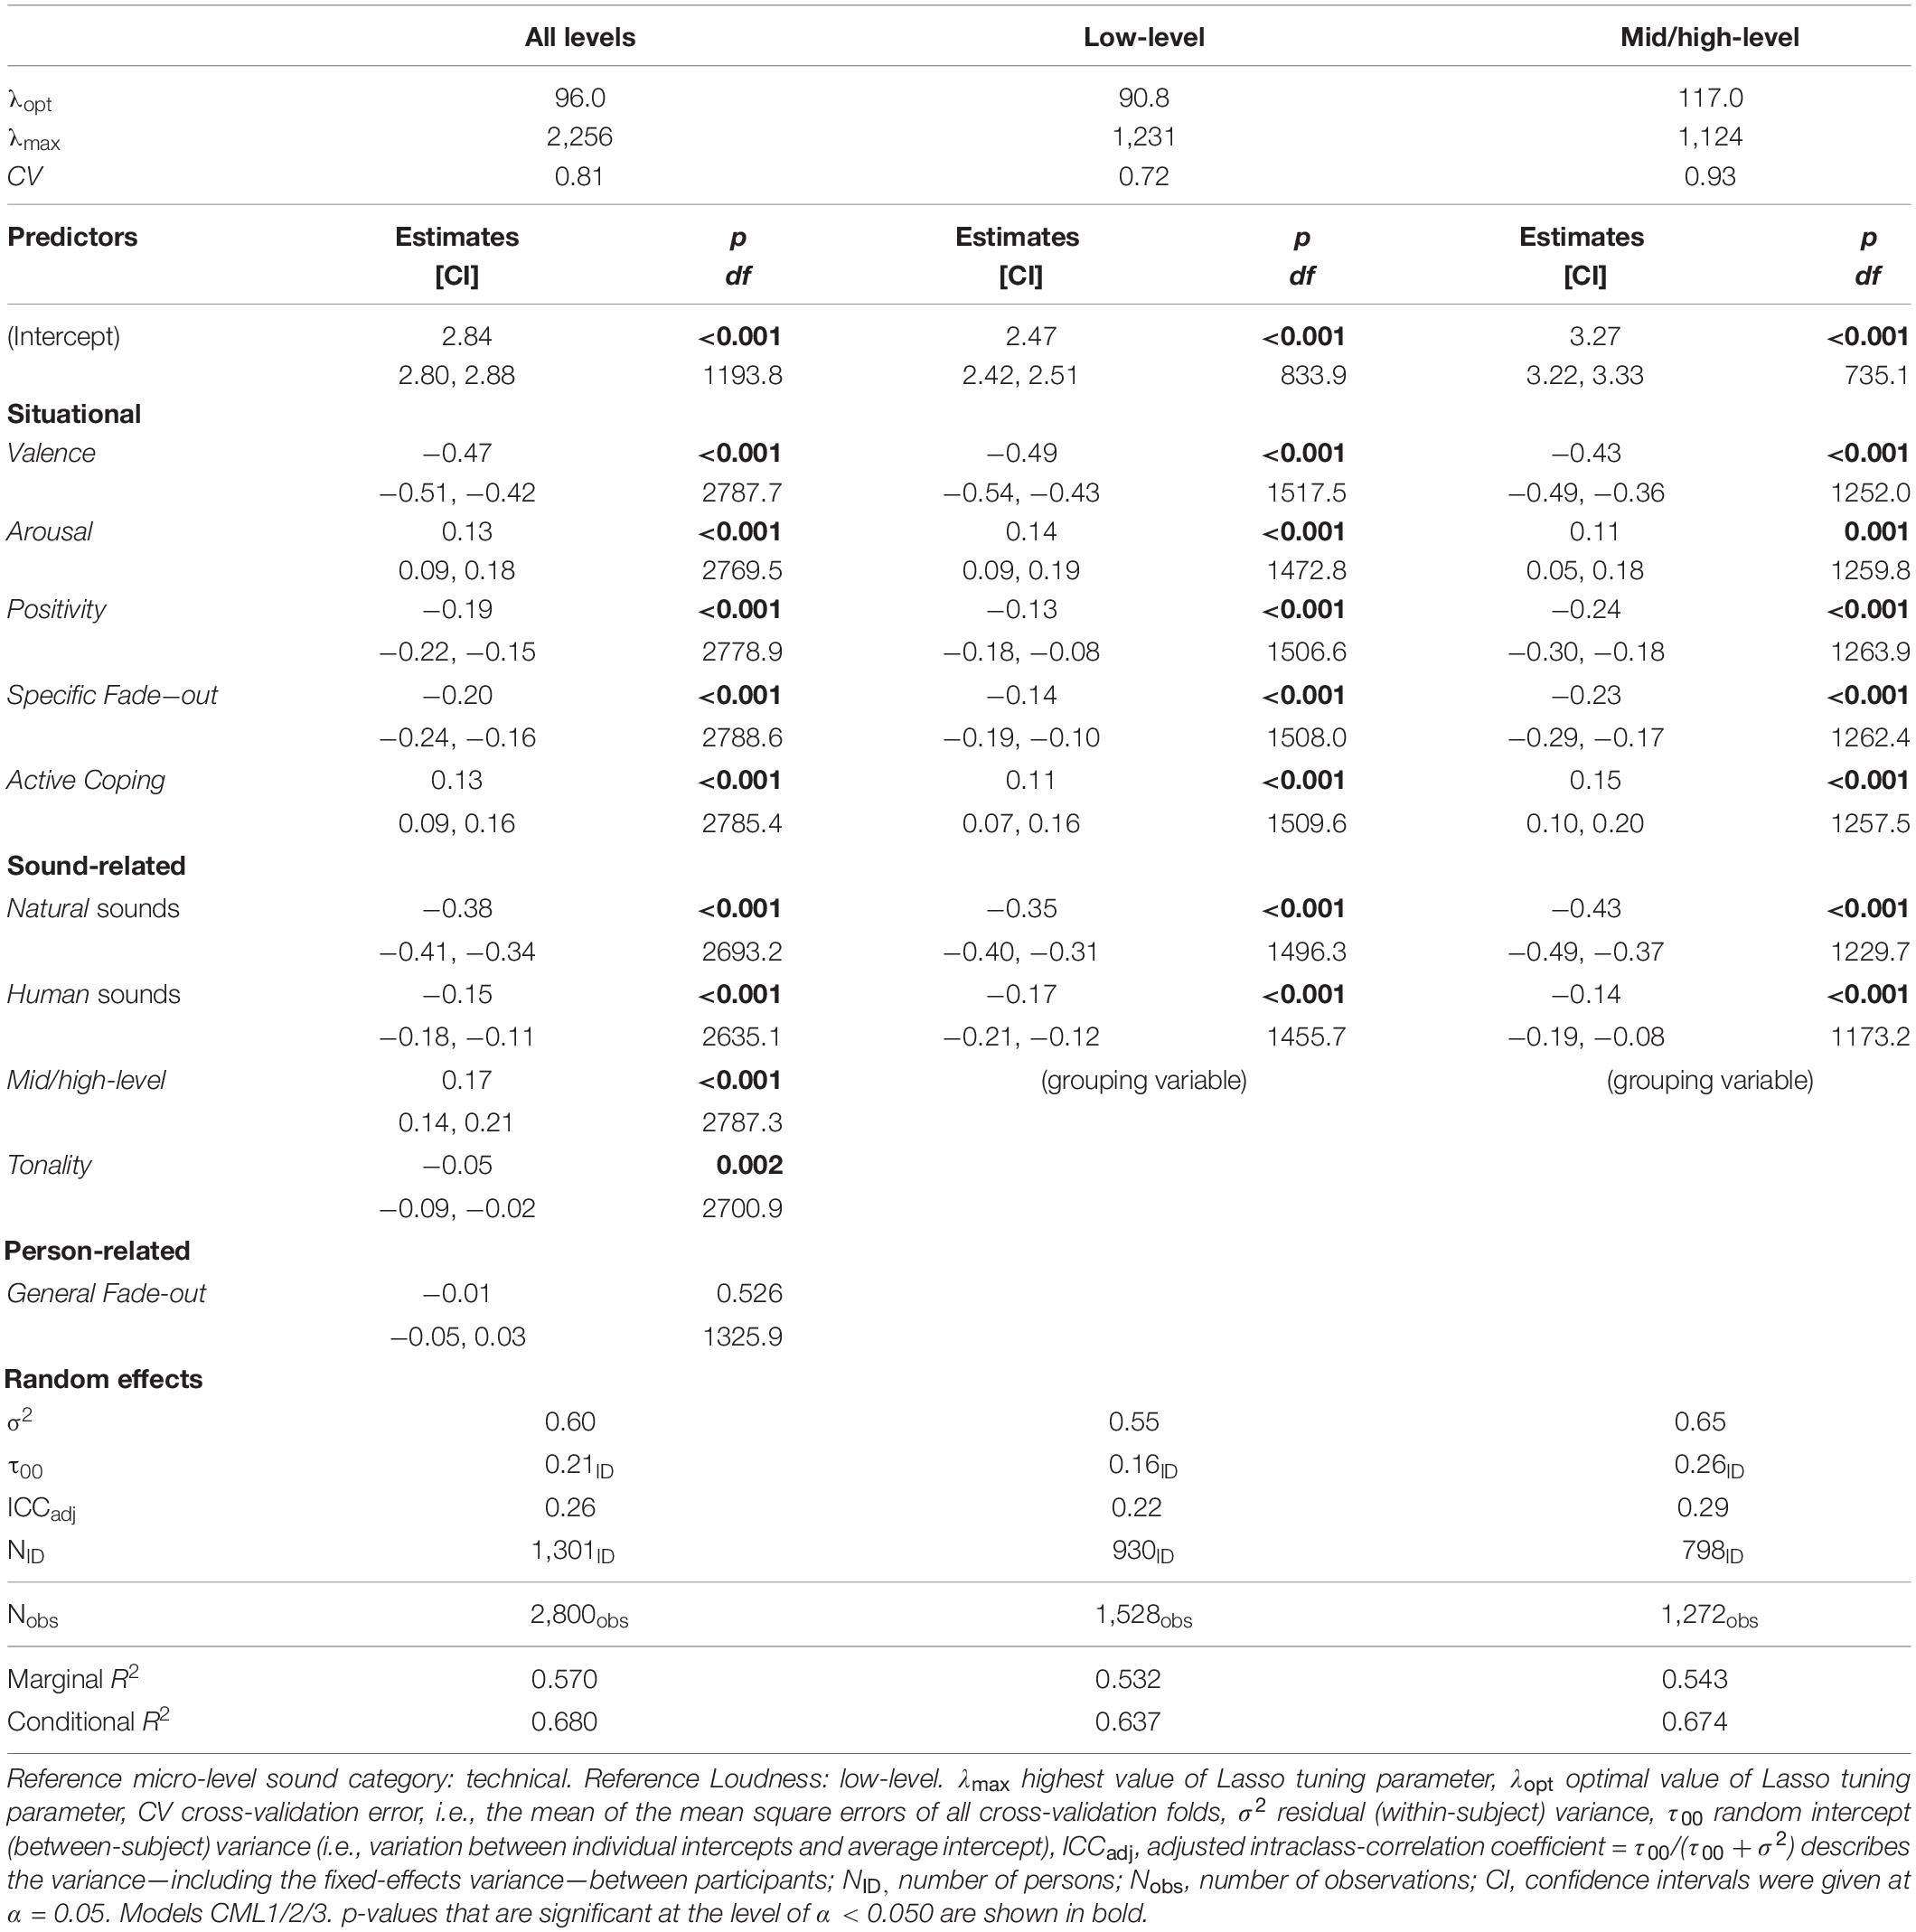
Table 6. Estimations of Lasso-selected parameters for the full dataset and two Loudness subsets.
The most crucial fixed factor was the affect Valence (β = −0.47, CI [−0.51, −0.42]) followed by the natural sound category (β = −0.38, CI [−0.41, −0.34]) and the Specific Fade-out ability (β = −0.20, CI [−0.24, −0.16]). The situational variable Positivity (β = −0.19, CI [−0.22, −0.15]) was included in the model, whereas Negativity was excluded. Lower Annoyance ratings were therefore related to higher (more positive) Valence scores, natural sounds as opposed to technical ones, and the stronger ability of respondents to fade out sounds. In contrast to the aforementioned negative effects, the fifth most important variable was the positive effect mid/high-level Loudness (β = 0.17, CI [0.14, 0.21]), followed by the positive effects Active Coping (β = 0.13, CI [0.09, 0.16]) and Arousal (β = 0.13, CI [0.09, 0.18]). That is, higher Annoyance values were related to higher Loudness, higher Arousal, and higher Active Coping scores. The sound characteristic Tonality had the smallest significant effect (β = −0.05, CI [−0.09, −0.02]). Finally, the General Fade-out capability (β = −0.01, CI [−0.05, 0.03]) was included as the only variable with a non-significant p-value (p = 0.526), whereas all other effects had highly significant p-values (p < 0.010).
Concerning the random effect ID, the residual (within-subject) variance σ2 = 0.60 and the random intercept (between-subject) variance τ00 = 0.21 were observed. The quite high within-subject variance of the Annoyance ratings may be due to high variation in the characteristics of the sounds and situations reported by participants. This variation is slightly smaller for the subset of sounds reported as low-level (σ2 = 0.55). An interpretation of this might be that the low-level sounds reported by participants were generally less annoying, whereas mid/high-level sounds (σ2 = 0.65) can be very annoying or even very pleasant—for example, imagine playing your favorite music or the Bird sounds that were reported as being mid/high-level. This can be seen in Figure 2, which shows the distribution for the two sound level subsets (additionally separated by macro-level sound category, model Macro2). A similar relationship between the sound level subsets can be observed for the between-subject variation τ00 of the random effect. These values were 0.3–0.4 times the within-subject variances. Unsurprisingly, the relationship between the sound level subsets mentioned above can also be found in the standard deviations of the raw data (SDall = 1.39; SDlow–level = 1.24; SDmid/high–level = 1.42; see also the distributions of the reported raw-data in Figure 2). Finally, an adjusted (i.e., conditional) intraclass-correlation coefficient for the full dataset—ICCadj = τ00/(τ00 + σ2) = 0.26—described the proportion of explained variance to total variance (including the fixed effects) due to differences between participants which were represented by the random effect ID. From a critical perspective, all of the above differences in variances and their interpretation may be strongly influenced by the huge variety in the sounds reported by participants due to the fact that each participant reported individual sounds, as no audio was played back and no grouped listening (as in sound walks) was performed.
In addition to the aforementioned model computed over the full dataset, we derived two further models using the Lasso regression method for the subsets of low-level (model CML2) versus mid/high-level (model CML3) observations. This was done to investigate whether evaluations of both low- and mid/high-level sounds would follow similar patterns. Both models showed similar but slightly smaller marginal R2-values (R2m_low–level = 0.532; R2m_mid/high–level = 0.543) compared to the overall model. The Loudness variable was no longer included in the sub-models, presumably because it served as the grouping variable. The two variables Tonality and General Fade-out were also excluded by the Lasso regression at the optimal tuning parameters (low-level: λ opt = 90.8, λ max = 1,231; mid/high-level: λopt = 117.0, λ max = 1,124). Compared to the overall model, the model for the low-level subset showed a slightly smaller cross-validation error (CV = 0.72). In contrast, the error of the mid/high-level model was slightly higher (CV = 0.93). When comparing the predictor estimates of the two models based on their CIs, no significant differences were observed, and both showed the same selected variables.
A model (CMSFF1) containing all variables that were significant in the bivariate analyses (subsections of section “Design and Questionnaire” and Figure 5) and showed an R2m ≥ 0.050 is shown in Table 7. The variables selected in this way confirmed the variable selection by the Lasso regularization method. The variable Control, which was meaningful in the bivariate analysis (β = −0.37; R2m = 0.071; p < 0.001), became unimportant in the comprehensive model (β = 0.00; p = 0.910). Some Location levels were inconsistently significant within each Loudness subset as well as between subsets. Although the Lasso variable selection method—in a misleading manner—selected General Fade-out, which was not significant, no person-related variable we assessed achieved an R2m of 0.050 in the single-fixed-factor models, and such variables were therefore excluded in this comprehensive linear model.
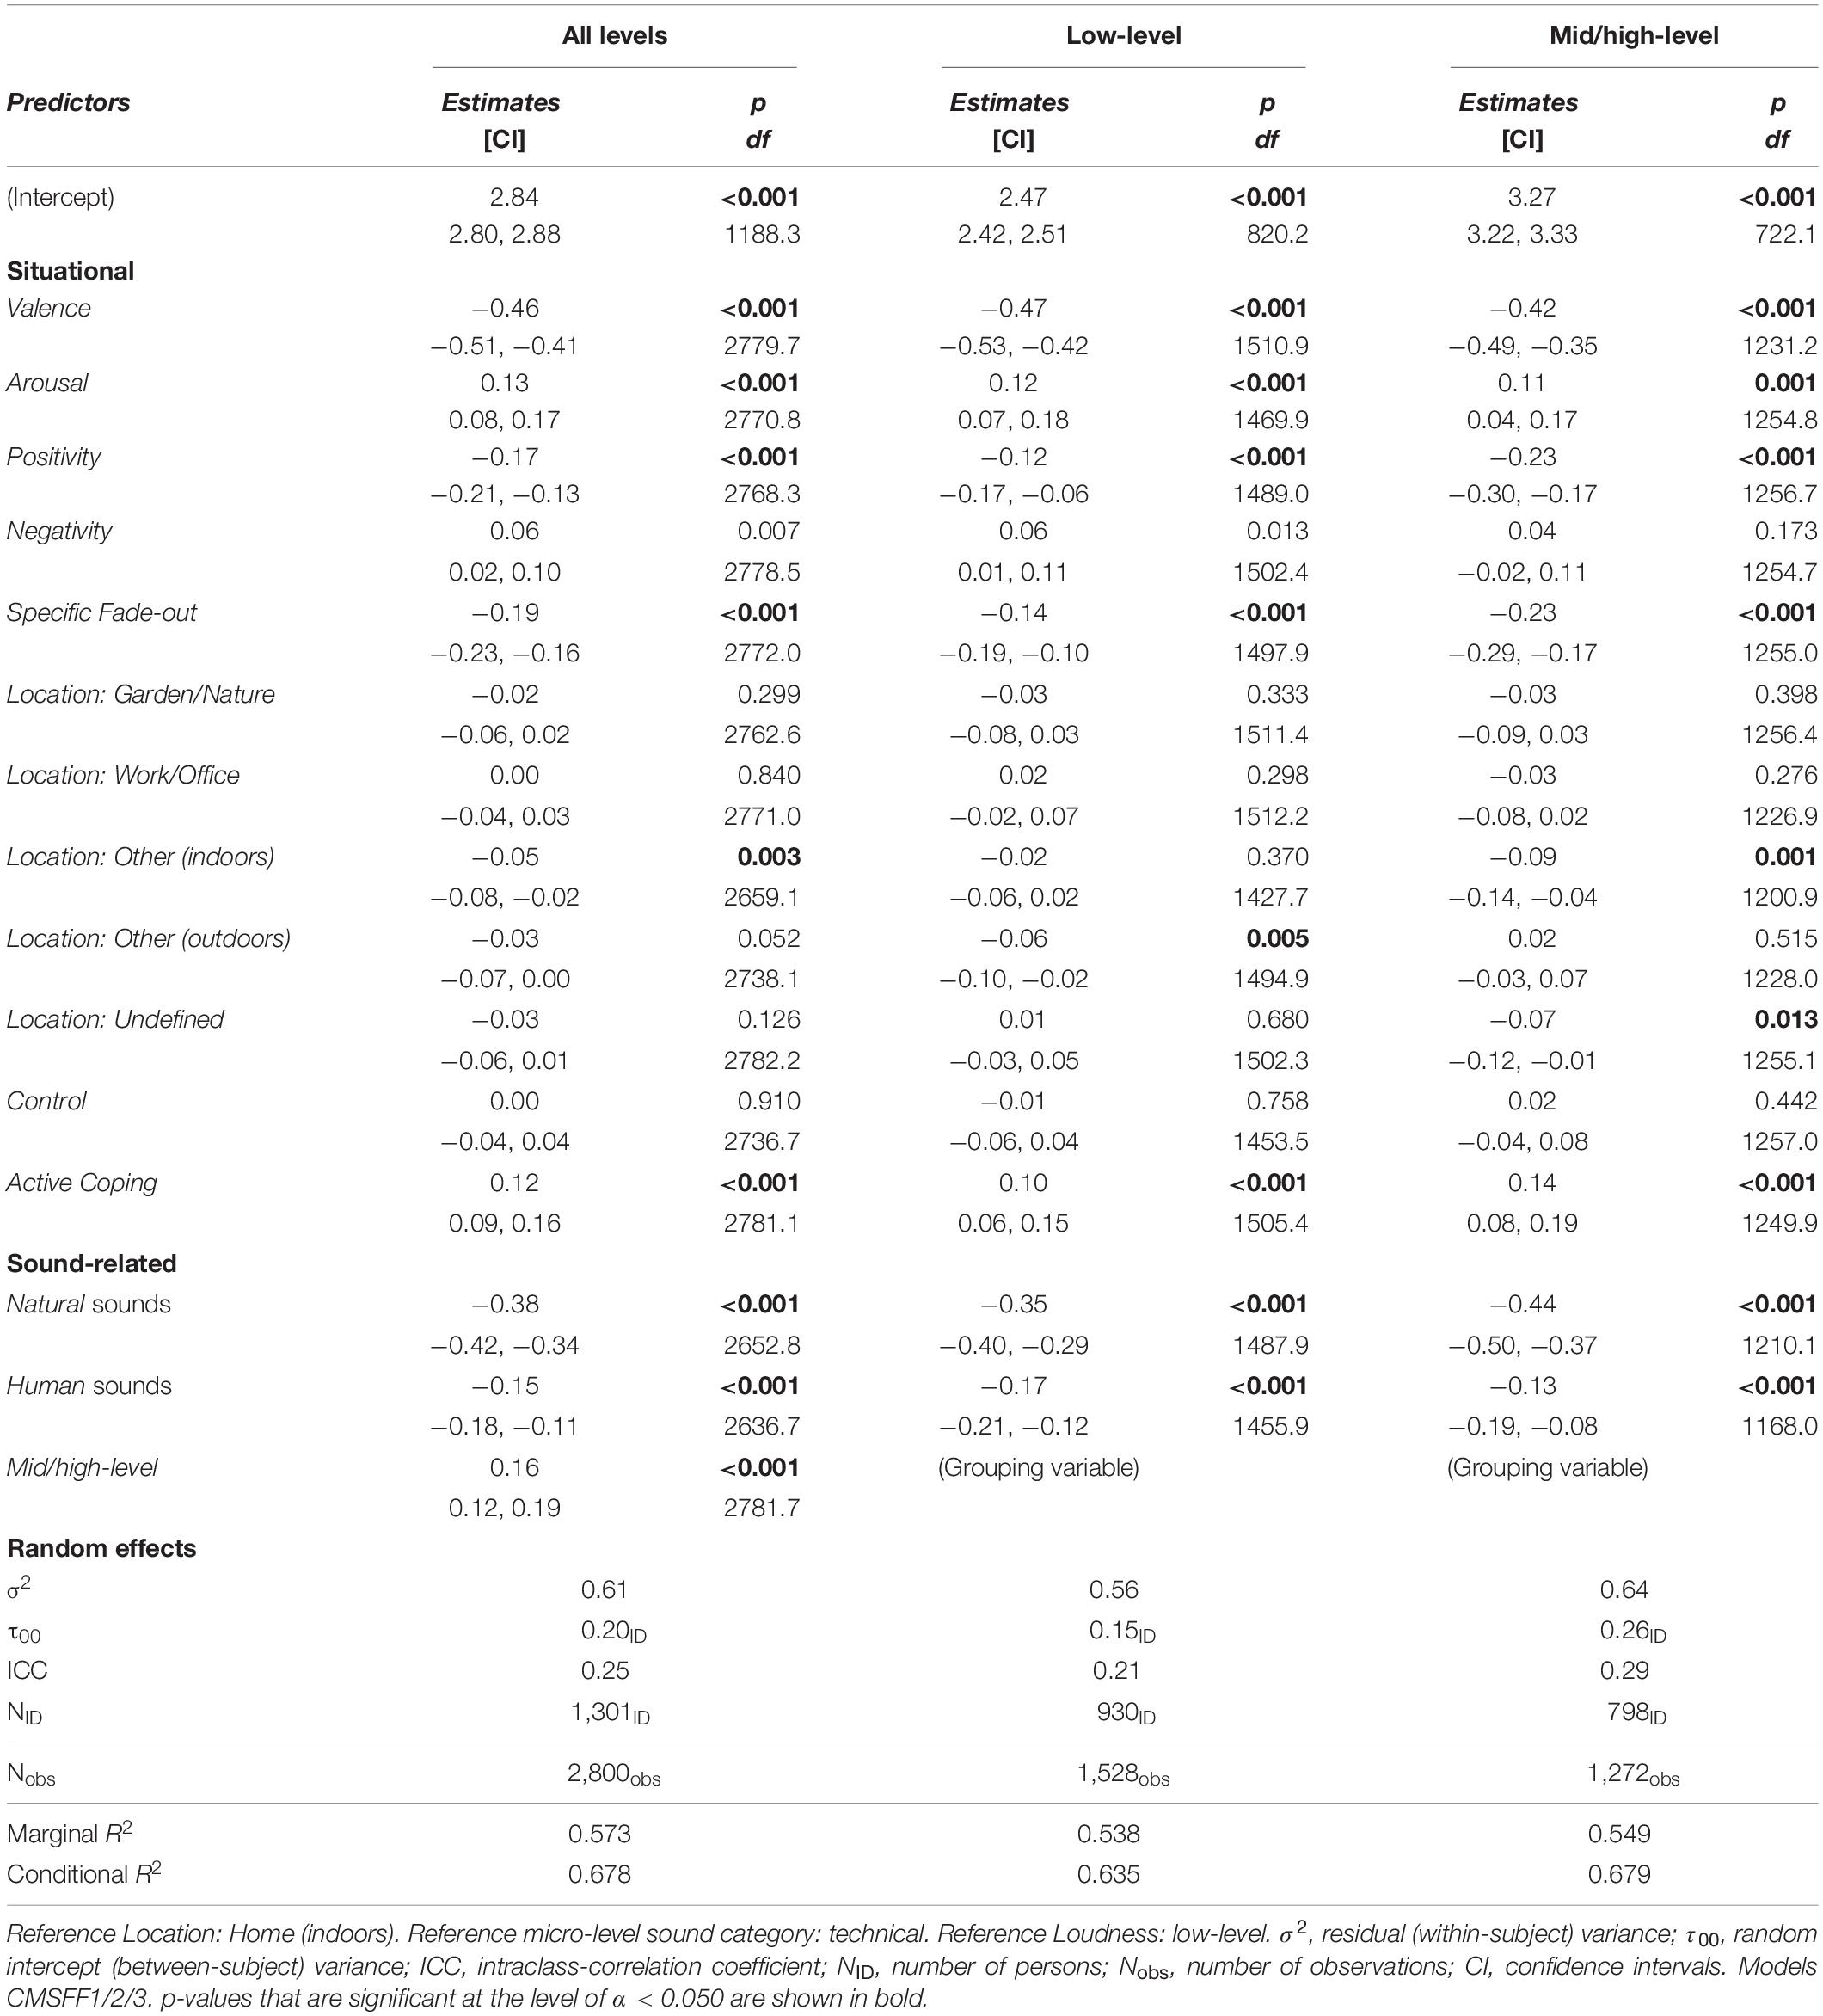
Table 7. Comprehensive model of all parameters from the bivariate analyses that reached an R2m ≥ 0.050, respectively; with the full dataset and two Loudness subsets.
Discussion
Summary
In this online study, we investigated the human perception of low-level environmental sounds and the influencing effects of sound-related, situational, and person-related factors. Moreover, we investigated whether variable-selection methods from linear machine-learning algorithms can aid noise effects and soundscape research by creating comprehensive models which can reliably predict and explain a considerable amount of variance in unseen data which was not used in the training when the model was built.
The results of our study corroborate previous findings suggesting that sound evaluations are dependent on myriad influencing factors, in particular situational factors (Fields, 1993; Wolsink et al., 1993; Stallen, 1999; Job et al., 2007; Kroesen et al., 2008; Steffens et al., 2017). Moreover, we demonstrated that linear mixed-effects models combined with novel machine learning variable-selection techniques are applicable in hypothesis testing in noise effects and soundscape research. Furthermore, they can overcome problems associated with overfitting and multicollinearity when many situational and person-related variables are included in the course of a multiple regression. The feasibility of these techniques is further supported by our extensive and time-consuming bivariate analyses of the single variables, which overall led to similar results.
To the best of our knowledge, this is the first study in the realm of sound perception that takes into account such a large number of psychological variables and utilizes linear machine learning to overcome the aforementioned statistical problems. In addition, the established models derived from the percentile-Lasso method maintain interpretability due to the linear, additive effects of the predictor variables on the outcome variable, as opposed to widespread deep learning approaches that obfuscate those relationships. The percentile-Lasso regression approach is assumed to be particularly useful if multiple (psycho-)acoustic parameters—usually highly correlated—are also taken into account in the course of more comprehensive future studies and models. Moreover, the combination of multilevel modeling and the percentile-Lasso approach will also allow time-series analyses and the separate modeling of inter- and intra-individual processes relevant to everyday sound perception.
The more detailed analysis of our data further supported the feasibility of using the three most frequently reported macro-level sound categories (natural, human, and technical; Axelsson et al., 2010; Bones et al., 2018; ISO/TS 12913-2,ISO, 2018), whose mean annoyance ratings differed significantly. In addition, we derived 38 micro-level sound categories from sound and situation descriptions, which shed light on the kinds of sounds people experience in their day-to-day life, including their prevalence and how they were evaluated depending on the loudness level.
Since the bootstrapping for the marginal mean values is based on resampling through the level 2 cluster variable, it cannot reproduce well the different distributions of, e.g., low-level sounds and mid/high-level sounds. When a second fixed factor was included in the models, the differences between the marginal means of the two loudness levels were equal across all levels of the other fixed factor (see Figures 2–4). For study designs with multiple fixed factor and non-homogeneously distributed data, a specific statistical approach must be developed in future research that relates the clustering to several levels of multiple factors.
Regarding the evaluation of low-level sounds, our models revealed the expected significant positive effects of perceived loudness on annoyance perception. However, the effect size of loudness was oftentimes smaller than that of non-auditory variables (Job, 1996; Kim et al., 2017; World Health Organization, 2018), which might be a result of the study design’s focusing on low-level sounds. A significant loudness-dependent difference in annoyance mean values was indeed observed for the three macro-level sound categories (natural, human, and technical). However, none of the effects of the Lasso-selected variables in the optimal models for different loudness levels differed significantly. As such, human sound perception strategies seem to be loudness-level independent, as the same predictors for the two sub-models (low-level and mid/high-level sounds) were selected by the Lasso. This could be affected by the fact that no acoustic stimuli were presented. The assessment of sounds that are remembered after days or weeks may be affected by a memory bias. An example could be the Peak-End rule, according to which people usually base their retrospective judgments on the most intense (Peak) and the last event (End) (Steffens et al., 2017). The inclusion of more cognitive processing may further bias the assessment compared to an in situ evaluation. Another explanation might be that some participants remembered a low-level sound while answering the questionnaire but—because no sound was provided—connected it with the sound source that they might have experienced in other situations at a shorter distance, i.e., higher loudness. Such a justification could also explain why the other sound characteristics—tonality and timbre—contributed negligibly to explaining the variance of annoyance or were even not significant. Non-significant predictors, like the General Fade-out, may be present in the model, especially resulting from the usage of the 1-SE rule. The reason for this lies in the Lasso variable selection method: The Lasso excludes predictors based on regularization but not p-values. The model selection is based on cross-validated MSE values in combination with the 1-SE rule to detect the most generalized and parsimonious model with low prediction error. Finally, we performed statistical testing and p-value analysis after the model selection process.
Our results of the bivariate analyses of the DIAMONDS psychological situation dimensions (Rauthmann et al., 2014) showed only two strong associations. As expected, positive situations were associated with low annoyance (i.e., pleasant) judgments and negative situations with high annoyance. The other six dimensions showed only small effects; sociality and duty were insignificant. A situation with intellectual, romantic, or social aspects was associated with more pleasant sounds, whereas adversity, deception, and duty were connected with greater annoyance. A reason for the relatively low contribution of the DIAMONDS dimensions to the annoyance perception may be that all participants rated individual sound situations and incorporated high diversity in objective environmental characteristics that were assessed—in the worst case—only once. The situational variables then become individual perceptions, i.e., personal variables (Rauthmann and Sherman, 2020). This represents a particular challenge for online studies and more valid field studies that must capture situations in a way that reduces otherwise enormous diversity.
Another situational variable—perceived control, often interpreted as perceived dominance over the situation—showed a minor effect in our analyses. In contrast, other studies have emphasized control as an important—if not essential—non-auditory factor with a negative effect on annoyance (Kjellberg et al., 1996; Stallen, 1999; Kroesen et al., 2008). An explanation might be found in the retrospective study design, as participants may not have been able to remember every aspect of the situation described, leading to bias. Nevertheless, our results are still consistent with the findings of Graeven (1975), who reported a small but significant effect of control over noise in the neighborhood or at home, and with the more recent results of Hatfield et al. (2002), who found a small negative effect of perceived control on sleep, reading disturbance, and general symptoms.
Although other studies have discussed coping as one of the top three non-acoustical factors of sound perception (Stallen, 1999; Kroesen et al., 2008), active coping was a minor situational factor for predicting annoyance in our study, both in the bivariate and the Lasso regression model. More active coping was associated with greater annoyance. Our result is in line with several studies positing that coping can be seen as a consequence of annoyance (Glass et al., 1972; Botteldooren and Lercher, 2004; Park et al., 2016). At first glance, we observed a direction of the coping effect contrary to that reported by Kroesen et al. (2008). It seems plausible that one might only feel the strong need for coping activity if one feels highly annoyed by a given situation. Kroesen et al., however, defined a different aspect of coping, namely “coping capacity,” which diminishes if one’s ability to face a threat is limited or reduced. As a consequence of being not able to cope with the situation, stress rises. By extension, perceiving a higher coping capacity leads to less annoyance.
In our study, the self-determined ability to fade out the specific reported sound in the specific situation was a crucial factor in explaining the variance of annoyance after valence, arousal, positivity, and (though not in the Lasso-selected variables) negativity. This is quite interesting, as to our knowledge there is no research on this topic available. As our study was very broad in scope, we could not explore every aspect in depth. It seems worthwhile to further study this construct, its antecedents and consequences, and its person-related (e.g., attention deficit disorder), situational (e.g., fatigue), and sound-related (e.g., saliency) correlates. Here, it would be particularly interesting to investigate the stability and situation dependency of this ability and whether its effect on annoyance evaluation can be reproduced in other contexts, such as the field or the laboratory.
Interestingly, noise sensitivity showed a minimal variance explanation with a small positive effect, meaning that higher noise sensitivity was associated with greater annoyance. Other studies have identified noise sensitivity as the most crucial factor in the annoyance responses caused by noise, considerably stronger than the exposure level (Job, 1988; Öhrström et al., 1988; Ryu and Jeon, 2011). In contrast, Stölzel (2004) and Kroesen et al. (2008) found no added explained variance or only a small correlation between noise sensitivity and annoyance, which is in line with our findings. One explanation for this discrepancy could be that we used a short questionnaire, the LEF-K (Zimmer and Ellermeier, 1998). Another could be that, according to other researchers, noise sensitivity may be seen as a multidimensional construct, which means that it might be different for various aspects of daily life (Schütte et al., 2007) and sound levels (Job, 1999). Therefore, an (additional) measurement such as the NoiSeQ (Schütte et al., 2007) or the short version NoiSeQ-R, which considers three everyday scenarios (Griefahn, 2008), might be advisable for future studies.
Since 1260 (45%) of all 2800 reported sounds were rated as mid/high-level—although we were interested in the low-level sounds perceived by the participants—one could hypothesize that some participants indicated the presumed volume of the sound source rather than what they heard. It could also be the case that when asked to report low-level sounds, the participants intuitively thought of a low-level sound, such as birdsong. Later, when asked to evaluate the loudness, they probably made a more cognitive evaluation, perhaps putting the sound into a context or comparing it with other sounds and situations. For example, birdsong might appear loud in a quiet morning, while it is certainly still a low-level sound compared to an accelerating bus passing by.
Limitations
Some limitations associated with the test design should be addressed. First, we provided no acoustic stimuli to participants. Instead, they recalled sounds, situations, and behavior, potentially introducing a memory bias (Steffens et al., 2017; Greb et al., 2019). Notwithstanding, our results (for example, in terms of valence and arousal) revealed similar values compared to studies that used acoustical stimuli (e.g., Hall et al., 2013). Furthermore, the data we assessed allowed for the interpretation of correlative relationships between variables but revealed neither directions of effects nor moderation and mediation effects. In addition, each participant reported only one to three observations, which makes it inappropriate to calculate personal means of otherwise time-varying measures. All of these drawbacks can be addressed by conducting a field study applying the experience sampling method and by obtaining a high number of repeated measures for each participant. The authors are preparing a large-scale field study, including on-site sound recordings, which aims to replicate and extend the findings of this study.
Conclusion
Despite the limitations mentioned above, our study shows how to deal with many influencing variables in the field of sound perception using machine learning for the selection of the most essential variables. Even though no actual acoustical stimuli were used, our recall-based online study revealed some crucial factors associated with annoyance judgments (valence, arousal, sound categories, and mental fade-out ability). The results of this study also have practical implications for manufacturers of technical equipment and domestic installations, as even low-level sounds—such as toilet flushing, which was associated with high annoyance ratings in our study—can be prominent (Kuwano et al., 2003). Manufacturers of heating installations, for example, may offer their customers a sense of perceived control that can lower annoyance perceptions by enabling customers to adjust the flow rate of the heating installation to reduce flow noise, if temporarily desired.
Data Availability Statement
The data sets presented in this article are not readily available as supplementary material, as the researchers plan to conduct further analyses. Requests for access to the data sets can be sent to SV,c2llZ2JlcnQudmVyc3VlbWVyQGhzLWR1ZXNzZWxkb3JmLmRl.
Ethics Statement
The studies involving human participants were reviewed and approved by the Ethics Committee of the Medical Faculty of the University of Duisburg-Essen, Germany. All participants provided digital written informed consent by confirming the declaration on data collection and processing before participating. They were anonymous to the researchers at all times.
Author Contributions
SV and JS designed the study, interpreted data, reviewed, and edited the manuscript. SV collected the data, performed the statistical analysis, programmed the diagrams, and wrote the first draft of the manuscript. PB implemented machine learning, wrote the corresponding passage in the “Materials and Methods” section, and consulted on statistics during editing. JB-S provided initial concept and consulted in the evaluation process. All authors approved the final version of the manuscript.
Funding
This study was sponsored by the German Federal Ministry of Education and Research. “FHprofUnt”-Funding Code: 13FH729IX6.
Conflict of Interest
The authors declare that the research was conducted in the absence of any commercial or financial relationships that could be construed as a potential conflict of interest.
Acknowledgments
We thank Christian-Maximilian Steier and the Faculty of Social Sciences and Cultural Studies from the University of Applied Sciences Düsseldorf for providing the online survey platform. We further are grateful to Matthias Ladleif for conducting the pre-test of the online survey as part of his bachelor thesis.
Supplementary Material
The Supplementary Material for this article can be found online at: https://www.frontiersin.org/articles/10.3389/fpsyg.2020.570761/full#supplementary-material
Footnotes
- ^ https://www.respondi.com/
- ^ https://www.limesurvey.org/
- ^ Instead of “1” and “a,” the sound and situation descriptions given by the participants were inserted here.
- ^ N (number of subjects with two or more ratings) = 3,039; n (number of ratings) = 2; k (number of categories) = 38 + 2.
- ^ N (number of subjects with two or more ratings) = 3,039; n (number of ratings) = 2; k (number of categories) = 3 + 2; B (number of bootstrap samples) = 1,000.
- ^ N (number of subjects with two or more ratings) = 2,778; n (number of ratings) = 2; k (number of categories) = 6; B (number of bootstrap samples) = 1,000. The N here is smaller than the N for the sound categories because locations have not been clustered for nonsensical reports.
- ^ https://easystats.github.io/performance/
- ^ SE, Standard Error.
References
Aletta, F., van Renterghem, T., and Botteldooren, D. (2018). Influence of personal factors on sound perception and overall experience in urban green areas. A case study of a cycling path highly exposed to road traffic noise. Int. J. Environ. Res. Public Health 15:1118. doi: 10.3390/ijerph15061118
Axelsson, Ö., Nilsson, M. E., and Berglund, B. (2010). A principal components model of soundscape perception. J. Acoust. Soc. Am. 128, 2836–2846. doi: 10.1121/1.3493436
Babisch, W. (2002). The noise/stress concept, risk assessment and research needs. Noise Health 4, 1–11. doi: 10.1007/978-1-4684-5625-7_1
Bangjun, Z., Lili, S., and Di Guoqing. (2003). The influence of the visibility of the source on the subjective annoyance due to its noise. Appl. Acoust. 64, 1205–1215. doi: 10.1016/S0003-682X(03)00074-4
Bartosova, M., Svetlak, M., Kukletova, M., Borilova Linhartova, P., Dusek, L., and Izakovicova Holla, L. (2019). Emotional stimuli candidates for behavioural intervention in the prevention of early childhood caries: a pilot study. BMC Oral Health 19:33. doi: 10.1186/s12903-019-0718-4
Basner, M., Babisch, W., Davis, A., Brink, M., Clark, C., Janssen, S., et al. (2014). Auditory and non-auditory effects of noise on health. Lancet 383, 1325–1332. doi: 10.1016/S0140-6736(13)61613-X
Bates, D. M., Mächler, M., Bolker, B., and Walker, S. (2015). Fitting linear mixed-effects models using lme4. J. Stat. Soft. 67, 1–48. doi: 10.18637/jss.v067.i01
Belojević, G., and Jakovjlevic, B. (2001). Factors influencing subjective noise sensitivity in an urban population. Noise Health 4, 17–24.
Bender, R., and Lange, S. (2001). Adjusting for multiple testing—when and how? J. Clin. Epidemiol. 54, 343–349. doi: 10.1016/S0895-4356(00)00314-0
Betella, A., and Verschure, P. F. M. J. (2016). The affective slider: a digital self-assessment scale for the measurement of human emotions. PLoS One 11:e0148037. doi: 10.1371/journal.pone.0148037
Beutel, M. E., Jünger, C., Klein, E. M., Wild, P., Lackner, K., Blettner, M., et al. (2016). Noise annoyance is associated with depression and anxiety in the general population- the contribution of aircraft noise. PLoS One 11:e0155357. doi: 10.1371/journal.pone.0155357
Bones, O., Cox, T. J., and Davies, W. J. (2018). Sound categories: category formation and evidence-based taxonomies. Front. Psychol. 9:1277. doi: 10.3389/fpsyg.2018.01277
Botteldooren, D., and Lercher, P. (2004). Soft-computing base analyses of the relationship between annoyance and coping with noise and odor. J. Acoust. Soc. Am. 115, 2974–2985. doi: 10.1121/1.1719024
Bradley, M. M., and Lang, P. J. (1994). Measuring emotion: the self-assessment manikin and the semantic differential. J. Behav. Ther. Exp. Psychiatry 25, 49–59. doi: 10.1016/0005-7916(94)90063-9
Bradley, M. M., and Lang, P. J. (2000). Affective reactions to acoustic stimuli. Psychophysiology 37, 204–215. doi: 10.1111/1469-8986.3720204
Bynion, T.-M., and Feldner, M. T. (2017). “Self-assessment manikin,” in Encyclopedia of Personality and Individual Differences, eds V. Zeigler-Hill and T. K. Shackelford, (Cham: Springer), 1–3. doi: 10.1007/978-3-319-28099-8_77-1
Costa, P. T., and McCrae, R. R. (2008). “The revised NEO Personality Inventory (NEO-PI-R),” in The SAGE Handbook of Personality Theory and Assessment: Volume 2 — Personality Measurement and Testing (1 Oliver’s Yard, eds G. J. Boyle, G. Matthews, and D. H. Saklofske, (London: SAGE Publications Ltd), 179–198. doi: 10.4135/9781849200479.n9
Crichton, F., Dodd, G., Schmid, G., and Petrie, K. J. (2015). Framing sound: using expectations to reduce environmental noise annoyance. Environ. Res. 142, 609–614. doi: 10.1016/j.envres.2015.08.016
Deen, M., and de Rooij, M. (2020). ClusterBootstrap: an R package for the analysis of hierarchical data using generalized linear models with the cluster bootstrap. Behav. Res. Methods 52, 572–590. doi: 10.3758/s13428-019-01252-y
Digman, J. M. (1990). Personality structure: emergence of the five-factor model. Annu. Rev. Psychol. 41, 417–440. doi: 10.1146/annurev.ps.41.020190.002221
Fields, J. M. (1993). Effect of personal and situational variables on noise annoyance in residential areas. J. Acoust. Soc. Am. 93, 2753–2763. doi: 10.1121/1.405851
Fyhri, A., and Klćboe, R. (2006). Direct, indirect influences of income on road traffic noise annoyance. J. Environ. Psychol. 26, 27–37. doi: 10.1016/j.jenvp.2006.04.001
German Federal Statistical Office, (2018). Verteilung der Privathaushalte in Deutschland nach monatlichem Haushaltsnettoeinkommen im Jahr 2017 (in 1.000). Available online at: https://de.statista.com/statistik/daten/studie/3048/umfrage/privathaushalte-nach-monatlichem-haushaltsnettoeinkommen/ (accessed June 08, 2020).
Glass, G. V., Peckham, P. D., and Sanders, J. R. (1972). Consequences of failure to meet assumptions underlying the fixed effects analyses of variance and covariance. Rev. Educ. Res. 42, 237–288. doi: 10.3102/00346543042003237
Graeven, D. B. (1975). Necessity, control, and predictability of noise as determinants of noise annoance. J. Soc. Psychol. 95, 85–90. doi: 10.1080/00224545.1975.9923237
Greb, F., Steffens, J., and Schlotz, W. (2018). Understanding music-selection behavior via statistical learning. Music Sci. 1:205920431875595. doi: 10.1177/2059204318755950
Greb, F., Steffens, J., and Schlotz, W. (2019). modeling music-selection behavior in everyday life: a multilevel statistical learning approach and mediation analysis of experience sampling data. Front. Psychol. 10:411. doi: 10.3389/fpsyg.2019.00390
Griefahn, B. (2008). Determination of noise sensitivity within an internet survey using a reduced version of the Noise Sensitivity Questionnaire. J. Acoust. Soc. Am. 123:3449. doi: 10.1121/1.2934269
Groll, A. (2017). “glmmLasso: Variable Selection for Generalized Linear Mixed Models by L1-Penalized Estimation. R package Version 1.5.1. Available at: https://CRAN.R-project.org/package=glmmLasso (accessed June 08, 2020).
Groll, A., and Tutz, G. (2014). Variable selection for generalized linear mixed models by L 1-penalized estimation. Stat. Comput. 24, 137–154. doi: 10.1007/s11222-012-9359-z
Gunn, W. J., Patterson, H. P., Cornog, J., Klaus, P., and Connor, W. K. (1975). A Model and Plan for a Longitudinal Study of Community Response to Aircraft Noise. NASA Technical Memorandum. Washington, DC: NASA.
Guski, R. (1999). Personal and social variables as co-determinants of noise annoyance. Noise Health 1, 45–56.
Guski, R., Schreckenberg, D., and Schuemer, R. (2017). WHO environmental noise guidelines for the European region: a systematic review on environmental noise and annoyance. Int. J. Environ. Res. Public Health 14:1539. doi: 10.3390/ijerph14121539
Halevy, N., Kreps, T. A., and de Dreu, C. K. W. (2019). Psychological situations illuminate the meaning of human behavior: recent advances and application to social influence processes. Soc Pers. Psychol. Compass 13:e12437. doi: 10.1111/spc3.12437
Hall, D. A., Irwin, A., Edmondson-Jones, M., Phillips, S., and Poxon, J. E. W. (2013). An exploratory evaluation of perceptual, psychoacoustic and acoustical properties of urban soundscapes. Appl. Acoust. 74, 248–254. doi: 10.1016/j.apacoust.2011.03.006
Harwell, M. R., Rubinstein, E. N., Hayes, W. S., and Olds, C. C. (1992). Summarizing monte carlo results in methodological research: the one- and two-factor fixed effects ANOVA cases. J. Educ. Stat. 17, 315–339. doi: 10.3102/10769986017004315
Hastie, T., Tibshirani, R., and Friedman, J. H. (2009). The Elements of Statistical Learning: Data Mining, Inference, and Prediction, 2nd Edn. New York, N.Y: Springer.
Hatfield, J., Job, R. F. S., Hede, A. J., Carter, N. L., Peploe, P., Taylor, R., et al. (2002). Human response to environmental noise: the role of perceived control. Int. J. Behav. Med. 9, 341–359. doi: 10.1207/S15327558IJBM0904_04
Hill, E. M., Billington, R., and Krägeloh, C. (2014). Noise sensitivity and diminished health: testing moderators and mediators of the relationship. Noise Health 16, 47–56. doi: 10.4103/1463-1741.127855
Irtel, H. (2007). PXLab: The Psychological Experiments Laboratory: Version 2.1.11. Available online at: http://irtel.uni-mannheim.de/pxlab/demos/index_SAM.html (accessed May 6, 2019).
ISO (2018). ISO/TS 12913-2: Acoustics - Soundscape: Part 2: Data Collection and Reporting, no. ISO/TS 12913-2:2018(E). Available online at: https://www.iso.org/obp/ui/#iso:std:iso:12913:-2:dis:ed-1:v1:en (accessed May 22, 2002).
Janssen, S. A., Vos, H., Eisses, A. R., and Pedersen, E. (2011). A comparison between exposure-response relationships for wind turbine annoyance and annoyance due to other noise sources. J. Acoust. Soc. Am. 130, 3746–3753. doi: 10.1121/1.3653984
Job, R. F. S. (1988). Community response to noise: a review of factors influencing the relationship between noise exposure and reaction. J. Acoust. Soc. Am. 83, 991–1001. doi: 10.1121/1.396524
Job, R. F. S. (1996). The influence of subjective reactions to noise on health effects of the noise. Environ. Int. 22, 93–104. doi: 10.1016/0160-4120(95)00107-7
Job, R. F. S. (1999). Noise sensitivity as a factor influencing human reaction to noise. Noise Health 1, 57–68.
Job, R. F. S., Hatfield, J., Hede, A. J., Peploe, P., Carter, N. L., Taylor, R., et al. (2007). The role of attitudes and sensitivity in reactions to changing noise. ICA 19, 1–5.
Kim, A., Sung, J. H., Bang, J.-H., Cho, S. W., Lee, J., and Sim, C. S. (2017). Effects of self-reported sensitivity and road-traffic noise levels on the immune system. PLoS One 12:e0187084. doi: 10.1371/journal.pone.0187084
Kjellberg, A., Landström, U., Tesarz, M., Söderberg, L., and Akerlund, E. (1996). The effects of nonphysical noise characteristics, ongoing task and noise sensitivity on annoyance and distraction due to noise at work. J. Environ. Psychol. 16, 123–136. doi: 10.1006/jevp.1996.0010
Klatte, M., Spilski, J., Mayerl, J., Möhler, U., Lachmann, T., and Bergström, K. (2017). Effects of aircraft noise on reading and quality of life in primary school children in Germany: results from the NORAH study. Environ. Behav. 49, 390–424. doi: 10.1177/0013916516642580
Krippendorff, K. (2004). Content Analysis: An Introduction to its Methodology, 2nd Edn. Thousand Oaks, CA: Sage.
Kroesen, M., Molin, E. J. E., and van Wee, B. (2008). Testing a theory of aircraft noise annoyance: a structural equation analysis. J. Acoust. Soc. Am. 123, 4250–4260. doi: 10.1121/1.2916589
Krstajic, D., Buturovic, L. J., Leahy, D. E., and Thomas, S. (2014). Cross-validation pitfalls when selecting and assessing regression and classification models. J. Cheminform. 6:10.
Kuwano, S., Seiichiro, N., Kato, T., and Hellbrück, J. (2003). Memorey of the loudness of sounds and its relation to overall impression. Acoust. Sci. Technol. 24, 194–196. doi: 10.1250/ast.24.194
Kuznetsova, A., Brockhoff, P. B., and Christensen, R. H. B. (2017). lmerTest package: tests in linear mixed effects models. J. Stat. Soft. 82, 1–26. doi: 10.18637/jss.v082.i13
Lang, P. J. (1980). “Behavioral treatment and bio-behavioral assessment: computer applications,” in Technology in Mental Health Care Delivery, eds J. B. Sidowski, J. H. Johnson, and T. A. Williams, (Norwood, NJ: Ablex), 119–137.
Lang, P. J., and Bradley, M. M. (1997). International Affective Picture System (IAPS): Technical Manual and Affective Ratings. (Gainesville, FL: NIMH Center for the Study of Emotion and Attention), 39–58.
Lercher, P. (1996). Environmental noise and health: an integrated research perspective. Environ. Int. 22, 117–129. doi: 10.1016/0160-4120(95)00109-3
Lewin, K. (1936). Priticiples of Topologicol Psychology, trans. F. Heider, and G. Heider, (New York, NY: McGraw Hill).
Lindborg, P., and Friberg, A. (2016). Personality traits bias the perceived quality of sonic environments. Appl. Sci. 6:405. doi: 10.3390/app6120405
Lix, L. M., Keselman, J. C., and Keselman, H. J. (1996). Consequences of assumption violations revisited: a quantitative review of alternatives to the one-way analysis of variance f test. Rev. Educ. Res. 66, 579–619. doi: 10.3102/00346543066004579
Luke, S. G. (2017). Evaluating significance in linear mixed-effects models in R. Behav. Res. Methods 49, 1494–1502. doi: 10.3758/s13428-016-0809-y
Miedema, H. M. E., and Vos, H. (1999). Demographic and attitudinal factors that modify annoyance from transportation noise. J. Acoust. Soc. Am. 105, 3336–3344. doi: 10.1121/1.424662
Miedema, H. M. E., and Vos, H. (2003). Noise sensitivity and reactions to noise and other environmental conditions. J. Acoust. Soc. Am. 113, 1492–1504. doi: 10.1121/1.1547437
Nakagawa, S., and Schielzeth, H. (2013). A general and simple method for obtaining R2 from generalized linear mixed-effects models. Methods Ecol. Evol. 4, 133–142. doi: 10.1111/j.2041-210x.2012.00261.x
Öhrström, E., Björkman, M., and Rylander, R. (1988). Noise annoyance with regard to neurophysiological sensitivity, subjective noise sensitivity and personality variables. Psychol. Med. 18, 605–613. doi: 10.1017/S003329170000828X
Park, S. H., Lee, P. J., Yang, K. S., and Kim, K. W. (2016). Relationships between non-acoustic factors and subjective reactions to floor impact noise in apartment buildings. J. Acoust. Soc. Am. 139, 1158–1167. doi: 10.1121/1.4944034
Perneger, T. V. (1998). What’s wrong with Bonferroni adjustments. BMJ 316, 1236–1238. doi: 10.1136/bmj.316.7139.1236
R Core Team (2020). R: A Language and Environment for Statistical Computing. Available online at: https://www.R-project.org/ (accessed February 29, 2002).
Rammstedt, B., and John, O. P. (2007). Measuring personality in one minute or less: a 10-item short version of the Big Five Inventory in English and German. J. Res. Pers. 41, 203–212. doi: 10.1016/j.jrp.2006.02.001
Rammstedt, B., Kemper, C. J., Klein, M. C., Beierlein, C., and Kovaleva, A. (2012). Eine kurze Skala zur Messung der fünf Dimensionen der Persönlichkeit. Big-Five-Inventory-10 (BFI-10). GESIS-Working Papers 22. Köln: GESIS.
Rauthmann, J. F. (2015). Structuring situational information. Eur. Psychol. 20, 176–189. doi: 10.1027/1016-9040/a000225
Rauthmann, J. F. (2018). S8-II - Eine Ultrakurzversion der Situational Eight DIAMONDS. Available online at: https://www.psycharchives.org/bitstream/20.500.12034/620/1/PT_9007482_S8-II_Fragebogen.docx (accessed April 25, 2019).
Rauthmann, J. F., Gallardo-Pujol, D., Guillaume, E. M., Todd, E., Nave, C. S., Sherman, R. A., et al. (2014). The Situational Eight DIAMONDS: a taxonomy of major dimensions of situation characteristics. J. Pers. Soc. Psychol. 107, 677–718. doi: 10.1037/a0037250
Rauthmann, J. F., and Sherman, R. A. (2020). The situation of situation research: knowns and unknowns. Curr. Dir. Psychol. Sci. doi: 10.1177/0963721420925546
Rauthmann, J. F., Sherman, R. A., and Funder, D. C. (2015). Principles of situation research: towards a better understanding of psychological situations. Eur. J. Pers. 29, 363–381. doi: 10.1002/per.1994
Riedel, N., Köckler, H., Scheiner, J., van Kamp, I., Erbel, R., Loerbroks, A., et al. (2019). Urban road traffic noise and noise annoyance-a study on perceived noise control and its value among the elderly. Eur. J. Public Health 29, 377–379. doi: 10.1093/eurpub/cky141
Roberts, S., and Nowak, G. (2014). Stabilizing the lasso against cross-validation variability. Comput. Stat. Data Anal. 70, 198–211. doi: 10.1016/j.csda.2013.09.008
Rothman, K. (1990). No adjustments are needed for multiple comparisons. Epidemiology 1, 43–46. doi: 10.1097/00001648-199001000-00010
RStudio Team (2019). RStudio: Integrated Development for R. Available online at: https://rstudio.com/products/rstudio/ (accessed January 19, 2020).
Ryu, J. K., and Jeon, J. Y. (2011). Influence of noise sensitivity on annoyance of indoor and outdoor noises in residential buildings. Appl. Acoust. 72, 336–340. doi: 10.1016/j.apacoust.2010.12.005
Schneider, S. L. (2008). “Applying the ISCED-97 to the German educational qualifications,” The International Standard Classification of Education (Mannheim: MZES), 77–102.
Schreckenberg, D., Belke, C., Faulbaum, F., Guski, R., Möhler, U., and Spilski, J. (2016). Effects of Aircraft Noise on Annoyance and Sleep Disturbances Before and After Expansion of Frankfurt Airport - Results of the NORAH study, WP 1 ‘Annoyance and Quality of Life’. (Hamburg: Inter.noise), 997–1006.
Schreckenberg, D., Griefahn, B., and Meis, M. (2010). The associations between noise sensitivity, reported physical and mental health, perceived environmental quality, and noise annoyance. Noise Health 12, 7–16. doi: 10.4103/1463-1741.59995
Schütte, M., Marks, A., Wenning, E., and Griefahn, B. (2007). The development of the noise sensitivity questionnaire. Noise Health 9, 15–24. doi: 10.4103/1463-1741.34700
Serrou, M. B. (1995). La protection des Riverains Contre le Bruit des Transports Terrestres. Available at: http://temis.documentation.developpement-durable.gouv.fr/docs/Temis/0026/Temis-0026438/11191.pdf (accessed September 6, 2002).
Shepherd, D., Heinonen-Guzejev, M., Hautus, M. J., and Heikkilä, K. (2015). Elucidating the relationship between noise sensitivity and personality. Noise Health 17, 165–171. doi: 10.4103/1463-1741.155850
Smith, C. A., and Lazarus, R. S. (1990). “Emotion and adaptation,” in Handbook of Personality: Theory and Research, ed. L. A. Pervin, (New York, NY: Guilford), 609–637.
Stallen, P. J. M. (1999). A theoretical framework for environmental noise annoyance. Noise Health 1, 69–80.
Steffens, J., Steele, D., and Guastavino, C. (2017). Situational and person-related factors influencing momentary and retrospective soundscape evaluations in day-to-day life. J. Acoust. Soc. Am. 141, 1414–1425. doi: 10.1121/1.4976627
Stölzel, K. (2004). Zusammenhang zwischen Umweltlärmbelästigung und Lärmempfindlichkeit – epidemiologische Untersuchung im Rahmen der Berliner Lärmstudie. Ph.D. thesis, Humboldt-Universität zu Berlin, Berlin.
Suk, H.-J. (2006). Color and Emotion – A Study on the Affective Judgment Across Media and in Relation to Visual Stimuli. Dissertation, School of Social Sciences, Universität Mannheim. Available online at: https://madoc.bib.uni-mannheim.de/1336
Tibshirani, R. (1996). Regression shrinkage and selection via the lasso. J. R. Stat. Soc. 58, 267–288.
UNESCO Institute for Statistics, (2015). ISCED 2011 Operational Manual: Guidelines for Classifying National Education Programmes and Related Qualifications. Paris: OECD.
van Kamp, I., Job, R. F. S., Hatfield, J., Haines, M., Stellato, R. K., and Stansfeld, S. A. (2004). The role of noise sensitivity in the noise-response relation: a comparison of three international airport studies. J. Acoust. Soc. Am. 116, 3471–3479. doi: 10.1121/1.1810291
van Renterghem, T. (2019). Towards explaining the positive effect of vegetation on the perception of environmental noise. Urban For. Urban Green. 40, 133–144. doi: 10.1016/j.ufug.2018.03.007
Võ, M. L.-H., Conrad, M., Kuchinke, L., Urton, K., Hofmann, M. J., and Jacobs, A. M. (2009). The berlin affective word list reloaded (BAWL-R). Behav. Res. Methods 41, 534–538. doi: 10.3758/BRM.41.2.534
Wolsink, M., Sprengers, M., Keuper, A., Pedersen, T. H., and Westra, C. A. (1993). “Annoyance from wind turbine noise on sixteen sites in three countries,” in Proceedings of the 1993 European Community Wind Energy Conference, Lübeck, 273–276.
World Health Organization, (2011). Burden of Disease from Environmental Noise: Quantification of Healthy Life Years Lost in Europe. Geneva: World Health Organization.
World Health Organization, (2018). Environmental noise guidelines for the European Region. Copenhagen: World Health Organization.
Yu, L., and Kang, J. (2008). Effects of social, demographical and behavioral factors on the sound level evaluation in urban open spaces. J. Acoust. Soc. Am. 123, 772–783. doi: 10.1121/1.2821955
Zapf, A., Castell, S., Morawietz, L., and Karch, A. (2016). Measuring inter-rater reliability for nominal data - which coefficients and confidence intervals are appropriate? BMC Med. Res. Methodol. 16:93. doi: 10.1186/s12874-016-0200-9
Zimmer, K., and Ellermeier, W. (1998). Ein Kurzfragebogen zur Erfassung der Lärmempfindlichkeit. Umweltpsychologie 2, 54–63.
Appendix
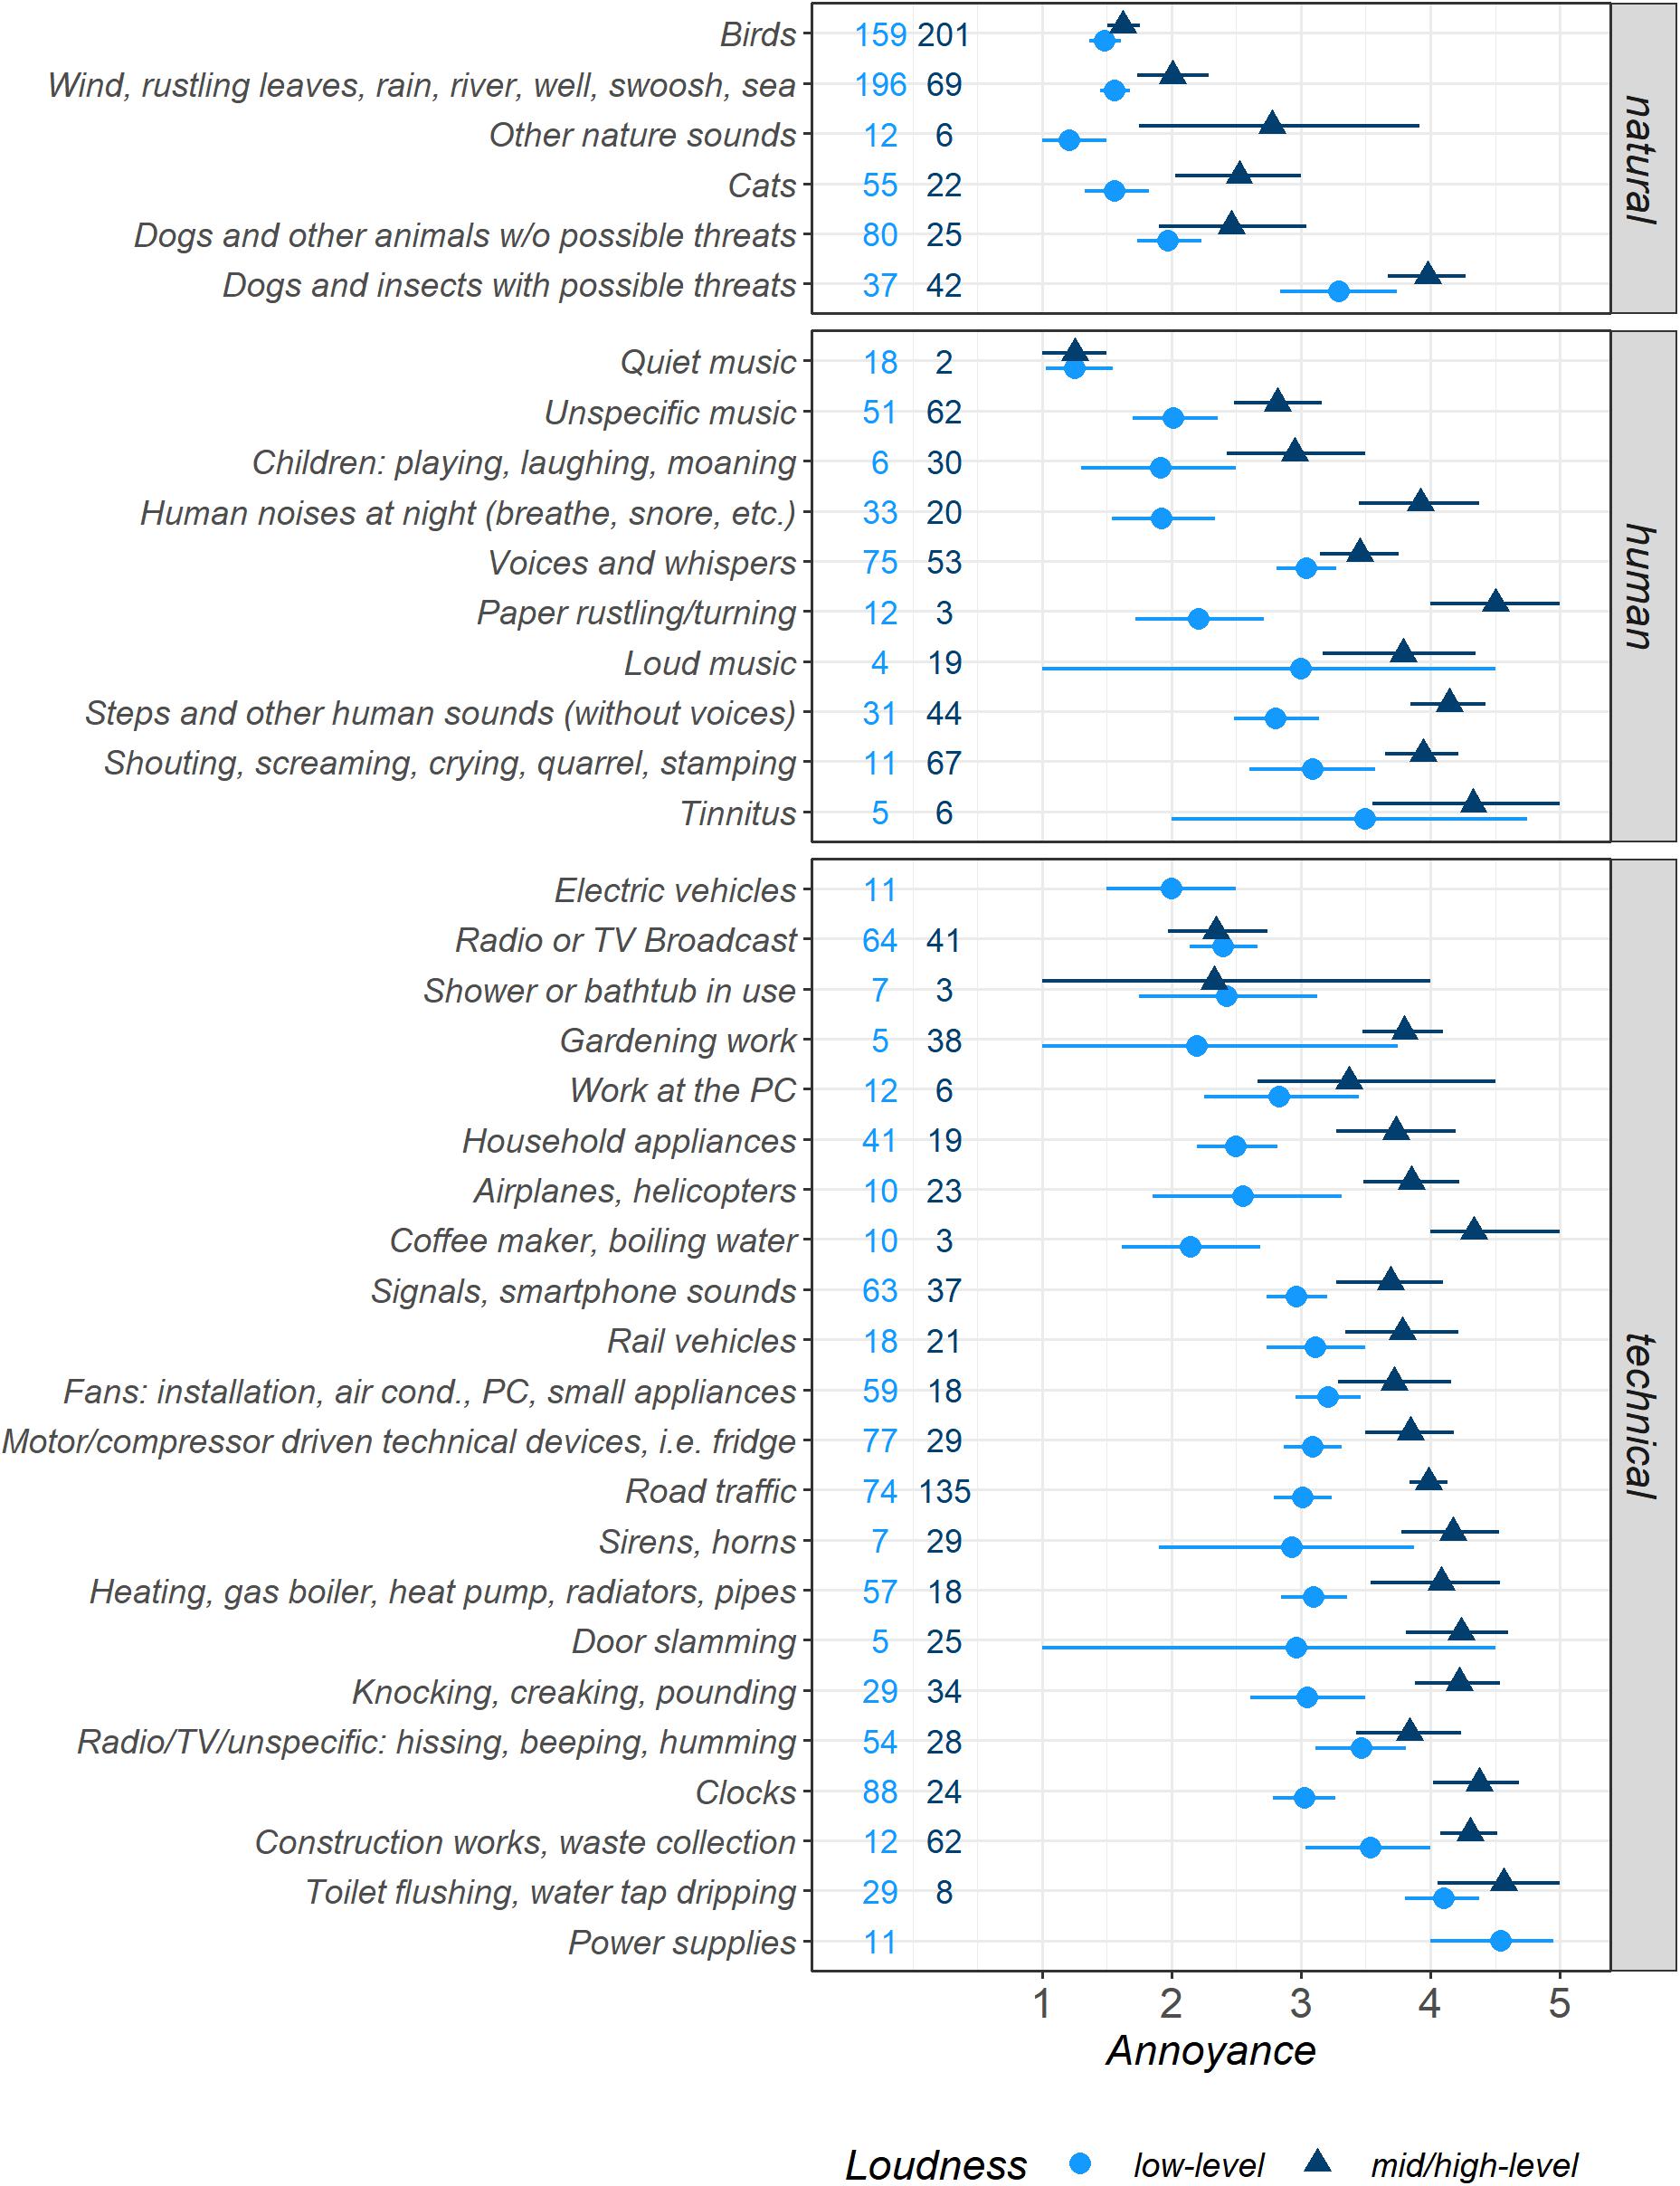
Figure A1. Estimated marginal means for Annoyance for sounds from 38 micro-level sound categories, separated by binary Loudness levels, displayed with 95% confidence intervals (both determined by bootstrapping) and the numbers of observations per category and Loudness level subsets. Very pleasant = 1, very annoying = 5. Models Micro3a and Micro3b.
Keywords: machine learning, variable selection, human perception, situation, Lasso, environmental sound, online-survey
Citation: Versümer S, Steffens J, Blättermann P and Becker-Schweitzer J (2020) Modeling Evaluations of Low-Level Sounds in Everyday Situations Using Linear Machine Learning for Variable Selection. Front. Psychol. 11:570761. doi: 10.3389/fpsyg.2020.570761
Received: 08 June 2020; Accepted: 07 September 2020;
Published: 23 October 2020.
Edited by:
Bert De Coensel, Ghent University, BelgiumReviewed by:
Catherine Lavandier, Université de Cergy-Pontoise, FrancePerMagnus Lindborg, School of Creative Media, City University of Hong Kong, Hong Kong
Copyright © 2020 Versümer, Steffens, Blättermann and Becker-Schweitzer. This is an open-access article distributed under the terms of the Creative Commons Attribution License (CC BY). The use, distribution or reproduction in other forums is permitted, provided the original author(s) and the copyright owner(s) are credited and that the original publication in this journal is cited, in accordance with accepted academic practice. No use, distribution or reproduction is permitted which does not comply with these terms.
*Correspondence: Siegbert Versümer, cy52ZXJzdWVtZXJAaHMtZHVlc3NlbGRvcmYuZGU=