 Xiaohong Zhou1,2,3
 Yong Yang
- 1School of Physical Science and Technology, ShanghaiTech University, Shanghai, China
- 2Shanghai Institute of Optics and Fine Mechanics, Chinese Academy of Sciences, Shanghai, China
- 3Shanghai Institute of Optics and Fine Mechanics, University of Chinese Academy of Sciences, Beijing, China
Lanthanum-containing materials are widely used in oxidative catalytic and electrocatalytic reactions such as oxidative coupling of methane (OCM) and solid oxide fuel cells (SOFCs). However, many of these materials are highly susceptible to air contamination which means ex situ characterization results generally cannot be associated with their reactivity. In this study, the activation processes of an in situ–prepared bulk La2O2CO3 sample and an ex situ as-prepared La(OH)3 sample are in situ investigated by X-ray photoelectron spectroscopy (XPS), X-ray diffraction (XRD), and online mass spectroscopy (MS). Results indicate that the La2O2CO3 sample, during linear heating to 800°C, always contains some carbonates near the surface region, which supports a two-step model of bulk carbonate decomposition through surface sites. The La(OH)3 sample structure evolution is more complex due to contaminations from air exposure. Together with TGA results, online mass analysis of water and CO2 signal loss showed that three major catalyst structure phase change steps and a preheating up to 800°C are required for the as-prepared material to be transferred to La2O3. This process is carefully investigated combining the three in situ methodologies. XPS and XRD data further reveal transformations of variety of in situ surface structures and forms including hybrid phases with hydroxyl, carbonates, and oxide as the sample heated to different temperatures within the range from 200 to 800°C. The results provide useful insights on the activation and deactivation of La-contained materials.
Introduction
The rare earth lanthanum is contained in a wide and important class of oxidation catalysts and electrocatalysts such as perovskites and MOF (Alcalde-Santiago et al., 2020; Lee, 2020; Karuppiah et al., 2021). These materials can be used as deep oxidation catalysts for a wide range of environmental applications (Hu et al., 2021; Ishisone et al., 2021; Le et al., 2021), which include membrane materials, electrocatalytic materials (Brugge et al., 2020), and materials in solid oxide fuel cells (SOFCs) (Duan et al., 2020). La2O3 is also widely used in materials applications, such as optical glasses, light-emitting materials, laser materials, and hydrogen storage materials (Dong et al., 2020; Le et al., 2021). On the other hand, many materials development adapt modification with La as it may help tailoring electronic, thermodynamic, and catalytic properties. Both the surface and bulk properties could be affected by these compositional changes. For most of these materials, La compounds are found on the surface (Vovk et al., 2005; Brugge et al., 2020; Duan et al., 2020; Sun et al., 2020; Hu et al., 2021; Ishisone et al., 2021; Le et al., 2021). Many of surface species of this group of materials are not stable under the operation conditions (Sunding et al., 2011; Li et al., 2019). In addition, after air exposure, their surface structure under operation conditions is usually not preserved. After the samples being transferred into ultrahigh vacuum (UHV) environment for traditional surface analysis, an in situ sample reactivation is required (Dou et al., 2017; Dong and Vayssieres, 2018; Nguyen et al., 2019; Zhang et al., 2019; Han et al., 2021). However, little is known about how the lanthanum-containing surface structure changes upon oxidation and reduction, including the status of surface oxygen species and other add-on species such as carbonates and adventitious carbon.
One of the most important applications of La2O3 as a catalyst is oxidative coupling of methane (OCM), in which La2O3-based catalysts exhibit excellent catalytic performance and give a commercialization potential (DeBoy and Hicks, 1988; Huang et al., 2013; Song et al., 2015; Jiang et al., 2016; Aseem et al., 2018; Gambo et al., 2018; Sollier et al., 2018). OCM reaction produces ethylene, a vital building block in the chemical industry (Gao et al., 2019), by direct coupling of CH3 radicals in the gas phase. It is considered as one of the promising ethylene production processes (Galadima and Muraza, 2016; Taifan and Baltrusaitis, 2016). Previous publications (Le Van, 1993; Lacombe et al., 1995; Xu et al., 1995), including our recent in situ studies, indicated that La2O3 is not stable in this reaction (Liu et al., 2018; Li et al., 2019; Guan et al., 2021; Pang et al., 2021; Zhou et al., 2021). In our recent studies, it was strongly suggested that a high temperature (800°C) precleaned sample surface, which is free of carbonates and hydroxyls, is enriched with a specific subsurface peroxide species (Zhou et al., 2021). A higher selectivity of C2 products was found on this surface. However, with high concentration (usually >10%) of COx as the reaction byproducts, the La2O3 sample is generally found forming, at least partially, surface and bulk La2O2CO3 (Le Van, 1993). With such conditions, the reaction selectivity and activity are found to be reduced (Xu et al., 1995; Guan et al., 2021). In addition, hydroxyl is also found to be easily formed (Li et al., 2019).
Our previous in situ XPS studies, applying a UHV-connected high pressure gas cell (HPGC), investigated pure La2O3 sample pretreated by water, CO2, O2, H2, CH4, and OCM reactants at different temperatures (Li et al., 2019). The results provide a reliable procedure for XPS binding energy (BE) scale calibration by applying carbon (deposited by in situ methane treatment) and lattice oxygen peaks as internal benchmarks. Results also showed that the binding energy of La 4d7/2 is the easiest benchmark for XPS spectra calibration as its BE is always uniform (102.2 ev) after above pretreatments including air exposure. A recent DFT simulation further corroborated the experimental results revealing the catalyst surface structure under realistic process conditions (Pang et al., 2021). Using the pristine La2O3 bulk structure supercell as reference, results suggested more proper definition of previous XPS feature assignments. For example, DFT found that the binding energy of the 4-coordinator (O4c) oxygen site in the (La2O22+)n layer of bulk La2O2CO3 overlaps with the lattice oxygen in La2O3.
In this study, two samples, that is, La2O2CO3 (in situ–prepared) and La(OH)3 (ex situ–prepared), are investigated by in situ XPS, XRD, and online MS for their surface and bulk structures. As these two samples represent two most popular La-related contamination species on many complex oxide surfaces, such as perovskites and MOF, their temperature stability and evolution of structure and phases are observed in detail. The in situ measurements are continued until the complete regeneration of La2O3 at about 800°C. All observed species are further interpreted by the characteristic species assignments and DFT surface structure model mentioned above. This study hopefully provides useful insight for understanding the related behavior of La-containing materials and the reaction performance of La-based catalysts.
Materials and Methods
Sample Preparation
The fresh nanorod La2O3 catalyst used in this work is described in detail elsewhere. The synthesis of the La2O3 nanorod catalysts follows the process proposed by Zhu and coworkers (Huang et al., 2013). In this study, a sample after this synthesis preparation is referred as “fresh as-prepared sample” which is mostly composed with La(OH)3. The SEM result indicates the sample is in the shape of nanorods with 10 nm diameter in average. BET measurement (N2) yields specific surface area of 3.4 m2/g (Liu et al., 2018).
Previous XPS and XRD analysis of the fresh as-prepared nanorod sample, after heating in vacuum at the temperature of 800°C for 1 h and subsequent cooling to room temperature at the same conditions, demonstrate a pure lanthanum oxide with minimum hydroxide and carbonate in the bulk or on the surface (Li et al., 2019; Guan et al., 2021; Zhou et al., 2021). In this work, the sample after this preheating in vacuum procedure is referred as “precleaned sample.”
The precleaned sample, after exposing to pure CO2 for 1 h at 600°C in HPGC and cooling down in the same atmosphere, is completely transferred into La2O2CO3. In this study, it is referred as “in situ–prepared La2O2CO3.”
Characterization Techniques
In Situ XPS
The XPS surface analysis in this work is performed by the ThermoFischer ESCALAB 250Xi XPS spectrometer. All spectra were acquired using a monochromated X-ray irradiation AlKα (hv = 1486.7 eV, 300 W, 500 μm spot size) and a 180° double-focusing hemispherical analyzer with a six-channel detector (30 eV pass energy). For in situ heating experiments simulating industrial high-temperature pretreatments, the sample analysis chamber (SAC) was specially equipped with a homemade heating stage. This sample stage is designed to be compatible with the original spectrometer manipulator which allows a sample to be heated up to 800°C with simultaneous XPS analysis. The in situ heating stage is also adapted to the regular flag-sample holder which allows the sample to be transferred to all the other UHV-connected functional chambers within the vacuum system. All heating treatments, if not specified additionally, are performed in the analysis chamber.
For XPS analysis, the fresh powder sample was pressed in a tiny 1.5 mm hole of a flag-shaped sample holder and then preheated in vacuum (10−10mbar). The in situ XPS analysis for every step is conducted at the fixed temperature. The analysis location (Φ=500 μm ) on the sample surface is chosen randomly. A set of primary sample spectra (C 1s, O 1s, La 3d, and La 4d) were acquired at 25°C before heating starts. Similarly, spectra were collected between 200 and 800°C with an increment of 100°C. Finally, the spectra after subsequent cooling to the room temperature were also collected. The monitoring time for spectra collected at fixed temperature was around 10°min; the heating rate in the XPS experiments was 10°C/min. During the whole process, the maximum pressure in the analysis chamber monitored by a wide-range gauge was around 2·10−8 mbar. All spectra processing analysis including O 1s and C 1s peak fitting are performed in Thermo Avantage software. The spectra are deconvoluted using the Lorentz–Gauss mix function after subtraction of modified Shirley (Smart) background. As proposed in our previous work (Li et al., 2019), the binding energy scale of all photoelectron spectra is calibrated to La 4d5/2 main peak at 102.2 eV. The atomic ratios of surface species are calculated from the corresponding photoelectron peaks after background subtraction taking into account transmission function and atomic sensitivity factors (ASF).
In Situ XRD
To confirm the phase change during the first heating of a fresh La2O3 sample, an in situ powder X-ray diffraction (in situ XRD) was used. In situ XRD analysis was conducted in the Bruker D8 Advance X-ray diffraction system using in situ Anton Paar XRK 900 cell reactor. The system is equipped with Cu Kα X-ray source (λ = 0.154 nm, 20 kV, 20 mA). The diffraction patterns are acquired with a step width of 0.02° in the (2θ) range from 20 to 50°. The sample temperature was ramped from room temperature to 800°C at a rate of 10°C/min. All presented survey scans are obtained at specified temperature.
Online MS
Temperature program desorption (TPD) in vacuum for a fresh sample was carried out using a quadrupole mass spectrometer (QMS, SRS 300) connected to HPGC (Zhou et al., 2021).
Results and Discussion
Activation of In Situ–Prepared La2O2CO3
Figure 1 data are obtained as the in situ–prepared La2O2CO3 is linearly heated directly in front of analyzer during the XPS analysis. The presented C 1s and O 1s spectra are collected at the actual temperature. The 529.8 eV peak in O 1s spectra is related to lattice oxygen in La2O3 or 4-coordinated oxygen atoms in La2O2CO3. The C 1s peak with BE around 285 eV is associated with adventitious carbon accumulated on the sample surface from background during the heating in HPGC. Both C 1s and O 1s spectra also show characteristic peaks of CO32− groups (BEs 532.4 eV for O 1s and 290.5 eV for C 1s). Our previous TPD studies showed that the bulk La2O2CO3 demonstrates two major desorption features: decomposition of the surface carbonate below 550°C and decomposition of the bulk La2O2CO3 from 600 to 800°C (Liu et al., 2018). During this sample linear heating to 800°C, the photoelectron spectra show that at 600°C (surface carbonate decomposition), the intensity of the carbonate species is strongly reduced. When the temperature reaches 800°C, a small carbonate signal in C 1s region is still observed. This species cannot be related to the initial surface carbonates but should be assigned to the bulk species decomposition through the surface. Therefore, the XPS results combined with the previous TPD data suggest that the bulk carbonate decomposes through a two-step process: the 1st step is migration to the surface and the 2nd is surface desorption. This is in agreement with our previous conclusion from kinetics study and DFT simulation results of bulk and surface carbonate free energies (Liu et al., 2018; Zhou et al., 2021). This in situ observed surface electronic structure also clearly indicates that during the linear heating, the continuous decomposition of bulk La2O2CO3 will result in surface sites occupied by carbonate groups at high temperature. In the La2O3-catalyzed OCM reaction, such surface carbonate occupation has a poisoning effect (Guan et al., 2021).
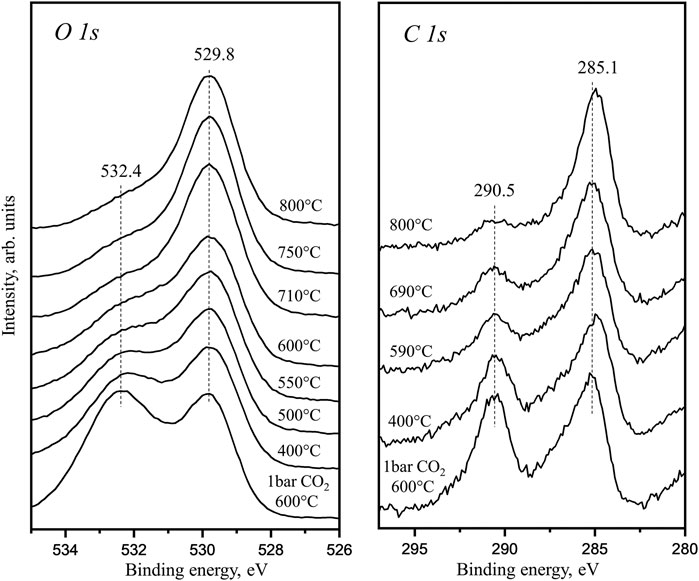
FIGURE 1. In situ XPS C 1s and O 1s core level spectra obtained in the temperature range from 400 to 800°C after pretreatment under 1 bar CO2 in UHV-connected HPGC.
Activation of La(OH)3 (Fresh As-Prepared Sample)
TGA and Online MS Analysis
To in situ obtain pure La2O3, the fresh nanorod sample after the synthesis needs to be heated to 800°C in inert gas or oxygen to decompose hydroxide and carbonate (Liu et al., 2018; Li et al., 2019; Guan et al., 2021). Figure 2 shows the online MS data of water (amu 18) and CO2 (amu 44) desorbing from the freshly prepared sample during the heating process. The inset of the figure plots our previously obtained TGA result including the raw data (black curve) and its derivative curve (red) for a comparison (Li et al., 2019). The combined results show that the process consists of 3 steps of mass change. In the 1st step at around 380°C, about 8.5% loss of total mass is observed which is identified as H2O desorption within a narrow 50°C temperature range. A small CO2 desorption signal (∼2% of water) is also detected at this step. No more water signal is observed in later TPD process, and this step is considered as sample dehydration. In the 2nd step at about 530°C, around 2.5% loss of total mass is observed which is identified as partial carbonate decomposition since it is accompanied by CO2 desorption. Finally, within 3rd step at around 700°C, about 3.0% mass loss is observed and identified as the complete carbonate decomposition accompanied by CO2 desorption (Li et al., 2019). The MS signal indicates the two CO2 desorption peaks which are much broader than the water related one. The higher temperature CO2 desorption peak is less intense than the lower temperature peak manifesting itself as a shoulder. After heating to 800°C, TGA demonstrates the total sample mass leftover is 9.0 mg. As mentioned in the introduction section, the sample after in situ heating up to this temperature is pure La2O3. Applying the recorded mass loss and the knowing molar masses, the molar ratio of H2O:CO2:La2O3 is roughly 3.4:1:2. In literature (Hou et al., 2015), similar three steps of mass loss were reported before. The transformations during the heating were explained as follows: in the 1st step, a mixture of La2(OH)4CO3 and La(OH)3 phases are decomposed forming La2O2CO3 and LaOOH, respectively, both yielding H2O as desorbed product. During the 2nd and 3rd steps, La2O2CO3 is decomposed to La2O3 yielding CO2 in two stages at ∼ 520 and 700°C.
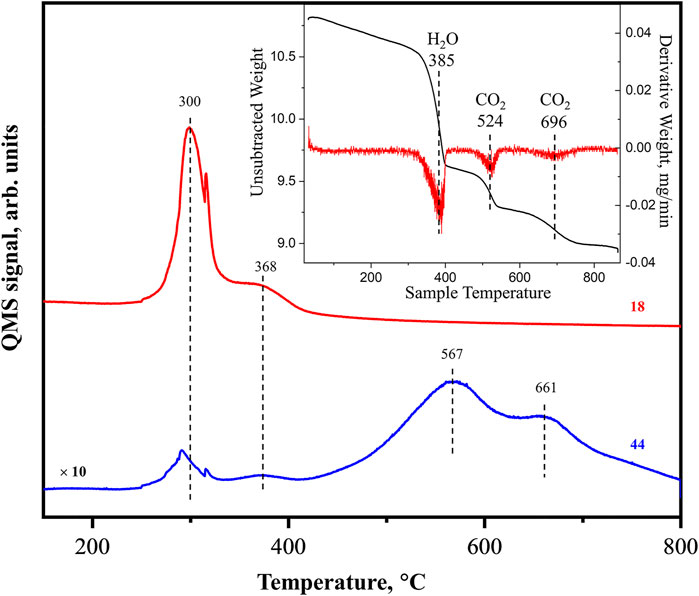
FIGURE 2. MS data of as-prepared La2O3 sample heated from room temperature to 800°C, showing the desorption signal of H2O (amu = 18, red) and CO2 (amu = 44). Inset: Thermogravimetric analysis (TGA) weight loss curve of La2O3 sample under N2 flow (black) and derivative (red) from Li et al. (2019).
In Situ Heating From Room Temperature to 400°C (Sample Dehydration)
Supplementary Figure S1 presents C 1s and O 1s photoelectron spectra of an as-prepared fresh sample and after in situ precleaning procedure by heating in vacuum at 800°C for 1 h. The C 1s spectrum of the as-prepared sample shows two main peaks with similar intensities: the adventitious carbon peak at 284.6 eV and a higher binding energy peak at 289.5 eV associated with carbonate. The O 1s spectrum of the as-prepared fresh sample has three features: a main peak at 531.0 eV and two relatively small shoulders at 532.3 and 528.7 eV. The shape of C 1s and O 1s spectra correlate very well with our previously published data (Li et al., 2019). After in situ precleaning procedure by heating in vacuum, both carbon features are removed. The O 1s spectrum after in situ cleaning shows one main peak at 529.8 eV assigned to lattice oxygen in La2O3 and a broad shoulder at 531.6 eV assigned to La peroxide (Zhou et al., 2021).
The above O 1s and C 1s peaks on the as-prepared surface are related to carbonates, adventitious carbon, and lattice oxygen. However, BE of these peaks are all somehow different from the peaks obtained for the in situ cleaned surface, although they are all calibrated with the La 4d peak as the standard procedure in our previous work (Li et al., 2019). This indicates that the actual species composition of the as-prepared surface could be more complex than the adsorbates in situ formed on the precleaned La2O3. To in situ investigate the surface electronic structure evolution of the catalyst during the sample precleaning process, the C 1s and O 1s core level spectra of the as-prepared fresh sample are obtained during simultaneous step heating directly in SAC of the XPS spectrometer. In addition, the similar heating process is also conducted in the in situ XRD reactor with the same heating profile. Comparing the two sets of data, the substantial bulk and surface electronic structure changes before and after the heating procedure are considered in multiple gradually changing steps. The results are presented following these steps of heating.
Figure 3A shows four in situ XRD patterns of the as-prepared fresh sample obtained at room temperature, 200, 300, and 400°C in comparison to PDF reference data for standard La compounds. At room temperature and 200°C, the sample bulk structure is dominated by La(OH)3. After the sample is heated to 300°C, the XRD pattern is significantly changed. Comparing with known PDF database, the main peaks in La(OH)3 diffraction pattern are not observed in the new pattern, suggesting that the La(OH)3 is completely decomposed. TGA and MS results above also support that heating to 300°C is accompanied by simultaneously removing most of hydroxide species from the bulk. Therefore, the main contamination in the sample bulk should be carbonates. However, the peaks in the new XRD patterns obtained at 300 and 400°C [attributed mainly to tetragonal La2O2CO3 (011)] are not found in good consistency with any single XRD PDF of the known La-based compounds. In addition, all the peaks obtained, such as the one with the highest intensity at 30.3°, are very broad, which indicates that after heating to 300°C, the new crystallization is only started forming very small grains. Most of the peaks in the obtained experimental XRD patterns can be covered by superposition of the tetragonal La2O2CO3 and hexagonal La2O3 PDF data. The behavior of XRD pattern suggests that the carbonate is highly dispersed in the sample below 300°C. However, there are still a few broad peaks in the experimental curves which are different from the carbonate and oxide references. This indicates that the sample, after being exposed to air and contaminated, is still not only a mixture of La(OH)3 and La2O2CO3 but also contains other complex compounds, such as La2(OH)4CO3 or LaOOH.
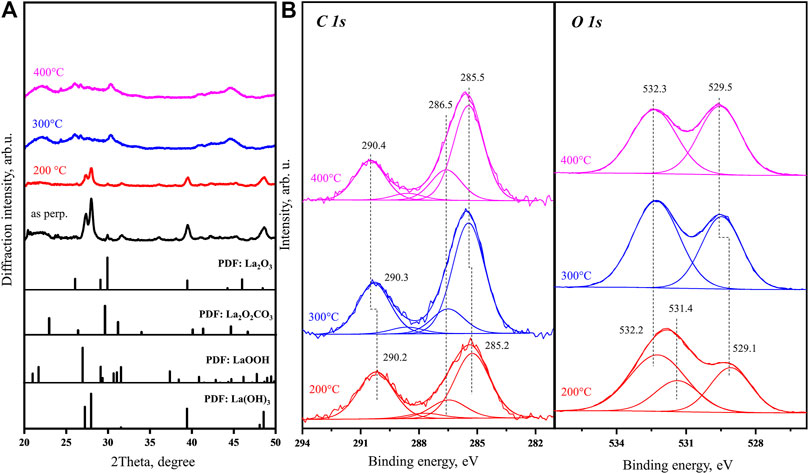
FIGURE 3. (A)In situ XRD patterns obtained for as-prepared fresh La2O3 sample at room temperature, 200, 300, and 400°C with PDF database of La(OH)3, La2O2CO3, LaOOH, and La2O3 as reference. (B)In situ C 1s and O 1s core level XPS spectra obtained for an as-prepared fresh nanorod La2O3 sample held at 200, 300, and 400°C.
The in situ XP spectra obtained for the same batch of sample are shown in Figure 3B. As the sample is in situ heated up to 200°C, the C 1s peak shape is not changed significantly. The O 1s spectrum taken at 200°C shows the 529.1 eV peak which can be assigned to La2O3 lattice oxygen (Sunding et al., 2011) and a broad higher BE peak which can be deconvoluted into two features at 531.4 and 532.2 eV. We associate these peaks with surface hydroxide and carbonate, respectively, taking into account our previous data for lanthanum oxide after interaction with H2O and CO2 (Li et al., 2019). At 300 and 400°C, the observed spectra are already in good agreement (less than 0.3 eV in peaks BE difference) with our previously published calibrated results for carbonated surface (Li et al., 2019). The O 1s and C 1s spectra show clear carbonate peaks with binding energies 532.5 and 290.5 eV. 532.5 eV is typical position of the oxygen in the CO32- group, either carbonate on La2O3 surface or bulk La2O3CO3 (Li et al., 2019; Pang et al., 2021). The O 1s spectrum also shows a sharp oxygen peak with binding energy of 529.5 eV. As mentioned before, 529.5 eV peak is generally assigned to lattice oxygen in La2O3. Our recent study demonstrated that it can also be associated with 4-coordinated oxygen (O4c) in (La2O22+)n layer of bulk La2O2CO3 (Pang et al., 2021). No hydroxyl peak in O 1s spectra is observed at 300 and 400°C as the TGA and MS data also indicate that the sample dehydration at this temperature is nearly complete. These XPS spectra support that heating of the as-prepared fresh sample to 400°C results in nearly complete dehydration with carbonate species on the surface starting to show up.
Comparison of the in situ data provides a more comprehensive assignment of the 528.7 eV peak observed in the O 1s spectrum of the as-prepared fresh sample (Supplementray Figure S1). An earlier publication assigned this low binding energy shoulder to lattice oxygen of La2O3 (Baškys et al., 2014; Jiang et al., 2016); other researchers attribute this peak to oxygen atoms formed after partial dehydration of La(OH)3 in vacuum or due to X-ray irradiation (Sunding et al., 2011). In above heating from room temperature to 400°C, the initial 528.7 eV O 1s peak observed in our in situ experiments is clearly approaching the BE of 529.8 eV. Our previous results revealed that the O 1s binding energy of hydroxyl is exclusively around 531.8 eV, which cannot be associated with either 529.5 eV or the 528.7 eV (Li et al., 2019). On the other hand, in situ XRD results indicate that there is no La2O3 phase at 200°C. The combined TGA and XRD results also support that the sample is changed from a mixture of La(OH)3 and La2O2CO3 at 200°C to a mixture of La2O2CO3 and La2O3 at 400°C during a gradual dehydration. For the O 1s peak with binding energy at ∼ 529.5 eV observed at 400°C, our previous publication assigned it to either the characteristic lattice oxygen species [(O4c) and (O6c)] in La2O3 or the (O4c) in the (La2O22+)n layer of bulk La2O2CO3 (Pang et al., 2021). Figure 3 shows that this peak could be as low as 528.7 eV on the as-prepared fresh sample with heavy concentration of hydroxyl species. As the temperature approaching 400°C, this peak moves to 529.5 eV. On the other hand, the behaviors of other O 1s and C 1s features show similar shifting during the dehydration procedure. At 200°C, the dominant peak in O 1s spectrum of the as-prepared fresh sample with binding energy 531.0 eV also slightly shifts to higher value of 531.5 eV, which is the characteristic peak position for hydroxyl. In reverse to the other peaks, the intensity of the hydroxyl peak, during its shifting process, is continuously decreasing. This is in agreement with the online MS result of water loss in this temperature range. In the C 1s spectra, the original 289.5 eV peak of the as-prepared fresh sample shifts gradually to 290.2 eV (200°C), 290.3 eV (300°C), and 290.4 eV (400°C), approaching the characteristic binding energy of carbonates (290.5 eV). Noticing that along with dehydration in UHV, the carbonate peak intensity is continuously increasing; this indicates that the as-prepared fresh sample surface is enriched with hydroxyl. Overall, the O 1s and C 1s spectra obtained below 300°C do not have typical features fully consistent with carbonates, hydroxyl, or La2O3 lattice oxygen species. As suggested from the XRD results above, in the as-prepared fresh sample, carbonate is highly dispersed in La(OH)3 phase. The strong interaction between carbonate and hydroxide or formed complex compounds does have an effect on the electronic structure.
In the end, the CO32− group is the only species with consistent O 1s binding energy in Figure 3B. Keeping the hydroxyl peak with fixed FWHM, fitting of the O 1s spectrum taken at 200°C results in a carbonate peak at 532.2 eV and hydroxyl peak at 531.4 eV. At 300°C, the hydroxyl peak disappears and the O 1s spectrum can be well fitted with two peaks. After heating to 400°C, the carbonate O 1s peak relative intensity continuously decreases, which agrees well with the increase of the carbonate (O4c) species discussed above. At 400°C, the carbonate-related O 1s peak is observed at 532.3 eV, which is initially (in the as-prepared sample) a small shoulder at the same position.
The behavior of the other C 1s main peak at 284.6 eV is rather elusive for a simple explanation comparing with the other features. It is generally attributed to adventitious carbon accumulated on a sample surface before XPS analysis. In this section, only an objective description is provided and a tentative assignment is provided at the end on the basis of all results. Binding energy of this peak increases to 285.2 eV (200°C) and 285.5 eV (300 and 400°C). The atomic percentage of this peak carbon increases from 14 to 20% as the sample heated from 200 to 400°C (Supplementary Table S1). The assignment of this peak will be provided at the end of the whole in situ heating process description.
Combining the XPS and XRD results, it clearly suggests that the as-prepared fresh sample, although to be synthesized as La(OH)3, is rather easy to absorb CO2 from air (during synthesis and preparation on XPS sample holder) forming highly dispersed carbonate compounds in the bulk. If the sample is kept at temperature lower than 200°C, La(OH)3 still dominates in the bulk structure, and especially in the near surface region.
In Situ Heating From 500 to 800°C
Taking into account previous literature studies (Chen et al., 2014), TGA and online MS results, there are 3 steps in which the adsorbed species desorb or decompose during the heating (in the range 25–800°C). As the sample temperature continues to approach 600°C, in situ XRD obtained at this step demonstrates the patterns similar to that obtained at 300 and 400°C. The main difference is that the peaks become sharper than in the patterns collected at lower temperatures indicating the polycrystalline grain size is increasing. Following the 1st step (25–400°C) data presented in Figure 3, the surface electrical structure transformation during the 2nd step (400–600°C) is investigated. Increasing temperature to 500°C gives rise to further decrease of carbonate feature at 290.4 eV in the C 1s spectrum. Meanwhile, in the O 1s spectrum, the intensity of carbonate component at 532.5 eV changes from slightly higher than the lattice oxygen peak to significantly lower.
Carbonate thermal decomposition of bulk La2O2CO3 through online MS-measured TPD has been studied in our recent publication (Guan et al., 2021). It was concluded that the desorbed CO2 within temperature range from 400 to 600°C is mostly related to carbonates located on the surface and subsurface sites. As the result, the CO2 loss observed by TGA and online MS in Figure 2 does not significantly affect the XRD pattern as this step does not include decomposition of the bulk components. On the other hand, XPS, as a surface sensitive method, indicates that the surface carbonate species content gradually reduced by heating. Overall, the TGA/MS, in situ XRD, and XPS agree very well with each other confirming the CO2 removal in the 2nd step is mostly related with surface and subsurface carbonates.
The online MS and TGA show that most of the CO2 desorption are depleted at the temperature of 700°C and higher. The XRD patterns (Figure 4A) obtained at 800°C agree well with the PDF file of La2O3, which confirms that most of the bulk carbonates are decomposed. The XPS data collected in the same temperature range also show no carbonate features in C 1s and O 1s spectra (Figure 4B). In the C 1s spectra, there is a main peak at 285.0 eV with shoulder peaks at 286.1 and 287.6 eV. According to the literature and our previous study results (Li et al., 2019), the main peak (at 285.0 eV) is attributed to the surface C–C feature, while the shoulder peaks are related to partially oxidized species, like C=O and C-O=C. On the other hand, in the O 1s spectra, the characteristic peak associated with the carbonate is gradually replaced by another new small shoulder, which is located at 532.0 eV at 800°C and at 531.8 eV after subsequently cooling to room temperature, while the main oxygen peak (529.8 eV) remains at the same position. Combined with our recent experimental results (Zhou et al., 2021), the small shoulder peak at 531.8 eV is assigned to the partially oxidized surface carbon species, which demonstrates the corresponding C 1s peak at 286.1 eV. According to the previous discussion, the main oxygen peak at 529.8 eV is the characteristic peak of the lattice oxygen in La2O3, which is the only La-containing species at this step. At temperatures higher than 400°C, when hydroxide is completely decomposed, the slow two-step carbonate decomposition process of first bulk carbonate (through the surface) and then surface carbonate can be easily correlated with in situ La2O2CO3 decomposition considered in Figure 1. The results indicate that only after heating to 800°C in an inert environment, the air exposed and stabilized La(OH)3 sample can be fully recovered to La2O3. This is also supported by the La 3d 5/2 spectra taken from room temperature to 800°C (Supplementary Figure S2), of which the peak splitting is increased from 3.8 to 4.6 eV, which also confirms that on the surface, carbonates and hydroxyl contamination is gradually removed and pure La2O3 is formed (Li et al., 2019).
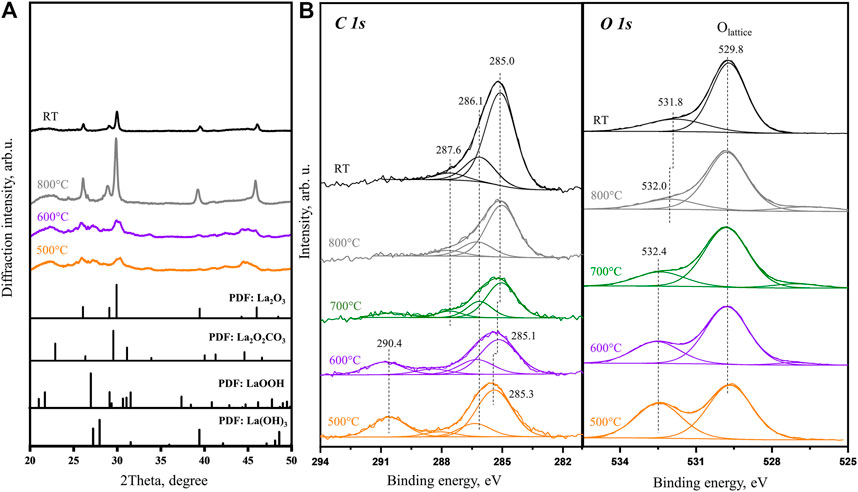
FIGURE 4. (A)In situ XRD patterns obtained for La2O3 sample at 500, 600, and 800°C with PDF database of references. (B)In situ XPS C 1s and O 1s core level spectra obtained at 500, 600, 700, and 800°C and after subsequent cooling to room temperature.
The evolution of both oxygen and carbon components depending on heating temperature is summarized in Figure 5. The C 1s binding energy of carbonate species is clearly approaching the previous calibrated characteristic values as discussed above. On the other hand, the lower binding energy peak in the C 1s spectra is always higher (285.0–285.5 eV) than the generally accepted value of adventitious carbon (284.8 eV). It is shown that the binding energy of this peak first goes up during the dehydration step and then decreases afterward. As the sample is heated to 700°C, this peak position is stabilized at a slightly higher position of 285.0 eV. Such a behavior of binding energy variation suggests that there is differential charging associated with carbon species. Unlike the bulk species of carbonates and oxide, the adventitious carbon is a surface species. During the heating, the sample volume is significantly reduced as the TGA above observes a relatively high mass loss of water and CO2 (molar ratio of H2O:CO2:La2O3 is roughly 3.4:1:2). The significant volume change can result in a loss of electrical contact between surface carbon species and the bulk of the sample which explains the charging built up during XP spectra collection.
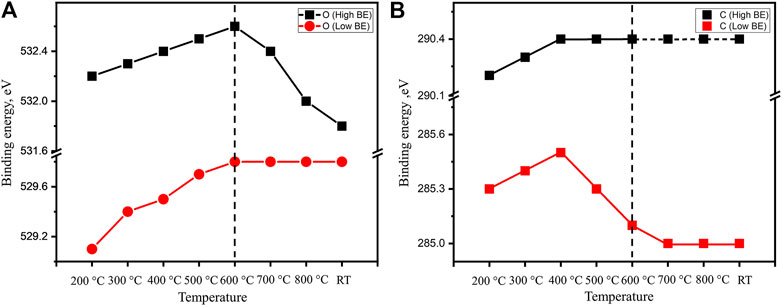
FIGURE 5. The binding energy evolution of main features in (A) O 1s and (B) C 1s of an as-prepared fresh La2O3 sample during the in situ hold at 200, 300, 400, 500, 600, 700, and 800°C and after following cooling to room temperature.
Conclusions
The temperature-correlated structure changes of two most popular La-related contamination species, in situ–prepared La2O2CO3 and ex situ–prepared La(OH)3, are investigated by in situ XPS, in situ XRD, and online MS. All observed species are further interpreted by previous obtained characteristic assignments and DFT surface structure model. After heated up to 800°C, both samples are completely regenerated to La2O3. For La2O2CO3 sample, during linear heating to 800°C, a partial carbonate coverage near the surface region is always observed, which confirms the previously suggested two-step model of bulk carbonate decomposition. The ex situ–prepared La(OH)3 sample is a hybrid of carbonates and hydroxyl due to air exposure–induced contamination. Three major steps of catalyst structure phase changes are investigated by the three in situ methods. Evolution of surface structures showing the changes of hybrid phases with hydroxyl and carbonates is observed by XPS and XRD from 200 to 800°C. Results provide surface and bulk structure details of the two samples during the heating treatment which bring insight into the activation and deactivation of La-containing materials.
Data Availability Statement
The raw data supporting the conclusions of this article will be made available by the authors, without undue reservation.
Author Contributions
XZ: XPS MS experiments, data analysis and interpretation, and writing. EV: data interpretation, writing, review, and editing. YL: XPS experiments. CG: XRD experiments. YY: supervision, funding acquisition, writing, review, and editing—design of the study.
Funding
This study was supported by the National Natural Science Foundation of China (No. 92045301, 22072092), the Key Projects of Shanghai Science and Technology Commission (18JC1412100), and the Shell Foundation Grants (No. PT66201), and the startup funding was provided by ShanghaiTech University, Analytical Instrumentation Center (No. SPSTAIC10112914).
Conflict of Interest
The authors declare that the research was conducted in the absence of any commercial or financial relationships that could be construed as a potential conflict of interest.
Acknowledgments
The authors would like to acknowledge the Shell Global Solutions International B.V. for additional funding and, in particular, thank Carl Mesters and Alexander van der Made, from Shell Global Solutions International B.V., for the helpful discussions.
Supplementary Material
The Supplementary Material for this article can be found online at: https://www.frontiersin.org/articles/10.3389/fchem.2021.694559/full#supplementary-material
References
Alcalde-Santiago, V., Davó-Quiñonero, A., Bailón-García, E., Lozano-Castelló, D., and Bueno-López, A. (2020). Copper-Lanthanum Catalysts for NOx and Soot Removal. ChemCatChem. 12, 6375–6384.
Aseem, A., Jeba, G. G., Conato, M. T., Rimer, J. D., and Harold, M. P. (2018). Oxidative Coupling of Methane over Mixed Metal Oxide Catalysts: Steady State Multiplicity and Catalyst Durability. Chem. Eng. J. 331, 132–143. doi:10.1016/j.cej.2017.08.093
Baškys, E., Bondarenka, V., Grebinskij, S., Senulis, M., and Sereika, R. (2014). XPS Study of Sol–Gel Produced Lanthanum Oxide Thin Films. Lith. J. Phys. 54, 120–124.
Brugge, R. H., Pesci, F. M., Cavallaro, A., Sole, C., Isaacs, M. A., Kerherve, G., et al. (2020). The Origin of Chemical Inhomogeneity in Garnet Electrolytes and its Impact on the Electrochemical Performance. J. Mater. Chem. A. 8, 14265–14276. doi:10.1039/d0ta04974c
Chen, G., Han, B., Deng, S., Wang, Y., and Wang, Y. (2014). Lanthanum Dioxide Carbonate La2O2CO3 Nanorods as a Sensing Material for Chemoresistive CO2 Gas Sensor. Electrochimica Acta 127, 355–361. doi:10.1016/j.electacta.2014.02.075
Deboy, J. M., and Hicks, R. F. (1988). The Oxidative Coupling of Methane over Alkali, Alkaline Earth, and Rare Earth Oxides. Ind. Eng. Chem. Res. 27, 1577–1582. doi:10.1021/ie00081a004
Dong, C. L., and Vayssieres, L. (2018). In Situ/Operando X‐ray Spectroscopies for Advanced Investigation of Energy Materials. Chem. Eur. J. 24, 18356–18373. doi:10.1002/chem.201803936
Dong, S., Chen, M., Zhang, J., Chen, J., and Xu, Y. (2020). Visible-Light-Induced Hydrogenation of Biomass-Based Aldehydes by Graphitic Carbon Nitride Supported Metal Catalysts (Green Energy & Environment). doi:10.1016/j.gee.2020.07.004
Dou, J., Sun, Z., Opalade, A. A., Wang, N., Fu, W., and Tao, F. (2017). Operando Chemistry of Catalyst Surfaces during Catalysis. Chem. Soc. Rev. 46, 2001–2027. doi:10.1039/c6cs00931j
Duan, N., Yang, J., Gao, M., Zhang, B., Luo, J.-L., Du, Y., et al. (2020). Multi-functionalities Enabled Fivefold Applications of LaCo0.6Ni0.4O3−δ in Intermediate Temperature Symmetrical Solid Oxide Fuel/electrolysis Cells. Nano Energy 77, 105207. doi:10.1016/j.nanoen.2020.105207
Galadima, A., and Muraza, O. (2016). Revisiting the Oxidative Coupling of Methane to Ethylene in the golden Period of Shale Gas: A Review. J. Ind. Eng. Chem. 37, 1–13. doi:10.1016/j.jiec.2016.03.027
Gambo, Y., Jalil, A. A., Triwahyono, S., and Abdulrasheed, A. A. (2018). Recent Advances and Future prospect in Catalysts for Oxidative Coupling of Methane to Ethylene: A Review. J. Ind. Eng. Chem. 59, 218–229. doi:10.1016/j.jiec.2017.10.027
Gao, Y., Neal, L., Ding, D., Wu, W., Baroi, C., Gaffney, A. M., et al. (2019). Recent Advances in Intensified Ethylene Production-A Review. ACS Catal. 9, 8592–8621. doi:10.1021/acscatal.9b02922
Guan, C., Yang, Y., Pang, Y., Liu, Z., Li, S., Vovk, E. I., et al. (2021). How CO2 Poisons La2O3 in an OCM Catalytic Reaction: A Study by In Situ XRD-MS and DFT. J. Catal. 396, 202–214. doi:10.1016/j.jcat.2021.02.017
Han, Y., Zhang, H., Yu, Y., and Liu, Z. (2021). In Situ Characterization of Catalysis and Electrocatalysis Using APXPS. ACS Catal. 11, 1464–1484. doi:10.1021/acscatal.0c04251
Hou, Y.-H., Han, W.-C., Xia, W.-S., and Wan, H.-L. (2015). Structure Sensitivity of La2O2CO3 Catalysts in the Oxidative Coupling of Methane. ACS Catal. 5, 1663–1674. doi:10.1021/cs501733r
Hu, C., Chang, C.-W., Yoshida, M., and Wang, K.-H. (2021). Lanthanum nanocluster/ZIF-8 for Boosting Catalytic CO2/glycerol Conversion Using MgCO3 as a Dehydrating Agent. J. Mater. Chem. A 9. doi:10.1039/D0TA12413C
Huang, P., Zhao, Y., Zhang, J., Zhu, Y., and Sun, Y. (2013). Exploiting Shape Effects of La2O3 Nanocatalysts for Oxidative Coupling of Methane Reaction. Nanoscale 5, 10844–10848. doi:10.1039/c3nr03617k
Ishisone, K., Isobe, T., Matsushita, S., Wakamura, M., Oshikiri, M., and Nakajima, A. (2021). Lao1.5 Surface Modification of Titanium-Substituted Hydroxyapatite Photocatalyst and Effects on 2-propanol Photocatalytic Decomposition Mechanisms. Appl. Catal. B: Environ. 283, 119658. doi:10.1016/j.apcatb.2020.119658
Jiang, T., Song, J., Huo, M., Yang, N., Liu, J., Zhang, J., et al. (2016). La2O3 Catalysts with Diverse Spatial Dimensionality for Oxidative Coupling of Methane to Produce Ethylene and Ethane. RSC Adv. 6, 34872–34876. doi:10.1039/c6ra01805j
Karuppiah, C., Thirumalraj, B., Alagar, S., Piraman, S., Li, Y.-J. J., and Yang, C.-C. (2021). Solid-State Ball-Milling of Co3O4 Nano/Microspheres and Carbon Black Endorsed LaMnO3 Perovskite Catalyst for Bifunctional Oxygen Electrocatalysis. catalysts 11, 76. doi:10.3390/catal11010076
Lacombe, S., Geantet, C., and Mirodatos, C. (1995). Oxidative Coupling of Methane over Lanthana Catalysts. J. Catal. 151, 439–452. doi:10.1006/jcat.1995.1046
Le, T. A., Kim, Y., Kim, H. W., Lee, S.-U., Kim, J.-R., Kim, T.-W., et al. (2021). Ru-supported Lanthania-Ceria Composite as an Efficient Catalyst for COx-free H2 Production from Ammonia Decomposition. Appl. Catal. B: Environ. 285, 119831. doi:10.1016/j.apcatb.2020.119831
Lee, J. (2020). MOF-derived 1D Hollow Bimetallic Iron(iii) Oxide Nanorods: Effects of Metal-Addition on Phase Transition, Morphology and Magnetic Properties. CrystEngComm. 22, 8081–8087. doi:10.1039/d0ce01440k
Levan, T., Che, M., Tatibouet, J. M., and Kermarec, M. (1993). Infrared Study of the Formation and Stability of La2O2CO3 during the Oxidative Coupling of Methane on La2O3. J. Catal. 142, 18–26. doi:10.1006/jcat.1993.1185
Li, J. P. H., Zhou, X., Pang, Y., Zhu, L., Vovk, E. I., Cong, L., et al. (2019). Understanding of Binding Energy Calibration in XPS of Lanthanum Oxide by In Situ Treatment. Phys. Chem. Chem. Phys. 21, 22351–22358. doi:10.1039/c9cp04187g
Liu, Z., Ho Li, J. P., Vovk, E., Zhu, Y., Li, S., Wang, S., et al. (2018). Online Kinetics Study of Oxidative Coupling of Methane over La2O3 for Methane Activation: What Is behind the Distinguished Light-Off Temperatures?. ACS Catal. 8, 11761–11772. doi:10.1021/acscatal.8b03102
Nguyen, L., Tao, F. F., Tang, Y., Dou, J., and Bao, X.-J. (2019). Understanding Catalyst Surfaces during Catalysis through Near Ambient Pressure X-ray Photoelectron Spectroscopy. Chem. Rev. 119 (12), 6822-6905. doi:10.1021/acs.chemrev.8b00114
Pang, Y., Zhou, X., Vovk, E. I., Guan, C., Li, S., Van Bavel, A. P., et al. (2021). Understanding Lanthanum Oxide Surface Structure by DFT Simulation of Oxygen 1s Calibrated Binding Energy in XPS after In Situ Treatment. Appl. Surf. Sci. 548, 149214. doi:10.1016/j.apsusc.2021.149214
Sollier, B. M., Gómez, L. E., Boix, A. V., and Miró, E. E. (2018). Oxidative Coupling of Methane on Cordierite Monoliths Coated with Sr/La2O3 Catalysts. Influence of Honeycomb Structure and Catalyst-Cordierite Chemical Interactions on the Catalytic Behavior. Appl. Catal. A: Gen. 550, 113–121. doi:10.1016/j.apcata.2017.10.023
Song, J., Sun, Y., Ba, R., Huang, S., Zhao, Y., Zhang, J., et al. (2015). Monodisperse Sr-La2O3 Hybrid Nanofibers for Oxidative Coupling of Methane to Synthesize C2 Hydrocarbons. Nanoscale 7, 2260–2264. doi:10.1039/c4nr06660j
Sun, W., Ma, C., Tian, X., Liao, J., Yang, J., Ge, C., et al. (2020). An Amorphous Lanthanum-Iridium Solid Solution with an Open Structure for Efficient Water Splitting. J. Mater. Chem. A. 8, 12518–12525. doi:10.1039/d0ta03351k
Sunding, M. F., Hadidi, K., Diplas, S., Løvvik, O. M., Norby, T. E., and Gunnæs, A. E. (2011). XPS Characterisation of In Situ Treated Lanthanum Oxide and Hydroxide Using Tailored Charge Referencing and Peak Fitting Procedures. J. Electron Spectrosc. Relat. Phenomena 184, 399–409. doi:10.1016/j.elspec.2011.04.002
Taifan, W., and Baltrusaitis, J. (2016). CH 4 Conversion to Value Added Products: Potential, Limitations and Extensions of a Single Step Heterogeneous Catalysis. Appl. Catal. B: Environ. 198, 525–547. doi:10.1016/j.apcatb.2016.05.081
Vovk, G., Chen, X., and Mims, C. A. (2005). In Situ XPS Studies of Perovskite Oxide Surfaces under Electrochemical Polarization†. J. Phys. Chem. B 109, 2445–2454. doi:10.1021/jp0486494
Xu, Y., Yu, L., Cai, C., Huang, J., and Guo, X. (1995). A Study of the Oxidative Coupling of Methane over SrO-La2O3/CaO Catalysts by Using CO2 as a Probe. Catal. Lett. 35, 215–231. doi:10.1007/bf00807178
Zhang, M., Wang, M., Xu, B., and Ma, D. (2019). How to Measure the Reaction Performance of Heterogeneous Catalytic Reactions Reliably. Joule.
Keywords: in situ XPS, in situ XRD, online MS, La2O3, reactivation
Citation: Zhou X, Vovk EI, Liu Y, Guan C and Yang Y (2021) An In Situ Temperature-Dependent Study of La2O3 Reactivation Process. Front. Chem. 9:694559. doi: 10.3389/fchem.2021.694559
Received: 13 April 2021; Accepted: 07 May 2021;
Published: 31 May 2021.
Edited by:
Shihui Zou, Zhejiang University, ChinaReviewed by:
Liangshu Zhong, Shanghai Advanced Research Institute (CAS), ChinaYunqian Dai, Southeast University, China
Copyright © 2021 Zhou, Vovk, Liu, Guan and Yang. This is an open-access article distributed under the terms of the Creative Commons Attribution License (CC BY). The use, distribution or reproduction in other forums is permitted, provided the original author(s) and the copyright owner(s) are credited and that the original publication in this journal is cited, in accordance with accepted academic practice. No use, distribution or reproduction is permitted which does not comply with these terms.
*Correspondence: Yong Yang, eWFuZ3lvbmdAc2hhbmdoYWl0ZWNoLmVkdS5jbg==