 Tomas Marqueño1
 Mikhail A. Kuzovnikov1Israel Osmond1Phillip Dalladay-Simpson2
 Andreas Hermann1Ross T. Howie1,2
 Miriam Peña-Alvarez1*
- 1Centre for Science at Extreme Conditions (CSEC), The School of Physics and Astronomy, The University of Edinburgh, Edinburgh, United Kingdom
- 2Center for High Pressure Science and Technology Advanced Research, Shanghai, China
The reactivity between NaH and H2 has been investigated through a series of high-temperature experiments up to pressures of 78 GPa in diamond anvil cells combined with first principles calculations. Powder X-ray diffraction measurements show that heating NaH in an excess of H2 to temperatures around 2000 K above 27 GPa yields sodium trihydride (NaH3), which adopts an orthorhombic structure (space group Cmcm). Raman spectroscopy measurements indicate that NaH3 hosts quasi-molecular hydrogen (
1 Introduction
The synthesis of metallic alloys hosting hydrogen at high pressures has attracted significant interest, especially after the suggestion of their potential high-temperature superconductivity (Ashcroft, 2004). This was demonstrated by the pioneering work on LaH10 with a critical temperature (Tc) of Tc = 250 K at 170 GPa (Drozdov et al., 2019; Somayazulu et al., 2019). However, there are essential aspects of high pressure hydrides that must be understood in order to provide an efficient route towards desired target properties. The alkali metal lithium was one of the first systems studied as a promising hydrogen host for superconductivity (Zurek et al., 2009). However, experimentally these compounds have proven difficult to synthesize, with some spectroscopic evidence that LiH reacts with H2 and transforms into LiH2 and LiH6 above 130 GPa hosting molecular hydrogen, which would prevent any favorable electron phonon coupling (Howie et al., 2012; Pépin et al., 2015).
Subsequent first principles simulations predicted that all of the heavier alkali metals could form highly stoichiometric hydrides (Baettig and Zurek, 2011; Hooper and Zurek, 2012; Shamp et al., 2012; Hooper et al., 2013; Shipley et al., 2021). Some of them such as KHn with n > 1 could also form stable polyhydrides at pressures as low as 3 GPa (Hooper and Zurek, 2012). Despite these theoretical predictions, only the hydrides of lithium (Pépin et al., 2015) and sodium (Struzhkin et al., 2016) have been experimentally approached. This is due to the experimental difficulties arising from studying alkali elements, which instantly react with the oxygen and water present in the atmosphere. The high reactivity of the alkali metals is the cause why there are very few studies on their polyhydrides.
Structural searches suggest that alkali metal polyhydrides are some of the best candidates for high Tc superconductivity among all possible binary hydrides (Shipley et al., 2021), with high predicted Tc values at lower pressures than those required for previously observed superconducting rare earth hydrides. In particular, superconductivity is predicted in Na2H11 (Tc ∼ 150 K at 100 GPa) and in NaH6, where Tc predictions range from 180 to 260 K at 50 and 100 GPa respectively (Chen et al., 2021; Shipley et al., 2021). The Na-H system has previously been studied experimentally up to 50 GPa, forming NaH3 (Cmcm) and NaH7 (Cc) above 40 GPa and 2000 K Struzhkin et al. (2016). Analogous to the lithium polyhydrides, NaH3 and NaH7 have been described to host quasi-molecular hydrogen. Thus, the sodium-hydrogen system remains experimentally unexplored above 50 GPa.
In this work, we explore the reactivity of the NaH-H2 system up to pressures of
2 Experimental details
Diamond anvil cells were prepared with diamond culet sizes of 80–200 μm, with the sample chamber formed by pre-indentation and laser drilling of a Re gasket. Sodium monohydride (Sigma Aldrich, 95% dry) was loaded into the sample chambers in an inert argon atmosphere glove box to prevent the oxidation of NaH. This was loaded together with small grains of gold powder used as a pressure calibrant for XRD experiments (Fei et al., 2007). The DACs were subsequently loaded with research grade (99.9999%) hydrogen gas at 2000 bar. The samples were heated using a 1,064 nm YAG laser. A summary of the experiments performed with each sample is given in Supplementary Table S1 in the Supplementary Data.
The XRD measurements were performed at the Sector 13 (GSECARS) beamline at the Advanced Photon Source (ANL, United States) (Shen et al., 2005; Prakapenka et al., 2008) and the P02.2 Extreme Conditions Beamline at PETRA-III (DESY, Germany) (Liermann et al., 2015). The relevant details of the beamline regarding our experiments are summarized in Supplementary Table S2 (Supplementary Data). The integration of the XRD patterns was performed using DIOPTAS (Prescher and Prakapenka, 2015). The analysis and refinement of the obtained XRD patterns were carried out using the software packages PowderCell and GSAS-II (Kraus and Nolze, 1996; Toby and Von Dreele, 2013).
Raman measurements of the samples were acquired using a custom-built confocal microfocused Raman setup with 514.5 nm Ar-ion laser excitation source, equipped with a PyLoN:100 cryogenically cooled CCD camera (1,340 × 100 sensor). In order to measure Raman spectra in a wide range of frequencies, a grating of 300 lines/mm was used. Pressure was monitored in Raman measurements using the frequency of the vibron of excess H2 (Howie et al., 2013), and cross-checked with the frequency of the stressed Raman edge of diamond (Akahama and Kawamura, 2006).
3 Computational details
Total energy density functional theory calculations were performed with the VASP package, using plane wave basis sets in conjunction with projector augmented wave (PAW) atomic data sets (Kresse and Furthmüller, 1996; Kresse and Joubert, 1999). The plane wave energy cutoff was 800 eV, Brillouin zone sampling used regular grids with linear k-point densities of 40/Å−1, and ‘hard’ PAW datasets that consider the 1s1/2s22p63s1 states as valence electrons, and have cutoff radii 0.8/2.2 Bohrs for H/Na, respectively. The structures were fully optimized over a range of pressures between 10 and 90 GPa, and until all atomic force components were below 1 meV/Å. Electronic exchange-correlation effects were described within the generalized gradient approximation, using the Perdew–Burke–Ernzerhof (PBE) parameterization (Perdew et al., 1996) and, for comparison, the semi-empirical Grimme D3 dispersion correction (Grimme et al., 2011) as well as the nonlocal vdW-DF optB88-vdW functional (Klimeš et al., 2010) (Supplementary Data, Supplementary Figure S1). Phonon calculations were performed using the finite-displacement method in suitable supercells of all Na-H compounds considered here (see Supplementary Material for details, Supplementary Figure S2); they were set up and analyzed using the phonopy and phonopy-spectroscopy packages (Togo and Tanaka, 2015; Skelton et al., 2017). Reaction enthalpies between NaH, NaH6, H2 to form NaH3 are shown in Supplementary Figure S3 (Supplementary Data).
4 Results
4.1 X-ray diffraction experiments
At room pressure and temperature, sodium hydride (NaH-I) crystallizes in a fcc structure analogous to that of NaCl (rock salt), in which hydrogen atoms occupy octahedral interstitial sites (Shull et al., 1948). Above
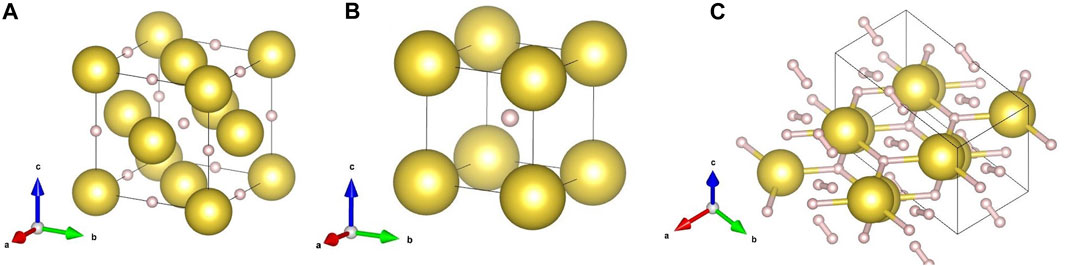
FIGURE 1. Relevant crystal structures of the Na-H system in our study: (A) NaH-I
NaH in H2 was compressed to 50 GPa and we did not observe the formation of any higher hydride with a larger hydrogen content, as shown in the bottom panel of 2 a). Since there are likely to be energy barriers preventing the chemical reaction between NaH and H2, we laser heated our sample at
in which we can use the volumes of NaH and H2 reported in the literature (Duclos et al., 1987; Loubeyre et al., 1996). The sum of the individual volumes per formula unit (f.u.) of NaH and H2 is displayed in Figure 3B for n = 1, 2 and 3 (Eq. 1). Experimental volumes are above and below the curves corresponding to n = 2 and 3, respectively. Thus, both XRD patterns and experimental volumes support the assignment to Cmcm-NaH3.
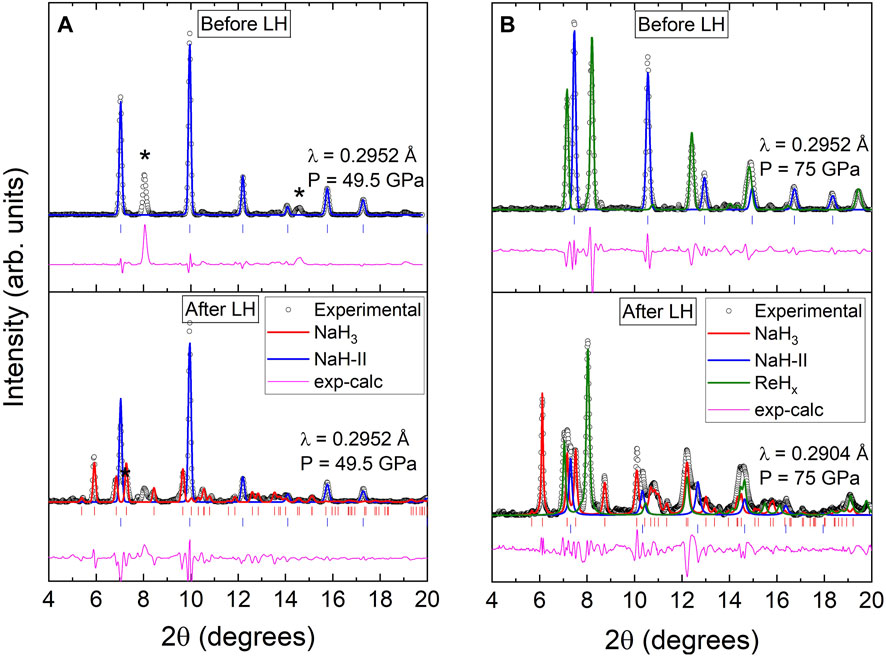
FIGURE 2. (A) & (B) Powder XRD pattern and LeBail refinements of two different samples before and after laser heating at 49.5 GPa and 75 GPa, respectively. Experimental data is represented by circles. The calculated contributions from NaH-II, Cmcm-NaH3 and hcp-ReHx phases are shown by the blue, red, and green curves, respectively. The reflections corresponding to NaH3 and NaH are indicated with red and blue ticks respectively. Asterisks in (A) indicate reflections associated with ReHx.
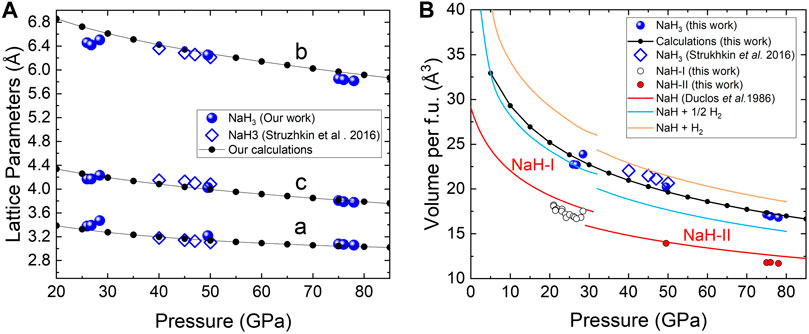
FIGURE 3. Pressure dependence of the (A) lattice parameters and (B) volume per formula unit of NaH3. The data obtained in our experiments is represented with blue spheres; small connected black dots stand for the results of our calculations. The data reported by Struzhkin et al. (2016) is depicted with diamonds. The red solid line stands for the volume-pressure curves of NaH (phases I and II) reported by Duclos et al. (1987). Blue and orange solid lines stand for the volume sums V(NaH) +
To investigate the stability range of NaH3, we heated subsequent samples below 50 GPa to temperatures in excess of 2000 K, where synthesis could be achieved as low as 30 GPa (see Supplementary Figure S4 in the Supplementary Data). Heating NaH + H2 at 75 GPa to similar temperatures converted a greater proportion of NaH to NaH3 than heating at either 27 GPa or 49.5 GPa. This could indicate greater stability and lower kinetic barriers to formation at higher pressure, but could also be due to differences in sample morphology. However, we did not observe any signatures of any other polyhydride compounds upon laser heating in the 30–75 GPa pressure range, with traces of the already reported NaH7 polyhydride (Struzhkin et al., 2016). These results agree with our theoretical predictions, which indicate that within the experimentally explored conditions NaH3 should form from NaH and H2, irrespective of exchange-correlation functional used (Supplementary Data, Supplementary Figures S1–S3). In the case of recently suggested NaH6 (Chen et al., 2021; Shipley et al., 2021), our calculations suggest that this polyhydride should react with NaH to form NaH3 at any pressure below 100 GPa (Supplementary Figure S3).
4.2 Raman scattering experiments
Prior to the heating of the sample, NaH-II exhibited no Raman activity, as it is shown in Supplementary Figure S6 (Supplementary Data) for a sample at
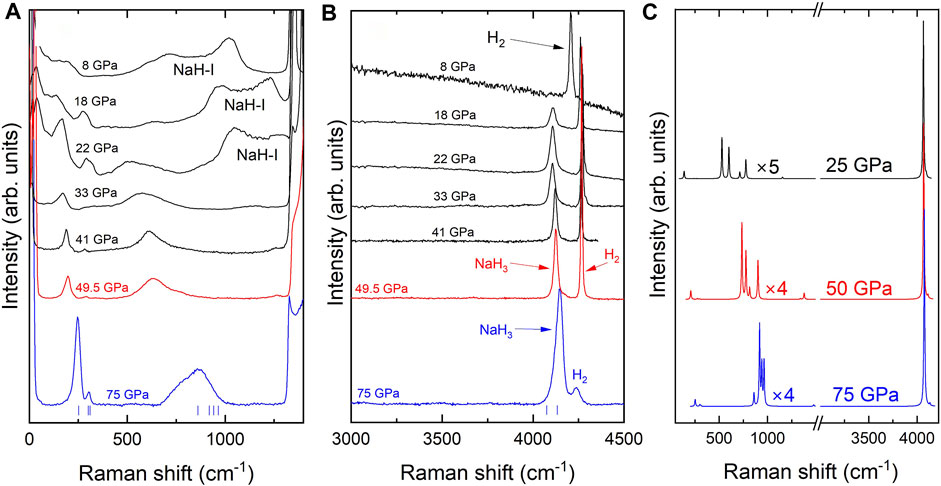
FIGURE 4. (A,B) Raman spectra of NaH3 samples. Blue and red solid lines correspond to NaH3 samples at 75 and 49.5 GPa, respectively, which were discussed in Figure 2. The black solid lines correspond to a different Raman experiment on NaH3 upon decompression from 41 to 8 GPa. Blue vertical ticks represent the simulated Raman frequencies of NaH3 at 75 GPa. (C) Simulated Raman spectra of NaH3 at 75, 50 and 25 GPa (blue, red and black lines, respectively). The peak intensities of the spectra below 1,500 cm−1 have been magnified by the indicated factors.
At frequencies below 1,200 cm−1, the Raman spectrum of NaH3 at 75 GPa is characterized by an intense, sharp mode at ∼ 250 cm−1, together with a lower intensity satellite mode at ∼ 300 cm−1 and a broad band at
At high frequency, the Raman spectrum of NaH3 is dominated by an intense mode at 4,145 cm−1 (at 75 GPa), which is directly related to the H-H stretching vibrations from quasi-molecular
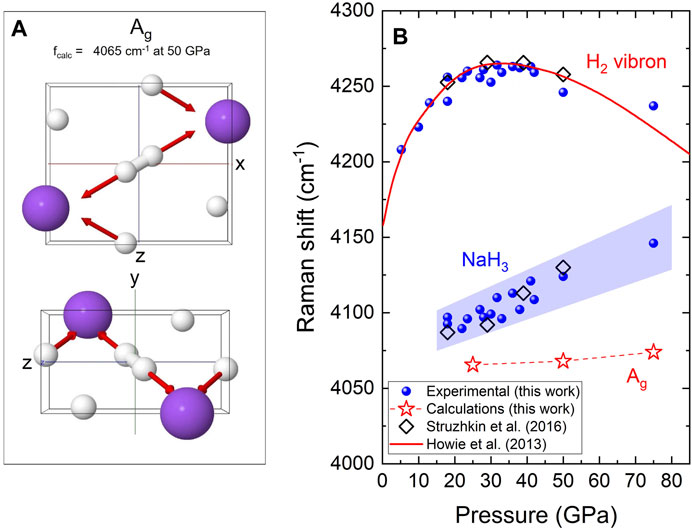
FIGURE 5. (A) Eigenmode corresponding to the
Interestingly, some NaH samples exhibited an intense photoluminescence background signal after exposure to X-ray radiation and IR laser used for heating. This can be attributed to the formation of color centers, which have previously been observed in studies of pure NaH Duclos et al. (1987); Williams (1962) and reported for isoelectronic alkaline halides such as NaF (Bryukvina et al., 2014). Furthermore, whilst the samples undergo a visual color change, appearing orange after X-ray irradiation at 75 GPa (Supplementary Figure S5B [Supplementary Data]), XRD mapping of the samples showing this photoluminescence did not reveal the formation of any other product or phase transition.
Figure 5B presents the Raman shift as a function of pressure of the NaH3
Similar behavior is also observed in previous measurements on the lithium-hydride system. IR absorption measurements show that while the vibron of pure H2 is located at around 4,450 cm−1 at 240 GPa (Zha et al., 2013), the vibrons of LiH2 and LiH6 are around 3900 cm−1 and 2,600 cm−1 at 160 GPa, respectively (Pépin et al., 2015). Like NaH3, these vibrons in LiH2 and LiH6 display a positive frequency shift with pressure. For instance, in LiH2 the vibron upshifts from 3900 at 160 GPa to 4,250 cm−1 at 220 GPa. These results contrast with the experimental observations on alkaline earth tetrahydrides (MH4 with M = Ca, Sr, Ba) which also contain quasi-molecular hydrogen (Peña-Alvarez et al., 2022). In these tetrahydrides, the frequency of the
The pressure induced H-H lengthening in binary hydrides has been suggested to be directly related to the charge transfer from the host element to the
According to our calculations, shown in Table 1, the charge of the Na cation goes from +0.7842 at 25 GPa to +0.7490 at 75 GPa. Similarly, the charge of the H anions goes from −0.6690 to −0.6274 at 25 and 75 GPa, respectively. Thus, most of the charge is transferred from sodium to the monoatomic hydrogen, while there is some charge on the
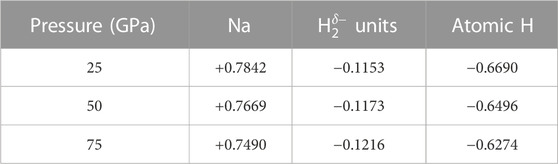
TABLE 1. Calculated average charges for sodium, quasi-molecular and atomic hydrogen inside of the Cmcm-NaH3 structure at different pressures.
The results presented here show that the previous study on the Na-H misinterpreted their Raman spectra by attributing the characteristic Ag mode of Cmcm-NaH3 to Cc-NaH7 (Struzhkin et al., 2016). Furthermore, the Raman modes assigned to NaH3 by Struzhkin et al. (2016) can be explained by the formation of CH4-H2 compounds from the high temperature reaction between the diamond anvil and the H2 medium (Peña-Alvarez et al., 2021; Ranieri et al., 2022). Our XRD and Raman results provide no evidence for the existence of Cc-NaH7 in the 25–75 GPa pressure range, which is within the synthesis conditions previously reported. We can as well rule out the formation of any of the predicted sodium polyhydrides (Baettig and Zurek, 2011; Chen et al., 2021; Shipley et al., 2021), to at least 78 GPa.
5 Conclusion
We have synthesized NaH3 from NaH and H2 at the high hydrogen pressures of ∼ 30, 40, 50 and 75 GPa and temperatures of 2000 K using laser heating. XRD measurements at 27, 49.5 and 75 GPa show that the crystal structure of the metal sublattice of NaH3 is compatible with the orthorhombic space group Cmcm. The Na volume expansion corresponds to a NaH3 stoichiometry. The unit-cell lattice parameters and unit-cell volume experimental points as a function of pressure are in good agreement with our DFT calculations for NaH3 and the previously reported data below 50 GPa (Struzhkin et al., 2016). Different and independent samples of NaH3 at 75 and 50 GPa were measured by Raman spectroscopy. Further Raman experiments were performed on an additional sample to characterize NaH3 upon decompression from 41 to 8 GPa. The NaH3 Raman spectrum is characterized by a phonon near 4,125 cm−1 (
Data availability statement
The raw data supporting the conclusion of this article will be made available by the authors, without undue reservation.
Author contributions
TM: Conceptualization, Data curation, Formal Analysis, Investigation, Methodology, Writing–original draft, Writing–review and editing. MK: Data curation, Investigation, Writing–review and editing, Formal Analysis. IO: Investigation, Methodology, Writing–review and editing, Validation. PD-S: Investigation, Writing–review and editing. AH: Formal Analysis, Investigation, Methodology, Resources, Software, Validation, Writing–review and editing. RH: Funding acquisition, Investigation, Methodology, Resources, Supervision, Writing–review and editing, Validation. MP-A: Conceptualization, Data curation, Formal Analysis, Funding acquisition, Investigation, Methodology, Project administration, Resources, Supervision, Validation, Writing–original draft, Writing–review and editing.
Funding
The author(s) declare financial support was received for the research, authorship, and/or publication of this article. MP-A acknowledges the support of the UKRI Future Leaders Fellowship Mrc-Mr/T043733/1. RH acknowledges that the project has received funding from the European Research Council (ERC) under the European Union’s Horizon 2020 Research and Innovation program (Grant Agreement No. 948895).
Acknowledgments
We thank Prof. M. McMahon for lending us the glove box of his laboratory to prepare the samples. We also thank beamline P02.2 at PETRA-III, DESY, Hamburg, Germany for the use of their facilities (proposal I-20221042) as well as beamline scientists Nico Giordano, Konstantin Glazyrin and Hanns-Peter Lierman for their help during the experiments. We would also like to acknowledge beamline 13 IDD–GSECARS in the Advance Photon Source (APS) at the Argonne National Laboratory, Illinois, United States, for granting us beamtime (experiments ID 266009, 216253, 208124, and 179388). Beamline scientists Stella Chariton and Vitali Prakapenka are also thanked for their help. We also would like to acknowledge Jack Binns for his help during data analysis and Prof. Eugene Gregoryanz for facilitating the equipment for the experiments. Computational resources provided by the UK’s National Supercomputer Service through the United Kingdom Car-Parrinello HEC consortium (EP/X035891/1) and by the United Kingdom Materials and Molecular Modelling Hub (EP/P020194) are gratefully acknowledged.
Conflict of interest
The authors declare that the research was conducted in the absence of any commercial or financial relationships that could be construed as a potential conflict of interest.
Publisher’s note
All claims expressed in this article are solely those of the authors and do not necessarily represent those of their affiliated organizations, or those of the publisher, the editors and the reviewers. Any product that may be evaluated in this article, or claim that may be made by its manufacturer, is not guaranteed or endorsed by the publisher.
Supplementary material
The Supplementary Material for this article can be found online at: https://www.frontiersin.org/articles/10.3389/fchem.2023.1306495/full#supplementary-material
References
Akahama, Y., and Kawamura, H. (2006). Pressure calibration of diamond anvil Raman gauge to 310 GPa. J. Appl. Phys. 100. doi:10.1063/1.2335683
Ashcroft, N. (2004). Hydrogen dominant metallic alloys: high temperature superconductors? Phys. Rev. Lett. 92, 187002. doi:10.1103/physrevlett.92.187002
Baettig, P., and Zurek, E. (2011). Pressure-stabilized sodium polyhydrides: NaHn (n > 1). Phys. Rev. Lett. 106, 237002. doi:10.1103/physrevlett.106.237002
Bi, T., and Zurek, E. (2021). Electronic structure and superconductivity of compressed metal tetrahydrides. Chem. Eur. J. 27, 14858–14870. doi:10.1002/chem.202102679
Bryukvina, L., Pestryakov, E., Kirpichnikov, A., and Martynovich, E. (2014). Formation of color centers and light scattering structures by femtosecond laser pulses in sodium fluoride. Opt. Commun. 330, 56–60. doi:10.1016/j.optcom.2014.05.030
Chen, C.-H., Huang, A., Tsuei, C., and Jeng, H.-T. (2021). Possible high-Tc superconductivity at 50 GPa in sodium hydride with clathrate structure. New J. Phys. 23, 093007. doi:10.1088/1367-2630/ac1df3
Drozdov, A., Kong, P., Minkov, V., Besedin, S., Kuzovnikov, M., Mozaffari, S., et al. (2019). Superconductivity at 250 K in lanthanum hydride under high pressures. Nature 569, 528–531. doi:10.1038/s41586-019-1201-8
Duclos, S. J., Vohra, Y. K., Ruoff, A. L., Filipek, S., and Baranowski, B. (1987). High-pressure studies of NaH to 54 GPa. Phys. Rev. B 36, 7664–7667. doi:10.1103/physrevb.36.7664
Fei, Y., Ricolleau, A., Frank, M., Mibe, K., Shen, G., Prakapenka, V., et al. (2007). Toward an internally consistent pressure scale. Proc. Natl. Acad. Sci 104 (22), 9182–9186. doi:10.1073/pnas.0609013104
Grimme, S., Ehrlich, S., and Goerigk, L. (2011). Effect of the damping function in dispersion corrected density functional theory. J. Comput. Chem. 32, 1456–1465. doi:10.1002/jcc.21759
Ho, A. C., Hanson, R. C., and Chizmeshya, A. (1997). Second-order Raman spectroscopic study of lithium hydride and lithium deuteride at high pressure. Phys. Rev. B 55, 14818–14829. doi:10.1103/physrevb.55.14818
Hooper, J., Altintas, B., Shamp, A., and Zurek, E. (2013). Polyhydrides of the alkaline earth metals: a look at the extremes under pressure. J. Phys. Chem. C 117, 2982–2992. doi:10.1021/jp311571n
Hooper, J., and Zurek, E. (2012). High pressure potassium polyhydrides: a chemical perspective. J. Phys. Chem. C 116, 13322–13328. doi:10.1021/jp303024h
Howie, R. T., Gregoryanz, E., and Goncharov, A. F. (2013). Hydrogen (deuterium) vibron frequency as a pressure comparison gauge at multi-mbar pressures. J. Appl. Phys. 114. doi:10.1063/1.4818606
Howie, R. T., Narygina, O., Guillaume, C. L., Evans, S., and Gregoryanz, E. (2012). High-pressure synthesis of lithium hydride. Phys. Rev. B 86, 064108. doi:10.1103/physrevb.86.064108
Klimeš, J., Bowler, D. R., and Michaelides, A. (2010). Chemical accuracy for the van der Waals density functional. J. Phys. Condens. Matter 22, 022201. doi:10.1088/0953-8984/22/2/022201
Kraus, W., and Nolze, G. (1996). Powder cell–a program for the representation and manipulation of crystal structures and calculation of the resulting x-ray powder patterns. J. Appl. Crystallogr. 29, 301–303. doi:10.1107/s0021889895014920
Kresse, G., and Furthmüller, J. (1996). Efficient iterative schemes for ab initio total-energy calculations using a plane-wave basis set. Phys. Rev. B 54, 11169–11186. doi:10.1103/physrevb.54.11169
Kresse, G., and Joubert, D. (1999). From ultrasoft pseudopotentials to the projector augmented-wave method. Phys. Rev. B 59, 1758–1775. doi:10.1103/physrevb.59.1758
Liermann, H.-P., Konôpková, Z., Morgenroth, W., Glazyrin, K., Bednarčik, J., McBride, E., et al. (2015). The extreme conditions beamline P02.2 and the extreme conditions science infrastructure at PETRA III. J. Synchrotron Radiat. 22, 908–924. doi:10.1107/s1600577515005937
Loubeyre, P., LeToullec, R., Hausermann, D., Hanfland, M., Hemley, R., Mao, H., et al. (1996). X-ray diffraction and equation of state of hydrogen at Megabar pressures. Nature 383, 702–704. doi:10.1038/383702a0
Peña-Alvarez, M., Binns, J., Marqués, M., Kuzovnikov, M. A., Dalladay-Simpson, P., Pickard, C. J., et al. (2022). Chemically assisted precompression of hydrogen molecules in alkaline-earth tetrahydrides. J. Phys. Chem. Lett. 13, 8447–8454. doi:10.1021/acs.jpclett.2c02157
Peña-Alvarez, M., Brovarone, A. V., Donnelly, M.-E., Wang, M., Dalladay-Simpson, P., Howie, R., et al. (2021). In-situ abiogenic methane synthesis from diamond and graphite under geologically relevant conditions. Nat. Commun. 12, 6387. doi:10.1038/s41467-021-26664-3
Pépin, C., Loubeyre, P., Occelli, F., and Dumas, P. (2015). Synthesis of lithium polyhydrides above 130 GPa at 300 K. Proc. Natl. Acad. Sci. 112, 7673–7676. doi:10.1073/pnas.1507508112
Perdew, J. P., Burke, K., and Ernzerhof, M. (1996). Generalized gradient approximation made simple. Phys. Rev. Lett. 77, 3865–3868. doi:10.1103/physrevlett.77.3865
Prakapenka, V., Kubo, A., Kuznetsov, A., Laskin, A., Shkurikhin, O., Dera, P., et al. (2008). Advanced flat top laser heating system for high pressure research at GSECARS: application to the melting behavior of germanium. High. Press. Res. 28, 225–235. doi:10.1080/08957950802050718
Prescher, C., and Prakapenka, V. B. (2015). Dioptas: a program for reduction of two-dimensional x-ray diffraction data and data exploration. High. Press. Res. 35, 223–230. doi:10.1080/08957959.2015.1059835
Ranieri, U., Conway, L. J., Donnelly, M.-E., Hu, H., Wang, M., Dalladay-Simpson, P., et al. (2022). Formation and stability of dense methane-hydrogen compounds. Phys. Rev. Lett. 128, 215702. doi:10.1103/physrevlett.128.215702
Shamp, A., Hooper, J., and Zurek, E. (2012). Compressed cesium polyhydrides: Cs+ sublattices and H3−-three-connected nets. Inorg. Chem. 51, 9333–9342. doi:10.1021/ic301045v
Sharma, S., Mao, H., and Bell, P. (1980). Raman measurements of hydrogen in the pressure range 0.2-630 kbar at room temperature. Phys. Rev. Lett. 44, 886–888. doi:10.1103/physrevlett.44.886
Shen, G., Prakapenka, V. B., Eng, P. J., Rivers, M. L., and Sutton, S. R. (2005). Facilities for high-pressure research with the diamond anvil cell at GSECARS. J. Synchrotron Radiat. 12, 642–649. doi:10.1107/s0909049505022442
Shipley, A. M., Hutcheon, M. J., Needs, R. J., and Pickard, C. J. (2021). High-throughput discovery of high-temperature conventional superconductors. Phys. Rev. B 104, 054501. doi:10.1103/physrevb.104.054501
Shull, C., Wollan, E., Morton, G., and Davidson, W. (1948). Neutron diffraction studies of NaH and NaD. Phys. Rev. 73, 842–847. doi:10.1103/physrev.73.842
Skelton, J. M., Burton, L. A., Jackson, A. J., Oba, F., Parker, S. C., and Walsh, A. (2017). Lattice dynamics of the tin sulphides SnS2, SnS and Sn2S3: vibrational spectra and thermal transport. Phys. Chem. Chem. Phys. 19, 12452–12465. doi:10.1039/c7cp01680h
Somayazulu, M., Ahart, M., Mishra, A. K., Geballe, Z. M., Baldini, M., Meng, Y., et al. (2019). Evidence for superconductivity above 260 K in lanthanum superhydride at megabar pressures. Phys. Rev. Lett. 122, 027001. doi:10.1103/physrevlett.122.027001
Struzhkin, V. V., Kim, D. Y., Stavrou, E., Muramatsu, T., Mao, H.-k., Pickard, C. J., et al. (2016). Synthesis of sodium polyhydrides at high pressures. Nat. Commun. 7, 12267. doi:10.1038/ncomms12267
Toby, B. H., and Von Dreele, R. B. (2013). Gsas-ii: the genesis of a modern open-source all purpose crystallography software package. J. Appl. Crystallogr. 46, 544–549. doi:10.1107/s0021889813003531
Togo, A., and Tanaka, I. (2015). First principles phonon calculations in materials science. Scr. Mater. 108, 1–5. doi:10.1016/j.scriptamat.2015.07.021
Wang, H., Tse, J. S., Tanaka, K., Iitaka, T., and Ma, Y. (2012). Superconductive sodalite-like clathrate calcium hydride at high pressures. Proc. Natl. Acad. Sci. U.S.A. 109, 6463–6466. doi:10.1073/pnas.1118168109
Williams, W. L. (1962). Magnetic, thermal, and optical properties of the F center in NaH. Phys. Rev. 125, 82–86. doi:10.1103/physrev.125.82
Zha, C. S., Liu, Z., Ahart, M., Boehler, R., and Hemley, R. J. (2013). High-pressure measurements of hydrogen phase iv using synchrotron infrared spectroscopy. Phys. Rev. Lett. 110, 217402. doi:10.1103/physrevlett.110.217402
Keywords: hydrides, sodium, high pressure, X-ray diffraction, Raman, density functional calculations
Citation: Marqueño T, Kuzovnikov MA, Osmond I, Dalladay-Simpson P, Hermann A, Howie RT and Peña-Alvarez M (2024) High pressure study of sodium trihydride. Front. Chem. 11:1306495. doi: 10.3389/fchem.2023.1306495
Received: 03 October 2023; Accepted: 19 December 2023;
Published: 09 January 2024.
Edited by:
Maxim Bykov, University of Cologne, GermanyReviewed by:
Guo-Hua Zhong, Chinese Academy of Sciences (CAS), ChinaMarek Tkacz, Institute of Physical Chemistry, Polish Academy of Sciences, Poland
Copyright © 2024 Marqueño, Kuzovnikov, Osmond, Dalladay-Simpson, Hermann, Howie and Peña-Alvarez. This is an open-access article distributed under the terms of the Creative Commons Attribution License (CC BY). The use, distribution or reproduction in other forums is permitted, provided the original author(s) and the copyright owner(s) are credited and that the original publication in this journal is cited, in accordance with accepted academic practice. No use, distribution or reproduction is permitted which does not comply with these terms.
*Correspondence: Miriam Peña-Alvarez, bWlyaWFtLnBlbmEuYWx2YXJlekBlZC5hYy51aw==