 Selda Topcu
 Gagan Jodhani
 Pelagia I. Gouma
- Department of Materials Science and Engineering, Stony Brook University, Stony Brook, NY, USA
Titania is the most widely studied photocatalyst. In its mixed-phase configuration (anatase–rutile form) – as manifested in the commercially available P25 Degussa material – titania was previously found to exhibit the best photocatalytic properties reported for the pure system. A great deal of published research by various workers in the field has not fully explained the underlying mechanism for the observed behavior of mixed-phase titania photocatalysts. One of the prevalent hypotheses in the literature that is tested in this work involves the presence of small, active clusters of interwoven anatase and rutile crystallites or “catalytic ‘hot-spots’.” Therefore, non-woven nanofibrous mats of titania were produced, and upon calcination, the mats consisted of nanostructured fibers with different anatase–rutile ratios. By assessing the photocatalytic and photoelectrochemical properties of these samples, the optimized photocatalyst was determined. This consisted of TiO2 nanostructures annealed at 500°C with an anatase/rutile content of 90/10. Since the performance of this material exceeded that of P25 complete structural characterization was employed to understand the catalytic mechanism involved. It was determined that the dominant factors controlling the photocatalytic behavior of the titania system are the relative particle size of the different phases of titania and the growth of rutile laths on anatase grains which allow for rapid electron transfer between the two phases. This explains how to optimize the response of the pure system.
Introduction
Significant interest in novel photocatalytic technologies for applications ranging from water remediation to energy harvesting via water splitting has involved nanostructured titania. A growing need to develop self-supported nanocatalyst configurations that do not disperse in aqueous media but rather stay intact and can be recovered following the photocatalytic action drives the research on 3D non-woven electrospun mats. A novel processing method has been developed for the synthesis of photocatalytic nanofiber mats, a pioneering concept that came out of our research laboratory (Lee and Gouma, 2011).
Titanium dioxide is the most commonly studied photocatalyst due to its chemical stability, eco-friendliness, non-toxicity, and cost-effective synthesis (Linsebigler et al., 1995; Asahi et al., 2001; Chen and Mao, 2007). Also it finds diverse applications in solar cells (Shim et al., 2008), photocatalysis (Li et al., 2012; Hu et al., 2013), batteries, and chemical sensors (More et al., 2008) among others. Several studies on the degradation of industrial dye, i.e., pollutants which are considered to be carcinogenic and which pollute both the water and air, used TiO2 photocatalysts. Since the synthesis method employed plays an important role on the optical, electronic, and chemical properties of TiO2 nanostructures, various methods have been explored to-date to fabricate TiO2 in the forms of nanorods (Miao et al., 2004), nanoparticles (Yu et al., 2007; Ba-Abbad et al., 2012), nanotubes (Xu et al., 2011), and nanofibers.
Titania as the commercial photocatalyst P25 Degussa has been widely studied, yet the full mechanism behind the enhanced photocatalytic properties of the mixed anatase–rutile system has not been elucidated. Without a thorough understanding of the structural and chemical features controlling the activity of pure titania as a photocatalyst, it is wasteful to try and optimize the system by adding dopants to it. So, this study aims to test a prevalent hypothesis for the behavior of mixed-phase titania systems, while developing a better, self-supported, pure titania photocatalyst in the process. The underlying assumption in P25 Degussa’s activity is the presence of closely intertwined nanocrystallites of anatase and rutile (Hurum et al., 2003). In order to test this hypothesis, non-woven nanostructures of titania were prepared and tested.
Electrospinning (Nakata et al., 2009; Bhardwaj and Kundu, 2010) has received more interest in recent years as it produces non-woven fibrous mats with controlled architectures. Electrospun nanofibers have short pathways for electron transfer (Nakata et al., 2011), and could potentially improves the photocatalytic properties of TiO2. The calcination temperature of the non-woven mats plays a significant role in determining the crystallographic and morphological characteristics of product such as crystallinity, grain size, and phase structure of the calcined fibers. This work aims to establish the precise characteristics of TiO2 nanostructures that give optimum photocatalytic activity and overall photoelectrochemical properties.
Experimental Details
Preparation of Pure TiO2 Nanofibers Mats
First, a 7.5 ml of PVP solution containing 5% PVP was prepared. This was done so by adding 0.45 g of PVP in 7.12 ml Ethanol, and this mixture was ultrasonicated for about an hour or till it dissolved and became a one phase solution. Then, in a glove box filled with Nitrogen, 1.6 ml of Titanium Isopropoxide (TIP) was added to a mixture of 3 ml Acetone and 3 ml Ethanol. This mixture was left undisturbed for about 15 min in the glove box. This solution was then removed from the box and poured into the 7.5 ml polymer solution, and this final mixture was ultrasonicated for about 1 h until a transparent homogeneous light yellow solution was achieved. This prepared yellow solution was called the spinning solution. The solution was loaded in the plastic syringe having a blunt 22-gage stainless steel needle for further electrospinning process. The steady jet was maintained for all combinations at a flow rate of 0.030 ml/min, applied voltage of 12–15 kV, and a fixed needle-to-collector distance of 15–20 cm. A collector that was a 20 cm2 glass plate covered with aluminum foil, sprayed with Teflon to help smoothly peel off the collected fibers from the foil. Gamma High Voltage Research DC Voltmeter capable of producing voltages up to 30 kV was used for electric field. The collected as-electrospun fibers were subsequently subjected to an oxidizing heat-treatment in a tube furnace (Lindberg Blue) at 450, 500, 600, and 700°C for 2 h. The fiber preparation schematics are displayed in Figure 1.
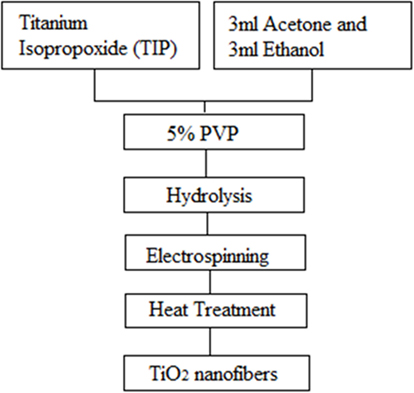
Figure 1. Schematic of the processing steps involved in getting the calcined nanofibers of titania.
Polyvinylpyrrolidone (PVP) is used as the carrier polymer to prepare the precursor solution for electrospinning. Figure 2 shows the structure of PVP. PVP has been previously used to facilitate the synthesis of ceramic nanofibers by means of electrospinning as reported in many publications by our research group and other workers (Li et al., 2012; Zhao et al., 2012). This support matrix was chosen due to its high molecular weight of 1,300,000 g/mol, which ensures that even at low concentrations the solution preserves the pairing of chains, even after it experiences severe stretching during the fiber drawing as determined by the strong electrostastic field applied (Watthanaarun et al., 2005; Nakata and Fujishima, 2012). The polymer is dissolved in ethanol, which evaporates during deposition, along with acetone.
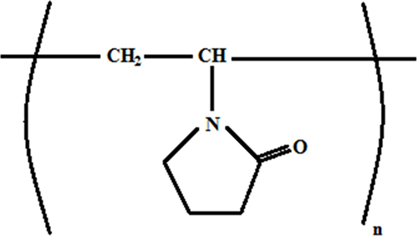
Figure 2. Structure of PVP.
Structural and Chemical Characterization Studies
The samples were characterized by X-ray diffraction (XRD, Rigaku miniflex II), Fourier Transform Infrared Spectroscopy (FTIR, Thermo Scientific Nicolet 6700), scanning electron microscopy (SEM, LEO 1550 Schottky Filed Emission SEM), and transmission electron microscopy (TEM, JEOL 1400) to examine their microstructure. The optical absorption properties of the electrospun mats were examined using a UV-Vis Spectrometer (UV-Vis, Perkin Elmer Lambda 950).
The crystal sizes (D) of anatase and rutile were determined by the Scherrer equation:
where λ is the wavelength of the Cu Kα radiation used (λ = 0.1541 nm), β the full width at half-maximum of the diffraction line, K a shape factor (0.9), and θ the angle of diffraction.
Photocatalytic Degradation of Methylene Blue
About 0.0017 g of the catalyst was mixed with 50-ppm methylene blue (MB) dye solution, which was then kept in dark for 1 h to achieve adsorption–desorption equilibrium. A light source with a 150 W Xenon lamp (Newport) with AM 1.5 G filter was used as the source for UV–visible light and visible light with a 400 nm cut-on filter in the same set up. Before the solution was placed under UV or visible light, about 2 ml of the sample was pipetted out for optical absorption measurement, which was recorded as 0 min absorbance. The solution was then kept under the visible light for 3 h. Every 30 min, 1.7 ml of the solution was taken out to measure its absorbance value, which was transferred back to the reaction vessel after each measurement. The degradation of MB was evaluated by studying the changes in the strongest absorbance band at the wavelength of 665 nm using UV/Vis spectrophotometer (HR 4000, Ocean Optic) with halogen and deuterium lamps as light sources.
Photoelectrochemical Characterization
Photo-electrochemical measurements were performed on a measurement station equipped with potentiostat (VersaStat, PAR) three-electrode, single-compartment glass cell fitted with a quartz window. Working electrodes were prepared by mixing the as-prepared catalyst with PVP in isopropanol alcohol and drop casting onto ITO glass substrate (illumination area of 1.0 cm2) to form a thin film, and then the films were annealed at 500°C for 10 min with rapid thermal processor (RTP). We used a 0.1M KOH solution as the electrolyte; a platinum wire was used as a counter electrode. We use an Ag/AgCl (3 M KCl) electrode as the reference electrode. A potentiostat (Princeton Applied Research) was employed for the chronoamperometry measurements. The surface of the working electrode was illuminated with light intensity of 113.0 mW/cm2 from a 150 W Xenon lamp equipped with an AM1.5G filter to simulate solar radiation.
Results and Discussion
Figure 3 shows the XRD patterns of the pure TiO2 samples obtained following calcination at 450, 500, 600, and 700°C respectively. The peaks shown correspond to TiO2 and they correspond to either pure anatase or anatase and rutile phases. The nanofibers annealed at 450°C were just anatase. The (101) peak of anatase becomes sharper and stronger with enhancing the calcination temperature from 450 to 700°C. Table 1 shows the relative polymorph phase content in the various calcined samples. Spurr equation (Spurr and Myers, 1957) was used to estimate the amount of anatase and rutile phases in TiO2.
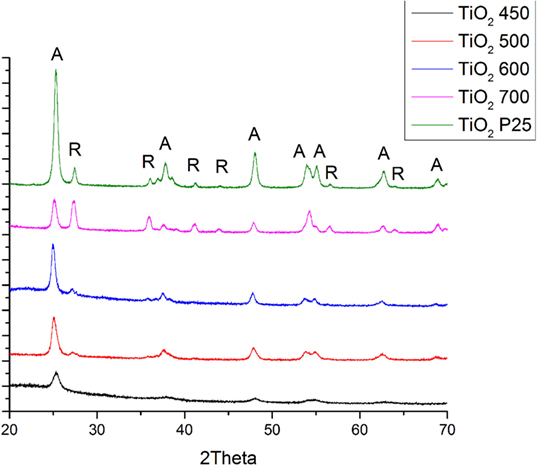
Figure 3. Results XRD analyses of P25 and pure TiO2 nanofibers annealed at different temperatures (A: anatase phase, R: rutile phase).
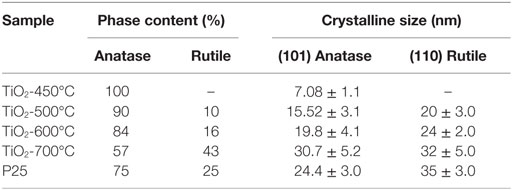
Table 1. The size and phase composition of TiO2 nanofibers.
where FA is the percentage of anatase, FR is the percentage of rutile, IA is the integral of (101) intensity of anatase, and IR is the integral of (110) intensity of rutile phase. The respective crytalline sizes were calculated using Scherrer’s equation (D = Kλ/βcosθ) from (101) anatase TiO2 peak in the XRD spectra.
Fourier Transform Infrared Spectroscopy was conducted on all the samples. The spectrum obtained as can be seen in Figure 4, reveal a strong peak in 600 cm−1 region. The peak can be attributed to Ti–O bond (Socrates, 2001). No peaks were observed that indicated presence of carbon in the samples, indicating that the polymer decomposed completely upon heat treatment.
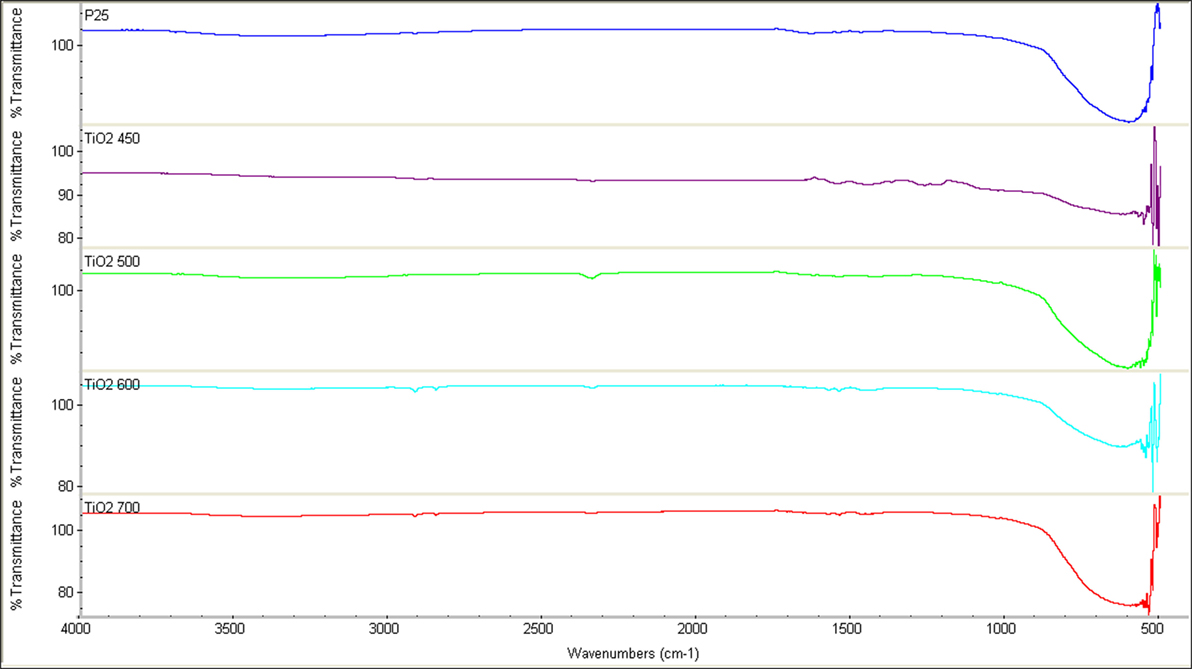
Figure 4. FTIR spectra of TiO2 fibers.
Scanning electron microscopy images of pure TiO2 nanofibers annealed at (a) 450°C, (b) 500°C, (c) 600°C, and (d) 700°C at a magnification of 100k× were shown at Figure 5. Fibers are randomly oriented forming non-woven mats. Nanofibers had smooth surface with fiber diameters ranging from 100 to 70 nm. There was almost no significant change in diameter as the calcination temperature increased.
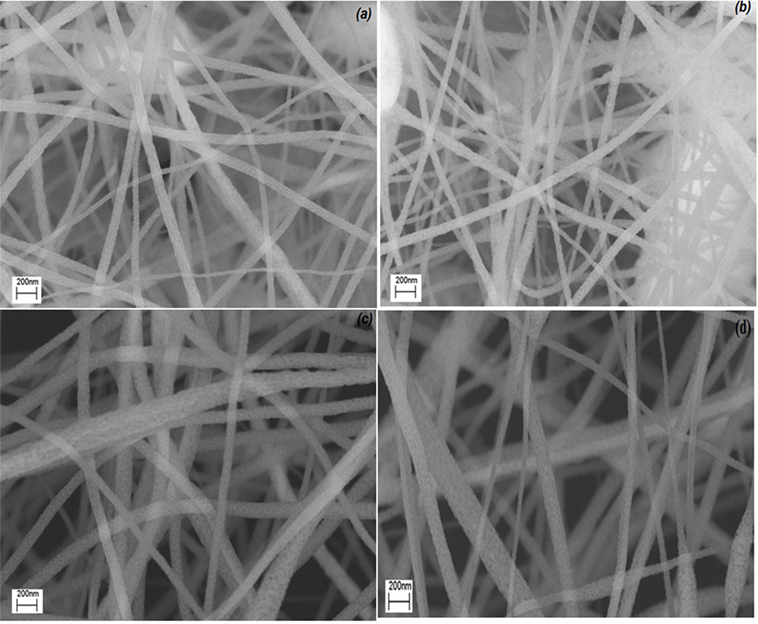
Figure 5. SEM images of pure TiO2 nanofibers annealed at (A) 450°C, (B) 500°C, (C) 600°C, and (D) 700°C.
The detailed morphology and crystalline structure of TiO2 nanofibers annealed at 450, 500, 600, and 700°C were investigated by TEM and shown in Figure 6 at different magnifications. The nanofibers calcined at different temperatures are shown intact, indicating that they consist of TiO2 crystallites, and that the grains grew with increasing temperature. The grain size distribution is consistent with those calculated from the XRD data. Some crystalline nanofibers showed lattice fringes.
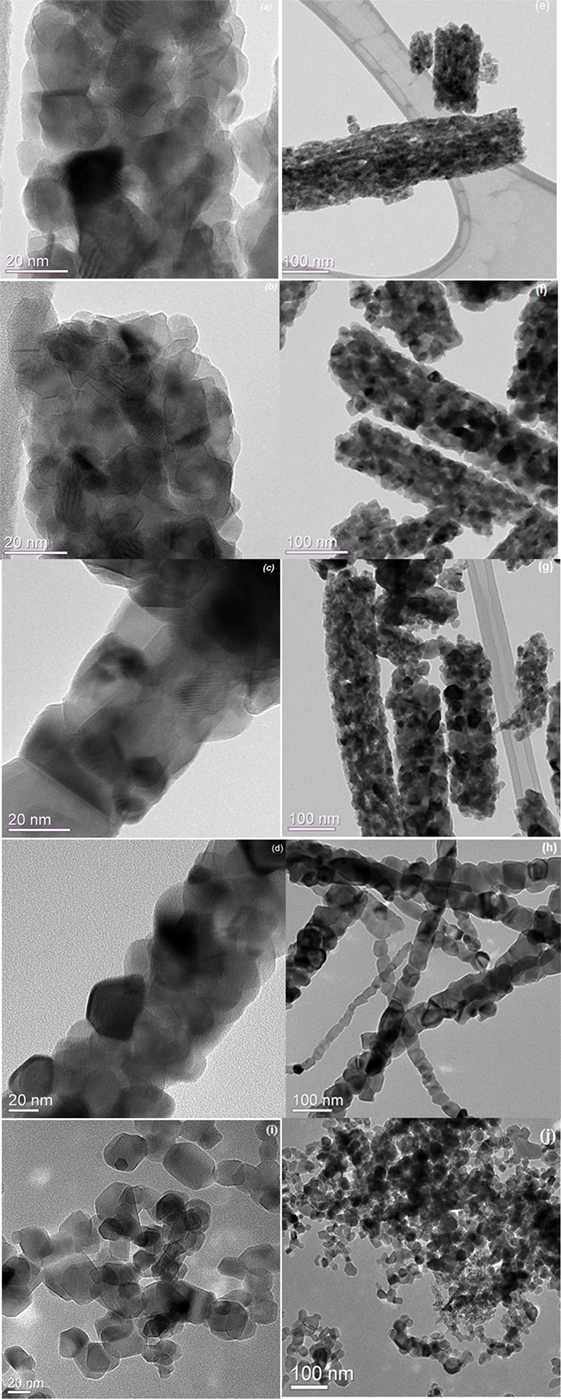
Figure 6. TEM images of pure TiO2 nanofibers annealed (A) at 450°C, (B) at 500°C, (C) at 600°C and (D) at 700°C at high magnification and (E–H) are low magnifications, (I,J) P25 TiO2.
The corresponding selected area diffraction patterns (SAED) are shown in Figure 7. The ring patterns observed confirm that the fibers consist of nanocrystals. For TiO2 annealed at 450°C, all diffraction rings belongs to anatase. Diffraction pattern of TiO2 annealed at 500, 600, and 700°C showed reflections form both the anatase (101) and rutile (101) phases.
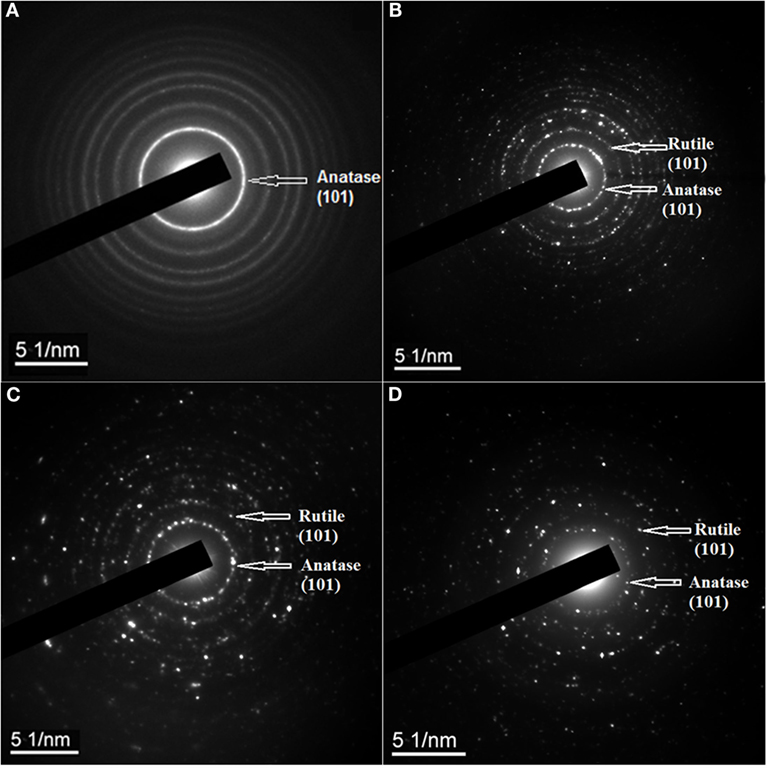
Figure 7. SAED pattern of pure TiO2 nanofibers annealed (A) at 450°C, (B) at 500°C, (C) at 600°C, and (D) at 700°C.
The UV-Visible spectroscopy carried out to investigate the adsorption properties of the calcined pure TiO2 nanofibers. Figure 8 shows the corresponding UV-Vis spectra of calcined nanofibers. All samples displayed a typical absorption with the intense transition in the UV region, resulting from electron transitions from the valence band to the conduction band (O 2p to Ti 3d). The absorbance spectra of TiO2 sample at 450 and 500°C indicates the absorption onset at around 415 nm, which is 3.0 eV, i.e., the band gap of anatase phase (Ohno et al., 2003). No distinct changes in the band gap energy were observed with changing annealing temperature as they remained in the range of 3.13–3.0 eV.
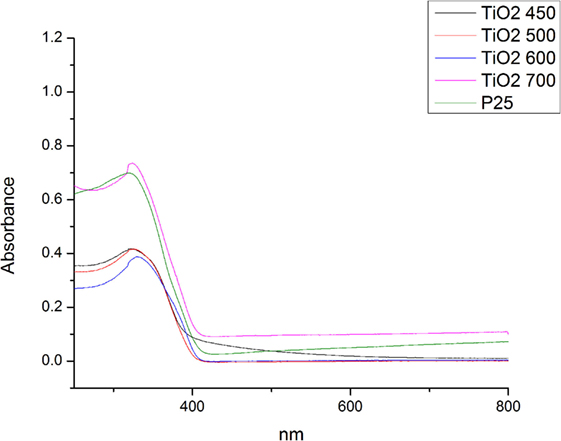
Figure 8. 4UV-Vis spectra of P25, pure TiO2 nanofibers annealed at 450, 500, 600, and 700°C.
The structures of the dye molecules directly determine the absorption characteristic of dyes for light. In the electron absorption spectra of dyes, there are several absorption bands, which reflect the state of motion of the electrons in the system. The absorption wavelength, absorption intensity, and the shape of absorption band are related directly to the structure of dye molecules. Therefore, it is possible to evaluate the structural variation of dyes by investigating the variation of the electron absorption spectra during the process of degradation of the dyes (Li et al., 2012). In order to determine the photocatalytic properties of the samples, the degradation of MB under whole spectrum and visible light irradiation was studied as shown in Figure 9. The degradation of MB dye under light irradiation was estimated with using the formula below:
where A0 and A1 are the absorbance of non-irradiated (0 min) and irradiated (at specific time interval) samples. The photocatalytic rate of MB under whole spectrum (UV and visible light) in the TiO2 nanofibers obtained at 500°C was faster when compared the others.
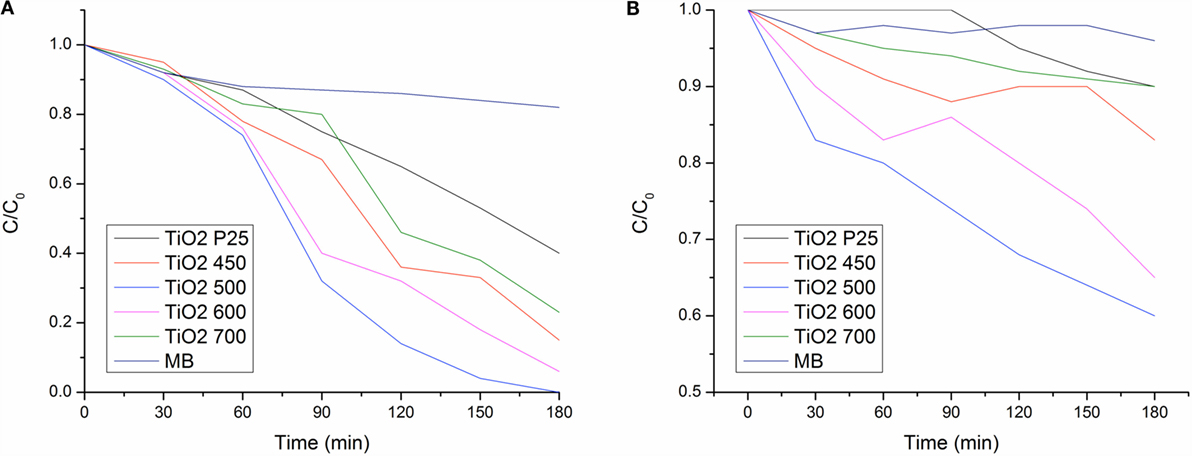
Figure 9. Photodegradation of MB under (A) UV-visible light and (B) visible spectrum (λ > 400 nm) of TiO2 nanofibers annealed at 450, 500, 600, and 700°C.
The photocatalytic rate of MB under visible light in the TiO2 nanofibers obtained at 450, 500, 600, and 700°C were 17, 40, 35, and 13% after 180 min of irradiation. It was observed that TiO2 nanofiber annealed at 500°C exhibit the best photocatalytic activity. Calcination at 700°C was highly detrimental to the photocatalytic activity as the rutile phase itself has low photocatalytic activity.
To investigate the photoresponse of the TiO2 nanofibers annealed at different temperatures, the photoelectrochemical measurement was carried out in a PEC cell under illumination with a 150 W Xenon lamp (Newport) equipped with an AM1.5G filter. When the TiO2 nanofibers were excited, the photogenerated electrons and holes were produced, and the electrons were quickly guided away by the applied electric field. The photocurrent response of the samples upon the on-off illumination vs. time was measured and was shown in Figure 10. The photocurrent rapidly rises to a steady-state value upon illumination, which is reproducible for several on/off cycles. The annealing temperature has an important effect on the photocurrent. For the TiO2-500°C sample, the photocurrents were ~0.09 mA, which exhibited the highest photocurrent density, due to the formation of anatase and rutile phases and the enhancement of crystallization. It could be concluded that TiO2-500°C nanomats have better photovoltaic performance under visible light. With further increase in temperature, there is a decrease in the photocurrent. Especially at TiO2-700°C, the photocurrent dropped rapidly, possibly due to the large percentage of rutile phase present (about 50%).
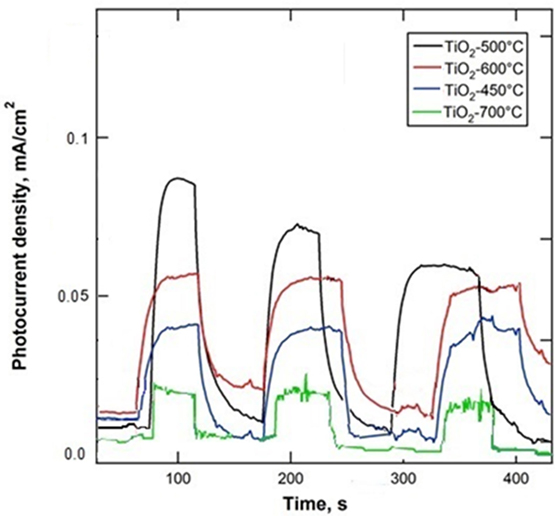
Figure 10. Current density (j) – potential curve of in simulated AM 1.5 illumination for TiO2 nanofibers annealed at 450, 500, 600, and 700°C.
Discussion
Some workers (Hurum et al., 2003; Ohno et al., 2003; Li et al., 2008; Chen et al., 2015) have argued that a phase junction exists between anatase and rutile particles that acts to enhance the photocatalytic activity of TiO2, compared to the pure anatase or pure rutile materials. The idea is that efficient electron-hole separation is facilitated between the two phases, allowing for enhanced lifetimes of electrons and holes. Heping Li et al. (Li et al., 2011) argued that when two phases come together, there is a charge transfer across the respective particles and thus electrons from the anatase phase are trapped in the lower energy trapping sites of rutile (since the band gap of rutile is lower than that of anatase) (Li et al., 2011). With the lifetime of photogenerated e− h+ pairs increased, hydroxyl radical species (⋅OH) form when the adsorbed O2 captures the photogenerated electrons, and these surface hydroxyls trap the holes, enhancing the photocatalytic efficiency of the mixed-phase material. However, Deanna C. Hurum (Hurum et al., 2003) and Wei Kan (Wang et al., 2016) support a different hypothesis: that the enhanced activity of mixed-phase TiO2 catalysts is due to the transfer of electrons from rutile to anatase trapping sites, which hindered the charge recombination. Nevertheless, neither of these two mechanisms seem applicable to our findings, simply because there is insufficient amount of second phase (rutile) to cause significant interactions.
The photocatalytic activity of TiO2 is known to depend on its grain size, phase, particle morphology, surface/bulk defects, and exposed crystalline facets, and subsequently its specific surface area (Sibu et al., 2002; Subramanian et al., 2004). Our TEM images showed diffraction contrast that may be attributed to defect structures on the particles (Figures 5A–C) similar to those seen on anatase nanograins undergoing a transition to rutile. Rutile laths were seen to grow on anatase grains [see Figure 3 in Gouma and Mills (2001), Subramanian et al. (2004), and Chen and Mao (2007)]. Our results showed that the sample TiO2 heat-treated at 500°C with ratio of anatase to rutile 90/10, and a particle size between15 and 20 nm has the best photocatalytic activity under UV and visible light and photocurrent density. Commercial TiO2 P25 has a ratio of anatase to rutile 75/25 with the particle size 24–35 nm (Table 1). When comparing our samples with the commercial TiO2 P25, there is a stark difference in the phase content and particle size.
Therefore, surface/bulk defects and particle size are considered the predominant factors determining the photochemical properties of the pure titania mats. The observed defect-like contrast on the anatase grains is likely due to the nucleation and growth of the rutile phase on them. Gouma reported that rutile plates forms initially on the surface of anatase particles in the form of fine lathers (plates) via a shear process mechanism Gouma and Mills (2001). Thus, any synergistic effect of the two phases will occur on the anatase grains undergoing transformation. This is an interesting topic to address in future studies of this material system.
Previous work from Oak Ridge National Laboratory (Xu et al., 1999) claimed that a significant increase of the reaction rate of degradation of MB was observed when the particle size of TiO2 was less than 30 nm. Dodd et al. (Watthanaarun et al., 2005; Nakata and Fujishima, 2012) also showed that there exists an optimum particle size for enhanced photocatalytic activity and this is attributed to an increase in the charge carrier recombination rate, which counteracts the increased activity arising from the higher specific surface area for a sufficiently small particle size 10 nm. The crystalline size of TiO2 at 500°C was lower than the TiO2 at 600 and 700°C, thus its specific surface area is higher. Larger surface area would also help to increase the photocatalytic reaction sites and promote the efficiency of the electron-hole separation and then adsorption of MB dyes on the surface of TiO2 nanoparticles would enhanced. Effects of smaller grain size and defects density would help to improve the photocatalytic activity of TiO2 nanofibers calcined at 500°C in best.
Conclusion
The pure TiO2 nanofiber photocatalysts were successfully fabricated through electrospinning method and then annealed at several different calcination temperatures. The catalytic performances of pure TiO2 samples as a function of calcination temperature were investigated by the photocatalytic degradation of MB. The results showed that TiO2 nanostructures annealed at 500°C, in which the content rate of anatase/rutile was 90/10, was better than P25 and this suggests that the dominant factors are the particle size of our material and the defect density of anatase potentially due do the growth of the rutile on them. Raising the calcination temperature to 600 and 700°C, the rutile phase content and particle size were increased, resulting in the decrease of the photochemical properties due to increase of recombination of photogenerated election–hole pairs.
Author Contributions
ST carried out the experiments related to materials processing, structural and electrochemical characterization; GJ carried out the chemical characterization tests; PG designed the experiments and contributed to the interpretation of the results.
Conflict of Interest Statement
The authors declare that the research was conducted in the absence of any commercial or financial relationships that could be construed as a potential conflict of interest.
Funding
This work has been supported by the NSF DMR 1106168. Research carried out in part at the Center for Functional Nanomaterials, Brookhaven National Laboratory, which is supported by the U.S. Department of Energy, Office of Basic Energy Sciences, under Contract No. DE-SC0012704.
References
Asahi, R., Morikawa, T., Ohwaki, T., Aoki, K., and Taga, Y. (2001). Visible-light photocatalysis in nitrogen-doped titanium oxides. Science 13, 269–271. doi: 10.1126/science.1061051
Ba-Abbad, M. M., Kadhum, A. A. H., Mohamad, A. B., Takriff, M. S., and Sopian, K. (2012). Synthesis and catalytic activity of TiO2 nanoparticles for photochemical oxidation of concenrated chlorophenols under direct solar radiation. Int. J. Electrochem. Sci. 7, 4871–4888.
Bhardwaj, N., and Kundu, S. C. (2010). Electrospinning: a fascinating fiber fabrication technique. Biotechnol. Adv. 28, 325–347. doi:10.1016/j.biotechadv.2010.01.004
Chen, W. T., Chan, A., Jovic, V., Sun-Waterhouse, D., Murai, K.-I., Idriss, H., et al. (2015). Effect of the TiO2 crystallite size, TiO2 polymorph and test conditions on the photo-oxidation rate of aqueous methylene blue. Topics Catal. 58, 85–102. doi:10.1007/s11244-014-0348-7
Chen, X., and Mao, S. S. (2007). Titanium dioxide nanomaterials: synthesis, properties, modifications, and applications. Chem. Rev. 107, 2891–2959. doi:10.1021/cr0500535
Gouma, P. I., and Mills, M. J. (2001). Anatase-to-Rutile Transformation in Titania Powders. J. Am. Ceram. Soc. 84, 619–622. doi:10.1111/j.1151-2916.2001.tb00709.x
Hu, M., Fang, M., Tang, C., Yang, T., Huang, Z., Liu, Y., et al. (2013). The effects of atmosphere and calcined temperature on phtocataytic activity of TiO2 nanofibers prepared by electrospinning. Nanoscale Res. Lett. 8, 548. doi:10.1186/1556-276X-8-548
Hurum, D. C., Agrios, A. G., and Gray, K. A. (2003). Explaining the enhanced photocatalytic activity of Degussa P25 mixed-phase TiO2 using EPR. J. Phys. Chem. B 107, 4545–4549. doi:10.1021/jp0273934
Lee, J., and Gouma, P. I. (2011). Tailored 3D CuO nanogrid formation. J. Nanomater. 2011, 6. doi:10.1155/2011/863631
Li, G. H., Ciston, S., Saponjic, Z. V., Chen, L., Dimitrijevic, N. M., Rajh, T., et al. (2008). Synthesizing mixed-phase TiO2 nanocomposites using a hydrothermal method for photo-oxidation and photoreduction applications. J. Catal. 253, 105–110. doi:10.1016/j.jcat.2007.10.014
Li, H. P., Zhang, W., and Pan, W. (2011). Enhanced photocatalytic activity of electrospun TiO2 nanofibers with optimal anatase/rutile ratio. J. Am. Ceram. Soc. 94, 3184–3187. doi:10.1111/j.1551-2916.2011.04748.x
Li, J., Qiao, H., Du, Y., Chen, C., Li, X., Cui, J., et al. (2012). Electrospinning sythesis and photocatalytic activity of mesoporous TiO2 nanofibers. ScientificWorldJournal 2012, 7. doi:10.1100/2012/154939
Linsebigler, A. L., Lu, G., and Yates, J. T. (1995). Photocatalysis on TiO2 surfaces: principles, mechanisms, and selected results. Chem. Rev. 95, 735–758. doi:10.1021/cr00035a013
Miao, L., Tanemura, S., Toh, S., Kaneko, K., and Tanemura, M. (2004). Fabrication, characterization and Raman study of anatase-TiO2 nanorods by a heating-sol-gel template process. J. Crystal Growth 26, 246–252.
More, A. M., Gunjakar, J. L., and Lokhande, C. D. (2008). Liquefied petroleum gas (LPG) sensor properties of interconnected weblike structured sprayed TiO2 films. Sens. Actuat. B Chem. 129, 671–677. doi:10.1016/j.snb.2007.09.026
Nakata, K., Baoshun, L., Goto, Y., Ochiai, T., Sakai, M., Sakai, H., et al. (2011). Visible light responsive electrospun TiO2 fibers embedded with WO3 nanoparticles. Chem. Lett. 40, 1161–1162. doi:10.1246/cl.2011.1161
Nakata, K., and Fujishima, A. (2012). TiO2 photocatalysis: design and applications. J. Photochem. Photobiol. C 13, 169–189. doi:10.1016/j.jphotochemrev.2012.06.001
Nakata, K., Watanabe, N., Yuda, Y., Tryk, D. A., Ochiai, T., Murakami, T. et al. (2009). Electrospun fibers composed of Al2O3-TiO2 nanocrystals. J. Ceram. Soc. Jpn. 117, 1203–1207.
Ohno, T., Tokieda, K., Higashida, S., and Matsumur, M. (2003). Synergism between rutile and anatase TiO2 particles in photocatalytic oxidation of naphthalene. Appl. Catal. A 244, 383–391. doi:10.1016/S0926-860X(02)00610-5
Shim, H. S., Na, S. I., Nam, S. H., Ahn, H. J., Kim, H. J., Kim, D. Y., et al. (2008). Efficient photovoltaic device fashioned of highly aligned multilayers of electrospun TiO2 nanowire array with conjugated polymer. Appl. Phys. Lett. 18, 92.
Sibu, C. P., Rajesh Kumar, S., Mukundan, P., and Warrier, K. G. K. (2002). Structural modifications and associated properties of lanthanum oxide doped sol-gel nanosized titanium oxide. Chem. Mater. 14, 2876–2881. doi:10.1021/cm010966p
Socrates, G. (2001). Infrared and Raman Characteristic Group Frequencies:Tables and Charts, 3rd Edn. Chichester: John Wiley & Sons Ltd.
Spurr, R. A., and Myers, H. (1957). Quantitative analysis of anatase-rutile mixtures with an X-ray diffractometer. Anal. Chem. 29, 760–762. doi:10.1021/ac60125a006
Subramanian, V., Wolf, E. E., and Kamat, P. V. (2004). Catalysis with TiO2/gold nanocomposites. Effect of metal particle size on the Fermi level equilibration. J. Am. Chem. Soc. 126, 4943–4950. doi:10.1021/ja0315199
Wang, W. K., Chen, J. J., Zhang, X., Huang, Y. X., Li, W. W., and Yu, H. Q. (2016). Self-induced synthesis of phase-junction TiO2 with a tailored rutile to anatase ratio below phase transition temperature. Sci. Rep. 6, 20491. doi:10.1038/srep20491
Watthanaarun, J., Pavarajarn, V., and Supaphol, P. (2005). Titanium (IV) oxide nanofibers by combined sol-gel and electrospinning techniques: preliminary report on effects of preparation conditions and secondary metal dopant. Sci. Technol. Adv. Mater. 6, 240–245. doi:10.1016/j.stam.2005.02.002
Xu, N. P., Shi, Z., Fan, Y., Dong, J., Shi, J., and Hu, M. Z.-C. (1999). Effects of particle size of TiO2 on photocatalytic degradation of methylene blue in aqueous suspensions. Ind. Eng. Chem. Res. 38, 373–379. doi:10.1021/ie980378u
Xu, S., Ng, J., Jianhong Du, A., Liu, J., and Delai Sun, D. (2011). Highly efficient TiO2 nanotube photocatalyst for simultaneous hydrogen production and copper removal from water. Int. J. Hydrogen Energy 36, 6538–6545. doi:10.1016/j.ijhydene.2011.03.047
Yu, J. G., Zhang, L., Cheng, B., and Su, Y. (2007). Hydrothermal preparation and photocatalytic activity of hierarchically sponge-like macro-/mesoporous titania. J. Phys. Chem. C 111, 10582–10589. doi:10.1021/jp0707889
Keywords: TiO2, nanofiber, the rate of anatase to rutile, photodegradation, photocurrent density
Citation: Topcu S, Jodhani G and Gouma PI (2016) Optimized Nanostructured TiO2 Photocatalysts. Front. Mater. 3:35. doi: 10.3389/fmats.2016.00035
Received: 27 April 2016; Accepted: 06 July 2016;
Published: 22 July 2016
Edited by:
Sheikh A. Akbar, Ohio State University, USACopyright: © 2016 Topcu, Jodhani and Gouma. This is an open-access article distributed under the terms of the Creative Commons Attribution License (CC BY). The use, distribution or reproduction in other forums is permitted, provided the original author(s) or licensor are credited and that the original publication in this journal is cited, in accordance with accepted academic practice. No use, distribution or reproduction is permitted which does not comply with these terms.
*Correspondence: Pelagia I. Gouma, cGVsYWdpYS1pcmVuZS5nb3VtYUBzdG9ueWJyb29rLmVkdQ==