 Nadiia Korsunska1Yulia Polishchuk1Mykola Baran1Valentyna Nosenko1Igor Vorona1Serhyi Lavoryk1,2Semyon Ponomaryov1
 Olivier Marie3Xavier Portier4
 Larysa Khomenkova1,5*
- 1V. Lashkaryov Institute of Semiconductor Physics of the National Academy of Sciences of Ukraine, Kiev, Ukraine
- 2NanoMedTech LLC, Kiev, Ukraine
- 3LCS, UMR Centre National de la Recherche Scientifique 6506, ENSICAEN, Normandie Université, Caen, France
- 4CIMAP, CEA, UMR Centre National de la Recherche Scientifique 6252, ENSICAEN, Normandie Université, Caen, France
- 5National University of Kyiv-Mohyla Academy, Kiev, Ukraine
The influence of chlorine on spatial distribution of subvalent dopants and oxygen vacancies' content in Cu-doped Y-stabilized ZrO2 nanopowders was studied as a function of calcination temperature (500–1,000°C) and Cu content (1 and 8 mol%). The powders were prepared by co-precipitation technique from a mixture of zirconium oxychloride, yttrium and copper nitrates. The powders were studied by X-ray diffraction, Auger spectroscopy, attenuated total and diffuse reflectance, as well as by electron paramagnetic resonance methods. The increase of calcination temperature stimulates structure transformation, variation of oxygen vacancies content in the grains, and amount of dispersed CuO at their surface. All these changes depend on Cu content being controlled by surface-volume copper redistribution: in-diffusion of copper (below 800°C) and its out-diffusion (at 800–1,000°C). The transformation of surface entities (Cu2Cl(OH)3 and Cu-OH complexes) followed by the formation of CuO was observed. At low Cu content (1 mol%), the amount of oxygen vacancies and CuO varies significantly and non-monotonically with Tc rise, while for higher Cu content (8 mol%), they change slightly. Chlorine was found to be present in the grain bulk with the content nearly equal to Cu content. It acts as compensator for Cu charge that prevents the appearance of oxygen vacancies. The Cu-Cl interaction hampers Cu out-diffusion from the grains, phase transformation and formation of CuO at their surface. The latter reduces the catalytic activity of the powders in the CO PROX reaction. Among all the powders, the highest CO conversion (about 80%) was found to be demonstrated by the powders calcined at 600°C contained 1 mol% of CuO.
Introduction
Zirconia nanopowders have attracted considerable attention due to their mechanical, electrical, thermal, and luminescent properties offering diverse applications such as catalysts (Bansal et al., 2015), high temperature and corrosion resistant coatings (Schulz et al., 1996; Padture et al., 2002; Habibi et al., 2013), radiation detectors (Kirm et al., 2005), biological labeling (Jia et al., 2006; Wang et al., 2010), etc.
Tetragonal and cubic zirconia are used in gas sensors (Fidelus et al., 2009; Kajiyama and Nakamura, 2015; Reiter and Seyr, 2016; Fischer et al., 2017) owing to their ability to allow oxygen ions to move freely through the crystal structure. Besides, this zirconia feature is attractive for solid-oxide fuel cells (SOFCs) (Zhang et al., 2007; Asadikiya and Zhong, 2018). In both cases, the density of oxygen vacancies is one of the important parameters because these vacancies control ionic conductivity of zirconia. Since both tetragonal and cubic phases have higher oxygen vacancies concentrations than monoclinic one, only such zirconia phases are used for SOFCs. Both these phases are usually stabilized by subvalent additives such as yttrium, calcium, scandium, cerium, etc., being yttrium the most common stabilizing agent.
Y-stabilized ZrO2 (YSZ) presents high ionic conductivity allowing applications as electrolyte in SOFCs (Minh, 1993; Sun and Stimming, 2007; Zhang et al., 2007; Restivo and Mello-Castanho, 2009; Asadikiya and Zhong, 2018). At the same time, YSZ has low electronic conductivity. However, it can be increased via doping with metallic additives. For instance, mechanical alloying of YSZ and metallic Ni- or Cu-powders was performed to produce anodes in SOFCs (Minh, 1993; Sun and Stimming, 2007; Restivo and Mello-Castanho, 2009). On the other hand, such subvalent impurities, being incorporated into the grains, affect structural characteristics of the composites. Specifically, depending on its concentration, Cu incorporation results in the transformation of monoclinic ZrO2 structure into tetragonal or cubic ones (Bhagwat et al., 2003; Zhang et al., 2008) with high concentrations of oxygen vacancies that may facilitate oxygen diffusion. Cu incorporation into zirconia grains results also in the appearance of a specific green band in photoluminescence (Korsunska et al., 2015a,b) and cathode-luminescence spectra1.
At the same time, a number of important properties of Cu doped zirconia that offer other applications are caused by copper localized on the grain surface [in the form of aggregates of Cu atoms (Sun and Sermon, 1994), CuO molecules or crystalline CuO (Zhang et al., 2014)].
Copper, located on the grains surface or in its near-surface region, was accepted to be responsible for catalytic activity of the composite (Sun and Sermon, 1994; Samson et al., 2014; Pakharukova et al., 2015), its fungicidal properties (Sherif and Hachtmann, 1980), tribological behavior (Ran et al., 2007), and also ability to compact the ceramic (Ran et al., 2007; Kong et al., 2014). In this case, the nature of surface Cu species, their surface concentration and surface area play an important role.
Thus, the control of both Cu spatial localization and zirconia structure (the oxygen vacancies concentration) is a crucial task. These properties, as well as the kind of Cu-loaded substances on the grain surface, depend on composite preparation technique. For instance, the mechanical alloying of YSZ and metallic Cu powders, similarly to SOFC anode preparation (Gross et al., 2007; Sun and Stimming, 2007; Restivo and Mello-Castanho, 2009), leads to the formation of metallic Cu in the YSZ pores (i.e., on the grain surface), which provides good electron conductivity. The impregnation of ZrO2 or YSZ powders with copper nitrates, used generally for catalyst preparation (Samson et al., 2014; Pakharukova et al., 2015), results in Cu localization on the grain surface or in near-surface region as dispersed or crystalline CuO or as metallic Cu.
At the same time, the simultaneous presence of Cu inside the grains and on their surface can be achieved by co-precipitation technique (Korsunska et al., 2014, 2017). In this case, the variation of calcination temperature (Tc) allows Cu relocation between volume and surface of nanocrystals. Thus, this approach provides the ability to control both structural and catalytic properties (including control of oxygen vacancies concentration, crystal sizes, surface area, and sintering process).
Tetragonal ZrO2 phase is known to exhibit better catalytic properties (Ma et al., 2005; Wang et al., 2007). Therefore the doping with yttrium is often used. At the same time, Cu addition enhances catalytic activity but also changes the structural properties of Y-doped ZrO2 when Cu penetrates inside the nanocrystals. As shown by Winnubst et al. (2009), the Cu addition to tetragonal YSZ, prepared by co-precipitaton technique, leads to a decrease of the temperature of tetragonal-to-monoclinic phase transformation.
Therefore, the investigation of the effect of technological conditions (fabrication approach, annealing temperature and duration, doping level, etc.,) on Cu spatial localization in ZrO2-based composites fabricated by co-precipitation technique is a key step for the development of materials with required properties.
Recently, we have revealed that not only the calcination temperature, cooling rate and Cu content, but also the nature of the raw materials used for the production of powders plays an important role in the structural and optical properties of the final material. Since Zr oxychloride is often used for YSZ preparation, the effect of chlorine on the properties of Cu-doped Y-stabilized ZrO2 (Cu-YSZ) nanopowders is investigated in the present paper.
Experimental Details and Methods
Sample Preparation
The Y-stabilized ZrO2 nanopowders doped with Cu were synthesized by a co-precipitation technique using ZrOCl2·nH2O, Y(NO3)3, and Cu(NO3)2 precursors. The zirconium salt concentration that will lead the particle size was set to 0.87 M. The whole salt solutions were then mixed with required ratio to obtain two sets of powders. For the first set (called hereafter as Cu-1), Zr, Y, and Cu salts were mixed to obtain a final composition as 96 mol% of ZrO2, 3 mol% Y2O3 and 1 mol% CuO. For the second set (called as Cu-8), the salts were mixed to achieve 89 mol% of ZrO2, 3 mol% Y2O3 and 8 mol% CuO in final product. All used chemical were of chemical grade purity. The water solutions of salts were mixed together on a propeller and stirred for 30 min. For chemical precipitation an ammonia solution (6 wt%) was added in aqueous solution of the mixed salts with continuous stirring. The pH value was 10–11. The gelation was continued for 1 h at room temperature. Afterwards the precipitate was recovered by filtration with a vacuum pump. The precipitates was washed to pH = 7 with distilled water. After washing and filtration, obtained hydrogels were further dried in a microwave furnace with a 700 W output power and at a 2.45 GHz frequency for 5 min. The dried hydroxides were calcined in a resistive furnace at Tc = 500–1,000°C for 2 h in air and slowly cooled in the furnace.
Methods for Materials' Characterization
Structural and optical properties were studied by X-ray diffraction (XRD), ATR-FTIR absorption and diffuse reflection methods, as well as by electron paramagnetic resonance (EPR) at room temperature.
XRD data were collected in the range of 2θ = 20–80° using a Thermo Scientific ARL X'TRA diffractometer with CuKα radiation (λ = 0.15418 nm) in a Bragg Brentano geometry. The coherent domain size was estimated from XRD data using Scherer formula d = Kλ/(β·cosθ), where K = 0.9 is a dimensionless shape factor, λ = 0.15418 nm, β is the full width at half of the maximum intensity (FWHM) and θ stands for the Bragg angle. To quantify the contribution of each crystal phase in the powders, the Reference Intensity Ratio (RIR) method was used. This method is based on the scaling of all diffraction data to the diffraction of a standard reference material (corundum is usually used as the international reference). The scale factor is defined by the ratio of the intensity of analyte (I) to the intensity of corundum (IC). For each phase the I/IC ratio is defined. Despite some shortcomings, the RIR method is straight forward, easy to implement and can be used to estimate the concentration of individual phases to within a few percent.
Infrared attenuated total reflection (ATR) spectra were acquired at room temperature using an IRAffinity-1 Fourier transform spectrometer equipped with a DTGS (deuterated triglycine sulfate) detector. The Golden Gate single reflection diamond ATR top-plate MKII accessory equipped with ZnSe lenses was used for ATR measurements. The spectra were collected with a mirror speed value of 2.8 mm·s−1 by averaging 32 scans at a 2 cm−1 resolution in the 550–4,000 cm−1 range. In our experiments, a small amount of powder was pressed on the diamond surface by a sapphire anvil. These effects were corrected by using advanced ATR correction.
UV diffuse reflectance spectra were recorded with respect to the BaSO4 standard with a double-beam UV-3600 UV-VIS NIR spectrophotometer (Shimadzu company), equipped with an ISR-3100 integrated sphere. The spectra were then transformed in absorption ones using standard program based on the Kubelka-Munk ratio defined by , where f (r∞) is the Kubelka-Munk function, r∞ = Rsample/RBaSO4 is the relative diffuse reflection from the sample, K and S – absorption and scattering coefficients of the sample, respectively.
The chemical composition of the powders was determined by Auger electron spectroscopy (AES). The JAMP 9500 F (JEOL) Auger microprobe with a 3 nm resolution in the secondary electron image mode was used. The microprobe was equipped with a sensitive hemispheric Auger spectrometer with an energy resolution of ΔE/E = 0.05–0.6%. For this analysis, the powders were mixed to ethanol before being spread on a conductive holder. The Auger spectrum was recorded, at first, from the initial surface of the sample, which is a layer of nanoparticles deposited on a silicon substrate. Further, for depth analysis, an Ar+ ion soft etching mode (1 keV) with a beam diameter of about 120 μm able to move by raster 1 × 1 mm2 was used with a significant relaxation time. This procedure allowed getting access to the surfaces of the cross-sections of the nanoparticles, removing their near-surface layer. Vacuum of the specimen chamber was better than 5·10−7 Pa. More details can be found elsewhere (Ponomaryov et al., 2016a; Khomenkova et al., 2017) and the procedure for thermal drift correction was used during Auger spectra recording (Ponomaryov et al., 2016a,b).
To extract information from Auger spectra about the sample composition, the analytical Auger peaks of CKLL, OKLL, ClLMM, CuLMM, YLMM, and ZrMNN with the corresponding 271, 509, 182, 915, 1,746, and 141 eV energies, respectively, were used. Quantitative element analysis was performed by calibration of the relative sensitivity factors for homogeneous samples of known composition (Briggs and Seah, 1990).
High-resolution transmission electron microscopy (TEM), STEM HAADF, and STEM EDX chemical maps were recorded for the powders mixed to butanol and spread on a holey carbon copper grid. A double-corrected cold FEG ARM200F JEOL microscope operated at 200 kV and equipped with a Centurio EDX JEOL setup was used. The acquisition time for the STEM EDX 256 × 256 squared maps was 5 ms.
Electron paramagnetic resonance (EPR) measurements were carried out using an upgraded Varian E12 X-band (~9.5 GHz) EPR spectrometer with a sensitivity limit of about 1012 EPR centers. A 100-kHz modulation of the magnetic field with peak-to-peak amplitude modulation of 0.1 mT and microwave power of about 2 mW, being much less than the saturation power, were applied. The signal of a MgO:Mn sample containing 3 × 10¹⁵ spins was used as a reference. EPR spectra were normalized with respect to the intensity of the signal of MgO:Mn reference and considering the mass of each powder studied. All measurements were carried out at room temperature.
The CO preferential oxidation (PROX) catalytic tests were performed in a fixed bed cylinder reactor (inner diameter ~4.3 mm) using samples weight of about 33 mg thieved in the 100–200 μm range and diluted with SiC to reach a 10 mm height of catalytic bed. The total gas flow rate was set to 100 ml·min−1 using the following composition: CO (1%), H2 (12.5%), O2 (1.5%), Ar (rest). Reactions were performed with no pre-treatment from room temperature to 600°C at a 10 K·min−1 heating rate. The CO conversion was calculated from the online gas phase analysis via an infrared dedicated cell.
Results
XRD Study
The original Cu-1 and Cu-8 xerogels were amorphous, whereas their calcination resulted in crystallization (Figures 1A,B). In Cu-1 samples calcined at Tc = 500–600°C, the XRD peaks at 2θ~30, 35, 50, and 60° correspond to either tetragonal or cubic phases. However, the presence of the peak at 2θ = 74.2° shows that the phase is mainly tetragonal (possibly with low content of cubic one) (Srinivasan et al., 1991; Korsunska et al., 2014). In fact, this peak coincides with the peak observed at higher Tc (up to Tc = 800°C), when the XRD patterns clearly show the presence of both peaks 74.2° and 73° typical for tetragonal phase. This phase is dominant up to 800°C. However at Tc > 600°C the appearance of XRD peaks corresponding to monoclinic phase is detected. Further increase of Tc enhances tetragonal-monoclinic phase transformation (Figure 1A, but in Cu-8 set, the tetragonal phase remains dominant for all samples (Figure 1B). For the Cu-1 sample calcined at 1,000°C, the cubic phase instead of the tetragonal one was detected.
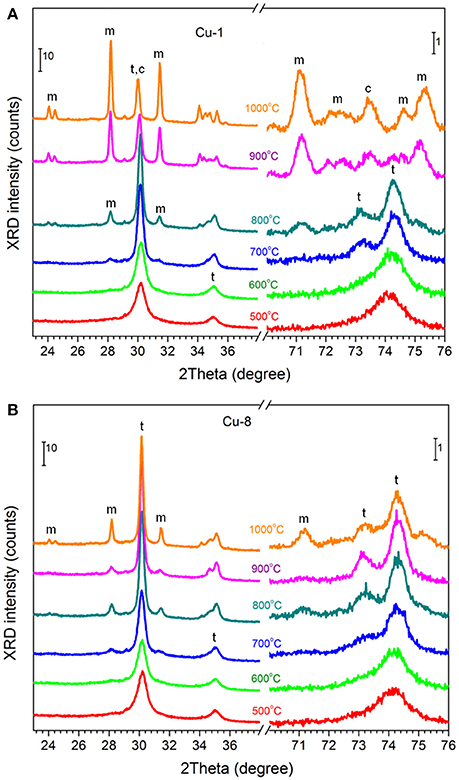
Figure 1. XRD patterns of Cu-1 (A) and Cu-8 (B) powders calcined at different temperatures. XRD peaks of monoclinic, tetragonal and cubic phases are marked with “m”, “t” and “c”. Only peaks that do not overlapped significantly are highlighted.
The phase composition was estimated using RIR method based on the XRD peak at 2θ~30° (for tetragonal and cubic phases) and at 2θ~28° (for monoclinic phase). This analysis shows that the contribution of monoclinic phase for Cu-1 samples increases with Tc up to 67% (Tc = 1,000°C) while for Cu-8 samples it remains as low as ~18% (Tc = 1,000°C) (Figure 2 and Table S1).
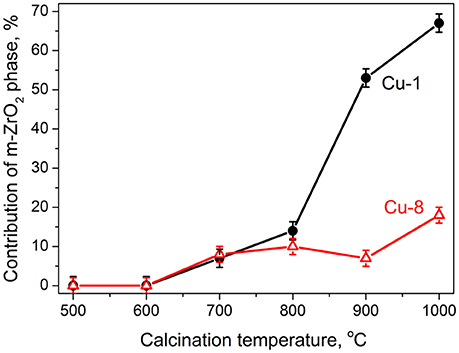
Figure 2. Relative contribution of monoclinic phase for Cu-1 (circle symbols) and Cu-8 (triangle symbols) powders calcined at different temperatures estimated from XRD data.
The coherent domain size of tetragonal phase was found to increase gradually from dt = 11.7–12.6 nm (Tc = 500°C) up to dt = 35.8–36.3 nm (Tc = 1,000°C) being almost independent on Cu content (Figure S1A and Table S1). For monoclinic phase, d values were estimated to be dm = 12.3–15.4 nm (Tc = 600°C) up to dm = 48.5–49.4 nm (Tc = 1,000°C) (Figure S1B and Table S1).
Figure 3 shows the XRD peak positions of Cu-1 and Cu-8 samples with respect to the Tc values that are shifted as compared to those of ZrO2 powders doped with 3 mol% Y (PDF#01-071-4810). The variation of XRD peak position at 2θ~30°, which belongs to the tetragonal or cubic phases and does not overlap with monoclinic phase reflections, is demonstrated in Figure 3A. The temperature effect is significantly different for Cu-1 or Cu-8 samples. Indeed, for Cu-1 powders, the peak is shifted, at first, toward higher angles (Tc = 600°C), and then toward lower ones, in a sharper way for Tc = 900–1,000°C. By contrast, for Cu-8 samples only a slight shift to lower angles is observed (Figure 3A). The positions of the XRD peak at 2θ~28° corresponding to the monoclinic phase shift slightly toward higher angles in both groups of samples (Figure 3B) with a more pronounced trend for Cu-1 samples.
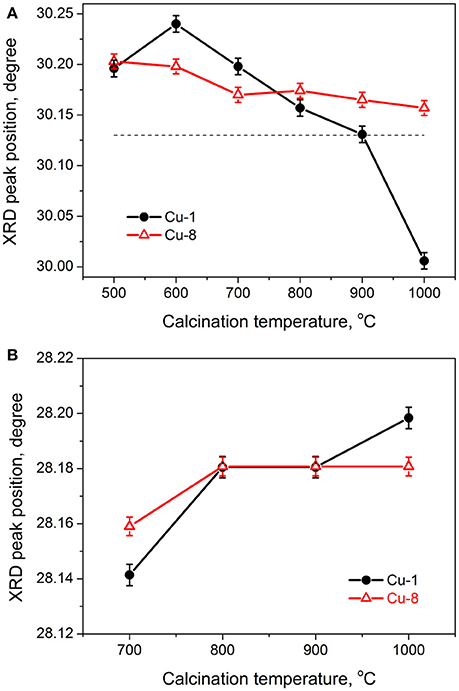
Figure 3. Evolution of XRD peak positions of tetragonal (A) and monoclinic (B) phases with calcination temperature. Dashed line in (A) shows the tabled XRD peak position of tetragonal phase of ZrO2-3mol% Y2O3 powder (PDF#01-071-4810).
Optical Characteristics
ATR Spectra
The evolution of ATR spectra with Tc increase correlates with the XRD data. The spectra of Cu-1 and Cu-8 samples calcined at 500–1,000°C reveal Zr-O vibrations in the range of 500–850 cm−1 (Figure S2) and other bands in the spectral regions of 1,300–1,400, 1,500–1,580, 1,580–1,680, and 3,000–3,700 cm−1 (Figure S3). The latter four bands are most probably due to vibrations of OH-groups and adsorbed water (Cho et al., 2003).
Besides, in the 3,000–3,700 cm−1 spectral range, three narrow peaks at 3,446, 3,356, and 3,316 superimposed on the broad one are observed for Tc = 600–800°C (Figure S3). These peaks can tentatively be ascribed to the hydroxyl stretching modes of Cu2Cl(OH)3 (Du et al., 2015). This assumption is confirmed by the absence of these narrow bands in the samples prepared from the nitrates (Korsunska et al., 2017). These bands are more pronounced in the Cu-1 samples (Tc = 600–800°C) while in Cu-8 samples, they are only observed for Tc = 800°C. For higher Tc values, the bands related with Cu and Cl complexes vanish.
The intensity of the broad band at 3,000–3,700 cm−1 caused by OH-groups or water molecules (López et al., 2005) decreases noticeably with Tc vanishing at Tc = 1,000°C. It is worth noting that water contained in the hydrogel evaporates at ~200°C (during drying and formation of xerogel), while the main amount of OH-groups is usually lost at Tc = 400–500°C. However, the presence of OH-groups and/or water molecules in our samples calcined at higher temperatures can be explained by further adsorption form atmospheric moisture on the grain surface (Figure S3).
Diffuse Reflectance Spectra
Diffuse reflectance (DR) spectra of Cu-1 and Cu-8 samples calcined at different temperatures are shown in Figures 4A,B, respectively. These DR spectra contain two bands located at ~270 and ~800 nm.
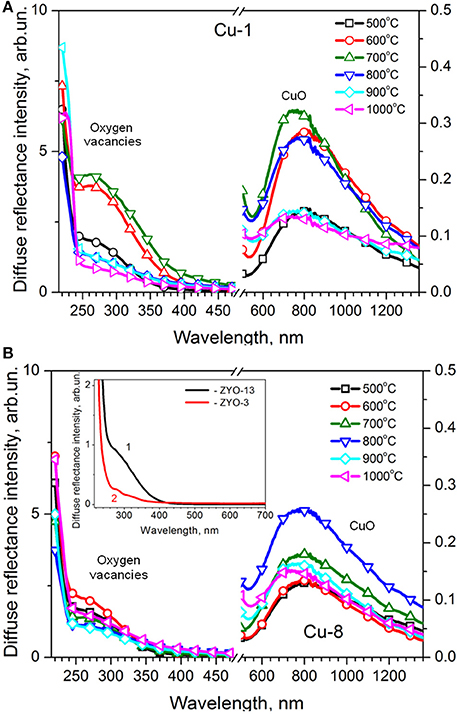
Figure 4. Diffuse reflectance UV-Vis spectra of Cu-1 (A) and Cu-8 (B) samples. Inset in (B) shows the diffuse reflectance spectra for Cu-free YSZ powders with 13 (curve 1) and 3 (curve 2) mol% of Y2O3 prepared from Zr oxychloride.
The absorption band near the band edge of ZrO2 at ~270 nm was earlier identified as light absorption by oxygen vacancies (Korsunska et al., 2017). Its intensity in Cu-1 and Cu-8 samples calcined at 500°C does not differ notably. However the Tc increase results in the non-monotonic changes of this band intensity for Cu-1 samples. This band enhances in the Tc = 500–700°C range and quenches for higher Tc values (800–1,000°C). At the same time, when considering Cu-8 samples, the intensity of the band at ~270 nm changes insignificantly indicating an only slight decrease upon Tc increase (Figure 5A).
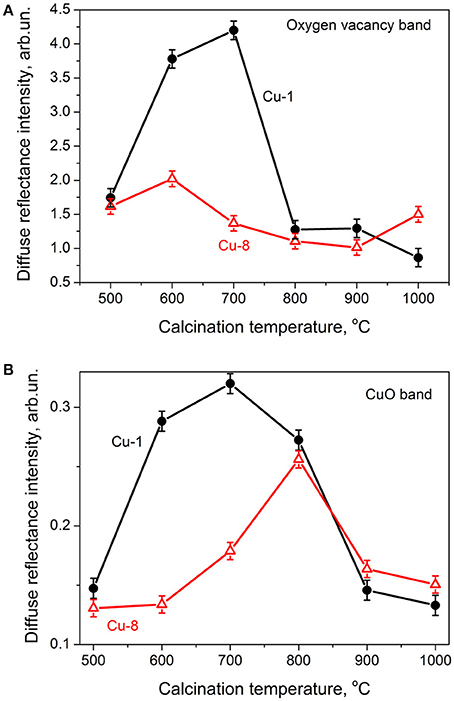
Figure 5. Dependence of intensity of 275 nm band (A) and 600–900 nm band (B) vs. calcination temperature.
The intensity of the band in the 600–900 nm range increases with Tc rise up to 700–800°C, in a more pronounced manner with Cu-1 samples. For higher calcination temperatures, the intensity of this band decreases in both sets of samples (Figure 5B).
The band in the 600–900 nm range is usually attributed to d-d transitions of the Cu2+ ions in an octahedral or tetragonal distorted octahedral surrounding (Goff et al., 1999; Pakharukova et al., 2009) and associated with dispersed CuO on the surface of the nanocrystals (Goff et al., 1999) or with CuZr substitutional atoms located in the near-surface region (Pakharukova et al., 2009; Samson et al., 2014). As for the change of this band intensity, additional information will be obtained from the EPR study.
EPR Spectra
EPR spectra of studied samples are shown in Figure 6. Depending on Tc values, two types of EPR spectra are present in our samples in a similar way to those obtained for samples prepared from nitrate raw materials (Korsunska et al., 2015a, 2017). The first type (spectrum I) is observed for Cu-1 samples calcined at Tc = 500–800°C and in Cu-8 samples calcined at Tc = 500–900°C. The other kind of EPR spectrum (spectrum II) contains a set of irregular shape lines in a wide range of magnetic fields and is detected in samples calcined at higher temperatures (Tc = 800–1,000°C for Cu-1 samples and Tc = 1,000°C for Cu-8 ones) when the intensity of spectrum I decreases (Figure 6).
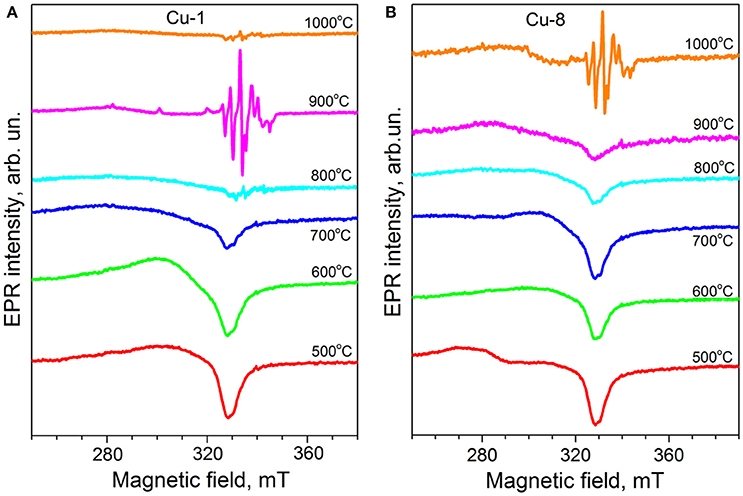
Figure 6. EPR spectra of (A) Cu-1 and (B) Cu-8 samples calcined at 500–1,000°C.
The analysis of EPR spectra of different samples shows that spectrum I consists at least of three signals (Figure 7). The first component (s1) exhibits the characteristic copper hyperfine splitting and can be described by the following spin-Hamiltonian parameters g⊥ = 2.072, g|| = 2.32, A⊥ ~ 0 G, A|| ~ 150 G. Some features at the minimum of these EPR spectra (at ~330 mT) indicate that s1 component is non-elementary and consists of, at least, two signals with close parameters. The detailed analysis of this feature is in progress.
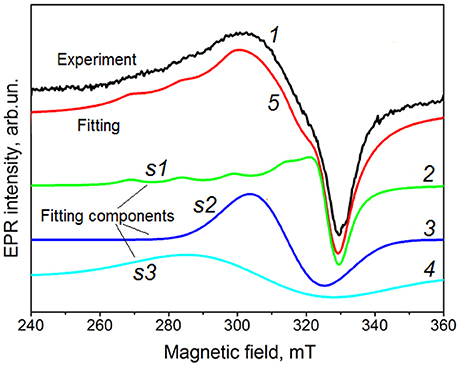
Figure 7. EPR spectrum of the Cu-8 sample calcined at 600°C (1) and its decomposition on three components s1 (2), s2 (3), and s3 (4). Curve 5 represents the result of the fitting of total EPR spectrum. This curve is shifted for clarity. The experimental EPR spectrum is spectrum I type as described in the text.
Two others components (s2 and s3) are single unstructured lines with g~2.15 and g~2.20, respectively. Because these signals are absent in Cu-free samples, it can be assumed that they are also caused by Cu-related centers. In this case, the absence of Cu-related hyperfine structure can be explained by exchange interaction between copper ions.
Upon Tc increase, the intensities of all signals of the spectrum I decrease monotonically (Figure 6). As observed in Figure 6 and Figure S3, the intensity decrease of spectrum I is accompanied by the decrease of the amount of water molecules and OH groups at the surface of the nanocrystals. On the other hand, in spite of the similar temperature dependence of the content of OH-groups or H2O molecules in both sets of samples, spectrum I remains in Cu-8 samples at higher temperatures than in their Cu-1 counterparts. The latter fact can be related with the higher tetragonal phase contribution in Cu-8 samples. Therefore, this spectrum can be more likely assigned to the surface complex containing OH-groups or H2O molecules and located at the surface of the crystals with tetragonal structure. Similar complexes containing Cu ions and different ligands were observed also in other Cu doped oxides (Altynnikov et al., 2006). Taking into account the complexity of EPR spectrum I it can be supposed that other ligands can also take part in the formation of surface complexes in our samples.
The spectrum II is observed in the samples calcined at higher temperatures (800–1,000°C) when the contribution of spectrum I decreases. This signal is similar to that observed in the samples prepared from the nitrate raw material and can be ascribed to ions in monoclinic structure (Korsunska et al., 2017).
Discussion
The analysis of XRD results described above allows obtaining information on copper localization in the powders. The shift of XRD reflections for Cu-1 and Cu-8 samples calcined at Tc = 500°C to higher angles in comparison with those for Cu-free ZrO2-3 mol% Y points out the presence of copper inside the nanocrystals. This statement is confirmed by our earlier study of the powders with the same Cu content, but grown from Zr nitrate (Korsunska et al., 2017), when a more pronounced shift of XRD peak position to higher angles was found for the samples with higher Cu content. This behavior of XRD reflections indicates that in the case of Zr oxychloride the incorporation of copper distorts the ZrO2 lattice in a weaker manner than in the case of Zr nitrate. This could be explained by the presence of chlorine inside the nanocrystals. Since the ionic radius of chlorine is larger than that of oxygen, and the ionic radius of copper is smaller than that of zirconium, the total displacement of the XRD peaks can be reduced due to compensating effect of both impurities.
The dependences of tetragonal XRD peak position on Tc allow the tracking of Cu reallocation upon Tc increase. As shown by Figure 3A, the XRD reflection of tetragonal phase for Cu-1 samples shifts to higher angles when Tc increases up to 600°C. Such behavior of XRD peaks can be tentatively assigned to an additional Cu incorporation into the nanocrystals from Cu-containing surface complexes upon heating.
When Tc > 600°C, the tetragonal peak position in Cu-1 samples shifts to lower angles (Figure 3A). One of the reasons of this shift can be a Cu out-diffusion to the grains surface because the out-diffusion of both Y and Cl has to result in opposite peak shift. This conclusion is confirmed by the fact that for Cu-1 sample calcined at 900°C the peak position is close to that in the samples doped with Y only (Figure 3A). Thus, for Tc = 900°C, considerable part of Cu migrated from the tetragonal crystal lattice to form surface complexes.
However, the most significant peak shift to lower angles for the tetragonal (and/or cubic) phase for Cu-1 samples takes place at Tc = 1,000°C when a great increase of the monoclinic phase contribution is observed. In this case, the peak position is found at lower angles than those observed for the samples doped with Y only. One of the reasons of such a peak behavior could be the presence of some species onto the crystallite surface such as CuO, Cu or yttrium cuprate. However, their presence could not shift the tetragonal peak toward lower angles because the lattice constants of these species are smaller than that of tetragonal ZrO2. At the same time, it is also possible that the presence of chlorine could favor the formation of other surface compounds with lattice parameters exceeding that of ZrO2. In particular, such compounds could be CuCl, CuCl2 or copper oxychloride.
Another reason for this XRD peak shift for the Cu-1 sample calcined at 1,000°C could be the sintering of nanocrystallites, which stretches the tetragonal phase due to direct contact with the monoclinic one. Such an effect was observed in copper-doped samples obtained from Zr nitrate (Korsunska et al., 2014, 2017). It was shown that calcination at high temperatures stimulates the Cu out-diffusion from nanocrystals and formation of surface CuO favoring the sintering process. If CuCl or CuCl2 appear on the nanocrystals surface, the XRD reflections of both tetragonal and monoclinic phases should shift toward lower angles. On the contrary, in the case of sintering, the monoclinic phase reflections should shift to higher angles, as observed experimentally (Figure 3B). Therefore, one can consider that the sintering process is the main reason for the shift of XRD reflections for Cu-1 samples after calcination at 1,000°C.
In the case of Cu-8 samples, the shift of the XRD peaks for tetragonal phase is insignificant and occurs toward lower angles. However, their position is found at higher angles than those observed for the samples doped with Y only (Figure 3A). This may indicate that the majority of copper in these samples remains inside the nanocrystals (i.e., the process of out-diffusion is negligible). The absence of XRD peak shift for the sample calcined at 600°C may be caused by a low number of Cu atoms that could be additionally embedded in the grain volume from surface complexes taking into account the already high amount of Cu atoms inside the grains. On the other hand, the weaker Cu out-diffusion for Cu-8 samples explains the smaller shift of the XRD peak of the monoclinic phase toward higher angles. Indeed, in this case, a smaller amount of CuO is expected on the surface of the nanocrystals that hinders sintering process. Furthermore, in these samples, the amount of monoclinic phase is insignificant, reducing the contact area of different ZrO2 phases that minimizes sintering process.
The assumption of copper relocation with Tc increase is in good agreement with the changes in the crystalline structure of the samples. In particular, more intensive Cu out-diffusion in Cu-1 samples compared with that in Cu-8 samples has to result in a larger contribution of the monoclinic phase, the appearance of higher amount of CuO on the grain surface and, as consequence, an enhancement of tensile stresses (Korsunska et al., 2014, 2017). These stresses can also be the reason of tetragonal-to-cubic transformation for Cu-1 samples. In fact, tensile stresses stimulate the formation of cubic ZrO2 (Pugachevskii et al., 2011; Bagmut et al., 2016), while compressive stress leads to the transformation of tetragonal phase to monoclinic one (Marin et al., 2013).
As a summary, the results obtained for samples synthesized from Zr oxychloride can be explained with the assumption that, by contrast to samples prepared from Zr nitrate, a significant number of copper atoms can remain inside the nanocrystals even for high Tc values. This difference can be assigned to the presence of Cl ions inside the nanocrystals, which can prevent Cu out-diffusion from ZrO2 nanocrystals. Indeed, this can be caused by the minimization of mechanical stresses. On the other hand, chlorine, being a donor, participates in charge compensation of copper (acceptor). Such compensation can be energetically more advantageous than the compensation by oxygen vacancies, which occurs in Cl-free powders (Korsunska et al., 2014). In addition, the simultaneous presence of copper (acceptor) and chlorine (donor) can lead to the appearance of Coulomb interaction between them, i.e., to the formation of distributed donor-acceptor pairs, which can also contribute to the retention of not only Cu but also Cl inside the nanocrystals. In fact, in unalloyed oxides derived from chlorine raw materials, chlorine is removed for temperatures below 500°C (Rao et al., 2018).
It is obvious, that the average distance between Cu and Cl atoms depends on the copper concentration. Therefore, it can be assumed that in Cu-8 samples, these complexes are closer keeping Cu and Cl mainly inside the nanocrystals, while in Cu-1 samples Cu can leave the grains, stimulating the monoclinic phase appearance. The presence of chlorine in all the samples was confirmed by STEM HAADF and EDX data as well as with Auger spectra (Figures S4, S5) showing a nearly equal Cu and Cl amount. Indeed, from Auger spectra, the content of Cu and Cl on the grain surface was estimated at 0.5 ± 0.03 and 0.3 ± 0.02 at %, respectively. After etching, the content of copper and chlorine was evaluated as 1.3 ± 0.06 and 1 ± 0.05 at%, respectively, by repeating recording the Auger spectrum at the same analysis area under the same conditions. Thus, it is confirmed that the concentration of copper and chlorine in the volume of the Cu-8 nanoparticle is greater than on its surface (Figure S4).
The conclusion about Cu relocation drawn from XRD data is further confirmed by ATR, diffuse reflectance and EPR studies of the same samples, providing also information on the nature of surface complexes containing Cu.
Specifically, the observation of 270 nm band reveals the presence of Cu and Y in nanocrystals. In fact, the incorporation of subvalent metallic impurity results in the formation of oxygen vacancies (donors) required for charge compensation. As shown earlier (Korsunska et al., 2017), in the presence of yttrium, additional doping of zirconia with Cu is responsible for the main contribution in vacancy concentration, obviously due to a higher difference in the valences of Cu and Zr ions in comparison with that of Y and Zr.
On another hand, in the case of oxychloride raw materials, charge compensation can be achieved by Cl that also acts as donor. In this regard, the role of both Cl and O vacancies has to be taken into account in the analysis of the oxygen vacancy-related band intensity in the UV diffuse reflectance spectra. As shown by Figures 4, 5, for Tc = 500°C the intensity of this band is nearly the same for Cu-1 and Cu-8 samples despite the high difference in Cu content. Therefore, one can conclude that in both sets of samples the compensation is predominantly achieved by chlorine. This is in good agreement with Auger data evidencing a nearly equal Cu and Cl amount. The main enhancement of oxygen vacancy-related band in Cu-1 samples when Tc rises from 500 to 700°C can be assigned to an increase of the Cu content in the nanocrystal volume and is consistent with XRD data related with the shift of the tetragonal peak position to higher angles (Figure 3).
The enrichment of nanocrystals with Cu can be assigned to the Cu in-diffusion from the Cu-related surface complexes observed in EPR spectra (Figure 6). In fact, the Tc increase leads to the decrease of corresponding EPR signal intensity due to destruction of these complexes as a result of the loss of water or OH-groups (Figure S3). In this case the compensation of incorporated Cu is expected to be realized by oxygen vacancies that explained the sharp enhancement of 270 nm band in Cu-I samples.
Simultaneously with the Cu incorporation in the grains the intensity of CuO-related absorption band (in the range of 600–900 nm) increases (Figure 5B). This finding can be explained by the following: part of Cu2+ ions, arising from the destruction of surface complexes, incorporates additionally into nanocrystals volume, while another part is oxidized forming CuO molecules. Such a process was observed earlier in similar powders produced from Zr nitrate raw material testifying that this behavior is not due to Cl out-diffusion (Korsunska et al., 2017).
Besides, the weakening of the 270-nm band in Cu-1 samples at higher Tc values can be the evidence of a Cu content decrease due to its out-diffusion from the grains. This is also in agreement with the XRD peak shift to lower angles and the appearance of noticeable amount of monoclinic phase (Figures 1, 2, 4, 5). It can be expected that the Cu out-diffusion will result in the increase of Cu amount at the surface and the enhancement of CuO-related absorption band. However, Figures 4, 5 show the weakening of this band at 800–900°C. Such a behavior can be explained by the sintering process followed by a cubic ZrO2 phase formation. Besides, another possible reason for CuO band weakening could be the formation of Y cuprate that can be formed at 850°C (Winnubst et al., 2009). In fact, for our powders, both Cu and Y out-diffuse simultaneously at Tc > 800°C (Korsunska et al., 2014, 2017) that should stimulate formation of Y cuprate.
For Cu-8 samples, the intensity of oxygen vacancy-related band increases insignificantly with Tc, which reveals the slight variation of Cu content inside nanocrystals, as well as a minor influence of both in- and out-diffusion processes. This statement is in agreement with XRD data showing the only slight shift of tetragonal peak and the low content of monoclinic phase (Figure 2).
Thus, the synthesis approach used allows obtaining nanocomposites with copper located both inside and on the surface of the nanocrystals, while variation of the calcination temperature controls surface-volume dopant diffusion processes. In the case of Cu dopant, its redistribution between bulk and surface of nanocrystals leads to the transformation of crystalline structure and the formation of Cu-related surface entities (CuO or Cu-OH complexes). However, both the Cu-relocation extent and the oxygen vacancies density depend on Cu content. The higher is the Cu content, the weaker is the process of Cu out-diffusion and the lower oxygen vacancies concentration. The main reason of this behavior is supposed to be the presence of Cl ions inside the nanocrystals whose number depends on Cu-content also. The incorporation of Cl ions results in Cu charge compensation, decreasing the density of oxygen vacancies, and preventing Cu out-diffusion and formation of Cu surface entities.
As previously reported (Samson et al., 2014; Pakharukova et al., 2015), CuO plays a significant role in the catalytic activity of Cu-doped oxides. In our case, according to the observed CuO content on the surface of the grains, we expect a higher catalytic activity for the Cu-1 samples. This assumption was proved by the PROX-CO reaction used as a catalytic test with Cu-1 and Cu-8 samples calcinated at 600°C (Figure 8). The results indeed confirm a higher CO oxidation efficiency for the Cu-1 sample.
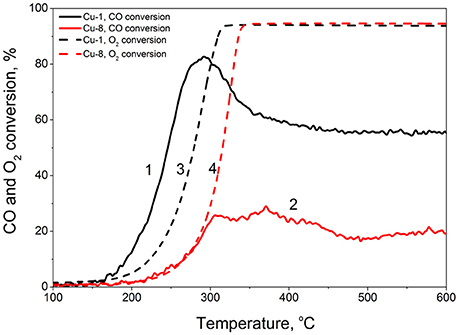
Figure 8. PROX-CO reaction for Cu-1 (1,3) and Cu-8 (2,4) samples calcined at 600°C: CO conversion (1,2) and O2 conversion (3,4).
Several catalytic tests were thus performed over this formulation. Cu based technology was described as efficient to avoid ammonia slip from NH3 SCR process (Jablonska and Palkovits, 2016). Therefore, the Cu-1 catalyst was tested in the ammonia oxidation reaction. While conversion reached values as high as 90% from 330°C, the N2 selectivity was low (data not shown) and alternative test reaction was searched. The preferential CO oxidation in presence of excess H2 (PROX) is of paramount importance for fuel cell applications demanding high purity hydrogen feed (Park et al., 2009). Several catalytic formulations involving CuO and ZrO2 were reported as promising for CO PROX (Moura et al., 2014; Moretti et al., 2017), while Moretti et al. (2011) focused on the effect of thermal treatment on a CuO-CeO2-ZrO2 catalytic composition up to 650°C. We thus believed interesting to compare the catalytic behavior in PROX-CO for both Cu-1 and Cu-8 calcined at similar temperature, i.e., 600°C. The Figure 8 describes the evolution of both the CO conversion (solid lines) and O2 conversion (dashed lines) with reaction temperature. Two main indicators are important to evaluate the PROX efficiency of a given catalyst, i.e., the maximum CO conversion reached (with corresponding Tmax temperature) and the O2 selectivity toward CO2 defined as:
While the Cu-8 sample presents poor characteristics with its best CO conversion of 30% reached at Tmax = 370°C, the Cu-1 catalyst shows despites its lower Cu content rather interesting properties. It indeed allows up to 80% CO conversion at much lower Tmax = 280°C. Furthermore, the SO2 → CO2 value increases from 33 to 45% when moving from Cu-8 to Cu-1. These results thus clearly indicate a higher CO oxidation efficiency and higher O2 selectivity toward CO2 for the Cu-1 sample. These data are consistent with its higher CuO content at the grain surface compared to the Cu-8 sample.
Conclusions
The influence of chlorine dopant and calcination temperature on copper localization in Cu-doped YSZ with different Cu content prepared by co-precipitation technique was studied. The variation of calcination temperature stimulates the following processes: (i) copper in-diffusion caused by destroying of Cu-related surface complexes; (ii) copper out-diffusion resulted in the t-c-m transformation and CuO appearance on grain surface. These two main processes depend also on Cu content.
The processes of surface-volume copper redistribution are well marked for Cu-1 samples, being almost absent for Cu-8 ones. The main reason of this phenomenon is assumed to be the presence of Cl ions inside the nanocrystals that would prevent Cu out-diffusion due to Coulomb interaction between Cl (donor) and Cu (acceptor) and minimization of mechanical stresses. The chlorine ions acting as donors are proposed to decrease the number of oxygen vacancies required for the compensation of Cu ions. The difference in the calcination temperature effect on the properties of Cu-1 and Cu-8 samples is assumed to be caused by different distances between Cu and Cl ions inside the grains. In the case of high enough Cu content the presence of Cl would then also prevent the formation of CuO at the grain surface that further reduces the catalytic activity of the materials.
Author Contributions
NK planned and supervised the experimental work, participated in some experiments and their interpretation; YP performed XRD experiment; MB, VN, and IV carried out EPR study and interpretation of EPR data; SL performed diffuse reflectance and ATR experiment; SP performed Auger experiment; OM investigated catalytic activity of the powders; XP performed the electron microscopy work to get chemical maps of the powders; LK designed the research, participated in the experiments and their interpretation; NK and LK prepared the draft of this paper. All authors corrected and approved the final version of the paper.
Conflict of Interest Statement
The authors declare that the research was conducted in the absence of any commercial or financial relationships that could be construed as a potential conflict of interest.
Acknowledgments
This work was partly supported by the National Academy of Sciences of Ukraine (project III-4-16 and project III-41-17), the Ministry of Education and Science of Ukraine (grant ID:89452), French-Ukrainian bilateral program DNIPRO (project 37884WC), and by the GENESIS EQUIPEX Program [PIA, ANR (ANR-11-EQPX-0020) and Normandie Region]. Authors thank also Dr. O. Gorban from O. O. Galkin Donetsk Institute for Physics and Engineering (NAS Ukraine) for the powders' preparation.
Supplementary Material
The Supplementary Material for this article can be found online at: https://www.frontiersin.org/articles/10.3389/fmats.2018.00023/full#supplementary-material
Footnotes
1. ^Korsunska, N., Baran, M., Papusha, V., Lavoryk, S., Marchylo, O., Michailovska, K., et al. (under review). The peculiarities of light absorption and light emission in Cu-doped Y-stabilized ZrO2 nanopowders. Submitted to Appl. Nanosci.
References
Altynnikov, A. A., Tsikoza, L. T., and Anufrienko, V. F. (2006). Ordering of Cu(II) ions in supported copper-titanium oxide catalysts. J. Struct. Chem. 47, 1161–1169. doi: 10.1007/s10947-006-0439-9
Asadikiya, M., and Zhong, Y. (2018). Oxygen ion mobility and conductivity prediction in cubic yttria-stabilized zirconia single crystals. J. Mater. Sci. 56, 1699–1709. doi: 10.1007/s10853-017-1625-1
Bagmut, A. G., Bagmut, I. A., and Reznik, N. A. (2016). Formation of ZrO2 cubic phase microcrystals during crystallization of amorphous films deposited by laser ablation of Zr in an oxygen atmosphere. Phys. Solid State 58, 1221–1224. doi: 10.1134/S1063783416060056
Bansal, P., Chaudhary, G. R., and Mehta, S. K. (2015). Comparative study of catalytic activity of ZrO2 nanoparticles and photocatalytic degradation of cationic and anionic dyes. Chem. Eng. 280, 475–485. doi: 10.1016/j.cej.2015.06.039
Bhagwat, M., Ramaswamy, A. V., Tyagi, A. K., and Ramaswamy, V. (2003). Rietveld refinement study of nanocrystalline copper doped zirconia. Mater. Res. Bull. 38, 1713–1724. doi: 10.1016/S0025-5408(03)00201-0
Briggs, D., and Seah, M. P. (1990). Practical Surface Analysis, 2nd Edn., Vol I. Auger and X-Ray Photoelectron Spectroscopy. New York, NY: John Wiley.
Cho, B. O., Lao, S. X., and Chang, J. P. (2003). Origin and effect of impurity incorporation in plasma-enhanced ZrO2 deposition. J. Appl. Phys. 93, 9345–9251. doi: 10.1063/1.1572193
Du, X., Li, H.-Y., Yu, J., Xiao, X., Shi, Z. H., Maoa, D., et al. (2015). Realization of a highly effective Pd–Cu–Clx/Al2O3 catalyst for low temperature CO oxidation by pre-synthesizing the active copper phase of Cu2Cl(OH)3. Catal. Sci. Technol. 5, 3970–3979. doi: 10.1039/C5CY00545K
Fidelus, J. D., Lojkowski, W., Millers, D., Smits, K., and Grigorjeva, L. (2009). Advanced nanocrystalline ZrO2 for optical oxygen sensors. IEEE Sensors 9, 1268–1272. doi: 10.1109/ICSENS.2009.5398385
Fischer, S., Fleischer, M., Magori, E., Pohle, R., and Straub, N. (2017). Gas Sensor and Method For Detecting Oxygen. U.S. Patent No. 2017/0227487 A1. Washington, DC: U.S. Patent and Trademark Office.
Goff, J. P., Hayes, W., Hull, S., Hutchings, M. T., and Clausen, K. N. (1999). Defect structure of yttria-stabilized zirconia and its influence on the ionic conductivity at elevated temperatures. Phys. Rev. B 59, 14202–14219. doi: 10.1103/PhysRevB.59.14202
Gross, M. D., Vohs, J. M., and Gorte, R. J. (2007). A study of thermal stability and methane tolerance of Cu-based SOFC anodes with electrodeposited Co. Electrochim. Acta 52, 1951–1957. doi: 10.1016/j.electacta.2006.08.005
Habibi, M. H., Wang, L., Liang, J., and Guo, S. M. (2013). An investigation on hot corrosion behavior of YSZ-Ta2O5 in Na2SO4+V2O5 salt at 1100°C. Corros. Sci. 75, 409–414. doi: 10.1016/j.corsci.2013.06.025
Jablonska, M., and Palkovits, R. (2016). Copper based catalysts for the selective ammonia oxidation into nitrogen and water vapour-recent trends and open challenges. Appl. Catal. Environ. 181, 332–351. doi: 10.1016/j.apcatb.2015.07.017
Jia, R., Yang, W., Bai, Y., and Li, T. (2006). Upconversion photoluminescence of ZrO2:Er3+ nanocrystals synthesized by using butadinol as high boiling point solvent. Opt. Mater. 28, 246–249. doi: 10.1016/j.optmat.2004.11.034
Kajiyama, N., and Nakamura, T. (2015). Electrode For Use in Gas Sensor and Gas Sensor Element Using The Same. U.S. Patent No 2015/0293051 A1. Washington, DC: U.S. Patent and Trademark Office.
Khomenkova, L., Lehninger, D., Kondratenko, O., Ponomaryov, S., Gudymenko, O., Tsybrii, Z., et al. (2017). Effect of Ge content on the formation of Ge nanoclusters in magnetron-sputtered GeZrOx-based structures. Nanoscale Res. Lett. 12:196. doi: 10.1186/s11671-017-1960-9
Kirm, M., Aarik, J., and Sildos, I. (2005). Thin films of HfO2 and ZrO2 as potential scintillators. Nucl. Instrum. Methods Phys. Res. A. 537, 251–255. doi: 10.1016/j.nima.2004.08.020
Kong, L., Bi, Q., Zhu, S. H., Qiao, Z. H., Yang, J., and Liu, W. (2014). Effect of CuO on self-lubricating properties of ZrO2(Y2O3)-Mo composites at high temperatures. J. Europ. Ceram. Soc. 34, 1289–1296. doi: 10.1016/j.jeurceramsoc.2013.11.027
Korsunska, N., Baran, M., Polishchuk, Y. U., Kolomys, O., Stara, T., Kharchenko, M., et al. (2015a). Structural and luminescent properties of (Y, Cu)-codoped zirconia nanopowders. ECS J. Solid State Sci. Technol. 4, N103–N110. doi: 10.1149/2.0021509jss
Korsunska, N., Baran, M., Vorona, I., Nosenko, V., Lavoryk, S., Portier, X., et al. (2017). Impurity-governed modification of optical and structural properties of ZrO2-based composites doped with Cu and Y. Nanoscale Res. Lett. 12:157. doi: 10.1186/s11671-017-1920-4
Korsunska, N., Baran, M., Zhuk, A., Polishchuk, Y. U., Stara, T., Kladko, V., et al. (2014). Role of paramagnetic defects in light emission processes in Y-doped ZrO2 nanopowder. Mater. Res. Express 1:045011. doi: 10.1088/2053-1591/1/4/045011
Korsunska, N., Stara, T., Khomenkova, L., Poslishchuk, Y. U., Kladko, V., Michailovska, K., et al. (2015b). Effect of Cu- and Y-codoping on structural and luminescent properties of zirconia based nanopowders. ECS Trans. 66, 313–319. doi: 10.1149/06601.0313ecst
López, T., Alvarez, M., Gómez, R., Aguilar, D. H., and Quintana, P. (2005). ZrO2 and Cu/ZrO2 sol–gel materials spectroscopic characterization. J. Sol-Gel. Sci. Technol. 33, 93–97. doi: 10.1007/s10971-005-6706-y
Ma, Z.-Y., Yang, C., Wie, W., Li, W.-H., and Sun, Y.-H. (2005). Catalytic performance of copper supported on zirconia polymorphs for CO hydrogenation. J. Mol. Catal. A. Chem. 231, 75–81. doi: 10.1016/j.molcata.2004.12.026
Marin, R., Sponchia, G., Zucchetta, E., Riello, P., Enrichi, F., De Portu, G., et al. (2013). Monitoring the t→m martensitic phase transformation by photoluminescence emission in Eu3+-doped zirconia powders. J. Am. Ceram. Soc. 96, 2628–2635. doi: 10.1111/jace.12363
Minh, N. Q. (1993). Ceramic fuel cells. J. Am. Ceram. Soc. 76, 563–588. doi: 10.1111/j.1151-2916.1993.tb03645.x
Moretti, E., Molina, A. I., Sponchia, G., Talon, A., Frattini, R., Rodriguez-Castellon, E., et al. (2017). Low-temperature carbon monoxide oxidation over zirconia-supported CuO-CeO2 catalysts: effect of zirconia support properties. Appl. Surf. Sci. 403, 612–622. doi: 10.1016/j.apsusc.2017.01.095
Moretti, E., Storaro, L., Talon, A., Lenarda, M., Riello, P., Frattini, R., et al. (2011). Effect of thermal treatments on the catalytic behaviour in the CO preferential oxidation of a CuO-CeO2-ZrO2 catalyst with a flower-like morphology. Appl. Catal. Environ. 102, 627–637. doi: 10.1016/j.apcatb.2011.01.004
Moura, J. S., Fonseca, J. D. L., Bion, N., Epron, F., Silva, T. D., Maciel, C. G., et al. (2014). Effect of lanthanum on the properties of copper, cerium and zirconium catalysts for preferential oxidation of carbon monoxide. Catal. Today 228, 40–50. doi: 10.1016/j.cattod.2013.11.016
Padture, N. P., Gell, M., and Jordan, E. H. (2002). Thermal barrier coatings for gas-turbine engine applications. Science 296, 280–284. doi: 10.1126/science.1068609
Pakharukova, V. P., Moroz, E. M., Kriventsov, V. V., Larina, T. V., Boronin, A. I., Dolgikh, L. Y., et al. (2009). Structure and state of copper oxide species supported on yttria-stabilized zirconia. J. Phys. Chem. C 113, 21368–21375. doi: 10.1021/jp907652n
Pakharukova, V. P., Moroz, E. M., Zyuzin, D. A., Ishchenko, A. V., Dolgikh, L. Y., and Strizhak, P. E. (2015). Structure of copper oxide species supported on monoclinic zirconia. J. Phys. Chem. C 119, 28828–28835. doi: 10.1021/acs.jpcc.5b06331
Park, E. D., Lee, D., and Lee, H. C. (2009). Recent progress in selective CO removal in a H2-rich stream. Catal. Today 139, 280–290. doi: 10.1016/j.cattod.2008.06.027
Ponomaryov, S. S., Yukhymchuk, V. O., and Valakh, M. Y. (2016a). Drift correction of the analyzed area during the study of the lateral elemental composition distribution in single semiconductor nanostructures by scanning Auger microscopy. Semiconduct. Phys. Quant. Electr. Optoelectr. 19, 321–327. doi: 10.15407/spqeo19.04.321
Ponomaryov, S. S., Yukhymchuk, V. O., Lytvyn, P. M., and Valakh, M. Y. (2016b). Direct determination of 3D distribution of elemental composition in single semiconductor nanoislands by scanning Auger microscopy. Nanoscale Res. Lett. 11:103. doi: 10.1186/s11671-016-1308-x
Pugachevskii, M. A., Zavodinskii, V. G., and Kuz'menko, A. P. (2011). Dispersion of zirconium dioxide by pulsed laser radiation. Tech. Phys. 56, 254–258. doi: 10.1134/S1063784211020241
Ran, S., Winnubst, A. J. A., Blank, D. H. A., Pasaribu, H. R., Sloetjes, J.-W., and Schipper, D. J. (2007). Effect of microstructure on the tribological and mechanical properties of CuO-doped 3Y-TZP ceramics. J. Am. Ceram. Soc. 90, 2747–2752. doi: 10.1111/j.1551-2916.2007.01823.x
Rao, A., Pundir, V. S., Tiwari, A., Padarthi, Y., Rao, N. V. M., Aich, S., et al. (2018). Investigating the effect of dopant type and concentration on TiO2 powder microstructure via rietveld analysis. J. Phys. Chem. Sol. 113, 164–176. doi: 10.1016/j.jpcs.2017.10.030
Reiter, W., and Seyr, P. (2016). Gas Sensor Element. U.S. Patent No 2016/0161441 A1. Washington, DC: U.S. Patent and Trademark Office.
Restivo, T. A. G., and Mello-Castanho, S. R. H. (2009). Sintering studies on Ni–Cu–YSZ SOFC anode cermet processed by mechanical alloying. J. Therm. Anal. Calorim. 97, 775–780. doi: 10.1007/s10973-009-0330-y
Samson, K., Sliwa, M., Socha, R. P., Góra-Marek, K., Mucha, D., Rutkowska-Zbik, D., et al. (2014). Influence of ZrO2 structure and copper electronic state on activity of Cu/ZrO2 catalysts in methanol synthesis from CO2. ACS Catal. 4, 3730–3741. doi: 10.1021/cs500979c
Schulz, U., Fritscher, K., and Peters, M. (1996). EB-PVD Y2O3- and CeO2-Y2O3-stabilized zirconia thermal barrier coatings - crystal habit and phase composition. Surf. Coat. Technol. 82, 259–269. doi: 10.1016/0257-8972(95)02727-0
Sherif, A. S., and Hachtmann, J. E. (1980). Stable Copper Zirconium Complex Salt Solutions for Enhancing the Resistance to Rot of Cotton Fabrics. U.S. Patent No 4,200,672. Washington, DC: U.S. Patent and Trademark Office.
Srinivasan, R., De Angelis, R., Ice, G., and Davis, B. (1991). Identification of tetragonal and cubic structures of zirconia using synchrotron X-radiation source. J. Mater. Res. 6, 1287–1292. doi: 10.1557/JMR.1991.1287
Sun, C., and Stimming, U. J. (2007). Recent anode advances in solid oxide fuel cells. J. Power Sources 171, 247–260. doi: 10.1016/j.jpowsour.2007.06.086
Sun, Y., and Sermon, P. A. (1994). Evidence of a metal-support in sol-gel derived Cu-ZrO2 catalysts for CO hydrogenation. Catal. Lett. 29, 361–369. doi: 10.1007/BF00807115
Wang, F., Banerjee, D., Liu, Y., Chen, X., and Liu, X. (2010). Upconversion nanoparticles in biological labeling, imaging, and therapy. The Analyst 135, 1839–1854. doi: 10.1039/c0an00144a
Wang, L.-C., Liu, Q., Chen, M., Liu, Y.-M., Cao, Y., Hey-Yong, H., et al. (2007). Structural evolution and catalytic properties of nanostructured Cu/ZrO2 catalysts prepared by oxalate gel-coprecipitation technique. J. Phys. Chem. C 111, 16549–16557. doi: 10.1021/jp075930k
Winnubst, L., Ran, S., Speets, E. A., and Blank, D. H. A. (2009). Analysis of reactions during sintering of CuO-doped 3Y-TZP nano-powder composites. J. Europ. Ceram. Soc. 29, 2549–2557. doi: 10.1016/j.jeurceramsoc.2009.02.009
Zhang, C., Li, C.-J., Zhang, G., Ning, X.-J., Li, C.-X., Liao, H., et al. (2007). Ionic conductivity and its temperature dependence of atmospheric plasma-sprayed yttria stabilized zirconia electrolyte. Mater. Sci. Eng. B 137, 24–30. doi: 10.1016/j.mseb.2006.10.005
Zhang, Y. S., Hu, L. T., Zhang, H., Chen, J. M., and Liu, W. M. (2008). Microstructural characterization and crystallization of ZrO2-Y2O3-CuO solid solution powders. J. Mater. Proc. Technol. 198, 191–194. doi: 10.1016/j.jmatprotec.2007.06.088
Keywords: Y-stabilized ZrO2, copper, doping, surface complexes, crystalline phase transformation
Citation: Korsunska N, Polishchuk Y, Baran M, Nosenko V, Vorona I, Lavoryk S, Ponomaryov S, Marie O, Portier X and Khomenkova L (2018) Peculiarities of Thermally Activated Migration of Subvalent Impurities in Cu-Doped Y-Stabilized ZrO2 Nanopowders Produced From Zr Oxychlorides. Front. Mater. 5:23. doi: 10.3389/fmats.2018.00023
Received: 08 January 2018; Accepted: 03 April 2018;
Published: 24 April 2018.
Edited by:
Alexey A. Sokol, University College London, United KingdomReviewed by:
Steve Suib, University of Connecticut, United StatesMargarita Sánchez-Domínguez, Centro de Investigación en Materiales Avanzados, Mexico
Copyright © 2018 Korsunska, Polishchuk, Baran, Nosenko, Vorona, Lavoryk, Ponomaryov, Marie, Portier and Khomenkova. This is an open-access article distributed under the terms of the Creative Commons Attribution License (CC BY). The use, distribution or reproduction in other forums is permitted, provided the original author(s) and the copyright owner are credited and that the original publication in this journal is cited, in accordance with accepted academic practice. No use, distribution or reproduction is permitted which does not comply with these terms.
*Correspondence: Larysa Khomenkova, a2hvbWVuQHVrci5uZXQ=