 Nicola Stehling
 Kerry J. Abrams
 Chris Holland
 Cornelia Rodenburg
- Department of Materials Science and Engineering, University of Sheffield, Sheffield, United Kingdom
The excellent mechanical properties of spider dragline silk are closely linked to its multiscale hierarchical structuring which develops as it is spun. If this is to be understood and mimicked, multiscale models must emerge which effectively bridge the length scales. This study aims to contribute to this goal by exposing structures within Nephila dragline silk using low-temperature plasma etching and advanced Low Voltage Scanning Electron Microscopy (LV-SEM). It is shown that Secondary Electron Hyperspectral Imaging (SEHI) is sensitive to compositional differences on both the micro and nano scale. On larger scales it can distinguish the lipids outermost layer from the protein core, while at smaller scales SEHI is effective in better resolving nanostructures present in the matrix. Key results suggest that the silks spun at lower reeling speeds tend to have a greater proportion of smaller nanostructures in closer proximity to one-another in the fiber, which we associate with the fiber's higher toughness but lower stiffness. The bimodal size distribution of ordered domains, their radial distribution, nanoscale spacings, and crucially their interactions may be key in bridging the length scale gaps which remain in current spider silk structure-property models. Ultimately this will allow successful biomimetic implementation of new models.
Introduction
Spider silk is of great interest to a range of scientific communities due to its high-performance and unique mechanical properties (Vollrath and Porter, 2009; Walker et al., 2015; Koeppel and Holland, 2017; Holland et al., 2018b). These properties are attributed to a hierarchical arrangement of ordered and disordered protein structures within a single fiber (Vollrath and Porter, 2009; Vollrath et al., 2011; Porter et al., 2013). This nanostructure has been extensively explored by bulk and space-averaging techniques such as calorimetry (Cebe et al., 2013; Vollrath et al., 2014; Holland et al., 2018a), spectroscopy (Dicko et al., 2007; Boulet-Audet et al., 2015) small angle scattering X-ray and neutron diffraction (Termonia, 1994; Riekel et al., 2000; Greving et al., 2010; Wagner et al., 2017) and solid state nuclear magnetic resonance (NMR) (Willis et al., 1972; Hijirida et al., 1996; Kümmerlen et al., 1996; Yang et al., 2000; Holland et al., 2008; McGill et al., 2018), which together have provided the fuel for a range of modeling approaches (Giesa et al., 2011; Cranford, 2013; Ebrahimi et al., 2015; Rim et al., 2017). In comparison, spatially resolved techniques are yet to be fully explored, but have already hinted at a diverse set of rich nano- and microscale features such as micelles (Lin et al., 2017; Oktaviani et al., 2018; Parent et al., 2018), nanofibrils (Wang and Schniepp, 2018), elongated cavities (Frische et al., 2002), and an overall radial variation of composition and structure (Li et al., 1994; Knight et al., 2000; Frische et al., 2002; Sponner et al., 2007; Brown et al., 2011). Therefore, in order to uncover the secret of spider silk's mechanical response, the precise spatial distribution of structural elements inside the fiber needs to be better understood.
Investigations of the radial distribution of structures within spider dragline silk show that the composition of the shell, comprising of the lipid, and glycoprotein coating and protein skin, is substantially different compared to that of the core. In a typical dragline fiber of 5 μm diameter, the coating is approximately 100 nm in thickness and can be further differentiated into a waxy lipids and a glycoprotein layer, which together are attributed with the control of moisture content, antimicrobial properties, and pheromonal communication (Augsten et al., 2000; Sponner et al., 2005, 2007). Although it is chemically diverse, the contribution of the coating to the fiber's overall tensile behavior has been proposed to be very small (Yazawa et al., 2018). The underlying skin is of similar thickness to the coating and has been found to compose mostly of minor ampullate spidroin protein (MiSp) which is the main component of minor ampullate fibers (Sponner et al., 2007).
Remarkably, there is a further differentiation of structure within the radial profile of the spider silk's core: below the thin (~100 nm) proteinous skin lies the β-sheet rich outer-core and finally the proline-rich and more structurally disordered inner core (Li et al., 1994; Knight et al., 2000; Vollrath and Knight, 2001; Sponner et al., 2007). The greatest contribution to the mechanical properties of the fiber arise from these core layers as they make up the bulk of the fiber's volume. The core contains the ordered β-sheet structures but also the disordered amorphous phases. The β-sheet structures have been of intense interest to structural analysis (McGill et al., 2018) and mechanical modeling (Keten et al., 2010; Giesa et al., 2011) whereas the disordered amorphous components have attracted less scientific attention, in part due to the difficulty of structurally characterizing them.
Currently, mechanical models do not consider this radial structure present in the most extensively studied Nephila dragline silk, which is at odds with the widespread agreement that multi-scale organization is integral to the fiber's characteristic tensile response (Nova et al., 2010; Giesa et al., 2011; Skelton and Nagase, 2012; López Barreiro et al., 2018; Yarger et al., 2018). A better dataset concerning the 3D mechanical properties and spatial distribution of different structural units within the silk will allow for better multi-scale mechanical models and will be important in successfully designing spider-silk mimicking fibers and polymers with tailored properties (Koeppel and Holland, 2017).
In this study a controlled variation of reeling speed is utilized to produce silk of varying mechanical and structural properties. To elucidate the differences in structure, the fibers are analyzed unstained and uncoated in the secondary electron microscope (SEM) by Secondary Electron Hyperspectral Imaging (Wan et al., 2017) and structures are revealed by low temperature plasma etching. The ultimate goal is to spatially characterize the 3D distribution of nanostructure radially and longitudinally and presenting results which will aid in the parameterization of multi-scale mechanical models.
Materials and Methods
Collection of Single Fiber Dragline Silk
All spider silk samples used in the Secondary Electron Hyperspectral Imaging (SEHI) and the mechanical testing stem from one continuous thread of a single mature Nephila inaurata female. The spider was kept in a lab environment and was fed crickets and waxworms ad libidum. To obtain single fiber major ampullate dragline silk, the spider was anesthetized using carbon dioxide and subsequently immobilized on a polystyrene block with its underside facing upward. The spider was left to regain consciousness for 30 min to eliminate any effect of the carbon dioxide on the spinning process (Riekel et al., 2004). Under an optical stereo microscope (Leica MZ6), a single major ampullate dragline thread was separated from other silks and taken up onto the reeling device. The reeling device was designed in-house to allow simultaneous control over rotational and lateral translational speeds of the reel, allowing the collection of single fibers with approximately 1 cm lateral spacing at well-defined speeds of 5, 20, and 40 mm s−1 and facilitating further sample preparation.
Mechanical Testing
While ensuring that the tension of the fibers was maintained, the N. inaurata fibers were applied to stiff paper frames as is common protocol for tensile testing spider silk (Kitagawa and Kitayama, 1997) and were glued above and below the tensile testing window to ensure good adhesion and a gauge length of 5 mm. 18 tensile samples were prepared for each reeling speed. After the glue was left to set for at least 24 h the paper frames were loaded into a Zwick tensile tester equipped with a 5 N loading cell using crocodile clamps, and the frame was cut using nail clippers to obtain the free-standing fiber. Tensile tests of all samples were performed in a controlled lab environment and within 6 h to minimize variability arising from differences in temperature and humidity. The tests were strain controlled at 10 mm min−1 and were simultaneously videoed. A sample video the tensile test is available to watch in the Supplementary Information. Mechanical properties were extracted from the tensile curves applying cross-sectional areas derived from diameter measurements of each reeling speed obtained by LV-SEM imaging.
SEM and Image Data Processing
All SEM imaging and measurements were performed on a FEI Helios NanoLab SEM.
Imaging
Images were collected at a working distance of 4.1 mm, and a current of 13 pA. The scan preset was chosen to obtain minimum spatiotemporal electron exposure: the dwell time was set to the minimum 50 ns, a scan interlace of 8 was used and 32 scans were integrated using drift correction to obtain the image. Accelerating voltages of 500 eV or 1 keV were used and are further specified in the figure caption.
Spectral Acquisition
The FEI Helios NanoLab SEM is equipped with a through-lens detector with a voltage controlled mirror electrode, which deflects the SE signal into the detector. By scanning the voltage on the mirror electrode over a range and generating an image each, the energy range of collected SEs is controlled and spectra and hyperspectral images are obtained through post-processing of the spectral image series. The energy calibration of this process is performed through stage bias experiments, as described elsewhere (Kazemian et al., 2007). For a detailed discussion of the method please refer to (Stehling et al., 2018). When considering the SE signal originating from a cylindrical object such as spider silk, the effect of the SE emission angle must be considered. In all spectra and hyperspectral images presented this effect has been corrected for by taking two spectra, the second of which was taken with a stage rotation of 180° relative to the initial spectrum. For each energy the spectral images were averaged to cancel out angular effects and detector shadowing in post-processing to yield geometrically corrected results. The success of this correction was confirmed by the comparison of the non-corrected to the corrected hyperspectral images of a Si calibration standard sample of known geometry.
Image Processing
Image processing was performed using Fiji software (Schindelin et al., 2012). All images presented have been optimized for their brightness and contrast using histogram normalization.
The Voronoi tessellation was performed by assigning the 8-bit greyscale values 255–141 to the nanostructure in the hyperspectral images of the given energy range. The resulting binary image was subsequently skeletonized to represent the bright nanostructure as a one-pixel line using Zang and Suen's algorithm (Zhang and Suen, 1984) and this was used as input for the Voronoi tessellation. A color look-up-table was applied to better illustrate the distances between particles along the tessellation lines and is displayed adjacent to the tessellation maps.
Low Temperature Plasma Treatment
Plasma treatment was performed in a Diener Electronic Zepto plasma cleaner at 40 kHz, 100 W, and 0.3 mbar air for the specified total times. Samples were exposed to the plasma for no longer than 3 min at a time to exclude the effects of sample heating which have been shown to lead to surface modification of a different kind (Yip et al., 2002). For treatment times of more than 3 min, the sample was treated for 3 min, then left to cool for 5 min before a subsequent treatment was performed to make up the total treatment time.
Results
To gain a complete understanding of the structural mechanical make-up of spider dragline silk, the radial as well as the longitudinal structures present within silk need to be considered. Generally, analysis techniques used for the characterization of structures on different scales are either space-averaging, such as nuclear magnetic resonance spectroscopy (NMR) and X-ray diffraction (XRD), or surface sensitive, such as atomic force microscopy (AFM) and electron microscopy (EM). This poses a practical challenge if 3D information with high spatial resolution in all dimensions is sought. If differences in nanostructure alignment and distribution, such as those proposed in literature are to be spatially resolved, the internal structure's 3D distribution must be revealed.
Plasmas are reactive environments in the gas phase and thus modify surfaces in response to the underlying structural composition (Yip et al., 2006). The use of a low temperature plasma for defined periods of time has previously been shown to lead to selective etching of fiber surfaces, with the treated surface morphology being a result of the fiber's crystallinity and its strain history (Wakida and Tokino, 1996; Yip et al., 2002,?, 2006; Stehling et al., 2018). In our experiments, plasma treatment was used to firstly etch away layers of the fiber radially to obtain images showing structure in the fiber axis at a given depth, and secondly to expose any nanostructure which may be influenced by the reeling speed and multi-scale organization of the fiber. Diameter measurements performed in the SEM after plasma treatment confirm that this process etches more material with increased treatment time at a rate of approximately 100 nm min−1 (Figure 1). Thus, this process opens a pathway to exposing selected radial layers through etching, giving insights into the core of the fiber and the nanostructure within.
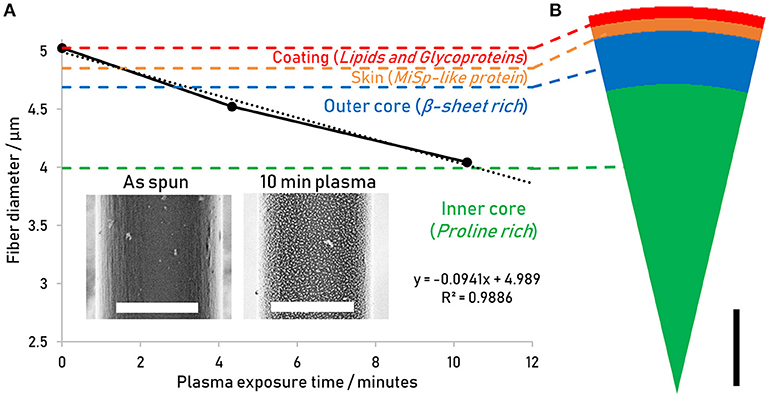
Figure 1. (A)Reduction of diameter with increasing plasma treatment time. Different layers relative to the overall diameter are indicated according to Sponner et al. (2007). Insets: Regular secondary electron images of Nephila inaurata dragline silk before and after 10 min plasma treatment, imaged at 500 eV. Scalebars measure 3 μm (B) Schematic of radial structure of spider silk, scalebar shows 500 nm. Adapted (labels omitted, rotated, and color coded) from Sponner et al. (2007) under a CC BY 2.0 license (https://creativecommons.org/licenses/by/2.0/uk/), 2007 Sponner et al.
After 10 min of plasma treatment, a fiber with an original diameter of 5.02 μm was etched by 0.98 μm (0.49 μm either side) to its outer-core, where β-sheet crystals are thought to characterize the nanostructure and the mechanical response (Knight et al., 2000; Sponner et al., 2007). The nanostructures evident in Figure 1 inset are most likely a result of the presence of β-sheet rich and ordered nano-domains which etch at a slower rate compared to the disordered amorphous phases. Their appearance is consistent with structures observed in dragline silk by SEM after the shell has been washed away by phosphate buffered saline (Augsten et al., 2000) and are similar to those observed in silkworm silk (Wan et al., 2017).
In order to confirm the effects of the etching process and describe the features revealed, a range of reeling speeds was used to generate different order/disorder ratios (Liu et al., 2005). For each reeling speed, the fibers were treated for 4 and 10 min and the comparison of the resulting nanostructures with reeling speed and plasma treatment are presented in Figure 2.
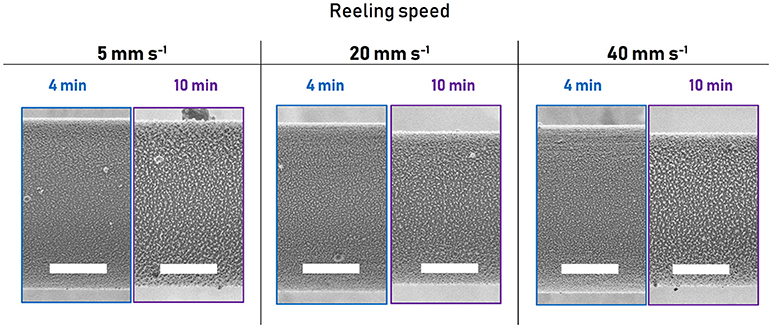
Figure 2. Nanostructures revealed by plasma etching for 4 min (blue) and 10 min (purple) for the different reeling speeds obtained by regular SE imaging at 1 keV. Scalebars measure 2 μm.
To the naked eye, there is no evident trend in the change in nanostructure with reeling speed. However, there are clear differences across all samples in response to plasma treatment time. Based on predictions from Figure 1, the images shown in Figure 2 for both plasma etching times result in the lipid and glycoprotein coating being etched away to expose the outer core of the fiber—at 4 min the outer core just beneath the skin is exposed, while the 10 min etch predictably exposes the outer core close to the inner core.
The observed differences in nanostructure size may be explained by irregularities in the boundary between the skin and the outer-core which have previously been observed in AFM and immunostaining studies (Li et al., 1994; Sponner et al., 2005), leading to the 4 min treated surface being more skin-like in composition, whereas the 10 min treated surface is characteristic of the proline devoid and β-sheet crystal rich outer core. The reduced etching rate of the β-sheet crystals may also play a role in the increased size of nanostructure features after 10 min treatment, if after etching through the outer-core more β-sheet-rich ordered domains remain and protrude topographically in the image to appear brighter due to the SEM's edge effect prevalent in regular SE imaging.
The predominance of topographical contrast in regular SE images, specifically the edge effect, can pose a problem to image analysis as it exaggerates the size of the nanostructures and could obscure any contrast arising from material differences between the ordered nanostructures and the surrounding disordered matrix. Thus, the influence of topography is a significant impairment in any attempt to quantifiably characterize differences between the visible structures when using standard Low Voltage SEM.
To better separate the compositional information from the topographical information present in the untreated and plasma treated fiber surfaces we used Secondary Electron Spectroscopy in conjunction with Secondary Electron Hyperspectral Imaging (SEHI) in the SEM under the same conditions. SEHI makes use of the fact that the secondary electron signal from which SEM images are commonly generated incorporates energy information as well as spatial information. It has previously been shown that depending on the SE energy window selected, topography can be excluded and energy ranges can be assigned to different compositions or phases with sensitivity to elemental composition, hybridization state, degree of order and crystallinity (Masters et al., 2015; Kumar et al., 2017; Wan et al., 2017; Dapor et al., 2018; Stehling et al., 2018).
SEHI was performed on the silk surface to compare the secondary electron energy signatures of the skin of the as-spun fiber with those of plasma etched fiber. The resulting secondary electron signal arises from the surface of the sample, which in the case of the as-spun fiber is the lipid layer, and in the case of the 10 min plasma treated fiber is the outer-core. Indeed, the difference between the spectrum of the as-spun (Figure 3A, blue line) and the etched fiber (Figure 3D) is the increased spectral emission intensity of the as-spun surface at lower secondary electron energies of 0–3 eV, so that this energy window may be assigned to the very outer lipid and glycoprotein layer, in the following referred to as the coating. Thus, the 0–3 eV energy window may be characterized as “coating-like.”
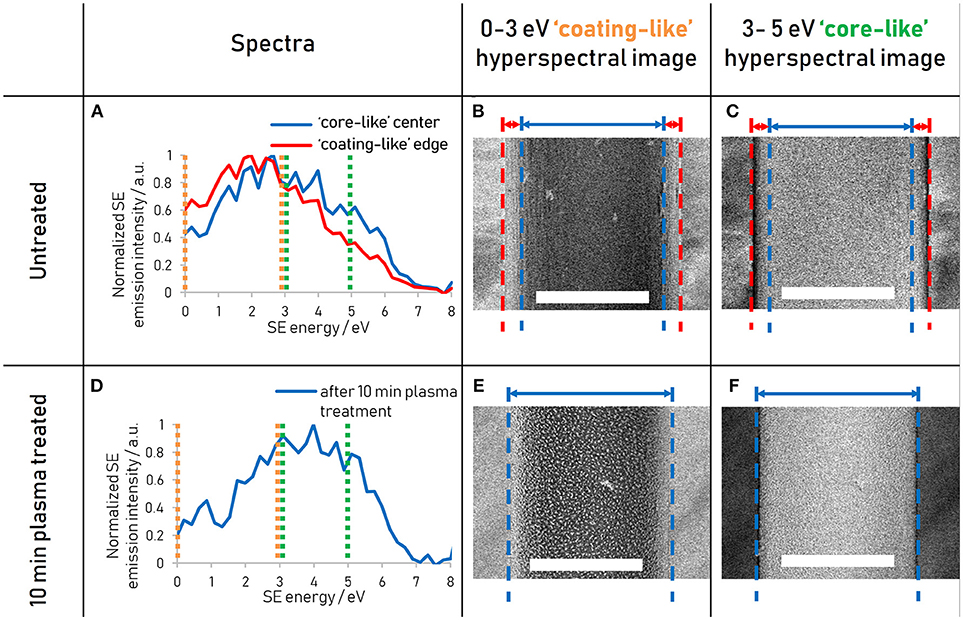
Figure 3. (A) Spectra of untreated Nephila inaurata dragline silk highlighting differences between the coating-like spectrum arising from the edge (red lines) and the core-like spectrum arising form the middle (blue lines). (B) Hyperspectral image of the untreated fiber representing the energy range of 0–3 eV highlighting the coating-like emissions and (C) 3–5 eV energy range hyperspectral image highlighting the core-like emissions. (D) Spectrum of Nephila inaurata dragline silk after the removal of the coating and skin via a 10 min plasma etch. (E) and (F) as (B) and (C) for the 10 min treated sample. The hyperspectral energy ranges of 0–3 and 3–5 eV are represented by orange and green dashed lines in the spectra of (A,D), respectively. All spectral images acquired with 500 eV primary beam energy. Scalebars measure 3 μm.
This hypothesis is further validated by the fact that the “coating-like” energy-window 0–3 eV, indicated by the dashed orange line, has increased intensity toward the edges of the as-spun fiber, where a higher fraction of the escaping secondary electrons have escaped from the electron-thin coating rather than the layers closer to the core (Figure 3A red line). Conversely, the higher energy range of 3–5 eV which exhibits higher intensity in the treated fiber can be characterized as the “core-like” window, as marked by the green dashed lines.
While SE information is generally considered to be from the very top surface, information depths of secondary electrons can range up to 100 nm in insulators (Seiler, 1983; Hessel and Gross, 1992). According to Sponner et al. the very outer coating containing lipid and glycoprotein layers around Nephila dragline silk only measure approximately 10–20 and 60 nm, respectively (Sponner et al., 2007), resulting in a contribution of the lower proteinous skin layer to the SE signal and spectrum in the untreated fiber—that is, the SE signal arising from the underlying protein layer shines through the coating and is collected by the detector. Note that the fibers investigated in this work are neither sputter coated nor stained, as is common practice for other electron imaging techniques (Yarger et al., 2018). Thus, the difference between the “coating-like” and “core-like” energy windows can be observed and is likely to arise from the different compositional make-ups of the layers, with the “coating-like” spectrum reflecting its lipid composition and the “core-like” region responding to proteinous layers.
This correlation between layer composition and emission energy can be exploited using SEHI to obtain spatially resolved compositional information in the form of hyperspectral images, which map the emission intensity of a certain energy range with increased brightness of a pixel translating to increased emission intensity (Wan et al., 2017). Note that these hyperspectral images are geometrically corrected to eliminate any potential image artifacts arising from angular dependencies of SE emission (for details please refer to the materials and methods section). As expected, the edges of the untreated fiber appear bright in the “coating-like” hyperspectral image (Figure 3B) and dark in the “core-like” hyperspectral image (Figure 3C), illustrating how the fraction of SEs emerging from the electron-thin coating gradually increases toward the fiber edge due to the cylindrical profile of the fiber. For the treated fiber, where the skin has been etched away, the “coating-like” hyperspectral image does exhibit bright edges, although this is readily explained by the fact that this energy range also responds to the nanostructures revealed by the plasma etching both at the edges and in the middle of the fiber, as seen clearly in the hyperspectral image (Figure 3E). The “core-like” hyperspectral image shows a uniform distribution of the gray levels across the fiber and especially at the edges in the treated fiber, illustrating how all SEs originate from the core layer (Figure 3F), whereas the “core-like” energy window in the untreated fiber shows a gradual reduction in gray levels as the number of SEs originating from the proteinous skin and core diminishes toward the edges (Figure 3C). Note how this energy window is not only insensitive to the difference in composition between the nanostructure and the matrix (Figure 3F), but also represses the topography arising from the different etching rates of the β-sheet crystals and amorphous regions.
Analogously to the way the coating and the core energy signatures have been compared in Figure 3, the energy signature of the nanostructures present in the plasma treated fiber can be compared to that of the matrix by spatially separating the two phases using thresholding of the greyscale values (Figure 4). It is clear from the spectra that the nanostructure and the matrix are best distinguished in the energy ranges from 1.5 to 4 eV, where the nanostructure dominates, and from 4 to 6 eV, where the matrix dominates.
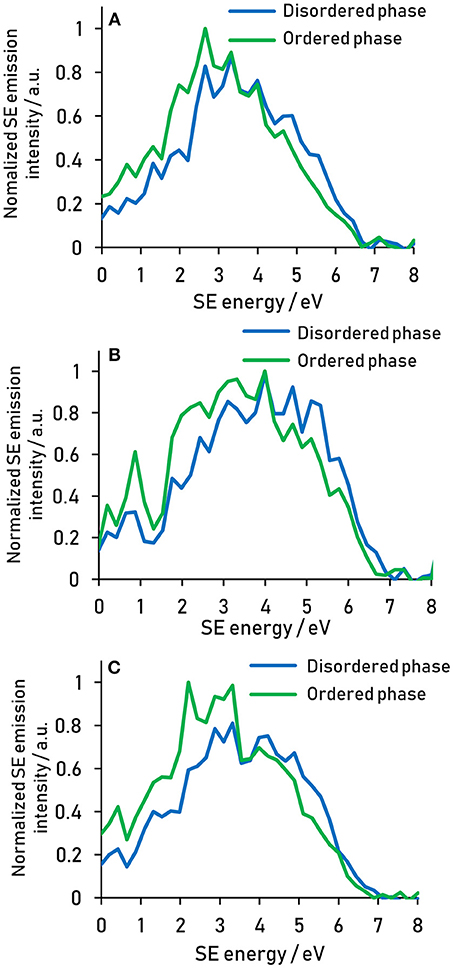
Figure 4. Secondary electron spectral differences between the ordered nanostructure and the disordered matrix present after 10 min plasma treatment for reeling speeds of (A) 5 (B) 20, and (C) 40 mm s−1. Spectra acquired at 500 eV primary beam energy.
The energy ranges isolated for the different components are summarized in Table 1. These energy range assignments overlap and are not absolute, so that a quantification in this way using spectral intensities would be problematic. However, the assignment of energy ranges in this fashion allows the determination of optimal energy windows in which the contrast between two components will be amplified compared to a regular SE image.
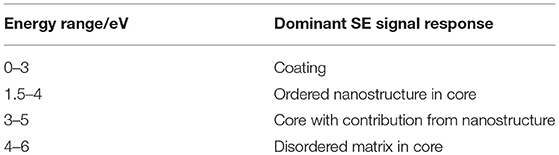
Table 1. Summary of energy ranges used to isolate compositions on different scales.
Thus, the energy windows selected using the spectra in Figure 4 were used to generate hyperspectral images to isolate the nanostructure, by adding the 1.5–4 eV hyperspectral image to the inverse of the 4–6 eV hyperspectral image, as shown in Figure 5. The detailed images d-f illustrate how an isolation based on energy can yield a hyperspectral image with pinpointed information: The nanostructure appears less diffuse in the hyperspectral image compared to the regular SE images and resolves multiple smaller features which appear as one larger feature in the regular SE image (Figure 5e blue arrow). Importantly, besides increasing the apparent resolution of the energy-selected nanostructures, the selected energy range also reveals smaller scale structures present within the matrix, such as structures linking the larger particles highlighted in the yellow circle (Figure 5d) and sub 10 nm structures present in between the larger nanostructures highlighted by the green arrow in Figure 5f.
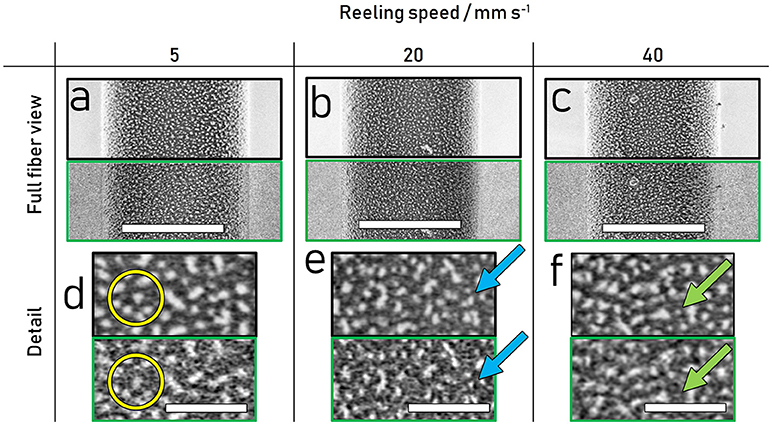
Figure 5. Comparison of regular SE (top with black border) and contrast-optimized hyperspectral images (bottom with green border) of 10 min plasma etched spider dragline silk reeled at 5, 20 and 40 mm s−1. (a–c) View across fiber, scalebars measure 3 μm (d–f) Detailed representation showing higher resolution and increased detail in the hyperspectral images, scalebars measure 500 nm. All images acquired at 500 eV primary beam energy.
Currently these structures are barely resolved in the presented images and difficult to separate from noise. However, their presence in the nanostructure optimized image and absence in the corresponding regular SE image suggests their composition may lie in between the more ordered and disordered components. Higher resolution hyperspectral images of targeted energies may give a clearer picture of the nature of these structures.
The differences in nanostructure with varying reeling speed are not readily seen with the naked eye in the hyperspectral images in Figure 5. To characterize and quantify the nanostructure, different image analysis tools were applied to the hyperspectral images in Figure 5, with the results presented in Figure 6. Firstly, the bright nanostructures were isolated from the darker matrix using thresholding. The resulting binary images presented in Figure 6A were analyzed for the area fraction of the nanostructure and for its size distribution. The area fraction of the particles in the total sampled area decreased from 35 to 31 to 29% for the reeling speeds of 5, 20, and 40 mm s−1, respectively. Interestingly, plotting the area distributions of the nanostructure as a histogram shows indications of a bi-modal distribution of nanostructure sizes consistent with literature (Trancik et al., 2006) (see Figure S1). However, there are limits to the area data recorded; Firstly, objects smaller than 6.5 nm cannot be resolved with the given image resolution, and secondly the total area is subject to error introduced by differences in brightness and contrast between images.
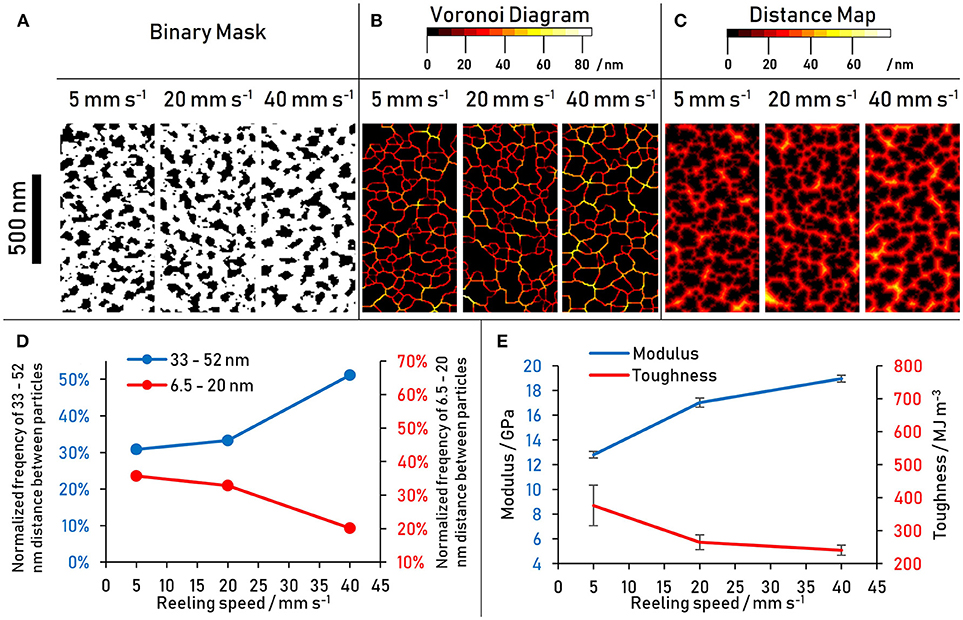
Figure 6. (A–C) Particle analysis of nanostructure in 10 min plasma treated spider dragline silk performed on hyperspectral images shown in Figure 5. The images show a sample of a total sample area of 4 μm2. (D) Frequency of larger (33–52 nm) and smaller (6.5–20 nm) nanostructure Voronoi distances with reeling speed (E) Modulus and toughness with reeling speed of the same spider silk thread.
To eliminate the sensitivity to differences in brightness and contrast of the source images, a Voronoi tessellation was chosen as a processing tool because it considers only the center of the particle (in this case the nanostructure) and not its entire area (Voronoi, 1908). Furthermore, it not only considers the properties of the structures, but also characterizes their location relative to one another. In a Voronoi tessellation as shown in Figure 6B, the tessellation lines run along where one particle center is equidistant to its nearest neighbor. The color value simultaneously encodes the magnitude of the distance of the Voronoi tessellation boundary to the center of either particle. The increased occurrence of higher distance values with increased reeling speed is evident from the Voronoi diagrams (Figure 6B) and the frequency histogram of the Voronoi tessellation was (Figure S1). This result is consistent with the indication of a bimodal size distribution of the area distribution, that is, the smaller reeling speeds have an increased number of particles smaller than 20 nm, which in turn results in the higher number of smaller particle distances seen in the Voronoi diagrams. Conversely, at higher reeling speeds the nanostructures are further apart from one another.
It seems then that it is not only the size and size distribution of nanostructures that matters, but also their distances from one-another within the matrix. This would imply that the interaction between the nanostructures and the matrix play an important role in the tensile properties of the outer core. To get a better understanding of the absolute numbers associated with particle distances (i.e., considering the size of the particles as well), the distance map of the binary images presented in Figure 6A were generated and analyzed (Figure 6C). The population of distances shows the same trend as the Voronoi tessellation distributions: at higher reeling speeds the smaller distances become less frequent while the larger distances become more frequent. This confirms that the trend is not only influenced by the size of a nanostructure, but also by the distribution of the matrix in between the particles. The result is a larger fraction of the matrix further away from any nanostructures at higher reeling speeds, resulting in less scope for matrix-nanostructure interactions and more prominent matrix-matrix interactions. The critical distance between nanostructures where the trend reverses is 20 nm, which may indicate that a bi-modal size distribution and thus a multi-scale organization is present not only within the crystalline nanostructure but also in the disordered domains.
Voronoi tessellation distances of 6.5–20 and 33–52 nm have been grouped to plot this trend in Figure 6D. The tensile results of the same silk thread (Figure 6E) are shown next to the results of the nanostructure analysis in an attempt to link nanoscale structure to macroscale properties. Assuming that the distribution of the ordered nanostructure within the fiber directly affects mechanical properties of the material, the data suggest that shorter distances between the ordered β-sheet crystals beget toughness, while larger distances contribute to a higher modulus. Potential explanations for this relationship are proposed in the Discussion section.
Discussion
The size and orientation of the ordered domains and especially the β-sheet crystals within spider silk have been subject to intense experimental interest with regards to their contribution to the desirable tensile properties of spider silk (Yang et al., 1997; Riekel and Vollrath, 2001; Sampath et al., 2012; McGill et al., 2018). Thus, modeling studies have focused on their tensile behavior in isolation from the matrix on length scales of atomistic to nanoscale models (Thiel et al., 1997; Keten et al., 2010; Giesa et al., 2011). The idea that the crystallinity alone is responsible for the dragline fiber's renowned mechanical response is in direct conflict with the fact that both minor ampullate spider silk of the same species and Bombyx mori silk have a substantially larger crystalline fraction and less desirable tensile properties (Riekel and Vollrath, 2001; Sampath et al., 2012). The results in this study suggest that the matrix and specifically the matrix-nanostructure interactions are key in the tensile response of the fibers. Although there are promising developments in elucidating the secondary structure and general organization of the amorphous phase (McGill et al., 2018), its inherent lack of order has posed a challenge to the structural analysis community as it cannot be readily described using most methods applied to the crystalline fractions of the fiber. This gives us a possible explanation why there is an underappreciation for its role in spider silk's mechanical response. Although this hypothesis requires further validation, our results suggest that the modulus is governed though the matrix-matrix interactions, whereas matrix-nanocrystal interactions supply a toughening mechanism especially at lower reeling speeds. Through their X-ray and NMR work, Grubb and Jelinski have come to a similar conclusion; that is that spider silk is best described on the macroscale as a filled elastomer, with the β-sheets acting as fillers to enhance the mechanical properties of the rubber-like amorphous and ordered amorphous matrix (Simmons et al., 1996; Grubb and Jelinski, 1997).
To link the parameters given by atomistic models to a larger scale, spider silk fiber has been modeled as a bundle of nanofibrils with diameters of 20–150 nm (Giesa et al., 2011). Initially thought to be cylindrical and spatially confined like those observed in Bombyx mori silk, more recent AFM and TEM studies have shown more diffuse structures which are oriented in the fiber direction, with some models considering spider silk thread as a bundle of fibrils (Giesa et al., 2011; Xu et al., 2014) or globules (Cranford, 2013). A directional anisotropy of structures on such length scales were not evident in this work, with the orientation of the exposed nanostructure in the outer-core being broadly isotropic. The size of the revealed structures is however consistent with accounts of a bi-modal size distribution of the higher-order fractions (Trancik et al., 2006). In our current work we see indications of the smaller size population, especially using hyperspectral imaging, although it is still below the resolution limit. Our dominant observed nanostructure is consistent with the larger population of ordered structures of 20–150 nm extension transverse to the fiber direction. The use of SEHI in combination with low temperature plasma etching provides access to a larger number of particles compared to data published in previous AFM (Miller et al., 1999; Du et al., 2006; Schäfer et al., 2008; Brown et al., 2011; Wang and Schniepp, 2018) and TEM (Thiel et al., 1997; Trancik et al., 2006) studies. This is essential to build a quantitative picture of nano- and microstructure distribution, especially considering that spider silk modeling approaches have yet to incorporate our knowledge of these multi-scale structures (Yarger et al., 2018). The various approaches taken to date in the mechanistic modeling of spider silk have been summed up in a recent review (López Barreiro et al., 2018). Various modeling approaches have had some success in reproducing spider silk's mechanical behavior but the incorporation of multiscale structures and their interactions into mechanistic models is yet to be realized in part due to the practical difficulty of liking atomistic approaches to micron scale models.
A complete 3D model of spider silk with its multi-scale organization is additionally hampered by the difficulties of revealing its internal make-up. The largest single fiber silk from a large spider only measures around 5 μm in diameter to start with, and provenly exhibits structures down to 2 nm in size (Trancik et al., 2006). Furthermore, the structures under investigation are sensitive to strain, thermal and chemical treatment and can undergo undesired and unknown structural modification through sample preparation. Thus, it cannot simply be cut or sectioned without potentially manipulating the structures of interest. Previously reported sample preparation procedures employ epoxy embedding, which cures exothermically and may result in thermal modification of fibers, and wax embedding involving solvent dehydration, embedding in molten wax, and rehydration steps. While the results contributed from these studies supply important pieces to the puzzle, such as the observation of a differential in mechanical properties between the inner and the outer core (Brown et al., 2011), it must be kept in mind that the fiber may have been substantially chemically transformed.
In this work we have used low-temperature plasma etching as a non-thermal, surface-acting technique. Previous work considering the surface modifications of polyamide(6,6) fibers in low temperature plasma establish that the surface morphology after plasma treatment is a result of the sample's crystallinity content and strain history (Yip et al., 2006), which makes this approach especially suitable for the analysis of spider silk force reeled at different speeds. While the methodology requires further optimization, we were able to identify differences in the resulting morphology with reeling speed exposed in the outer-core of the fiber. We show that comparably, plasma treatment may be a mild preparation method to uncover certain layers within the radial structure of spider silk.
Compared to conventional spatially resolved techniques such as conventional SEM, TEM and AFM our secondary electron hyperspectral imaging (SEHI) has key advantages when imaging spider silk and associated nanostructures. The Low-Voltage SEM imaging requires no sample preparation besides the plasma treatment, and thus eliminates potentially damaging or obscuring processes such as coating or staining. Our comparison of SE spectra and hyperspectral images illustrates how powerful this method is in distinguishing natural organic materials and compositions, such as lipids and proteins, while simultaneously enabling the suppression of topographical information of SEs. Secondly, through the systematic selection of energy ranges, we have increased the compositional contrast between the nanostructures and the matrix, revealing structures which are not visible in a conventional SE image. In future studies this approach will be further developed to resolve the sub 10 nm features prevalent in the matrix in between the larger nanostructures, especially in the lower reeling speeds.
We present low temperature plasma etching as a novel tool to uncover layers along the radial profile of Nephila spider silk. The use of Secondary Electron Hyperspectral Imaging (SEHI) has allowed high resolution mapping of the different compositions of the components contributing to the multi-scale design of dragline silk, with distinct energy signatures arising from the skin and core on the microscale, and the nanostructures and matrix on the nanoscale. The use of these energy ranges in hyperspectral images has revealed smaller scale structures than those evident in regular SE images. While there were no significant differences in nanostructure area fraction and orientation with reeling speed, the spatial situation of the >20 nm nanostructures is shown to change, with larger distances between nanostructures prevalent at higher reeling speeds.
The combination of plasma etching, LV-SEM, and SEHI provides a top-down approach for the structural analysis of spider silk which bridges multiple length scales and supplies compositional and spatial information simultaneously. Further work will involve varying etching times and thus exposing fiber layers systematically to obtain an extensive dataset illustrating the radial evolution of nanostructures within the fiber. Specifically, such a dataset will serve to bridge the length scale gaps between the current molecular and larger scale models and will help to map out the yet poorly defined disordered domains and the situation of the ordered domains within. A multiscale mechanical model capable of incorporating this information and reproducing silk's complex tensile behavior will be a large step forward in engineering structure-property relationships for bio-inspired man-made materials.
Author Contributions
NS performed the majority of the experimental work and data analysis and wrote the manuscript. KA performed instrument calibration and validation work central to the spectral data in the manuscript. CH and CR contributed to the experimental design, project supervision, and the writing of the manuscript.
Funding
Any expenses pertaining to experimental work were covered by the EPSRC grants EP/K005693/1 and EN/N008065. As this is an invited contribution, the publication fees are waived (see cover letter).
Conflict of Interest Statement
The authors declare that the research was conducted in the absence of any commercial or financial relationships that could be construed as a potential conflict of interest.
Acknowledgments
CR and CH would like to thank the EPSRC for funding (EP/N008065/1 and EP/K005693/1).
Supplementary Material
The Supplementary Material for this article can be found online at: https://www.frontiersin.org/articles/10.3389/fmats.2018.00084/full#supplementary-material
References
Augsten, K., Muehlig, P., and Herrmann, C. (2000). Glycoproteins and skin-core structure in Nephila clavipes spider silk observed by light and electron microscopy. Scanning 22, 12–15. doi: 10.1002/sca.4950220103
Boulet-Audet, M., Vollrath, F., and Holland, C. (2015). Identification and classification of silks using infrared spectroscopy. J. Exp. Biol. 218, 3138–3149. doi: 10.1242/jeb.128306
Brown, C. P., MacLeod, J., Amenitsch, H., Cacho-Nerin, F., Gill, H. S., Price, A. J., et al. (2011). The critical role of water in spider silk and its consequence for protein mechanics. Nanoscale 3, 3805–3811. doi: 10.1039/c1nr10502g
Cebe, P., Hu, X., Kaplan, D. L., Zhuravlev, E., Wurm, A., Arbeiter, D., et al. (2013). Beating the heat-fast scanning melts silk beta sheet crystals. Sci. Rep. 3:1130. doi: 10.1038/srep01130
Cranford, S. W. (2013). Increasing silk fibre strength through heterogeneity of bundled fibrils. J. R. Soc. Interface 10:20130148. doi: 10.1098/rsif.2013.0148
Dapor, M., Masters, R. C., Ross, I., Lidzey, D. G., Pearson, A., Abril, I., et al. (2018). Secondary electron spectra of semi-crystalline polymers – A novel polymer characterisation tool? J. Electron Spectros. Relat. Phenomena 222, 95–105. doi: 10.1016/j.elspec.2017.08.001
Dicko, C., Porter, D., Bond, J. E., Kenney, J. M., and Vollrath, F. (2007). Structural disorder in silk proteins reveals the emergence of elastomericity. Biomacromolecules 9, 216–21. doi: 10.1021/bm701069y
Du, N., Liu, X. Y., Narayanan, J., Li, L., and Lim, M. Li, D. (2006). Design of superior spider silk: from nanostructure to mechanical properties. Biophys. J. 91, 4528–4535. doi: 10.1529/biophysj.106.089144
Ebrahimi, D., Tokareva, O., Rim, N. G., Wong, J. Y., Kaplan, D. L., and Buehler, M. J. (2015). Silk–its mysteries, how it is made, and how it is used. ACS Biomater. Sci. Eng. 1, 864–876. doi: 10.1021/acsbiomaterials.5b00152
Frische, S., Maunsbach, A. B., and Vollrath, E. (2002). Elongate cavities and skin–core structure in Nephila spider silk observed by electron microscopy. J. Microsc. 189, 64–70. doi: 10.1046/j.1365-2818.1998.00285.x
Giesa, T., Arslan, M., Pugno, N. M., and Buehler, M. J. (2011). Nanoconfinement of spider silk fibrils begets superior strength, extensibility, and toughness. Nano Lett. 11, 5038–5046. doi: 10.1021/nl203108t
Greving, I., Dicko, C., Terry, A., Callow, P., and Vollrath, F. (2010). Small angle neutron scattering of native and reconstituted silk fibroin. Soft. Matter. 6, 4389–4395. doi: 10.1039/c0sm00108b
Grubb, D. T., and Jelinski, L. W. (1997). Fiber morphology of spider silk: the effects of tensile deformation. Macromolecules 30, 2860–2867. doi: 10.1021/ma961293c
Hessel, R., and Gross, B. (1992). Escape depth of secondary electrons from electron-irradiated polymers. IEEE Trans. Electr. Insul. 27, 831–834. doi: 10.1109/14.155806
Hijirida, D. H., Do, K. G., Michal, C., Wong, S., Zax, D., and Jelinski, L. W. (1996). 13C NMR of Nephila clavipes major ampullate silk gland. Biophys. J. 71, 3442–3447. doi: 10.1016/S0006-3495(96)79539-5
Holland, C., Hawkins, N., Frydrych, M., Laity, P., Porter, D., and Vollrath, F. (2018a). Differential scanning calorimetry of native silk feedstock. Macromol. Biosci. 9:1800228. doi: 10.1002/mabi.201800228
Holland, C., Numata, K., and Rnjak-Kovacina, Seib, F. P. (2018b). The biomedical use of silk: past, present, future. Adv. Healthc. Mater. 8:1800465. doi: 10.1002/adhm.201800465
Holland, G. P., Creager, M. S., Jenkins, J. E., Lewis, R. V., and Yarger, J. L. (2008). Determining secondary structure in spider dragline silk by carbon– carbon correlation solid-state NMR spectroscopy. J. Am. Chem. Soc. 130, 9871–9877. doi: 10.1021/ja8021208
Kazemian, P., Mentink, A. M., Rodenburg, C., and Humphreys, C. J. (2007). Quantitative secondary electron energy filtering in a scanning electron microscope and its applications. Ultramicroscopy 107, 140–150. doi: 10.1016/j.ultramic.2006.06.003
Keten, S., Xu, Z., Ihle, B., and Buehler, M. J. (2010). Nanoconfinement controls stiffness, strength and mechanical toughness of [beta]-sheet crystals in silk. Nat. Mater. 9, 359–367. doi: 10.1038/nmat2704
Kitagawa, M., and Kitayama, T. (1997). Mechanical properties of dragline and capture thread for the spider Nephila clavata. J. Mater. Sci. 32, 2005–2012. doi: 10.1023/A:1018550116930
Knight, D. P., Knight, M. M., and Vollrath, F. (2000). Beta transition and stress-induced phase separation in the spinning of spider dragline silk. Int. J. Biol. Macromol. 27, 205–210. doi: 10.1016/S0141-8130(00)00124-0
Koeppel, A., and Holland, C. (2017). Progress and trends in artificial silk spinning: a systematic review. ACS Biomater. Sci. Eng. 3, 226–237. doi: 10.1021/acsbiomaterials.6b00669
Kumar, V., Schmidt, W. L., Schileo, G., Masters, R. C., Wong-Stringer, M., Sinclair, D. C., et al. (2017). Nanoscale mapping of bromide segregation on the cross sections of complex hybrid perovskite photovoltaic films using secondary electron hyperspectral imaging in a scanning electron microscope. ACS Omega 2, 2126–2133. doi: 10.1021/acsomega.7b00265
Kümmerlen, J., Van Beek, J. D., Vollrath, F., and Meier, B. H. (1996). Local structure in spider dragline silk investigated by two-dimensional spin-diffusion nuclear magnetic resonance. Macromolecules 29, 2920–2928. doi: 10.1021/ma951098i
Li, S. F., McGhie, A. J., and Tang, S. L. (1994). New internal structure of spider dragline silk revealed by atomic force microscopy. Biophys. J. 66, 1209–1212. doi: 10.1016/S0006-3495(94)80903-8
Lin, T. Y., Masunaga, H., Sato, R., Malay, A. D., Toyooka, K., Hikima, T., et al. (2017). Liquid crystalline granules align in a hierarchical structure to produce spider dragline microfibrils. Biomacromolecules 18, 1350–1355. doi: 10.1021/acs.biomac.7b00086
Liu, Y., Shao, Z., and Vollrath, F. (2005). Relationships between supercontraction and mechanical properties of spider silk. Nat. Mater. 4, 901–905. doi: 10.1038/nmat1534
López Barreiro, D., Yeo, J., Tarakanova, A., and Martin-Martinez, Buehler, M. J. (2018). Multiscale modeling of silk and silk-based biomaterials—a review. Macromol. Biosci. e1800253. doi: 10.1002/mabi.201800253. [Epub ahead of print].
Masters, R. C., Pearson, A. J., Glen, T. S., F.-,Sasam, C., Li, L., Dapor, M., et al. (2015). Sub-nanometre resolution imaging of polymer-fullerene photovoltaic blends using energy-filtered scanning electron microscopy. Nat. Commun. 6:6928. doi: 10.1038/ncomms7928
McGill, M., Holland, G. P., and Kaplan, D. L. (2018). Experimental methods for characterizing the secondary structure and thermal properties of silk proteins. Macromol. Rapid Commun. 40:e1800390. doi: 10.1002/marc.201800390
Miller, L. D., Putthanarat, S., Eby, R. K., and Adams, W. W. (1999). Investigation of the nanofibrillar morphology in silk fibers by small angle X-ray scattering and atomic force microscopy. Int. J. Biol. Macromol. 24, 159–165. doi: 10.1016/S0141-8130(99)00024-0
Nova, A., Keten, S., Pugno, N. M., Redaelli, A., and Buehler, M. J. (2010). Molecular and nanostructural mechanisms of deformation, strength and toughness of spider silk fibrils. Nano Lett. 10, 2626–2634. doi: 10.1021/nl101341w
Oktaviani, N. A., Matsugami, A., Malay, A. D., Hayashi, F., Kaplan, D. L., and Numata, K. (2018). Conformation and dynamics of soluble repetitive domain elucidates the initial β-sheet formation of spider silk. Nat. Commun. 9:2121. doi: 10.1038/s41467-018-04570-5
Parent, L. R., Onofrei, D., Xu, D., Stengel, D., Roehling, J. D., Addison, J. B., et al. (2018). Hierarchical spidroin micellar nanoparticles as the fundamental precursors of spider silks. Proc. Natl. Acad. Sci. U.S.A. 115, 11507–11512. doi: 10.1073/pnas.1810203115
Porter, D., Guan, J., and Vollrath, F. (2013). Spider silk: super material or thin fibre? Adv. Mater. 25, 1275–1279. doi: 10.1002/adma.201204158
Riekel, C., Madsen, B., Knight, D., and Vollrath, F. (2000). X-ray diffraction on spider silk during controlled extrusion under a synchrotron radiation X-ray beam. Biomacromolecules 1, 622–626. doi: 10.1021/bm000047c
Riekel, C., Rössle, M., Sapede, D., and Vollrath, F. (2004). Influence of CO2 on the micro-structural properties of spider dragline silk: X-ray microdiffraction results. Naturwissenschaften 91, 30–33. doi: 10.1007/s00114-003-0482-8
Riekel, C., and Vollrath, F. (2001). Spider silk fibre extrusion: combined wide- and small-angle X-ray microdiffraction experiments. Int. J. Biol. Macromol. 29, 203–210. doi: 10.1016/S0141-8130(01)00166-0
Rim, N. G., Roberts, E. G., Ebrahimi, D., Dinjaski, N., Jacobsen, M. M., Martín-Moldes, Z., et al. (2017). Predicting silk fiber mechanical properties through multiscale simulation and protein design. ACS Biomater. Sci. Eng. 3, 1542–1556. doi: 10.1021/acsbiomaterials.7b00292
Sampath, S., Isdebski, T., Jenkins, J. E., Ayon, J., Henning, R. W., et al. (2012). X-ray diffraction study of nanocrystalline and amorphous structure within major and minor ampullate dragline spider silks. Soft. Matter. 8, 6713–6722. doi: 10.1039/c2sm25373a
Schäfer, A., Vehoff, T., Glišovi,ć, A., and Salditt, T. (2008). Spider silk softening by water uptake: an AFM study. Eur. Biophys. J. 37, 197–204. doi: 10.1007/s00249-007-0216-5
Schindelin, J., Arganda-Carreras, I., Frise, E., Kaynig, V., Longair, M., Pietzsch, T., et al. (2012). Fiji: an open-source platform for biological-image analysis. Nat. Methods 9:676. doi: 10.1038/nmeth.2019
Seiler, H. (1983). Secondary electron emission in the scanning electron microscope. J. Appl. Phys. 54, R1–R18. doi: 10.1063/1.332840
Simmons, A. H., Michal, C. A., and Jelinski, L. W. (1996). Molecular orientation and two-component nature of the crystalline fraction of spider dragline silk. Science 271, 84–87. doi: 10.1126/science.271.5245.84
Skelton, R. E., and Nagase, K. (2012). Tensile tensegrity structures. Int. J. Sp. Struct. 27, 131–137. doi: 10.1260/0266-3511.27.2-3.131
Sponner, A., Unger, E., Grosse, F., and Weisshart, K. (2005). Differential polymerization of the two main protein components of dragline silk during fibre spinning. Nat. Mater. 4, 772–775. doi: 10.1038/nmat1493
Sponner, A., Vater, W., Monajembashi, S., Unger, E., Grosse, F., and Weisshart, K. (2007). Composition and hierarchical organisation of a spider silk. PLoS ONE 2:e998. doi: 10.1371/journal.pone.0000998
Stehling, N., Masters, R., Zhou, Y., O'Connell, R., Holland, C., Zhang, H., et al. (2018). New perspectives on nano-engineering by secondary electron spectroscopy in the helium ion and scanning electron microscope. MRS Commun. 8, 226–240. doi: 10.1557/mrc.2018.75
Termonia, Y. (1994). Molecular modeling of spider silk elasticity. Macromolecules 27, 7378–7381. doi: 10.1021/ma00103a018
Thiel, B. L., Guess, K. B., and Viney, C. (1997). Non-periodic lattice crystals in the hierarchical microstructure of spider (major ampullate) silk. Biopolym. Orig. Res. Biomol. 41, 703–719. doi: 10.1002/(SICI)1097-0282(199706)41:7& < ;703::AID-BIP1&>;3.0.CO;2-T
Trancik, J. E., Czernuszka, J. T., Bell, F. I., and Viney, C. (2006). Nanostructural features of a spider dragline silk as revealed by electron and X-ray diffraction studies. Polymer 47, 5633–5642. doi: 10.1016/j.polymer.2005.01.110
Vollrath, F., Hawkins, N., Porter, D., and Holland, C. (2014). Differential scanning fluorimetry provides high throughput data on silk protein transitions. Sci. Rep. 4:5625. doi: 10.1038/srep05625
Vollrath, F., and Knight, D. P. (2001). Liquid crystalline spinning of spider silk. Nature 410, 541–548. doi: 10.1038/35069000
Vollrath, F., and Porter, D. (2009). Silks as ancient models for modern polymers. Polymer 50, 5623–5632. doi: 10.1016/j.polymer.2009.09.068
Vollrath, F., Porter, D., and Holland, C. (2011). There are many more lessons still to be learned from spider silks. Soft Matter 7, 9595–9600. doi: 10.1039/c1sm05812f
Voronoi, G. (1908). Nouvelles applications des paramètres continus à la théorie des formes quadratiques. Deuxième mémoire. Recherches sur les parallélloèdres primitifs. J. Für Die Reine Und Angew. Math. 134, 198–287.
Wagner, J. A., Patil, S. P., Greving, I., Lämmel, M., Gkagkas, K., Seydel, T., et al. (2017). Stress-induced long-range ordering in spider silk. Sci. Rep. 7:15273. doi: 10.1038/s41598-017-15384-8
Wakida, T., and Tokino, S. (1996). Surface modification of fibre and polymeric materials by discharge treatment and its application to textile processing. Indian J. Fibre Textile Res. 21, 69–78.
Walker, A. A., Holland, C., and Sutherland, T. D. (2015). More than one way to spin a crystallite: multiple trajectories through liquid crystallinity to solid silk. Proc. R. Soc. B 282:20150259. doi: 10.1098/rspb.2015.0259
Wan, Q., Abrams, K. J., Masters, R. C., Talari, A. C. S., Claeyssens, F., et al. (2017). Mapping nanostructural variations in silk by secondary electron hyperspectral imaging. Adv. Mater. 29:1703510. doi: 10.1002/adma.201703510
Wang, Q., and Schniepp, H. C. (2018). Strength of recluse Spider's silk originates from nanofibrils. ACS Macro Lett. 7, 1364–1370. doi: 10.1021/acsmacrolett.8b00678
Willis, R. F., Fitton, B., and Skinner, D. K. (1972). Study of carbon-fiber surfaces using Auger and secondary electron emission spectroscopy. J. Appl. Phys. 43, 4412–4419. doi: 10.1063/1.1660936
Xu, G., Gong, L., Yang, Z., and Liu, X. Y. (2014). What makes spider silk fibers so strong? From molecular-crystallite network to hierarchical network structures. Soft Matter 10, 2116–2123. doi: 10.1039/C3SM52845F
Yang, Z., Grubb, D. T., and Jelinski, L. W. (1997). Small-angle X-ray scattering of spider dragline silk. Macromolecules 30, 8254–8261. doi: 10.1021/ma970548z
Yang, Z., Liivak, O., Seidel, A., LaVerde, G., Zax, D. B., and Jelinski, L. W. (2000). Supercontraction and backbone dynamics in spider silk: 13C and 2H NMR studies. J. Am. Chem. Soc. 122, 9019–9025. doi: 10.1021/ja0017099
Yarger, J. L., and Cherry, B. R. (2018). Uncovering the structure–function relationship in spider silk. Nat. Rev. Mater. 3:18008. doi: 10.1038/natrevmats.2018.8
Yazawa, K., Malay, A. D., Masunaga, H., and Numata, K. (2018). Role of skin layers on mechanical properties and supercontraction of spider dragline silk fiber. Macromol. Biosci. 1800220. doi: 10.1002/mabi.201800220. [Epub ahead of print].
Yip, J., Chan, K., Sin, K. M., and Lau, K. S. (2002). Low temperature plasma-treated nylon fabrics. J. Mater. Process. Technol. 123, 5–12. doi: 10.1016/S0924-0136(02)00024-9
Yip, J., Chan, K., Sin, K. M., and Lau, K. S. (2002). Study of plasma-etched and laser-irradiated polyamide materials. Mater. Res. Innov. 6, 44–50. doi: 10.1007/s10019-002-0169-3
Yip, J., Chan, K., Sin, K. M., and Lau, K. S. (2006). Formation of periodic structures by surface treatments of polyamide fiber: part II. Low temperature plasma treatment. Appl. Surf. Sci. 253, 2493–2497. doi: 10.1016/j.apsusc.2006.05.004
Keywords: spider silk, biopolymer, protein, hierarchical structure, multiscale material, natural materials, low voltage scanning electron microscopy
Citation: Stehling N, Abrams KJ, Holland C and Rodenburg C (2019) Revealing Spider Silk's 3D Nanostructure Through Low Temperature Plasma Etching and Advanced Low-Voltage SEM. Front. Mater. 5:84. doi: 10.3389/fmats.2018.00084
Received: 30 November 2018; Accepted: 31 December 2018;
Published: 25 January 2019.
Edited by:
Fernando Fraternali, University of Salerno, ItalyReviewed by:
Francesco Colangelo, Università degli Studi di Napoli Parthenope, ItalyRupinder Singh, Department of Production Engineering, Guru Nanak Dev Engineering College, India
Copyright © 2019 Stehling, Abrams, Holland and Rodenburg. This is an open-access article distributed under the terms of the Creative Commons Attribution License (CC BY). The use, distribution or reproduction in other forums is permitted, provided the original author(s) and the copyright owner(s) are credited and that the original publication in this journal is cited, in accordance with accepted academic practice. No use, distribution or reproduction is permitted which does not comply with these terms.
*Correspondence: Cornelia Rodenburg, Yy5yb2RlbmJ1cmdAc2hlZmZpZWxkLmFjLnVr