 J. Quetzalcóatl Toledo-Marín
 Le Yan
- 1Departamento de Sistemas Complejos, Instituto de Física, Universidad Nacional Autónoma de México, Mexico City, Mexico
- 2Kavli Institute for Theoretical Physics, University of California, Santa Barbara, Santa Barbara, CA, United States
In network glass including chalcogenides, the network topology of microscopic structures can be tuned by changing the chemical compositions. As the composition is varied, an intermediate phase (IP) singularly different from the adjacent floppy or rigid phases on sides has been revealed in the vicinity of the rigidity onset of the network. Glass formers in the IP appear to be reversible at glass transition and strong in dynamical fragility. Meanwhile, the calorimetry experiments indicate the existence of a first-order liquid-liquid transition (LLT) at a temperature above the glass transition in some strong glass-forming liquids. How are the intermediate phase and the liquid-liquid transition related? Recent molecular dynamic simulations hint that the intermediate phase is thermodynamically distinct that the transitions to IP as varying the chemical composition in fact reflect the LLT: out of IP, the glass is frozen in vibrational entropy-dominated heterogeneous structures with voids; while inside IP, energy dominates and the microscopic structures of liquids become homogeneous. Here we demonstrate such first-order thermodynamic liquid-liquid transition numerically and analytically in an elastic network model of network glass and discuss possible experimental approaches to testify the connection.
1. Introduction
In network glass, the material properties relying on structures can be tuned by changing the chemical compositions that have different abilities to make covalent connections with its neighbor atoms. In chalcogenides GexAsySe1−x−y, for example, selenium (Se) forms only two bonds while arsenic (As) and germanium (Ge) form three and four respectively. First pointed out by Maxwell (1864), a general network will lose rigidity as the network connectivity is reduced to below certain critical connectivity when the average number of constraints per atom, n, is equal to the degrees of freedom, i.e., nc = d in spatial dimension d. This rigidity loss also applies to the chalcogenides when selenium concentration is high, predicted by Phillips in Phillips (1979) and Thorpe (1985), where he showed that counting both radial and angular constraints of covalent bonds gives nSe = 2, nAs = 9/2, and nGe = 7, indicating a chalcogenide glass is marginally rigid at a composition with average number of covalent bonds rc = 2.4. Since then, more and more works have shown that the thermodynamic and dynamic features of glass-forming liquids (not limited to chalcogenides) are strongly regulated by the rigidity transition of the microscopic networks (Hall and Wolynes, 2003; Shintani and Tanaka, 2008; Mauro et al., 2009; Yan et al., 2013). One of the most interesting discoveries is the intermediate phase (IP) near rc (Boolchand et al., 2001; Wang et al., 2005; Rompicharla et al., 2008; Bhosle et al., 2012), which remains a big puzzle.
The intermediate phase appears to be singularly distinct from the adjacent rigid or floppy phases: the non-reversible heat, a glass-transition equivalent of the latent heat, vanishes (Boolchand et al., 2001); the stress heterogeneity disappears (Wang et al., 2005; Rompicharla et al., 2008); the molar volume and fragility are sharply smaller (Bhosle et al., 2012). All available pieces of evidence suggest that the glass undergoes some transitions when entering IP from either side (Bhosle et al., 2012). However, both, Maxwell's rigidity theorem and the rigidity percolation theory that takes into account fluctuations of random networks (Jacobs and Thorpe, 1995, 1996; Barré et al., 2005) predict only a single transition in network constraint number n. Noticed the interval of the two rigidity transition points in two theories, Thorpe and his colleagues proposed a self-organized transition scenario, which predicts a rigidity window in between two transitions—one corresponding to the loss of percolating rigidity as in the rigidity percolation theory and the other corresponding to the loss of ability to relax stress as in the Maxwell's theorem (Thorpe et al., 2000; Chubynsky et al., 2006). This stress-free rigidity window relies on a subtle balance between the fluctuation or entropy facilitating the rigidity percolation and the energy eliminating the stress throughout the range, which is, however, fragile to the ubiquitous perturbations such as Van der Waals (VdW) forces and temperature (Yan and Wyart, 2014). Despite in a more recent paper (Kirchner and Mauro, 2019), Kirchner and Mauro provide a robust approach of computing the constraint number to determine IP in the presence of finite temperature, the heterogeneous nature captured by a diverging correlation length at n = nc (Brière et al., 2007), in fact, still contradicts the observations of a homogeneous IP.
An alternative set of theoretical insights on IP is from the molecular dynamics simulations (Micoulaut and Bauchy, 2013; Bauchy et al., 2014; Bauchy and Micoulaut, 2015), where a similar intermediate range of homogeneous structures is revealed by continuously tuning the pressure instead of composition. In the simulation, as the pressure gradually increases, the amorphous structure undergoes a liquid-liquid transition (LLT) from a more structured low-modulus low-density amorphous phase to a more homogeneous rigid high-density phase (Yildirim et al., 2018). When the composition is varied, the transition pressure shows a non-monotonic pattern with a lower value in an intermediate range near rc, same as the pattern of the stress percolation pressure in chalcogenides (Wang et al., 2005). In addition, in experiments, a transition between two thermodynamically different liquids is indicated by a lambda peak in specific heat at a temperature above the glass transition in some strong glass-formers close to the rigidity threshold, including silica (SiO2) (Angell, 2008, 2011; Wei et al., 2011, 2013). These materials imply that the glass in IP may be rather in a different thermodynamic phase resulted from a transition above the glass transition and the transitions to IP directly reflect such liquid-liquid transitions. So what are the two different liquid phases in network glass?
In the previous work (Yan, 2018), one of the authors showed with a network model that the vibrational entropy facilitates the rigid-floppy separated heterogeneous network structures close to the rigidity transition nc as floppy modes store large amounts of vibrational entropy (Naumis, 2005) while cost little configurational entropy in marginally rigid networks. On the opposite, the elastic energy is lower in homogeneous structures with stresses evenly distributed (Yan and Wyart, 2014). So under cooling, a network near nc inevitably undergoes a first-order transition from an entropy-dominated heterogeneous phase to an energy-dominated homogeneous phase. The interplay of the glass transition temperature Tg and the LLT temperature TLLT would then be key in determining which liquid phase the material is frozen in at the glass transition and all the consequential features. Here, we investigate the transition separating the two liquid phases by studying the thermodynamics of the same network model. We show that the network undergoes a first-order phase transition where free energy crosses over, associated energy and entropy are discontinuous, and specific heat jumps in the thermodynamic limit. Finally, we discuss how this liquid-liquid transition could be probed in experiments in order to understand the intermediate phase.
2. Model
We consider a two-dimensional triangular lattice of N particles with periodic boundary conditions (Yan and Wyart, 2014, 2015; Yan, 2018), where a small regular deformation of the lattice is imposed to avoid non-generic singular modes. We model all radial and angular constraints of covalent interactions by Ns = Nn linear springs of stiffness k, connecting the nearest neighbors on a triangular lattice, as shown in Figure 1. We incorporate quenched disorder of glassy energy landscape by rest length mismatches of springs to the lattice bond lengths: lγ = lγ, 0+ϵγ for spring γ. Mismatches {ϵγ} are i.i.d. random Gaussian variables with mean zero and variance ϵ2. By setting kB = 1, kϵ2 = 1 defines the unit of, both, energy and temperature. Furthermore, we include also the weak VdW interactions by adding weak fixed springs of stiffness kw ≪ k connecting any particle to all its six next-nearest neighbors as shown in Figure 1. The mean-field effect of these weak long-range non-specific interactions can be captured by a control parameter α = 3kw/k ≪ 1 (Yan et al., 2013; Yan and Wyart, 2015).
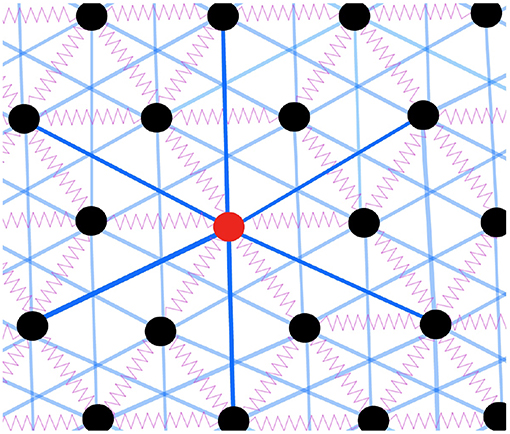
Figure 1. Sketch of the model. The black circles represent the particles, the purple springs represent the strong interaction between nearest neighbors while the blue lines represent the VdW interactions between next nearest neighbors. We color one of the particles in red with bold blue lines for illustration purposes.
In the model, the microscopic configuration depends on how the network is connected or which lattice bonds are occupied by strong springs, denoted by Γ≡{γ ↔ (i, j)}, for particle i and j connected by spring γ. Given Γ, when particles deviate from the mechanical equilibrium by |δR〉, the elastic energy potential to the linear order is,
where H is the energy of the inherent structure of configuration Γ and the second term corresponds to the vibration from equilibrium with being the Hessian matrix of energy H. We thus perform a Metropolis Monte Carlo simulation (Newman and Barkema, 1999) to sample the configurations according to their Boltzmann weight e−F(Γ)/T with free energy,
with the volume of thermal vibrations counted in the vibrational entropy,
where ω2 are the eigenvalues of the Hessian matrix.
Without loss of generality, we assume the independence of mismatch ϵγ on the particle distances of the distorted lattice rij so that the Hessian matrix becomes only a function of the occupation {σ}, where σij = 1 if particle i and j are connected by a spring and σij = 0 otherwise. The stress energy of the network at mechanical equilibrium can thus be computed by,
where is the diagonal spring stiffness matrix and is the structural matrix, both depending only on occupation {σ}. The detailed derivations and expressions of these matrices and the numerical implementation are documented in the Supplementary Notes 1, 2.
3. Results
3.1. Network Structures
As proven in Yan (2018) and directly inferred by Equation (3), vibrational entropy is large for floppy modes with a vanishing ω. When the total number of constraints is fixed, the total entropy can gain from additional floppy modes in phase separation of a very rigid subnetwork where the springs cluster and a very floppy counterpart where floppy modes cluster. This phase separation is shown in the snapshot of a system of 576 particles at high temperature in the left panel of Figure 2. On the contrary, networks with constraints homogeneously distributed store lower elastic energy than other configurations given the number of springs, as shown in Yan and Wyart (2014). At low temperature, when elastic energy dominates, homogeneous microscopic structures with no rigid-floppy phase separation will be sampled, as shown in the right panel of Figure 2. In the following, we will show that these heterogeneous and homogeneous structures correspond to two distinct thermodynamic liquid phases that are separated by a first-order liquid-liquid transition at a critical temperature TLLT. We will further argue that depending on the relation between TLLT and the glass transition temperature Tg, the liquid can be frozen into different thermodynamic phases, which could be the origin of the singular intermediate phase in network glass.
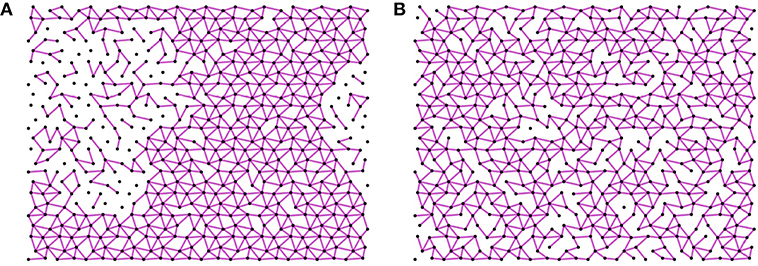
Figure 2. Snapshot of the system above (A) and below (B) the critical temperature for a system of 576 particles with the constraint number n = 2.06 > nc. The purple lines represent the springs. (A) Heterogeneous structure: At high temperature T = 10, the entropy dominates over the internal stress energy, in particular, the vibrational entropy maximizes by phase separating into rigid and floppy regions. (B) Homogeneous structure: At low temperature T = 0.001 the energy of the inherent structures dominates over the internal energy, this energy minimizes by a homogeneous distribution of constraints.
3.2. Thermodynamics
The numerical results of thermodynamics of the model are shown in Figure 3 together with the theoretical predictions of both heterogeneous and homogeneous phases. In the upper left panel of Figure 3, for a given connectivity n = 2.06, we find the total free energy of the networks equilibrated at given temperature T can be perfectly fitted by the theoretical predictions of heterogeneous networks at high temperature end (in red) and of homogeneous networks at low temperature end (in blue). Moreover, the numerics and the free energy prediction of heterogeneous networks are consistently lower than the prediction of the homogeneous phase when the temperature is higher than certain transition temperature TLLT ≈ 0.2. At the free energy crossover TLLT, marked in Figures 3B–D, we are also observing the convergence to discontinuous jumps at the transition in the thermodynamic limit N → ∞ from a higher value in high temperature heterogeneous phase to a lower value in the low temperature homogeneous phase in stress energy, vibrational entropy, and the specific heat. This result demonstrates that the heterogeneous and homogeneous structures are thermodynamical phases, separated by a first-order phase transition where, both, energy and entropy are discontinuous.
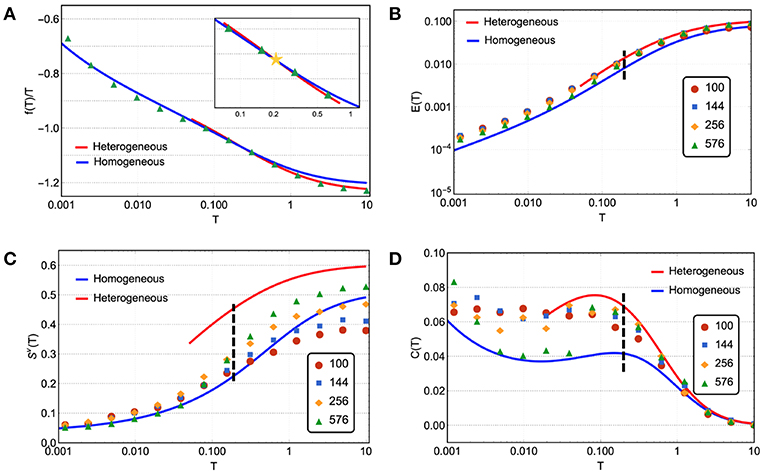
Figure 3. Thermodynamics of the network model near the rigidity transition n = 2.06. The thermodynamics is characterized by the basic thermodynamic quantities, including free energy, internal energy, entropy, and specific heat, shown vs. temperature in markers for simulation results and in curves for analytical predictions. The simulations are done for different system sizes N (see legends) and the analytical predictions are obtained in the thermodynamic limit N → ∞ for homogeneous networks in blue and heterogeneous networks in red (see Supplementary Notes 3, 4 for detailed descriptions). (A) The numerical results of free energy follow the prediction of a homogeneous network at low temperatures until the homogeneous-heterogeneous first order phase transition around T ≈ 0.2 and then cross over to the prediction of a heterogeneous network. The yellow star in the inset marks this crossover. (B) Data points follow the homogeneous and heterogeneous predictions in the same low and high temperature ranges corresponding to the free energy, while separated by a discrete transition that the numeric result is converging to in the thermodynamic limit. (C) Similarly, the vibrational entropy results also converge to a discrete jump at the crossover of free energy. (D) At the phase transition, the specific heat is also characterized by has a jump, seen in the largest system size.
In Figure 3, the data points of energy in the upper right panel of Figure 3 and vibrational entropy in the lower left panel of Figure 3 are averages of Equations (3) and (4) over the Monte Carlo courses at given temperature T. The specific heat C in the lower right panel of Figure 3 is obtained from the mean energy fluctuation over the Monte Carlo courses normalized by temperature squared, . Finally, the main numerical result of free energy F in the upper left panel of Figure 3 combines both direct measurement of energy E and the inferred total entropy S = Sv+Sc by integrating over the specific heat C,
as F = E − TS. The theory derivations and the way we consistently fit parameters are fully documented in the Supplementary Notes 3–5 or see Yan and Wyart (2015) for homogeneous networks and Yan (2018) for heterogeneous networks.
3.3. Spatial and Temporal Correlations
We have shown the existence of two distinct thermodynamic liquid phases of networks with the basic thermodynamic quantities. Among these quantities, the specific heat is a good experimental indicator to detect the two liquid phases and the transition: one can look for a lambda divergence or a peak in specific heat above glass transition Tg, as found in certain strong-type glass-forming liquids and water (Angell, 2008, 2011; Wei et al., 2011, 2013). Here we present also the spatial and temporal correlation profiles of the two phases that could be directly measured in experiment to probe the transition. The spatial and temporal correlations are investigated by the structure factor and the time autocorrelation function as shown in Figure 4. They are defined by the occupation {σ} as,
where .
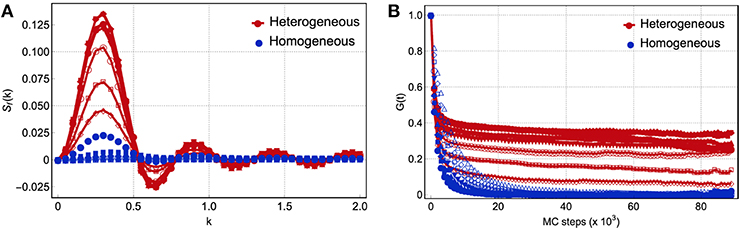
Figure 4. (A) Spatial correlation function and (B) time correlation function for N = 576. Red curves correspond to temperatures T(m) = 10/2m with m = {0, …, 5} and blue curves correspond to temperatures T(m) with m = {6, …, 16}. The blue open symbols correspond to temperatures T ≲ α, i.e., of the order of the weak interactions. The wavenumber k has been averaged over three different directions. The time correlation function was computed using samples taken every 103 Monte Carlo steps.
For temperatures higher than the transition temperature TLLT ≈ 0.2, we observe a plateau to finite correlation in the time range scanned in simulation and a strong signal in structure factor averaged over that time scale, which reflects the heterogeneous phase as in the snapshot in the left panel of Figure 2. On the contrary, for temperatures lower than TLLT, we observe normal homogeneous liquid, where the correlation quickly relaxes to zero with no special structure in wave vector space after averaged over time, as in the snapshot in the right panel of Figure 2. In the left panel of Figure 4, we also notice that the systems in the heterogeneous phase yield two relaxation times: the system first relaxes to a plateau rapidly, yet in this plateau, the system is also relaxing but with a much larger characteristic time. It implies that the rigid and floppy clusters are not held fixed in a given position and the structural features in Sf(k) will also vanish when averaged at the time longer than the second relaxation as in liquids. These features of spatial and temporal correlations emerging at an intermediate time scale should be looked for in distinguishing the two liquid phases and detecting the transition.
3.4. Dependence on Network Topology
Finally, we derive the liquid-liquid transition temperature TLLT for varying constraint number n but close to nc where a heterogeneous phase exists at high temperature, shown in Figure 5A1. Unlike the glass transition temperature Tg, which increases monotonically with n, TLLT varies non-monotonically and is maximal at n = nc, which is also consistently shown by numerical results of the model as data points in Figure 5A. This result implies that for certain range of parameters, the networks undergo LLT to a thermodynamic homogeneous phase before they are dynamically trapped in glass, when TLLT(n) > Tg(n) or nf < n < nr, which is likely to occur in the vicinity of the rigidity threshold nc due to the different dependences of TLLT and Tg on n. The liquids frozen in homogeneous networks become glass in the IP, while the network glass out of the IP is then frozen in the heterogeneous network structures as the glass transition happens first under cooling, as illustrated in Figure 5B. The transitions to the IP are thus transitions between different frozen thermodynamic liquid phases in this picture.
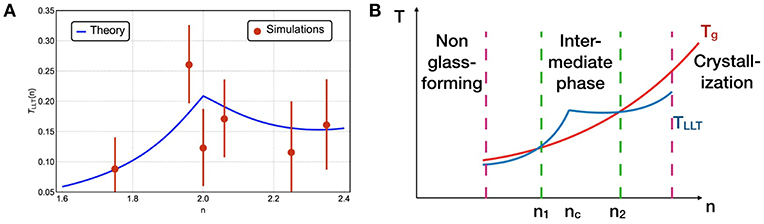
Figure 5. (A) Liquid-liquid transition temperature vs. number of constraints, predicted by theory (blue line) and measured numerically for the network model for N = 256 (data points). Details of the theory and numerical extraction of TLLT are documented in Supplementary Note 6. (B) Illustration of different dependence of TLLT and glass transition Tg on the number of constraints n. When n is close to nc where TLLT becomes >Tg, liquid is frozen in a homogeneous intermediate phase at Tg.
4. Discussion
Relying on how and where Tg and TLLT intersect with each other, this new picture of the intermediate phase is potent to explain some of the material features in the experiments. First, depending on the relative strength of the Van der Waals forces, the constraint numbers where Tg and TLLT intersect vary, which leads to different widths and locations of the intermediate phase when changing the chemical compositions (Boolchand et al., 2001; Yan, 2018). Second, as the dynamics have shown to be much less fragile in a liquid with homogeneous structures, the liquid-liquid transition from the high-temperature heterogeneous to low-temperature homogeneous phase implies the dynamics of a liquid in the intermediate phase potentially undergoes a fragile to strong transition under cooling as observed in water (Angell, 2011) and in-silico silica (Horbach and Kob, 1999; Sastry and Angell, 2003). Finally, as a byproduct of our theory, the disappearance of heterogeneous phases at very high and very low n may explain the transitions beyond the intermediate phase far from the rigidity threshold (Bhosle et al., 2012), as depicted in Figure 5B.
To test this picture of the intermediate phase experimentally, one could look for direct signals of the liquid-liquid transition, including a lambda peak in the specific heat and loss of structural features from the scattering experiments under cooling. The direct evidence should be most likely to be found in compounds close to the boundaries of the intermediate phase, where the liquid-liquid transition temperature is comparable to the glass transition temperature. As the glass transition reflects the dynamic aspect while the liquid-liquid transition reflects the thermodynamic aspect of the material, one could also tune one of the transitions by increasing the cooling rate, or adding a small amount of impurities, or exerting a certain amount of pressure to check if the range of the intermediate phase can be perturbed in a predictable way.
5. Conclusions
In this paper, we have shown with an elastic network model that the microscopic structure of a network glass undergoes a liquid-liquid transition from an entropy-dominated heterogeneous phase to an energy-dominated homogeneous phase under cooling. At this first-order transition, the specific heat diverges, structural features disappear, and relaxation plateau vanishes. The transition temperature scales as the average frustration energy stored in covalent bonds and varies non-monotonically on the network connectivity. As the glass transition temperature scales positively with the connectivity, the two transition temperatures could cross at two constraint numbers. Inside the two constraint numbers, we would observe the liquid-liquid transition first under cooling and obtain homogeneous network glass at glass transition as in the intermediate phase.
Data Availability
All datasets generated for this study are included in the manuscript and/or Supplementary Files.
Author Contributions
JT-M and LY contributed conception and design of the study, developed the theory and performed the statistical analysis, and drafted the manuscript. JT-M implemented simulation. Both authors contributed to manuscript revision, read, and approved the submitted version.
Funding
JT-M acknowledges a doctoral fellowship from CONACyT as well as support from DGAPA-UNAM project IN102717. LY was supported by the Gordon and Betty Moore Foundation under Grant No. GBMF2919. This research was supported in part by the National Science Foundation under Grant No. NSF PHY-1748958.
Conflict of Interest Statement
The authors declare that the research was conducted in the absence of any commercial or financial relationships that could be construed as a potential conflict of interest.
Acknowledgments
We gratefully thank G. G. Naumis and M. Wyart for discussions. We thank the editors for invitation to contribute to the topic.
Supplementary Material
The Supplementary Material for this article can be found online at: https://www.frontiersin.org/articles/10.3389/fmats.2019.00196/full#supplementary-material
Footnote
1. ^Notice that the temperature predicted here is in the unit of covalent bond bending and stretching energy. For instance, in the case of silica with an average constraint number nSiO2 = 3.67, the liquid-liquid phase transition temperature has been experimentally reported at TLLT ≈ 1820K (Brueckner, 1970; Horbach and Kob, 1999) and glass transition at Tg ≈ 1425K. The bond energy is estimated at 621.7 kJ/mol (Jutzi and Schubert, 2007), and the bond bending/stretching energy can be estimated by Lindemann's criterion with kϵ2 = 2 × 0.32× 621.7 ≈ 112kJ/mol. We then have TLLT ≈ 0.14 and Tg ≈ 0.11 in the unit of kϵ2 for silica.
References
Angell, C. A. (2008). Insights into phases of liquid water from study of its unusual glass-forming properties. Science 19, 582–587. doi: 10.1126/science.1131939
Angell, C. A. (2011). “Heat capacity and entropy functions in strong and fragile glass-formers, relative to those of disordering crystalline materials,” in Glassy, Amorphous and Nano-crystalline Materials (Springer), 21–40.
Barré, J., Bishop, A. R., Lookman, T., and Saxena, A. (2005). Adaptability and “intermediate phase” in randomly connected networks. Phys. Rev. Lett. 94:208701. doi: 10.1103/PhysRevLett.94.208701
Bauchy, M., Kachmar, A., and Micoulaut, M. (2014). Structural, dynamic, electronic, and vibrational properties of flexible, intermediate, and stressed rigid as-se glasses and liquids from first principles molecular dynamics. J. Chem. Phys. 141:194506. doi: 10.1063/1.4901515
Bauchy, M., and Micoulaut, M. (2015). Densified network glasses and liquids with thermodynamically reversible and structurally adaptive behaviour. Nat. Commun. 6:6398. doi: 10.1038/ncomms7398
Bhosle, S., Gunasekera, K., Boolchand, P., and Micoulaut, M. (2012). Melt homogenization and self-organization in chalcogenides-part II. Int. J. Appl. Glass Sci. 3, 205–220. doi: 10.1111/j.2041-1294.2012.00092.x
Boolchand, P., Georgiev, D., and Goodman, B. (2001). Discovery of the intermediate phase in chalcogenide glasses. J. Optoelectr. Adv. Mater. 3, 703–720.
Brière, M.-A., Chubynsky, M. V., and Mousseau, N. (2007). Self-organized criticality in the intermediate phase of rigidity percolation. Phys. Rev. E 75:056108. doi: 10.1103/PhysRevE.75.056108
Brueckner, R. (1970). Properties and structure of vitreous silica. I. J. Non-crystalline solids 5, 123–175.
Chubynsky, M. V., Brière, M.-A., and Mousseau, N. (2006). Self-organization with equilibration: a model for the intermediate phase in rigidity percolation. Phys. Rev. E 74:016116. doi: 10.1103/PhysRevE.74.016116
Hall, R. W., and Wolynes, P. G. (2003). Microscopic theory of network glasses. Phys. Rev. Lett. 90:085505. doi: 10.1103/PhysRevLett.90.085505
Horbach, J., and Kob, W. (1999). Static and dynamic properties of a viscous silica melt. Phys. Rev. B 60:3169. doi: 10.1103/PhysRevB.60.3169
Jacobs, D. J., and Thorpe, M. F. (1995). Generic rigidity percolation: the pebble game. Phys. Rev. Lett. 75:4051–4054.
Jacobs, D. J., and Thorpe, M. F. (1996). Generic rigidity percolation in two dimensions. Phys. Rev. E 53:3682–3693.
Jutzi, P., and Schubert, U. (2007). Silicon Chemistry: From the Atom to Extended Systems. Weinheim : John Wiley & Sons.
Kirchner, K. A., and Mauro, J. C. (2019). Statistical mechanical model of the self-organized intermediate phase in glass-forming systems with adaptable network topologies. Front. Mater. 6:11. doi: 10.3389/fmats.2019.00011
Mauro, J. C., Allan, D. C., and Potuzak, M. (2009). Nonequilibrium viscosity of glass. Phys. Rev. B 80:094204. doi: 10.1103/PhysRevB.80.094204
Maxwell, J. (1864). L. On the calculation of the equilibrium and stiffness of frames. Philos. Mag. 27, 294–299. doi: 10.1080/14786446408643668
Micoulaut, M., and Bauchy, M. (2013). Anomalies of the first sharp diffraction peak in network glasses: Evidence for correlations with dynamic and rigidity properties. Phys. Stat. Solidi B 250, 976–982. doi: 10.1002/pssb.201248512
Naumis, G. G. (2005). Energy landscape and rigidity. Phys. Rev. E 71:026114. doi: 10.1103/PhysRevE.71.026114
Newman, M., and Barkema, G. (1999). Monte Carlo Methods in Statistical Physics Chapter 1-4. New York, NY: Oxford University Press.
Phillips, J. C. (1979). Topology of covalent non-crystalline solids i: Short-range order in chalcogenide alloys. J. Non-Crystalline Solids 34, 153–181.
Rompicharla, K., Novita, D. I., Chen, P., Boolchand, P., Micoulaut, M., and Huff, W. (2008). Abrupt boundaries of intermediate phases and space filling in oxide glasses. J. Phys. 20:202101. doi: 10.1088/0953-8984/20/20/202101
Sastry, S., and Angell, C. (2003). Liquid–liquid phase transition in supercooled silicon. Nat. Mater. 2, 739–743. doi: 10.1038/nmat994
Shintani, H., and Tanaka, H. (2008). Universal link between the boson peak and transverse phonons in glass. Nat. Mater. 7:870–877. doi: 10.1038/nmat2293
Thorpe, M. (1985). Rigidity percolation in glassy structures. J. Non-Crystalline Solids 76, 109–116.
Thorpe, M., Jacobs, D., Chubynsky, M., and Phillips, J. (2000). Self-organization in network glasses. J. Non-Crystalline Solids 266-269 (Pt 2), 859 – 866. doi: 10.1016/S0022-3093(99)00856-X
Wang, F., Mamedov, S., Boolchand, P., Goodman, B., and Chandrasekhar, M. (2005). Pressure raman effects and internal stress in network glasses. Phys. Rev. B 71:174201. doi: 10.1103/PhysRevB.71.174201
Wei, S., Gallino, I., Busch, R., and Angell, C. A. (2011). Glass transition with decreasing correlation length during cooling of fe 50 co 50 superlattice and strong liquids. Nat. Phys. 7, 178–182. doi: 10.1038/nphys1823
Wei, S., Yang, F., Bednarcik, J., Kaban, I., Shuleshova, O., Meyer, A., et al. (2013). Liquid–liquid transition in a strong bulk metallic glass-forming liquid. Nat. Commun. 4:2083. doi: 10.1038/ncomms3083
Yan, L. (2018). Entropy favors heterogeneous structures of networks near the rigidity threshold. Nat. Commun. 9:1359. doi: 10.1038/s41467-018-03859-9
Yan, L., Düring, G., and Wyart, M. (2013). Why glass elasticity affects the thermodynamics and fragility of supercooled liquids. Proc. Natl. Acad. Sci. U.S.A. 110, 6307–6312. doi: 10.1073/pnas.1300534110
Yan, L., and Wyart, M. (2014). Evolution of covalent networks under cooling: contrasting the rigidity window and jamming scenarios. Phys. Rev. Lett. 113:215504. doi: 10.1103/PhysRevLett.113.215504
Yan, L., and Wyart, M. (2015). Adaptive elastic networks as models of supercooled liquids. Phys. Rev. E 92:022310. doi: 10.1103/PhysRevE.92.022310
Keywords: rigidity transition, intermediate phase, liquid-liquid transition, network glasses, vibrational entropy
Citation: Toledo-Marín JQ and Yan L (2019) Competition Between Entropy and Energy in Network Glass: The Hidden Connection Between Intermediate Phase and Liquid-Liquid Transition. Front. Mater. 6:196. doi: 10.3389/fmats.2019.00196
Received: 17 May 2019; Accepted: 29 July 2019;
Published: 14 August 2019.
Edited by:
Punit Boolchand, University of Cincinnati, United StatesReviewed by:
John C. Mauro, Pennsylvania State University, United StatesStefan Karlsson, RISE Research Institutes of Sweden, Sweden
Copyright © 2019 Toledo-Marín and Yan. This is an open-access article distributed under the terms of the Creative Commons Attribution License (CC BY). The use, distribution or reproduction in other forums is permitted, provided the original author(s) and the copyright owner(s) are credited and that the original publication in this journal is cited, in accordance with accepted academic practice. No use, distribution or reproduction is permitted which does not comply with these terms.
*Correspondence: Le Yan, bHlhbkBraXRwLnVjc2IuZWR1