 Jochen Harmuth
 Björn Wiese
 Jan Bohlen
 Thomas Ebel
 Regine Willumeit-Römer1
- 1Metallic Biomaterials, Institute of Materials Research, Helmholtz-Zentrum Geesthacht, Geesthacht, Germany
- 2Magnesium Innovation Centre MagIC, Institute of Materials Research, Helmholtz-Zentrum Geesthacht, Geesthacht, Germany
Currently, only a few magnesium alloys have been approved for implant applications. For biomedical purposes, the choice of the alloying elements is a critical parameter and rare earth elements have been proven to be mechanically suitable and biologically tolerable. In this comprehensive study, tailoring the mechanical properties of binary Mg-Gd alloys by indirect extrusion is shown to obtain a property profile that is applicable to different biomedical applications. Mg-2Gd, Mg-5Gd, and Mg-10Gd were solid solution treated before extrusion. For each alloy various combinations of extrusion temperature and speed were applied. Resulting effects of alloy composition and processing on microstructure development, texture evolution, mechanical properties, and degradation behavior were investigated. Grain sizes and corresponding textures were adjusted by the extrusion parameters. Despite changes in the texture, grain boundary strengthening effects were confirmed for all alloys in accordance with the Hall-Petch relationship. The alloy composition contributed to the mechanical properties by solid solution strengthening and a combination of texture changes and slip activities. Consequently, mechanical properties can be tailored within a wide range resulting in tensile yield strengths of 90 to 200 MPa (ultimate tensile strengths 180–280 MPa) and compressive yield strengths of 80 to 220 MPa (ultimate compressive strengths 300–450 MPa) with elongations of 10–45%. Low degradation rates in the range of 0.2 mm/year were determined for all alloys. Degradation was only slightly influenced by the alloy composition but not affected by processing. Overall, the properties of Mg-Gd determined in this work appear to be suitable to future implant applications.
Introduction
As constant mineral element in the human body and contributing to a variety of metabolic processes magnesium features excellent biocompatibility (Eder, 2009). Furthermore, mechanical properties and degradation behavior of Mg outperform biodegradable polymers. However, in pure form Mg has insufficient mechanical strength for most implant applications, e.g., osteosyntheses. Alloying of pure Mg might overcome this drawback by varying modes of strengthening and by changing the deformation behavior and texture. However, excellent biocompatibility and slow degradation of alloying elements needs to be ensured. Due to the existing concerns related to the potential neurotoxicity of aluminum different alloying elements are under investigation (El-Rahman, 2003).
The application of aluminum-free magnesium alloys for biomedical implants is highly dependent on specific material properties such as good biocompatibility, robust degradation behavior, and relevant mechanical properties. Regarding these properties, rare earth based alloys have been proven to be suitable, for example in two different CE (European Conformity) approved implant applications: Magnezix alloy for screws and pins (company Syntellix)1 (Wetterlöv Charyeva, 2015) and SynerMag® alloy for Magmaris magnesium scaffold (company Biotronik)2 (Marukawa et al., 2016). In accordance with these approvals, also Mg-Gd alloys have shown promising potential in mechanical properties (Rokhlin, 2003; Hort et al., 2010) and in vitro and in vivo biocompatibility testing (Feyerabend et al., 2010; Myrissa et al., 2016).
The influence of rare earth elements on the mechanical properties of Mg alloys has been reported to be beneficial (Rokhlin, 2003; Tekumalla et al., 2014). Mechanisms such as grain size strengthening and solid solution strengthening have been addressed for Mg-Gd (Gao et al., 2009; Xu et al., 2016, 2018). The beneficial influence of rare earth elements in general (Imandoust et al., 2017) and in particular for Mg-Gd (Stanford and Barnett, 2008; Stanford et al., 2010; Kim et al., 2017) is also attributed to texture weakening and enhanced slip activation that results in improved ductility and reduced anisotropy. In addition, tailoring of mechanical properties is critical for implant design but the underlying mechanisms have to be fully understood, particularly for Mg-Gd. Regarding the degradation behavior, an absence of intermetallic phases, and dendritic segregation favors slow and homogeneous degradation. Here, degradation rates of rare earth based magnesium alloys can be influenced by heat treatments during processing (Dvorský et al., 2018), if required. Also, tailored surface treatments show potential for adjustments (Gawlik et al., 2017).
Thus, besides alloy composition, the influence of processing parameters on Mg-Gd alloys for biomedical applications needs to be addressed. In order to develop customized alloys, the aim of this work is to reveal the relation between the Gd content and the processing parameters to the property profile of as-extruded Mg-Gd alloys without deteriorating the low degradation behavior. As a result, reliable correlations between processing parameters and alloy properties were established in this study. Compared to previous works where mostly single material conditions or alloys have been described, findings in this work describe the overall capabilities of the Mg-Gd system for implant applications within a defined set of processing parameters for indirect extrusion. Results can be potentially transferred to other rare earth based Mg alloys and also applied as quality measures to verify reproducibility.
Experimental
Alloys with 2, 5, and 10 wt.% Gd were prepared by permanent direct chill casting in a resistance furnace. Pure magnesium (99.97%, Dead Sea Magnesium Ltd.) was melted in the furnace at 710°C, followed by the addition of pure Gd (99.9%, Dr. Ihme GmbH). The melt was stirred at 250 rpm for 15 min and poured into preheated molds. After placing the mold in a holding furnace at 650°C for 2 min the mold was slowly immersed into a water bath for a fast solidification of the ingot. The ingots were machined to cylinders of 150 mm length and 49 mm diameter and T4 treated (solid solution) at 525°C for 8 h. Before extrusion ingots were pre-heated to the respective extrusion temperatures for 1 h to establish a constant and homogeneous temperature distribution. Finally, round bars with a diameter of 10 mm were obtained by indirect extrusion (extrusion ratio 1:25). For each alloy different combinations of extrusion parameters were applied, varying the extrusion temperature (350, 400, and 450°C) and the profile exit speed (0.75, 1.50, and 3.00 m/min), referred to as the extrusion speed. The chemical composition of all alloys is presented in Table 1.
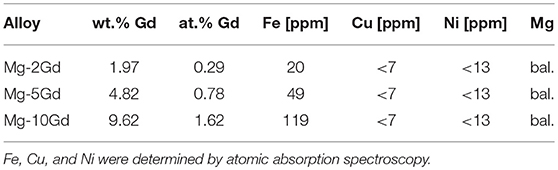
Table 1. Gd concentrations were measured by X-ray fluorescence spectroscopy.
Material characterization was conducted in the as extruded condition. Microstructural analysis was carried out on longitudinal sections of the round profiles using optical microscopy. Samples were ground by SiC paper down to 2,500 grit, polished by 1 μm OPSTM suspension (Cloeren Technology GmbH) with diamond 0.25 μm and etched by picric acid solution (Kree et al., 2004). Corresponding grain sizes were determined by counting line intersections with grain boundaries on three longitudinal sections (0.058 mm2 each). Recrystallized areas were measured on three images of three longitudinal sections (5.8 mm2 each) per sample and the corresponding mean value is expressed as degree of recrystallization (fraction of recrystallized area of overall area). SEM analysis was performed at an acceleration voltage of 15 kV and a working distance of 15 mm using a scanning electron microscope (TESCAN VEGA3-SB, Brno, Czech Republic) equipped with energy-dispersive X-ray spectroscopy (EDS).
Vickers hardness was determined on cross sections with a load of 5 kg (HV 5) and a dwell time of 30 s. An average of 10 measurements per sample were carried out on M1C 010 testing machine (Emco-Test GmbH). The tensile and compressive properties were determined by testing 5 samples per condition. Tensile test specimens were machined to a diameter of 5 mm and a gauge length of 25 mm corresponding to DIN 50125 form B. Samples for compression tests were machined to a diameter of 8 mm and a length of 12 mm. All tests were performed on a universal testing machine Zwick Z050 (ZwickRoell GmbH & Co. KG) at a constant strain rate of 10−3 s−1 at room temperature. Six pole figures were measured using X-ray diffraction on polished cross sections of the extruded bars. Cu Kα radiation with a beam size of 1.5 mm x 1 mm and tilt angles from 0 to 70° was used. An open source code MTEX (Bachmann et al., 2010) was applied to recalculate inverse pole figures in extrusion direction for texture presentation.
Degradation properties were determined by performing semi static weight loss tests under cell culture conditions (37°C, 5% CO2, 20% O2, 95% relative humidity). Prior to immersion samples were ground with 2,500 SiC paper, cleaned (20 min in hexane, 20 min in acetone, 5 min 100% ethanol all in ultrasonic bath, Merck KGaA) and sterilized (5 min in 70% ethanol). Initial weights were determined after cleaning, using an electronic balance (SBA 32, accuracy 0.1 mg, Scaltec). For each condition, three samples were immersed in Dulbecco's Modified Eagle's Medium (DMEM, Fisher Scientific) + Glutamax (Life TechnologiesTM, Gibco) + 10% fetal bovine serum (FBS, PAA Laboratories) for 7 days with medium changes after 2 and 4 days. Corrosion products were removed by immersion in chromic acid (180 g/L in distilled water, Sigma-Aldrich) for 20 min. Samples were cleaned with 100% ethanol and distilled water and dried at ambient temperature. The weight after removal of corrosion products was recorded using the electronic balance.
Results
Microstructure and Hardness
Microstructure profiles from longitudinal sections of the as extruded Mg-10Gd with corresponding extrusion parameters are presented in Figure 1 serving as an example also for Mg-2Gd and Mg-5Gd that show similar results. Overall, homogeneous distributions of equiaxed fine grains are present in all conditions. At lower extrusion speeds and temperatures some non-recrystallized areas are also visible. Cubic particles are present in all microstructures and aligned in extrusion direction. Exemplarily, an SEM image of Mg-10Gd is shown in Figure 2. EDS spot measurements (see Supplementary Figure 1) revealed high Gd concentrations of 75 to 85 wt.% for these cubic particles. The surrounding matrix (black area) showed Gd concentrations of around 9 wt.% which is in line with the overall alloy composition of Mg-10Gd in this study. Next to Gd, measurements revealed the presence of magnesium. Low signals for silicon and oxygen are attributed to residues of polishing and minimal surface oxidation and can be neglected. Compared to former investigations these results indicate the presence of Gd hydrides (GdH2) (Vlček et al., 2017). As a side note, when investigating samples by SEM, the amount/number of GdH2 particles appeared to be similar for all alloys and conditions but was not further quantified.
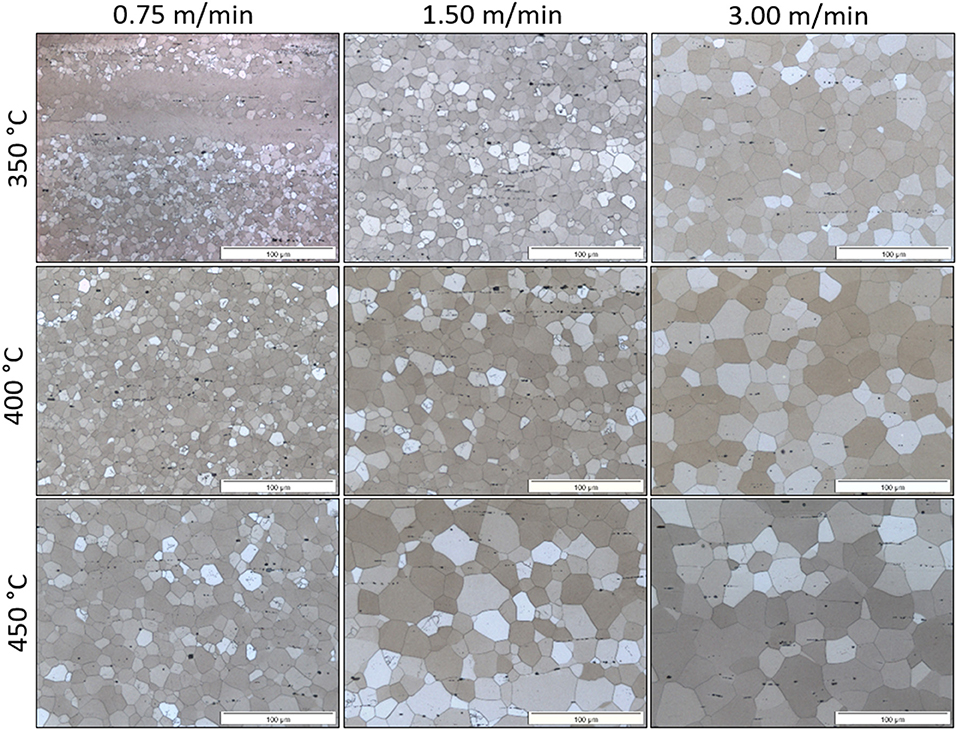
Figure 1. Microstructure evolution of Mg-10Gd after indirect extrusion. Micrographs show longitudinal sections with extrusion direction to the right.
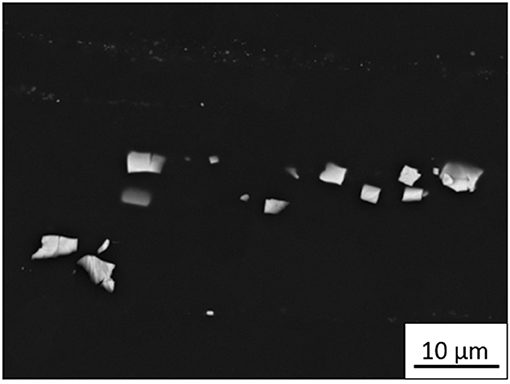
Figure 2. SEM image (BSE) with GdH2 particles aligned in extrusion direction.
The influence of the extrusion parameters on grain size and hardness is shown in Figure 3. For all alloys, grain sizes are similar at identical extrusion conditions indicating no influence of alloy composition. Minor differences are of no significance and might be due to slight parameter variation during extrusion. Increasing grain sizes are observed when the extrusion speed and/or the extrusion temperature is increased. This is due to an impact of deformation heat which increases with the extrusion speed as reported in earlier work (Bohlen et al., 2010). For all alloys, the average grain sizes range from 3 μm at 350°C and 0.75 m/min up to 25 μm at 450°C and 3.00 m/min. Both, increasing extrusion speed and extrusion temperature result in lower hardness values, as also shown in Figure 3. In addition, the effect of alloy composition on the hardness is visualized. Contrary to grain size evolution, hardness values are significantly affected by the alloy composition.
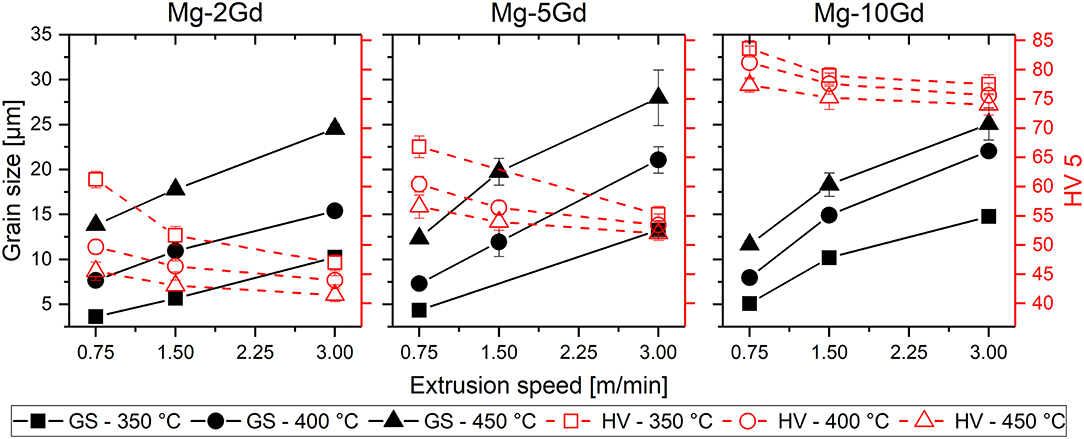
Figure 3. Grain sizes (solid) and hardness (empty) for all alloys with respect to individual extrusion conditions. With increasing extrusion parameters, grain sizes trend higher, hardness values trend lower. Alloy composition is not affecting grain sizes but hardness values are significantly increased with higher Gd additions. Error bars are standard deviations.
Furthermore, the microstructures are characterized by the degree of recrystallization after extrusion. Non-recrystallized areas are present in conditions after slow extrusion and at low temperatures and can be easily identified by their elongated band-like structure with significantly larger dimensions compared to the surrounding recrystallized fine grains (see top left micrograph in Figure 1). The degree of recrystallization for all alloys with respect to extrusion parameters is shown in Figure 4. Extrusion conditions representing speeds of 1.50 m/min or 3.00 m/min feature degrees of recrystallization of more than 95% for all three alloys and temperatures which is considered to be fully recrystallized. Only the slowest speed of 0.75 m/min is accompanied by not fully recrystallized microstructures in the three alloys. However, an increase in extrusion temperature leads to a higher degree of recrystallization in all alloys. The increase of Gd content visibly also leads to higher degrees of recrystallization.
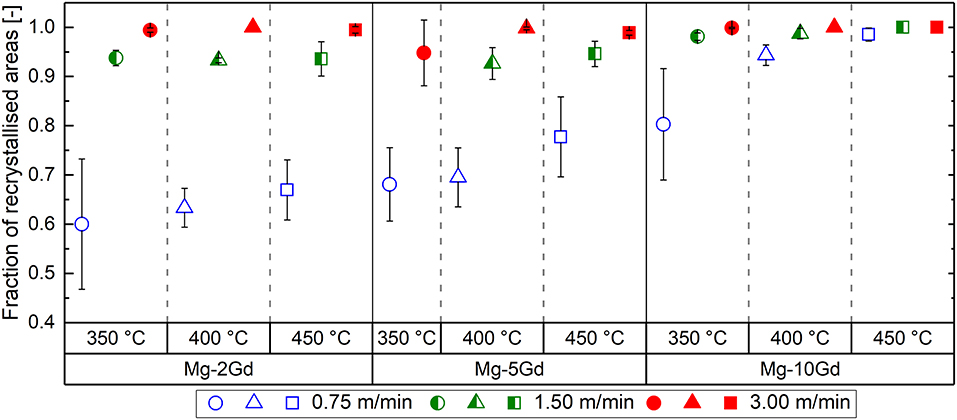
Figure 4. Degree of recrystallization for all alloys with respect to extrusion parameters. Identical symbols refer to identical extrusion conditions and degree of recrystallization is comparable in between all alloys (i.e., blue circles represent 350°C and 0.75 m/min for each alloy). Error bars are standard deviations.
Texture
Inverse pole figures are presented in Figure 5. For each alloy, four combinations of extrusion parameters are shown to analyze the influence of extrusion parameters and alloy composition. For 0.75 m/min and 350°C, all alloys show a similar strong texture dominated by intensities at the pole (see Figures 5A–C). In part, this component of texture is characteristic of a not fully recrystallized microstructure and corresponds well to uniaxial deformation of hcp metals (Dillamore and Roberts, 1965; Bohlen et al., 2010). However, for Mg-10Gd the maximum intensity is significantly lower and a weak component at the 〈0001〉 pole is present. Increasing the extrusion temperature to 450°C (Figures 5D,E) the textures for Mg-2Gd and Mg-5Gd are comparable. Again, Mg-10Gd shows further reduced intensities that are also shifted toward the pole (Figure 5F). The component at the 〈0001〉 pole vanished. When increasing the extrusion speed at constant temperatures maximum intensities in all alloys are significantly lowered and steadily shifted toward the pole (see Figures 5G–L). This texture development correlates well with observations in microstructure evolution as non-recrystallized areas disappear and recrystallization takes place when extrusion speed and temperature are increased. Contrary to the microstructures, there is a larger effect of the extrusion speed to the weakening of textures whereas the influence of extrusion temperature is of minor importance. Additionally, the alloy composition is influencing the texture development as intensities are significantly lowered with increasing amount of Gd. In all alloys a “rare earth component” (Stanford and Barnett, 2008) is visible, characterized by intensities with tilt out of the arc between the and poles toward the 〈0001〉 pole. Thus, a tilt of basal planes out of the extrusion direction results. This is more pronounced at higher Gd contents as well as at higher extrusion temperatures.
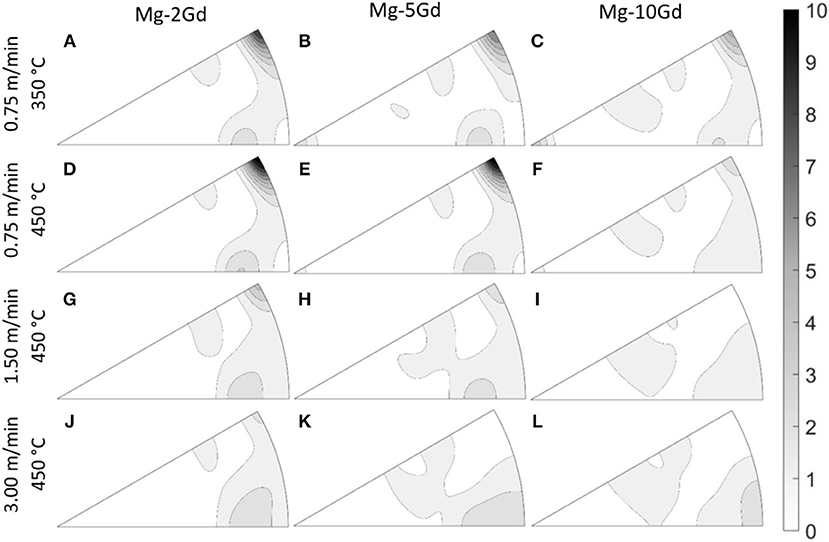
Figure 5. Texture development of as extruded conditions. Bottom left 〈0001〉 pole, bottom right pole and top right pole with intensities ranging from 0 to 10. (A–C) Extrusion at 0.75 m/min and 350°C; (D–F) extrusion at 0.75 m/min and 450°C; (G–I) extrusion at 1.50 m/min and 450°C; (J–L) extrusion at 3.00 m/min and 450°C.
Tension and Compression Properties
Results of tension and compression testing in correlation to the respective extrusion parameters are summarized in Figure 6. Results of tensile yield strengths (TYS) and compressive yield strengths (CYS) are displayed in Figure 6A. TYS and CYS decrease with increasing extrusion parameters. However, this effect is minimalized for the highest extrusion speed and with increasing Gd content. The tensile and compressive yield strengths increase with increasing Gd content. Furthermore, a tension/compression (t/c) yield asymmetry can be observed. It is obtained by dividing corresponding TYS by CYS for identical extrusion conditions. For Mg-2Gd, CYS is lower than TYS leading to a t/c ratio of ≥1 for all conditions. This is partially reversed for Mg-5Gd that shows t/c ratios of 0.84–1.11. For Mg-10Gd, the yield asymmetry is completely reversed with t/c ratios of ≤ 1 for all conditions. Results of ultimate tensile strengths (UTS) and ultimate compressive strengths (UCS) are displayed in Figure 6B. In all conditions and for all alloys, UCS > UTS. Overall, ultimate strengths decrease with increasing extrusion temperatures and speeds with the exception for UCS in Mg-2Gd at 400°C and Mg-5Gd at 400 C and 450°C. Ultimate strengths increase with increasing Gd content.
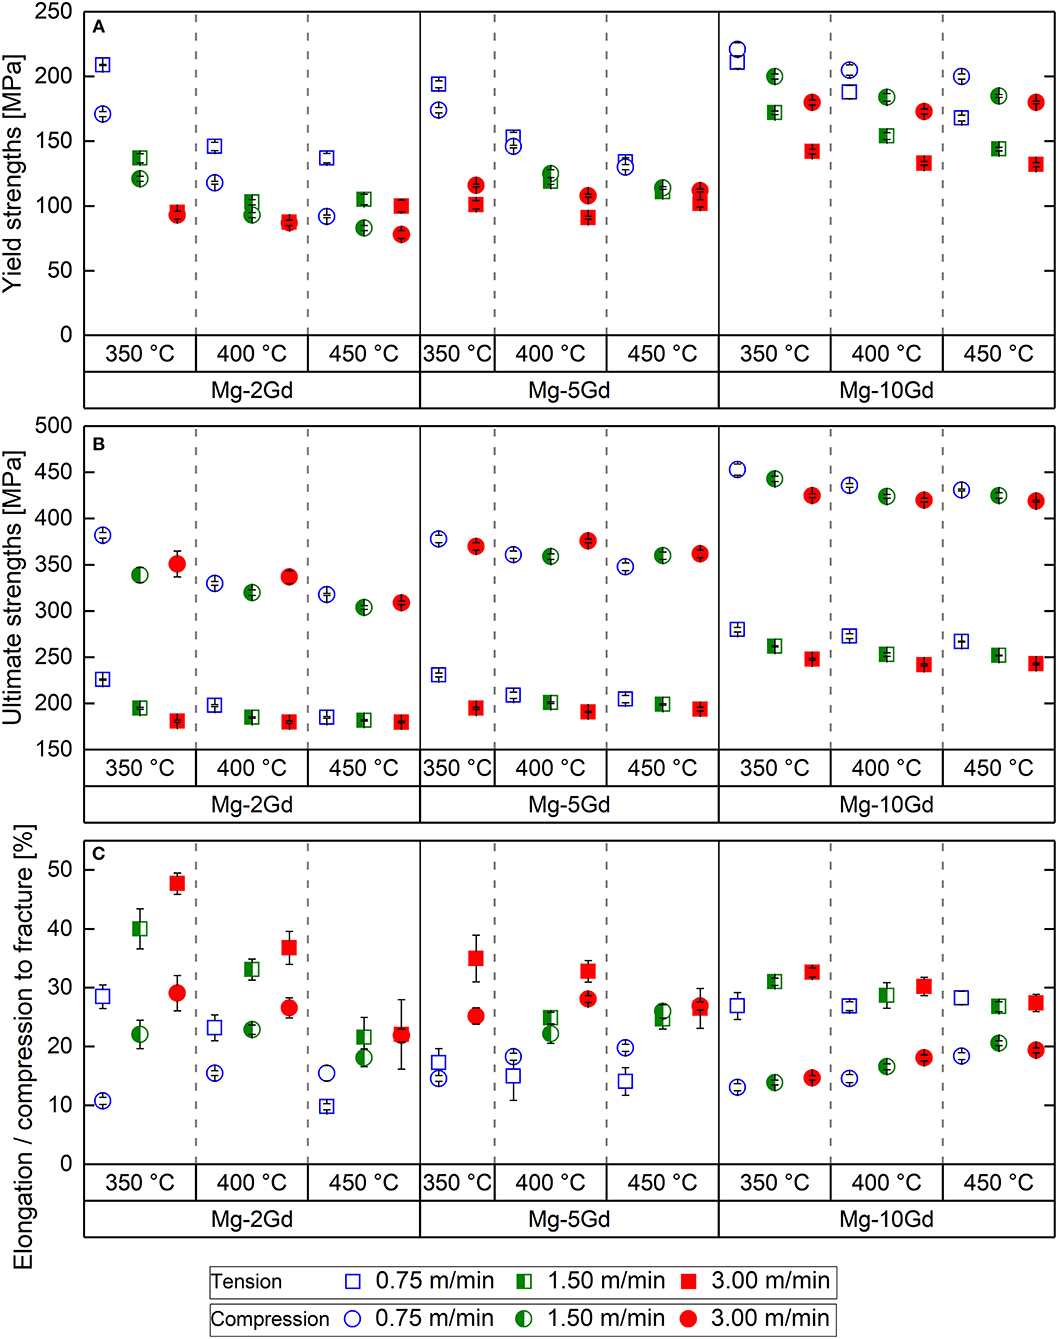
Figure 6. Mechanical properties from tension and compression with respect to extrusion parameters. (A) Yield strengths, (B) ultimate strengths, and (C) elongation and compression to fracture.
Results of elongation to fracture (Att) and compression to fracture (Atc) are displayed in Figure 6C. The influence of extrusion parameters is first explained using data of Mg-2Gd. An increase in speed results in an increase in Att whereas an increase in temperature reduces Att. This trend can be seen also in Mg-5Gd and is valid for all conditions in Mg-10Gd except at 450°C. Att ranges from 10 to 48% for Mg-2Gd and from 14 to 35% for Mg-5Gd. Contrary, Mg-10Gd shows minimal variations from 27 to 33%. Same trends are visible for compressive deformation as an increase in extrusion speed also results in an increase in Atc. Interestingly, changes in the extrusion temperature do not result in such a general trend. However, for Mg-10Gd an almost linear increase in Atc can be observed when increasing speed and temperature that results in a range of 13–21%. For Mg-2Gd Atc ranges from 11 to 29% and from 15 to 28% for Mg-5Gd. A wide range of Att and Atc can be observed for low amounts of Gd in relationship with the parameter variation. These variations in Att and Atc are narrowed, when Gd levels are increased.
Degradation Properties
Degradation rates (DR) after immersion for 7 days were calculated by Equation 1 with change in weight Δm [g], density ρ [g/cm3] (measured based on Archimedes principle), surface area A [cm2] and time t [h]. Results are presented in Figure 7 and show similar and low values of around 0.15–0.25 mm/year with no statistical significant differences. DR are not affected by extrusion parameters. However, higher Gd contents tend to lower overall DRs. These degradation rates are perfectly suitable for further investigation by cell culture and in vivo studies.
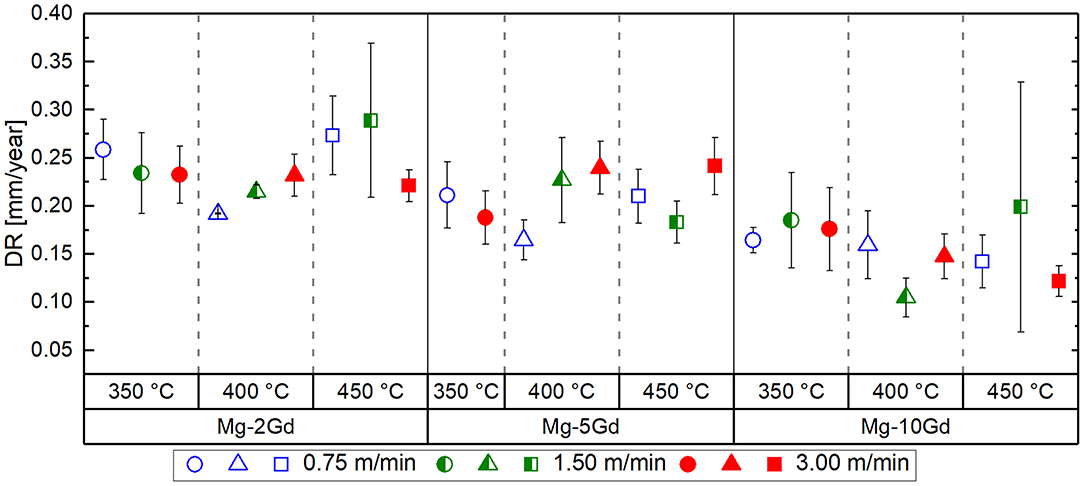
Figure 7. Mean degradation rates after 7 days immersion. Error bars are standard deviations.
Discussion
Microstructure and Texture Evolution
As described in previous studies, the development of microstructures and textures in rare earth containing Mg alloys is based on several mechanisms: in some parts by changes in grain nucleation and grain growth during recrystallization as a result of extrusion. In other parts by texture changes because of the activation of deformation mechanisms like slip and twinning (Yu et al., 2013; Kim et al., 2017; Harmuth et al., 2018).
First, contributions of grain nucleation and grain growth are discussed. Results show no significant difference in the grain size between different Gd contents for the same extrusion conditions. However, an increase of the Gd content also increases the fraction of recrystallized microstructure in those conditions where such behavior can be judged (e.g., at 350°C). As solid solution treatment prior to extrusion is also applicable to increasing contents of Gd it is hypothesized that intermetallic particles as nucleation sites of recrystallized grains (i.e., a particle stimulation of recrystallization) or particles as obstacles for grain boundary mobility (i.e., a particles related mobility drag) are not to be considered as important mechanisms in this regard. While in other alloys (see e.g., Mg-RE-Mn alloys, Vlček et al., 2017) the same microstructure development features have been discussed in the context of particle effects, it is suggested that another solute related source of grain nucleation is active with increasing Gd content. This also includes the deformation characteristics such as dislocations or twins leading to stress pile-ups and therefore sources of recrystallization. Contrary, the grain size is not changing with increasing Gd content which contradicts an enhanced grain growth ability. It is therefore hypothesized that the nucleation rate of recrystallized grains is increased by adding Gd whereas grain growth is somewhat restricted. Similar discussions have been presented for other Mg alloys including rare earth elements (Bohlen et al., 2010).
Concurrently, the texture evolution is affected by the extrusion conditions and the amount of Gd. Strong {10-10} fiber textures are present in materials processed at slow extrusion speeds that also feature non-recrystallized areas in the microstructure. As reported before, this deformation texture is a result of partial recrystallization known in Mg alloys in general, regardless of the addition of Gd (Bohlen et al., 2010; Yu et al., 2013; Kim et al., 2017). As described before, the increase in extrusion temperature appears to be of higher significance to the recrystallization and weakening of the textures. Again, a higher content of Gd is associated with less significant intensity at the <10-10> pole and concurrently the fraction of un-recrystallized microstructure.
Furthermore, a distinct texture development known as “rare earth texture” is addressed (Stanford and Barnett, 2008). It describes the orientation of basal planes with a tilt out of the extrusion direction. This component is present in all samples and is beneficial for deformation processes as it enables basal slip. Due to its low critical resolved shear stress of as low as 0.7 MPa it serves as the main deformation mechanism in magnesium alloys (Kammer, 2000; Fukuda et al., 2016).
In samples with low extrusion speeds and low extrusion temperatures, increasing Gd content weakens deformation textures and also develops texture components at the <0001> pole. This represents an orientation of basal planes perpendicular to the extrusion direction. A proposed explanation for this texture evolution can be found in a combination of shear band recrystallization and the solute drag effect as well as non-basal slip activation (Grey and Higgins, 1973; Kim et al., 2017). With increasing extrusion parameters and therefore coarser grains, the influence of Gd addition is reduced.
Grain Size Strengthening Effect
Results of tensile yield strengths (TYS) and compressive yield strengths (CYS) with respect to the average grain size, D, are plotted in Figure 8. Following the Hall-Petch relation (Equation 2) the inverse square root of the grain size is used to visualize potential grain boundary strengthening effects, with YS being the TYS or CYS, Ky [MPa μm1/2] the strengthening coefficient associated with grain boundary strengthening and σ0 [MPa] the friction stress for dislocation movement. Note, that a required statistical orientation relation between neighboring grains may not be fulfilled in the framework of the study as the samples exhibit a weak but non-random texture in all cases. Strengthening coefficients and friction stress are summarized in Table 2. As the textures remain weak in most cases, a potential contribution to these coefficients may be low.
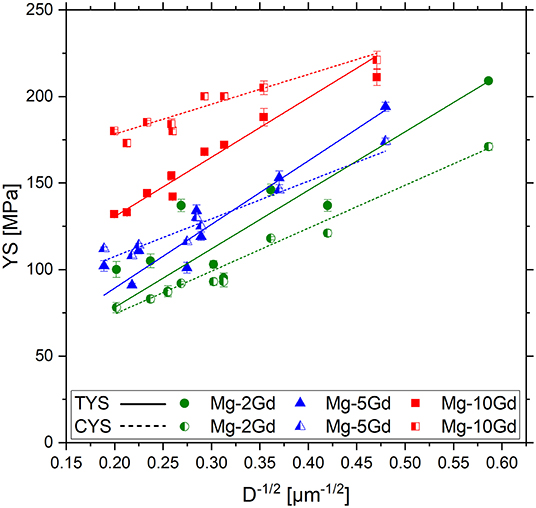
Figure 8. Hall-Petch relation for all alloys. TYS denoted by solid lines and symbols. CYS denoted by halved symbols and dashed lines. Error bars are standard deviations.
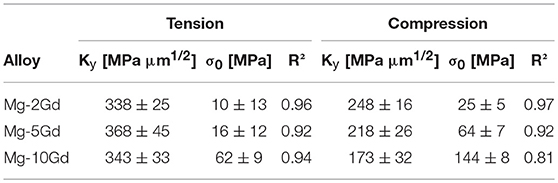
Table 2. Hall-Petch coefficients for tension and compression including standard deviations (Harmuth et al., 2018).
A linear behavior of grain size to yield strengths for tension and compression with high coefficients of determination is confirmed for all alloys. Furthermore, a reversed t/c asymmetry becomes visible with increasing Gd content, which also corresponds to higher degrees of recrystallization and weaker textures. Xu et al. (2018) determined a similar Hall-Petch relation and yield asymmetries for small grains within their analysis of a wide range of grain sizes. Minor differences in values might be attributed to the fact that a combination of heat treated and extruded material conditions with a large range in grain sizes (30 to more than 1,500 μm) were investigated. Similar results were also previously reported for Mg-0.49 at.% Gd (3.09 wt.% Gd) with Ky of 188 MPa μm1/2 and σ0 of 46.5 MPa for tension tests (Gao et al., 2009).
In hcp metals, yield strengths are affected by crystallographic orientation with respect to loading direction and alloy composition. Tension-compression yield asymmetries have been investigated before in as-extruded pure Mg with t/c > 1 (Sukedai and Yokoyama, 2010) and, reversed, for Mg-10Gd with t/c < 1 (Maier et al., 2012). This indicates that a shift in yield asymmetry is due to increasing Gd contents and is supported by the results of this work. This effect is most likely caused by an activation of {10-11} compression twins at the expense of {10-12} tension twins (Nagarajan et al., 2016).
The friction stress is increased with increasing Gd content for tension and compression (Table 2). Low friction stress for Mg-2Gd is due to the softening of prismatic slip and hardening of the basal plane by solute Gd atoms in dilute Mg alloys (Akhtar and Teghtsoonian, 1969). With higher concentrations of Gd atoms in solid solution, the hardening effect is increased. Furthermore, short range order is likely to contribute to hardening of slip and twinning in Gd alloys (Gencheva et al., 1981). Compared to previous works (Nagarajan et al., 2016), results for friction stress in this study are similar. Slight differences for Mg-10Gd are attributed to texture effects, i.e., higher CYS due to tensile twinning when <0001> pole intensity is present.
The strengthening coefficients in Table 2 are not significantly different for all three alloys if the error margins are considered. However, the values for the compression tests remain visibly lower compared to those in tension. In recent work, it was proposed that this behavior is due to changes in twinning deformation (Harmuth et al., 2018). For increasing Gd contents {10-12} extension twinning is more and more inhibited by short range order whereas {10-11} compression twinning remains available for higher Gd contents in solid solution (Nagarajan et al., 2016). Consequently, the asymmetry between tension and compression is reversed as it is shown for Mg-10Gd.
A different analysis proposes the theory of a change in deformation mechanics with increased Gd content (Cepeda-Jiménez et al., 2018). This is supported by Figure 9 showing the deformation behavior for Mg-2Gd and Mg-10Gd in tensile and compression testing. As expected, materials with smaller grain sizes show higher strengths during tension and compression no matter of the amount of Gd. As it can be seen in Figure 9A, in tension similar deformation behavior is visible for Mg-2Gd and Mg-10Gd. In compression (Figure 9B) Mg-2Gd shows a typical S-shape curve for small grains that is flattened with increasing grain size representing active twinning deformation. However, the distinct difference in the curves of Mg-10Gd support the theory that twinning is active in compression of Mg-2Gd but suppressed in compression of Mg-10Gd. This is attributed to increased Gd contents and an increase in extrusion speed accompanied by a higher degree of recrystallization and weaker textures. As a result t/c is already reversed for smaller grains when Gd contents are higher.
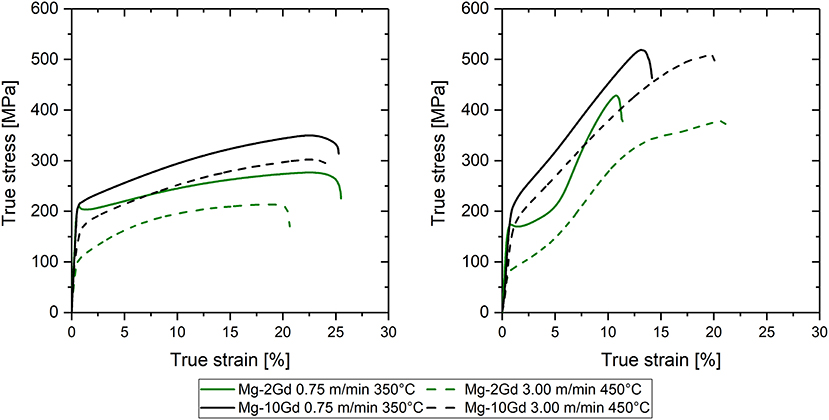
Figure 9. True stress-strain curves for smallest (0.75 m/min and 350°C) and most coarse grains (3.00 m/min and 450°C) and lowest and highest Gd content. (A) Tension, (B) compression.
Overall, grain size strengthening effects are easily observed in tension and compression yield strengths (Figure 8). TYS and CYS are linearly increased with decreasing grains sizes in the Hall-Petch plot. Also, a solid solution strengthening effect is visible. For identical grain sizes the increase in yield strengths is attributed to the increase of Gd atoms in solid solution.
Hardness Effects
Grain Sizes
The alloys in this study also exhibit a linear relationship of hardness to grain size that follows the Hall-Petch relationship (see Figure 10) and was reported before for aluminum alloys (Taha and Hammad, 1990). It can be described with reasonable security by Equation 3 with KHV and H0 being constants that were determined experimentally (see Table 3). Overall, smaller grains, represented by low extrusion parameters, feature higher hardness values than coarse grains, represented by higher extrusion parameters. Furthermore, an increase in hardness with increasing Gd content becomes visible that is independent of grain size. In contrast to these findings, Xu et al. (2016) reported independence of grain size and hardness. This is attributed to the large range of grain sizes (30 to more than 1,500 μm) that was investigated. The present work is focused on grain sizes ranging from 3 to 25 μm and clearly indicate a strengthening effect of grain size on hardness values.
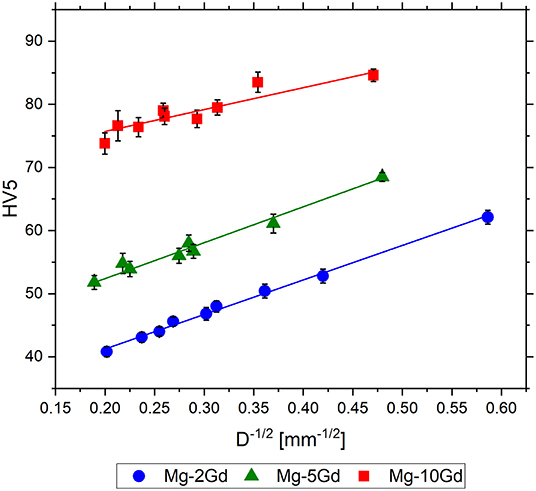
Figure 10. Effect of grain size on hardness. Error bars are standard deviations.
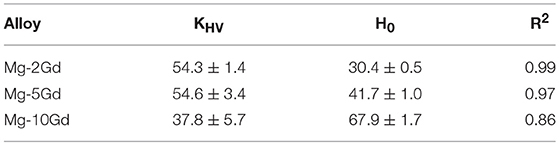
Table 3. Coefficients for relation of hardness to grain size including standard deviations.
Ultimate Strengths
Results indicate that there is a direct relation between ultimate strengths and hardness values that is shown in Figure 11. Technically, a direct relationship between tensile/compressive strength and hardness is not to be expected as mechanisms of deformation and failure are different. However, as both measurements require loading the empirical relationship that is observed in this work appears to be viable. A similar relationship between UTS and hardness has been reported for steel (Pavlina and Van Tyne, 2008) and Cu alloys (Zhang et al., 2011). It can be described with reasonable security by Equation 4 with KUS and US0 being constants that were determined experimentally (see Table 4). Limited availability of slip systems in Mg alloys and the already mentioned different CRSS for compressive and tensile twinning as well as the t/c asymmetry in yields strengths illustrate that this phenomenon is in need of further analysis. Nonetheless, both relations are applied to an accurate estimation of ultimate strengths from hardness measurements without facilitating expensive and time consuming tensile and compression test. In addition to the Hall-Petch relationship, the most important mechanical properties can be derived from simple microstructure analysis and hardness measurement.
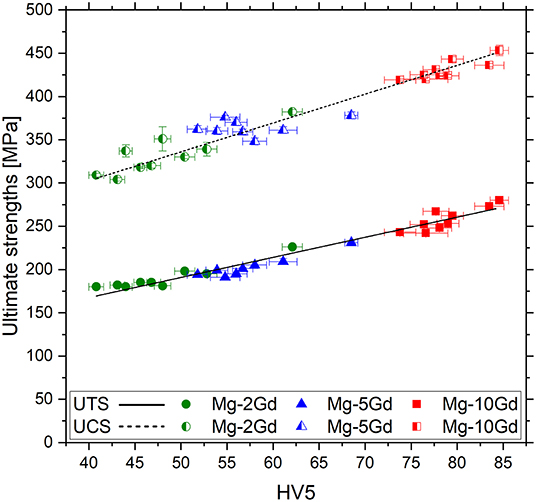
Figure 11. Correlation between UTS/UCS and Vickers hardness. UTS denoted by solid lines and symbols. UCS denoted by halvedsymbols and dashed lines. Error bars are standard deviations.
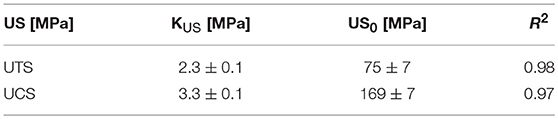
Table 4. Coefficients for relation of ultimate strengths to hardness including standard deviations.
Fracture Strains
Fracture strains in tension exceed those in compression in most cases. In general, the fracture strains remain high in comparison to other magnesium extrusions. Interestingly, an increase in fracture strain with increasing speed is associated with an increase of the fraction of recrystallized microstructure. On the other hand, a decrease of fracture strains with increasing extrusion temperature is concurrent to larger grained microstructures. The higher the Gd content and the lower the differences in grain size or fraction of recrystallized microstructure the more similar are the fracture strains as visible in the case of Mg-10Gd. In compression this tendency is less strongly developed compared to tension. Furthermore, the texture component at the 〈0001〉 pole and a change in deformation mechanism as mentioned before might be contributing to the limitation of fracture strains for high Gd contents.
Degradation Characteristics
The overall degradation behavior is low and appears applicable to biomedical applications despite significantly high levels of Fe contamination especially for Mg-10Gd. Degradation rates are not influenced by processing parameters, grain sizes or microstructural features. No conclusions can be drawn to put degradation rates in relation to the degree of recrystallization or the mechanical properties. A significant impact or correlation is not revealed. Overall, higher amounts of Gd up to 10 wt.% tend to lower degradation rates. This is in accordance with findings of Rokhlin (2003). It was also confirmed by Hort et al. (2010) in earlier studies. However, these results were obtained from as cast conditions only and showed significantly higher DRs. In this work, due to the fact that all materials have been solid solution heat treated and also after extrusion Gd remained in solid solution, potential local galvanic effects have been reduced to a minimum as reported previously (Dvorský et al., 2018). Similar DRs for as extruded Mg-5Gd have been reported by Gawlik et al. (2017). Further surface treatment by HAc etching is effective in reducing DRs and improving reproducibility. According to Gawlik et al. (2019) the acetic acid etching of Mg-xGd alloys is able to remove harmful surface bound Fe contaminants (e.g., from manufacturing) which in turn improve the reproducibility of the degradation behavior. Overall, degradation behavior in this study was assessed by short term tests only and requires further investigation.
Applicability and Transferability
In terms of applicability, a comparison of mechanical properties of Mg-10Gd at 350°C and 0.75 m/min to as extruded SynerMag® alloy system, that is used for an available implant, is favorable. Properties of SynerMag® featuring YS of 190–220 MPa (210 MPa for Mg-10Gd), UTS of 260–320 MPa (280 MPa), and Att of 20–35% (27%) (Magnesium Elektron).
Due to similar behavior of rare earth elements in Mg alloys in general (Rokhlin, 2003), application of these finding to different systems might be possible in the future in order to further improve properties by extrusion. Furthermore, findings can be transferred to production and quality control due to inexpensive and time saving analysis of properties.
Conclusions
Overall, several relationships between alloy composition, microstructures and mechanical properties have been derived that aid in further development of degradable implants based on rare earth Mg alloys. Furthermore, these findings can be applied to increase overall understanding of underlying mechanism in Mg alloys in general. The major findings are:
1) As extruded Mg-Gd system features homogeneous microstructures accompanied by weak textures that can be tailored by indirect extrusion.
2) The tension/compression yield asymmetry is inverted with increasing Gd content based on a change in deformation mechanism.
3) Higher Gd content is reducing the variation in the texture and increasing the recrystallization without an effect on the grain growth in the absence of nucleation particles.
4) The following relationships are confirmed in this work:
a. Grain size strengthening effects on TYS/CYS and on hardness
b. Hardness and ultimate strengths
5) Degradation of all materials is slow and not affected by processing or alloy composition. Mechanical properties can be varied in a wide range without deteriorating the superior degradation rate.
6) Within this frame of processing and alloy composition, customization of mechanical properties is feasible to meet standards of an already approved Mg alloy.
Data Availability
All datasets generated for this study are included in the manuscript/Supplementary Files.
Author Contributions
JH, BW, and JB conceived, analyzed data, and designed experiments. JH and JB performed extrusion. JH performed characterization with assistance of BW and JB. JB, TE, and RW-R contributed materials, analysis tools. JH wrote initial manuscript and prepared the final manuscript. BW, JB, TE, and RW-R revised manuscript and assisted with valuable feedback and discussions.
Funding
The presented work was funded in parts by the Helmholtz Association: Project Virtual Institute MetBioMat (VH-VI 523 MetBioMat).
Conflict of Interest Statement
The authors declare that the research was conducted in the absence of any commercial or financial relationships that could be construed as a potential conflict of interest.
Acknowledgments
The presented work follows a collaborative approach between the Institute for Metallic Biomaterials and the Magnesium Innovation Center. The help of and discussions with Prof. Karl Ulrich Kainer, Dr. Norbert Hort, and Dr. Dietmar Letzig is highly acknowledged. The authors appreciate the help of Mr. Günter Meister during casting the material and the advice of Mr. Gert Wiese for metallography in this work.
Supplementary Material
The Supplementary Material for this article can be found online at: https://www.frontiersin.org/articles/10.3389/fmats.2019.00201/full#supplementary-material
Supplementary Figure 1. EDS spot measurements and corresponding spectra of magnesium matrix (1) and Gd rich particle (2).
Footnotes
1. ^Syntellix. Magnezix Alloy. Available online at: http://www.syntellix.de/home.html (accessed November 15, 2018).
2. ^Magnesium Elektron. SynerMag Alloy Specifications. Available online at: https://www.magnesium-elektron.com/markets/biomaterials/synermag/ (accessed November 15, 2018).
References
Akhtar, A., and Teghtsoonian, E. (1969). Solid solution strengthening of magnesium single crystals-I alloying behaviour in basal slip. Acta Metall. 17, 1339–1349. doi: 10.1016/0001-6160(69)90151-5
Bachmann, F., Hielscher, R., and Schaeben, H. (2010). Texture analysis with MTEX —free and open source software toolbox. Solid State Phenom. 160, 63–68. doi: 10.4028/www.scientific.net/SSP.160.63
Bohlen, J., Yi, S., Letzig, D., and Kainer, K. U. (2010). Effect of rare earth elements on the microstructure and texture development in magnesium-manganese alloys during extrusion. Mater. Sci. Eng. A. 527, 7092–7098. doi: 10.1016/j.msea.2010.07.081
Cepeda-Jiménez, C. M., Prado-Martínez, C., and Pérez-Prado, M. T. (2018). Understanding the high temperature reversed yield asymmetry in a Mg-rare earth alloy by slip trace analysis. Acta Mater. 145, 264–277. doi: 10.1016/j.actamat.2017.12.021
Dillamore, I. L., and Roberts, W. T. (1965). Preferred orientation in wrought in annealed metals. Metall. Rev. 10, 271–380. doi: 10.1179/095066065790138348
Dvorský, D., Kubásek, J., Vojtìch, D., Cavojský, M., and Minárik, P. (2018). Effect of heat pre-treatment and extrusion on the structure and mechanical properties of WZ21 magnesium alloy. Mater. Tehnol. 52, 499–505. doi: 10.17222/mit.2017.214
Eder, K. (2009). Magnesium-verbindungen - aufnahme, funktionen und therapeutische aspekte. Pharm. Unserer Zeit. 38, 262–267. doi: 10.1002/pauz.200800316
El-Rahman, S. S. A. (2003). Neuropathology of aluminum toxicity in rats (glutamate and GABA impairment). Pharmacol. Res. 47, 189–194. doi: 10.1016/S1043-6618(02)00336-5
Feyerabend, F., Fischer, J., Holtz, J., Witte, F., Willumeit, R., Drücker, H., et al. (2010). Evaluation of short-term effects of rare earth and other elements used in magnesium alloys on primary cells and cell lines. Acta Biomater. 6, 1834–1842. doi: 10.1016/j.actbio.2009.09.024
Fukuda, K., Koyanagi, Y., Tsushida, M., Kitahara, H., Mayama, T., and Ando, S. (2016). Activation stress for slip systems of pure magnesium single crystals in pure shear test. J Japan Inst. Met. 80, 334–339. doi: 10.2320/jinstmet.J2015062
Gao, L., Chen, R. S., and Han, E. H. (2009). Effects of rare-earth elements Gd and Y on the solid solution strengthening of Mg alloys. J. Alloys Compd. 481, 379–384. doi: 10.1016/j.jallcom.2009.02.131
Gawlik, M. M., Steiner, M., Wiese, B., González, J., Feyerabend, F., Dahms, M., et al (2017). The effects of HAc etching on the degradation behavior of Mg-5Gd. J. Med. Mater. Technol. Spec. Issue Proc. 4th Euro BioMAT. 1, 22–25. doi: 10.24354/medmat.v1i2.17
Gawlik, M. M., Wiese, B., Welle, A., Gonzalez, J., Desharnais, V., Harmuth, J., et al (2019). Acetic acid etching of Mg-xGd alloys. Metals 9:117. doi: 10.3390/met9020117
Gencheva, D. S., Katsnelson, A. A., Rokhlin, L. L., Silonov, V. M., and Khavadzha, F. A. (1981). Short order study in erbium and gadolinium containing magnesium-base alloys. Fiz. Met. Metalloved. 51, 788–793.
Grey, E. A., and Higgins, G. T. (1973). Solute limited grain boundary migration: a rationalisation of grain growth. Acta Metall. 21, 309–321. doi: 10.1016/0001-6160(73)90186-7
Harmuth, J., Wiese, B., Bohlen, J., Ebel, T., and Geesthacht, H. (2018). “Tailoring of material properties of Mg-Gd alloys for biomedical applications,” in Proceedings of the 11th International Conference on Magnesium Alloys and Their Applications (Old Windsor), 376–381.
Hort, N., Huang, Y., Fechner, D., Störmer, M., Blawert, C., Witte, F., et al (2010). Magnesium alloys as implant materials-Principles of property design for Mg-RE alloys. Acta Biomater. 6, 1714–1725. doi: 10.1016/j.actbio.2009.09.010
Imandoust, A., Barrett, C. D., Al-Samman, T., Inal, K. A., and El Kadiri, H. (2017). A review on the effect of rare-earth elements on texture evolution during processing of magnesium alloys, J. Mater. Sci. 52, 1–29. doi: 10.1007/s10853-016-0371-0
Kim, S. H., Jung, J. G., You, B. S., and Park, S. H. (2017). Microstructure and texture variation with Gd addition in extruded magnesium. J. Alloys Compd. 695, 344–350. doi: 10.1016/j.jallcom.2016.10.179
Kree, V., Bohlen, J., Letzig, D., and Kainer, K. U. (2004). Metallographische gefügeuntersuchungen von magnesiumlegierungen. Prakt. Metallogr. Metallogr. 41, 233–246.
Maier, P., Müller, S., Dieringa, H., and Hort, N. (2012). “Mechanical and corrosion properties of as-cast and extruded MG10GD alloy for biomedical application,” in Magnesium Technology, eds S. N. Mathaudhu, W. H. Sillekens, N. R. Neelameggham, and N. Hort (Cham: Springer), 253–259.
Marukawa, E., Tamai, M., Takahashi, Y., Hatakeyama, I., Sato, M., Higuchi, Y., et al. (2016). Comparison of magnesium alloys and poly-l-lactide screws as degradable implants in a canine fracture model. J. Biomed. Mater. Res. Part B Appl. Biomater. 104, 1282–1289. doi: 10.1002/jbm.b.33470
Myrissa, A., Martinelli, E., Szakács, G., Berger, L., Eichler, J., Fischerauer, S. F., et al. (2016). In vivo degradation of binary magnesium alloys - A long-term study. Bio. Nano Mater. 17, 121–130. doi: 10.1515/bnm-2016-0006
Nagarajan, D., Cáceres, C. H., and Griffiths, J. R. (2016). Grain size hardening effects in Mg-Gd solid solutions. Metall. Mater. Trans. A 47, 5401–5408. doi: 10.1007/s11661-016-3686-1
Pavlina, E. J., and Van Tyne, C. J. (2008). Correlation of yield strength and tensile strength with hardness for steels. J. Mater. Eng. Perform. 17, 888–893. doi: 10.1007/s11665-008-9225-5
Rokhlin, L. L. (2003). Magnesium Alloys Containing Rare Earth Metals: Structure and Properties, 1st Edn. London: Taylor & Francis.
Stanford, N., Atwell, D., and Barnett, M. R. (2010). The effect of Gd on the recrystallisation, texture and deformation behaviour of magnesium-based alloys. Acta Mater. 58, 6773–6783. doi: 10.1016/j.actamat.2010.09.003
Stanford, N., and Barnett, M. R. (2008). The origin of “rare earth” texture development in extruded Mg-based alloys and its effect on tensile ductility. Mater. Sci. Eng. A. 496, 399–408. doi: 10.1016/j.msea.2008.05.045
Sukedai, E., and Yokoyama, T. (2010). Investigation of tensile-compressive yield asymmetry and the role of deformation twin in extruded pure magnesium. Int. J. Mater. Res. 101, 736–740. doi: 10.3139/146.110332
Taha, A. S., and Hammad, F. H. (1990). Application of the hall-petch relation to microhardness measurements on Al, Cu, Al-MD 105, and Al-Cu Alloys. Phys. Status Solidi 119, 455–462. doi: 10.1002/pssa.2211190207
Tekumalla, S., Seetharaman, S., Almajid, A., and Gupta, M. (2014). Mechanical properties of magnesium-rare earth alloy systems: a review. Metals 5, 1–39. doi: 10.3390/met5010001
Vlček, M., CíŽek, J., Lukáč, F, Hruška, P., Smola, B., Stulíková, I., et al. (2017). Hydrogen absorption in Mg-Gd alloy. Int. Hydrogen Energy J. 42, 22598–22604. doi: 10.1016/j.ijhydene.2017.04.012
Wetterlöv Charyeva, O. (2015). Bioresorbable Magnesium Implants for Bone Applications. Giessen: University Giessen.
Xu, Y., Gensch, F., Ren, Z., Kainer, K. U., and Hort, N. (2018). Effects of Gd solutes on hardness and yield strength of Mg alloys. Prog. Nat. Sci. Mater. Int. 28, 1–7. doi: 10.1016/j.pnsc.2018.10.002
Xu, Y., Ren, Z., Huang, Y., Kainer, K., and Hort, N. (2016). Solid solution strengthening in Mg-Gd. Mag Technol. 2016, 135–139. doi: 10.1002/9781119274803.ch27
Yu, H., Kim, Y. M., You, B. S., Yu, H. S., and Park, S. H. (2013). Effects of cerium addition on the microstructure, mechanical properties and hot workability of ZK60 alloy. Mater. Sci. Eng. A. 559, 798–807. doi: 10.1016/j.msea.2012.09.026
Keywords: extrusion, biomaterial, mechanical properties, degradation, gadolinium, rare earth elements, yield asymmetry, texture
Citation: Harmuth J, Wiese B, Bohlen J, Ebel T and Willumeit-Römer R (2019) Wide Range Mechanical Customization of Mg-Gd Alloys With Low Degradation Rates by Extrusion. Front. Mater. 6:201. doi: 10.3389/fmats.2019.00201
Received: 24 May 2019; Accepted: 05 August 2019;
Published: 20 August 2019.
Edited by:
Maria Teresa Pérez, Instituto IMDEA Materiales, SpainReviewed by:
Antonio Riveiro Rodriguez, University of Vigo, SpainDikai Guan, University of Sheffield, United Kingdom
Copyright © 2019 Harmuth, Wiese, Bohlen, Ebel and Willumeit-Römer. This is an open-access article distributed under the terms of the Creative Commons Attribution License (CC BY). The use, distribution or reproduction in other forums is permitted, provided the original author(s) and the copyright owner(s) are credited and that the original publication in this journal is cited, in accordance with accepted academic practice. No use, distribution or reproduction is permitted which does not comply with these terms.
*Correspondence: Jochen Harmuth, am9jaGVuLmhhcm11dGhAaHpnLmRl; Björn Wiese, YmpvZXJuLndpZXNlQGh6Zy5kZQ==