 Mingpei Li
 Dongye Yang
 Bo He
Bo He- School of Materials Engineering, Shanghai University of Engineering Science, Shanghai, China
This article presents a systematically study through experimental and theoretical methods to better understand the mechanism of the geometric deformation produced during selective laser melting (SLM) treatment of the Ti6Al4V blade. Ti6Al4V blade was prepared by SLM. Microstructure, dimensional deviation and residual stress were investigated. The microstructure observation illustrates that the acicular α′ martensite formed in prior β grain, in addition, the smaller the grain size, the larger the dimensional deviation. The geometric deviation demonstrates that the directions of dimensional deviation at the leading and trailing edges of the blade are opposite to those in the middle. The distribution of dimensional deviation exhibits a parabolic change at the trailing edge of blade. The thermal stresses along the edges are much larger than that of the blade body, which cause the severe deformation of the edges toward the suction side of the blade. This conclusion is further verified by the XRD method. The residual stress distribution measured through X-ray diffraction is consistent with the simulation results.
Introduction
Ti6Al4V alloy is widely utilized in the aerospace industry benefits from its high specific strength, light weight, and superior corrosion resistance, especially as a suitable materials for aero-engine blades (Cui et al., 2011; Shuhui et al., 2013; Zhang and Chen, 2019). However, the traditional subtractive manufacturing process is difficult to fabricate complex Ti6Al4V components due to its low thermal conductivity, high hardness and high chemical reactivity, which also causes a large amount of material waste and high manufacturing costs (Tian et al., 2008; Greitemeier et al., 2017; Zhuang et al., 2018).
Additive manufacturing (AM) is an emerging manufacturing technology that builds three-dimensional objects in a layer-by-layer manner (Emmelmann et al., 2013; Herzog et al., 2016; Zhang et al., 2018a). Thus, AM technology enables rapid prototyping of complex structural components of Ti6Al4V alloy. Selective laser melting (SLM) is a powder-based AM process, which utilizes a laser-beam to melt metal powder and produce components with high dimensional accuracy. At present, titanium alloy AM is becoming a mature technology, which is not only be utilized in producing aerospace components with high geometric complexity such as impellers and blades (Liu et al., 2017), but also can be used to produce medical equipments and implants (Yadroitsev et al., 2014; Uhlmann et al., 2015; Seabra et al., 2016; Zhang and Attar, 2016; Xu et al., 2018).
During the SLM process, the metal powder is rapidly melted by the laser beam to form a molten pool (Manvatkar et al., 2015), and then, it cools and solidifies rapidly due to the extremely fast laser scanning speed, resulting in a steep temperature gradient near the molten pool (Vasinonta et al., 2006). The great temperature gradient makes the trend of expansion and contraction among the various parts inside the component, which generate thermal stress and thermal deformation during the forming process, and form residual stress and residual deformation after the end of construction (Mercelis and Kruth, 2006; Kruth et al., 2012; Cheng et al., 2016). These problems directly affect the dimensional accuracy and functional performance of the components (Rossini et al., 2012). Therefore, a large number of studies focusing on prediction and prevention of residual stress and related deformation of SLM process can be found. Kruth et al. (2012) developed a bridge curvature method to assess the thermal stress and deformation of SLM components. They found that optimizing the direction of the laser scanning vector can reduce thermal stress and deformation. Li et al. (2017a) developed a temperature-thread modeling method for efficient prediction of cantilever distortion produced by SLM. Their study reported that the predicted residual stress in length direction is dominant factor for part distortion. Large tensile residual stress in length direction was predicted on the top layer of the cantilever with support on the substrate, and the tensile residual stress in the upper layer of the cantilever decreased by 70% after the support removal. Mukherjee et al. (2017) combined three-dimensional transient heat transfer and additive fluid flow models with thermodynamic models to accurately calculate the temperature field, residual stress, and deformation of Ti6Al4V printing components. The simulation results show that the longitudinal residual stress exhibits a steep gradient at both ends of the deposit, making the part easy to bend and warp; the residual stress changes from tensile to compressive at the layer interfaces, which may result in layer separation. Most of these studies directly use simulation software to obtain stress field and deformation distribution (Cheng et al., 2016; Li et al., 2017a, 2018; Mukherjee et al., 2017; Zhang et al., 2018b). Their research aims to develop new three-dimensional numerical models to better predict residual stress and deformation of printed components under different parameters. However, the mechanism of the influence of thermal stress on deformation is rarely studied. In addition, the experimental research objects are usually rectangular or thin-walled parts with simple shapes, and the research results cannot effectively reflect the dimensional deviation distribution of complex SLM components.
In view of the above, the objective of this work is to study the distribution law of dimensional deviation of complex blade components prepared by SLM and to explore the mechanism of thermal stress on deformation.
Materials and Methods
Gas-atomized spherical Ti6Al4V powder was used as the raw powders. The size range of raw powders is 15–45 μm, size distribution (D50) is ≤30 μm, flowability is ≤40 s, and apparent density is 2.5 g/cm3. The chemical compositions of raw powders are listed in Table 1.
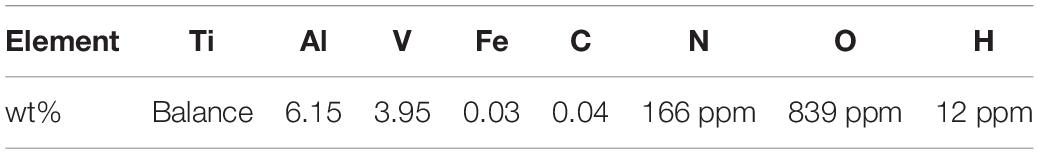
Table 1. The chemical composition of Ti6Al4V powder.
A solid Ti6Al4V blade sample was designed and printed, as shown in Figure 1a. Figure 1b showed details of the designed blade. The Ti6Al4V blade was manufactured by an EOS M280 system equipped with an Yb-Fiber laser with a maximum power output of 400 W. During the process, the built chamber was in an argon atmosphere to avoid oxidation of the sample. The temperature of built platform was maintained at 200°C, the laser power was 280 W; the scanning speed was 1200 mm/s; the scanning pitch was 85 μm; layer thickness was 30 μm; and scanning strategy for zigzag scanning.
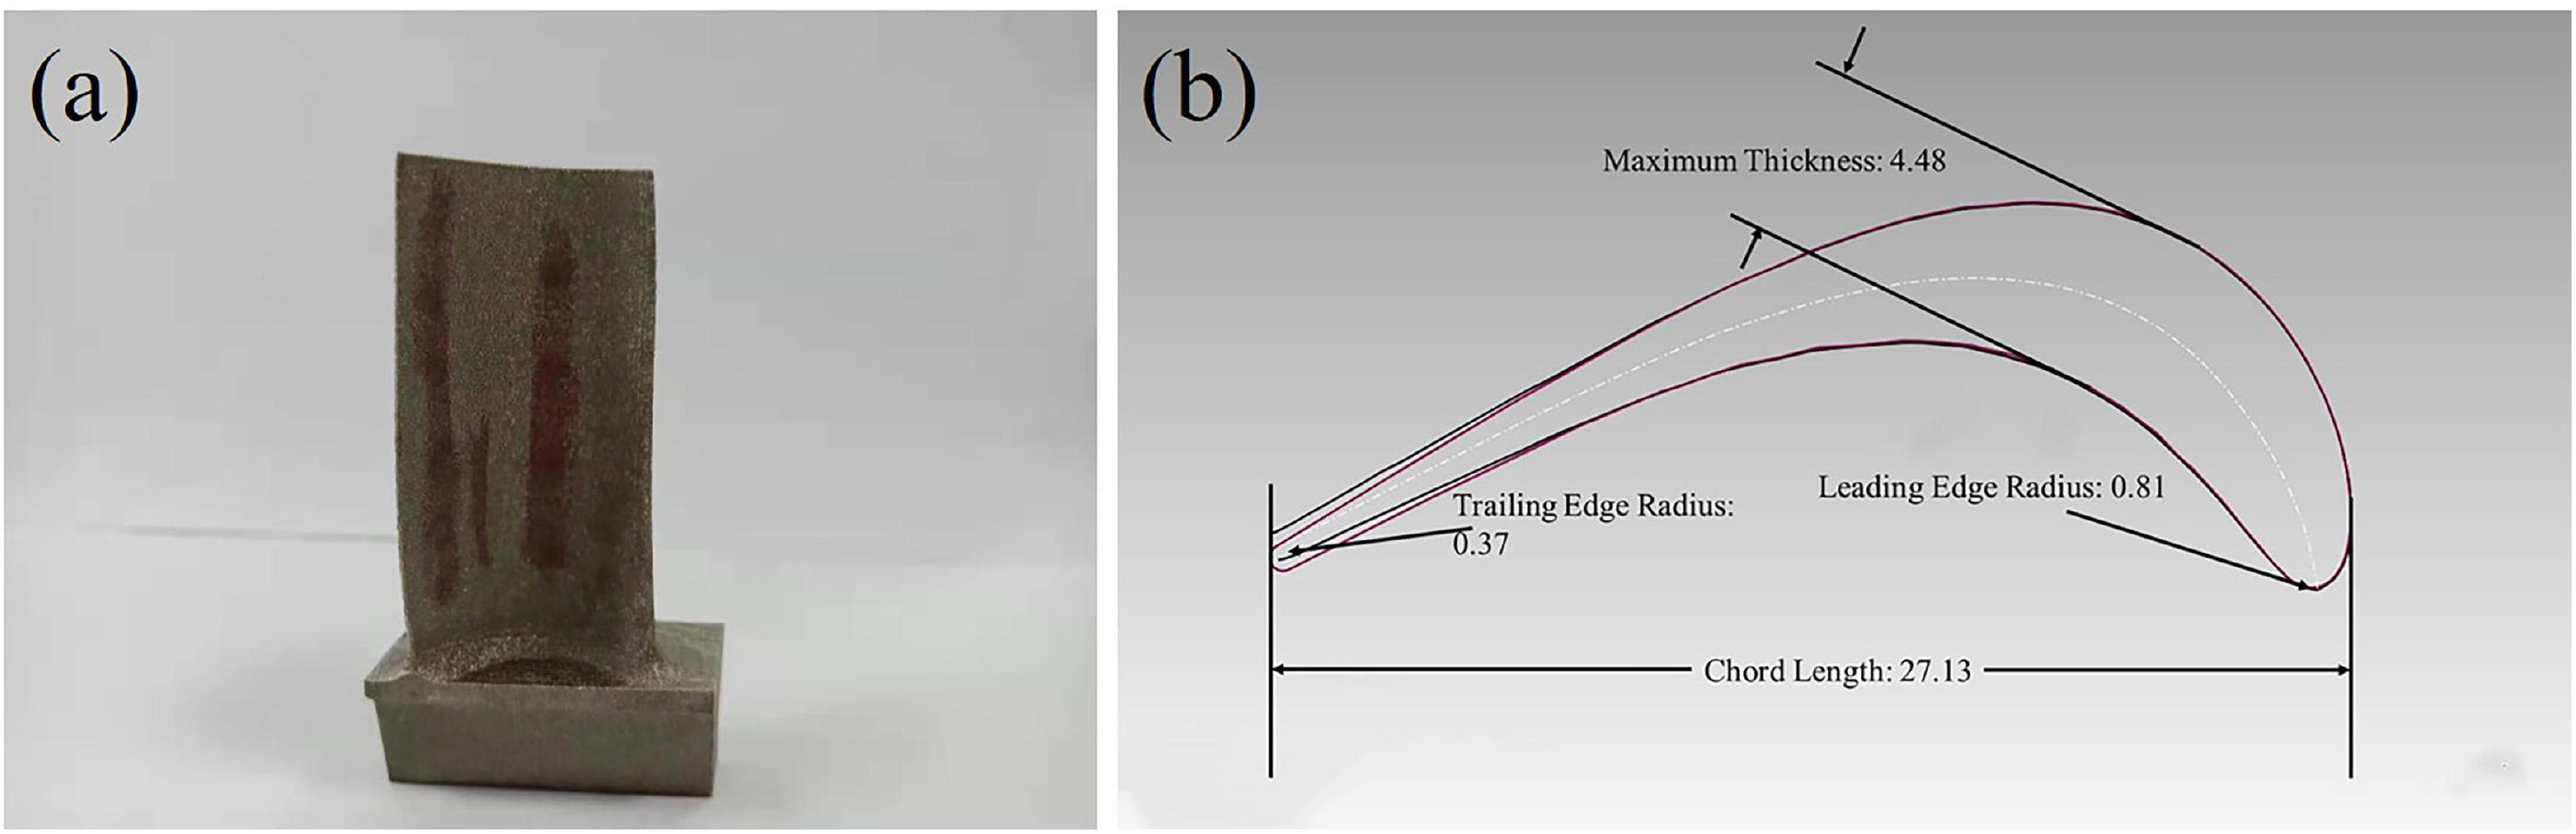
Figure 1. (a) The Ti6Al4V blade. (b) Details of the designed blade.
The samples were scanned using a three-dimensional scanner equipped with a blue-ray projector and two cameras with a resolution of 0.02 mm. The scanned data was imported into Geomagic Control software and aligned with the three-dimensional model of the sample to obtain dimensional deviations for all samples.
The microstructure was observed by an optical microscopy (OM, Olympus-BX53) and electron backscatter diffraction (EBSD). Samples of microstructure and EBSD were cut at the leading edge and trailing edge of the blade, respectively. The size of samples is 8 mm × 8 mm. The samples of EBSD were electro-polished. The samples of microstructure were polished then etched in reagent (5 ml HF + 25 ml HNO3 + 50 ml water) for 20 s.
The residual stresses were obtained by the XRD pattern (D8 advance, CuKα radiation, λ = 1.542 Å). The longitudinal direction of blade is construction direction. the transverse direction is perpendicular to the construction direction and parallel to the blade surface. The accelerating voltage and tube current are 30 kV and 25 mA, respectively. The spot diameter is 2 mm. The sin2 ψ method was conducted to calculate the planar stresses of the blade on the basis of the shifts of diffraction peak of Ti {213} with ψ angel in the range −30° ≤ ψ ≤ 30°. The test surface stress can be regarded as a two-dimensional stress state. The relationship between residual stress σ and sin2 ψ can be demonstrated as (Li et al., 2017b):
where d is the d-spacing of the plane measured at angle ψ, d0 is the stress freed-spacing, −1/2S2σ is the X-ray elastic constant which is calculated from ISODEC (Gnäupel-Herold, 2012) and set to 11.89 × 10⁻⁶ MPa–1. The residual stress can be calculated from the slope between the (d−d0)/d0 and sin2ψ (Vora et al., 2015).
Results and Discussion
Microstructure
The XRD pattern of the blade is shown in Figure 2. The hexagonal closed-packed (hcp) α′ phases are detected, distinct β phase peaks are not observed, which indicates that the prior-β phase has converted into the α′ phase due to the high cooling rate during SLM process. The longitudinal section microstructure of blade along the build direction are shown in Figure 3. The OM images show the presence of α′ martensite laths and columnar prior-β grain boundaries. Prior-β grains grow epitaxially along a heat flow direction through a plurality of deposited layers. The length of columnar prior-β grains is about several 100 μm and the width is about 50–200 μm. A large number of acicular α′ martensite are formed within the columnar prior-β grains. These acicular martensites are parallel or perpendicular to each other and form an angle of about 45° with the grain boundaries of the prior-β grains (Figure 3a). The α′ martensite at the trailing edge of the blade (Figure 3b) are finer than the leading edge (Figure 3a).
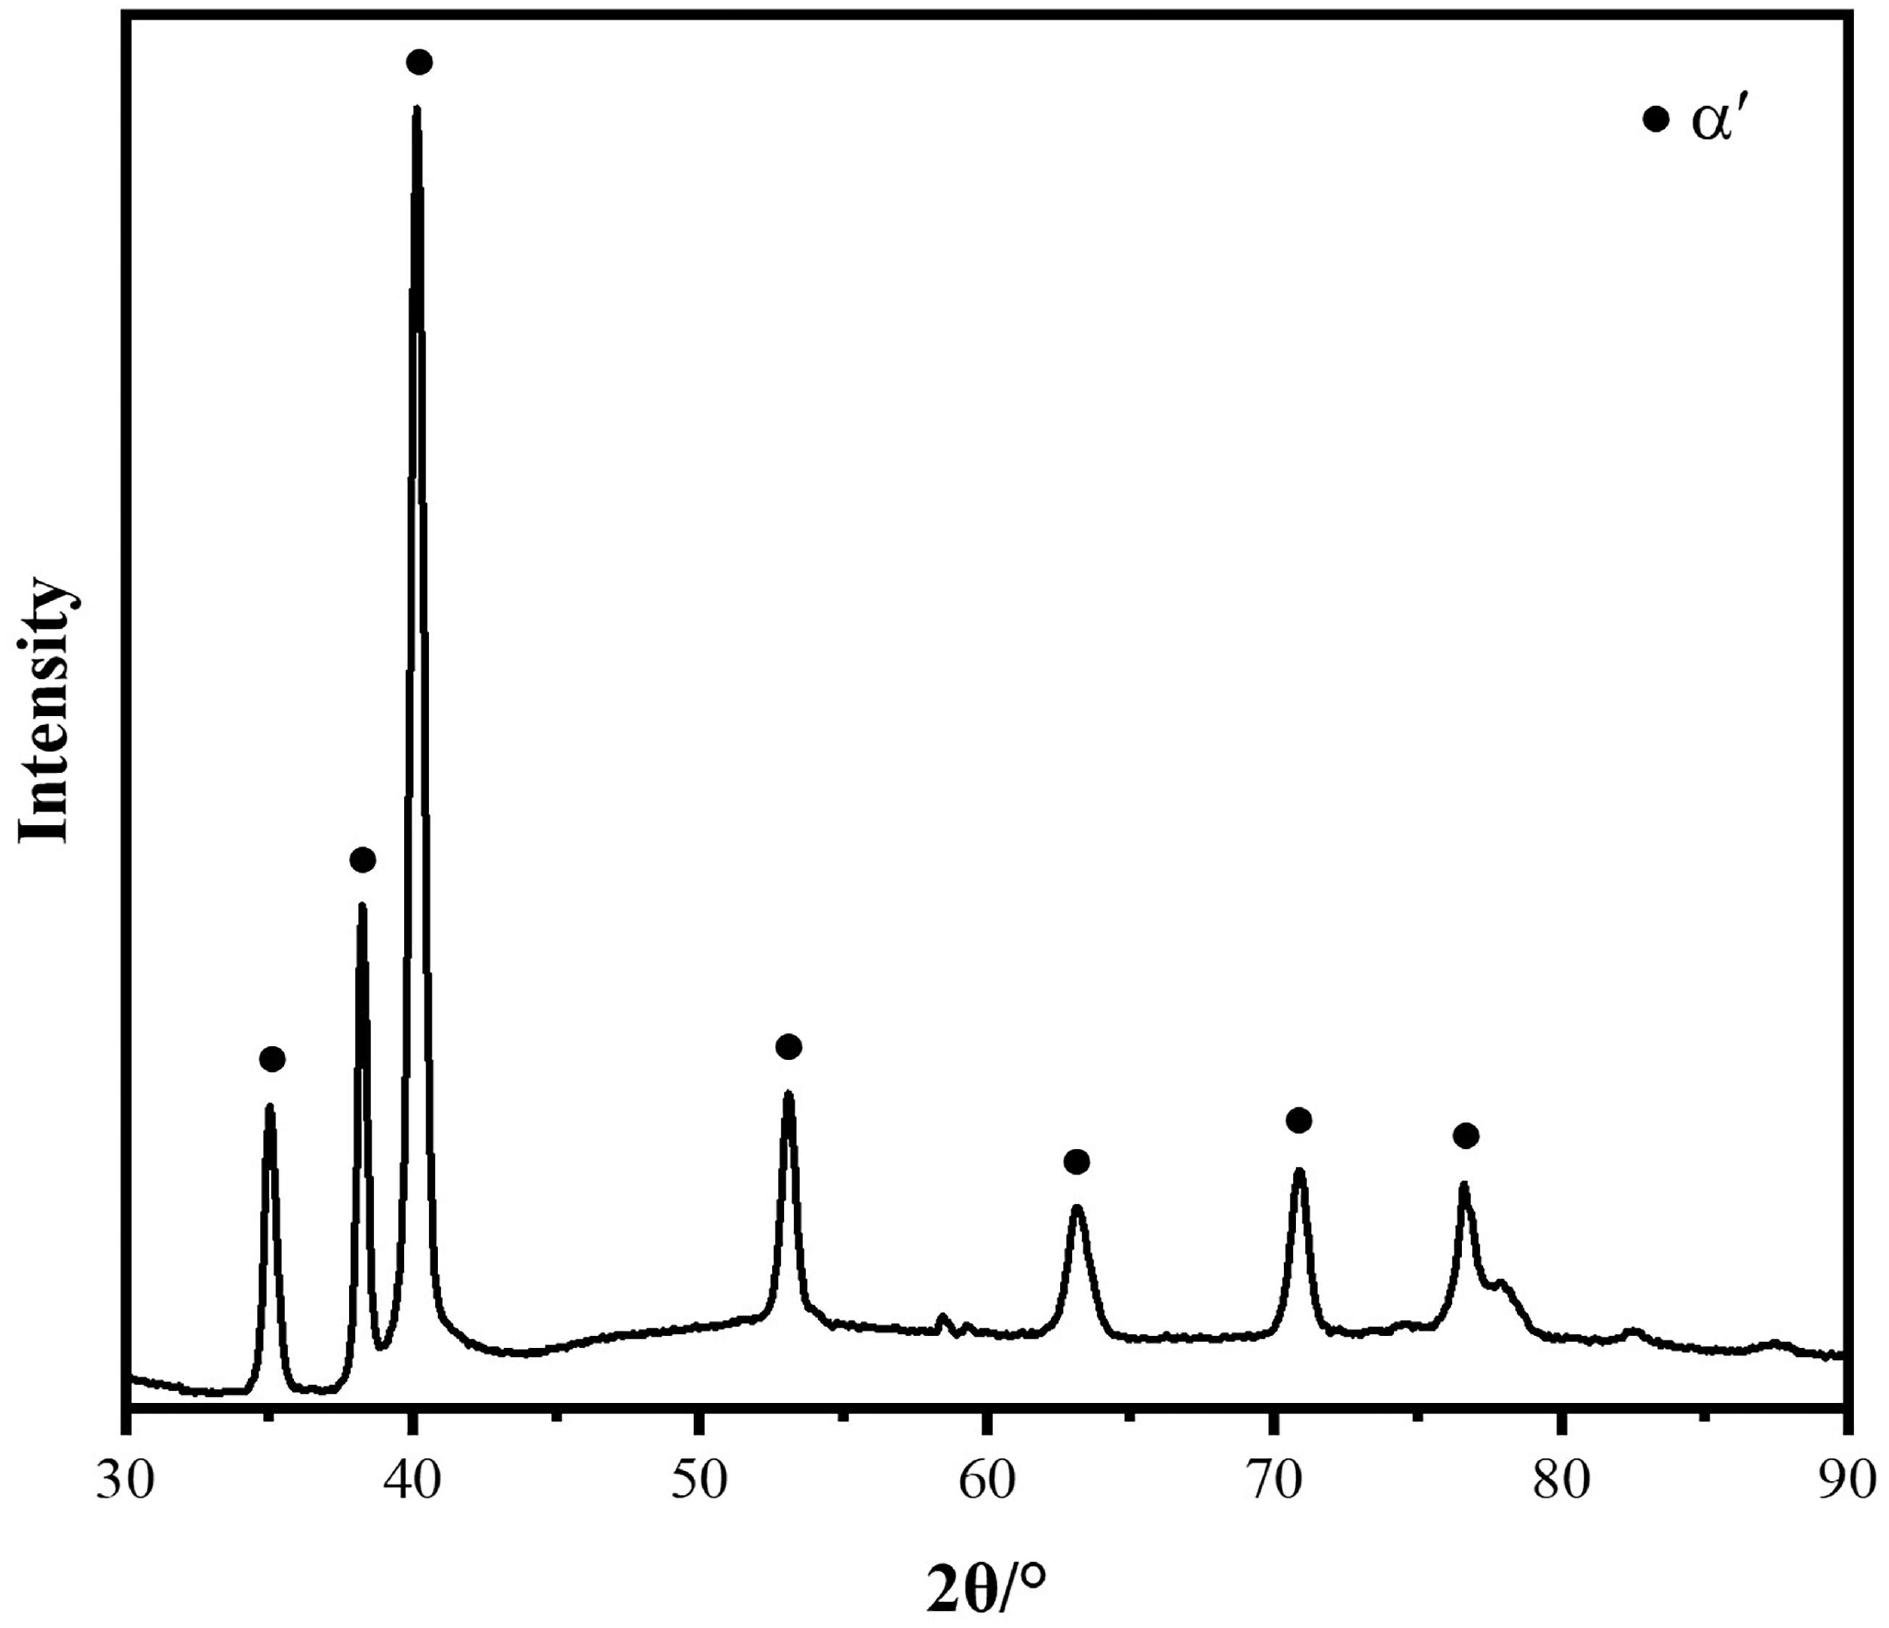
Figure 2. The XRD profile for the SLMed Ti6Al4V blade feature.
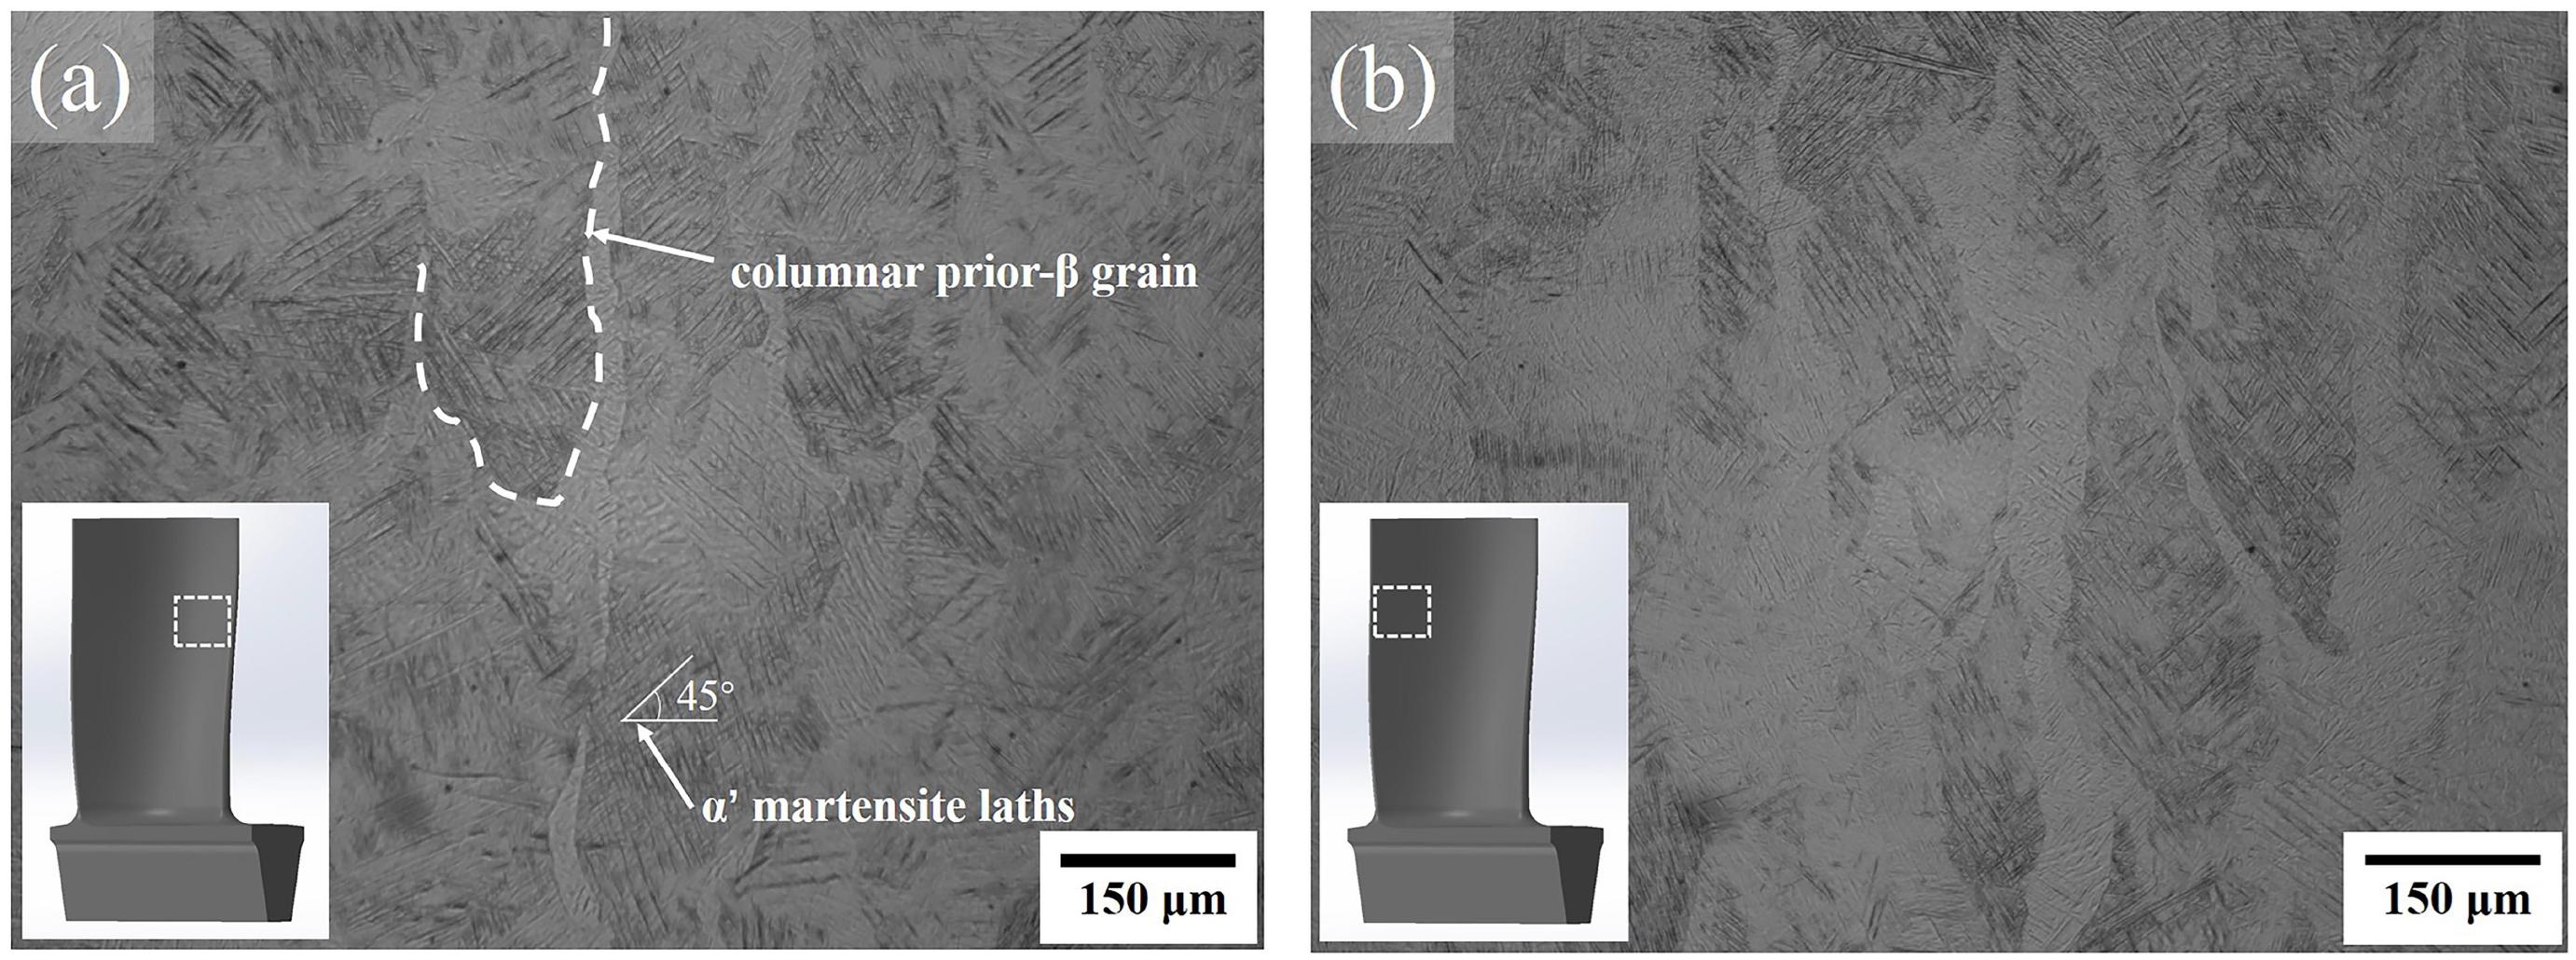
Figure 3. Optical microscopy (OM) images of the longitudinal section of SLM Ti6Al4V blade. (a) The leading edge, (b) the trailing edge.
Electron backscatter diffraction microscopy of blade at the leading and trailing edges are shown in Figures 4a,b. The inverse pole figure (IPF) map shows orthogonally oriented martensitic colony are formed within the prior-β grains. The α’ martensite colony at the leading and trailing edge are shown in Figures 5A,B, respectively. The size of α′ martensite colony at the trailing edge (Figure 5B) are finer than that at the leading edge (Figure 5A), which are corresponded to the Figure 4. The percent of small-sized grains at the trailing edge is higher than that at the leading edge. The average size of martensite colony width at the leading and trailing edge is about 1.3 and 1.0 μm. This is related to the high temperature gradient due to the thinner wall thickness at the trailing edge. Smaller grains are more prone to generate internal stresses and cause shape changes. The misorientation angle distributions of the blade at the leading and trailing edges are shown in Figures 6A,B, respectively. Both of them mainly involve high-angle grain boundaries (HAGBs, >15°), but the ratio of the high-angle grain boundary at the trailing edge is slightly smaller than the ratio at the leading edge, which indicates that the plasticity at the trailing edge is poorer and it would be more easily to deform. It can be concluded that the deformation and stress at the trailing edge of the blade are larger than those at the leading edge from Figures 3–6.
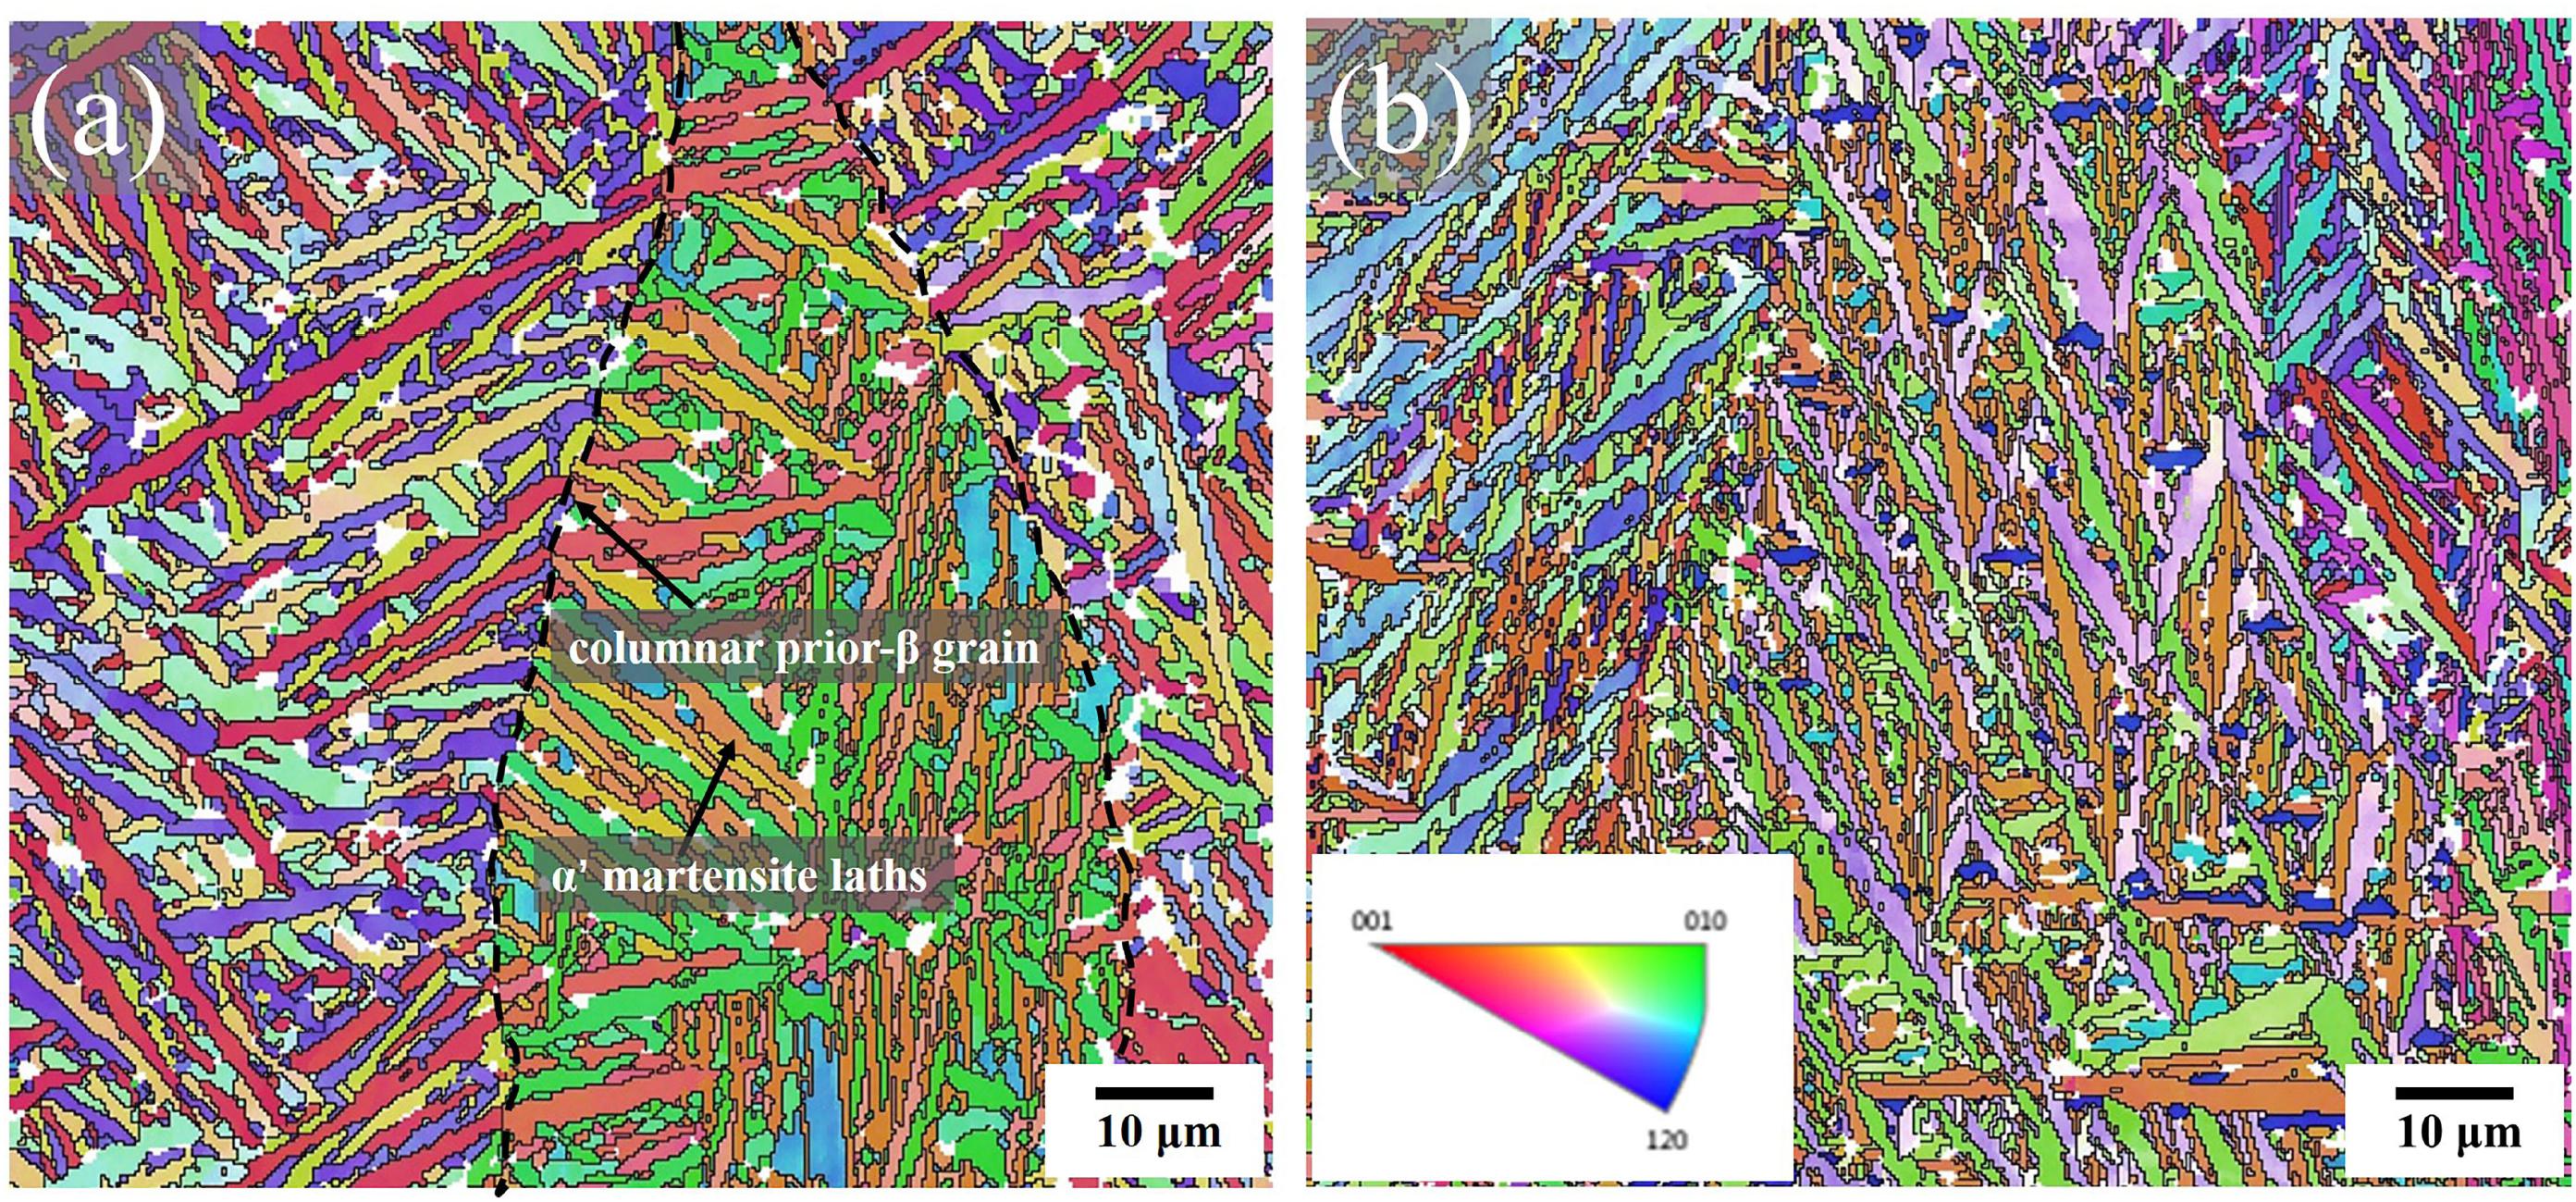
Figure 4. EBSD microscopy of blade, (a) at the leading edge, (b) at the trailing edge.
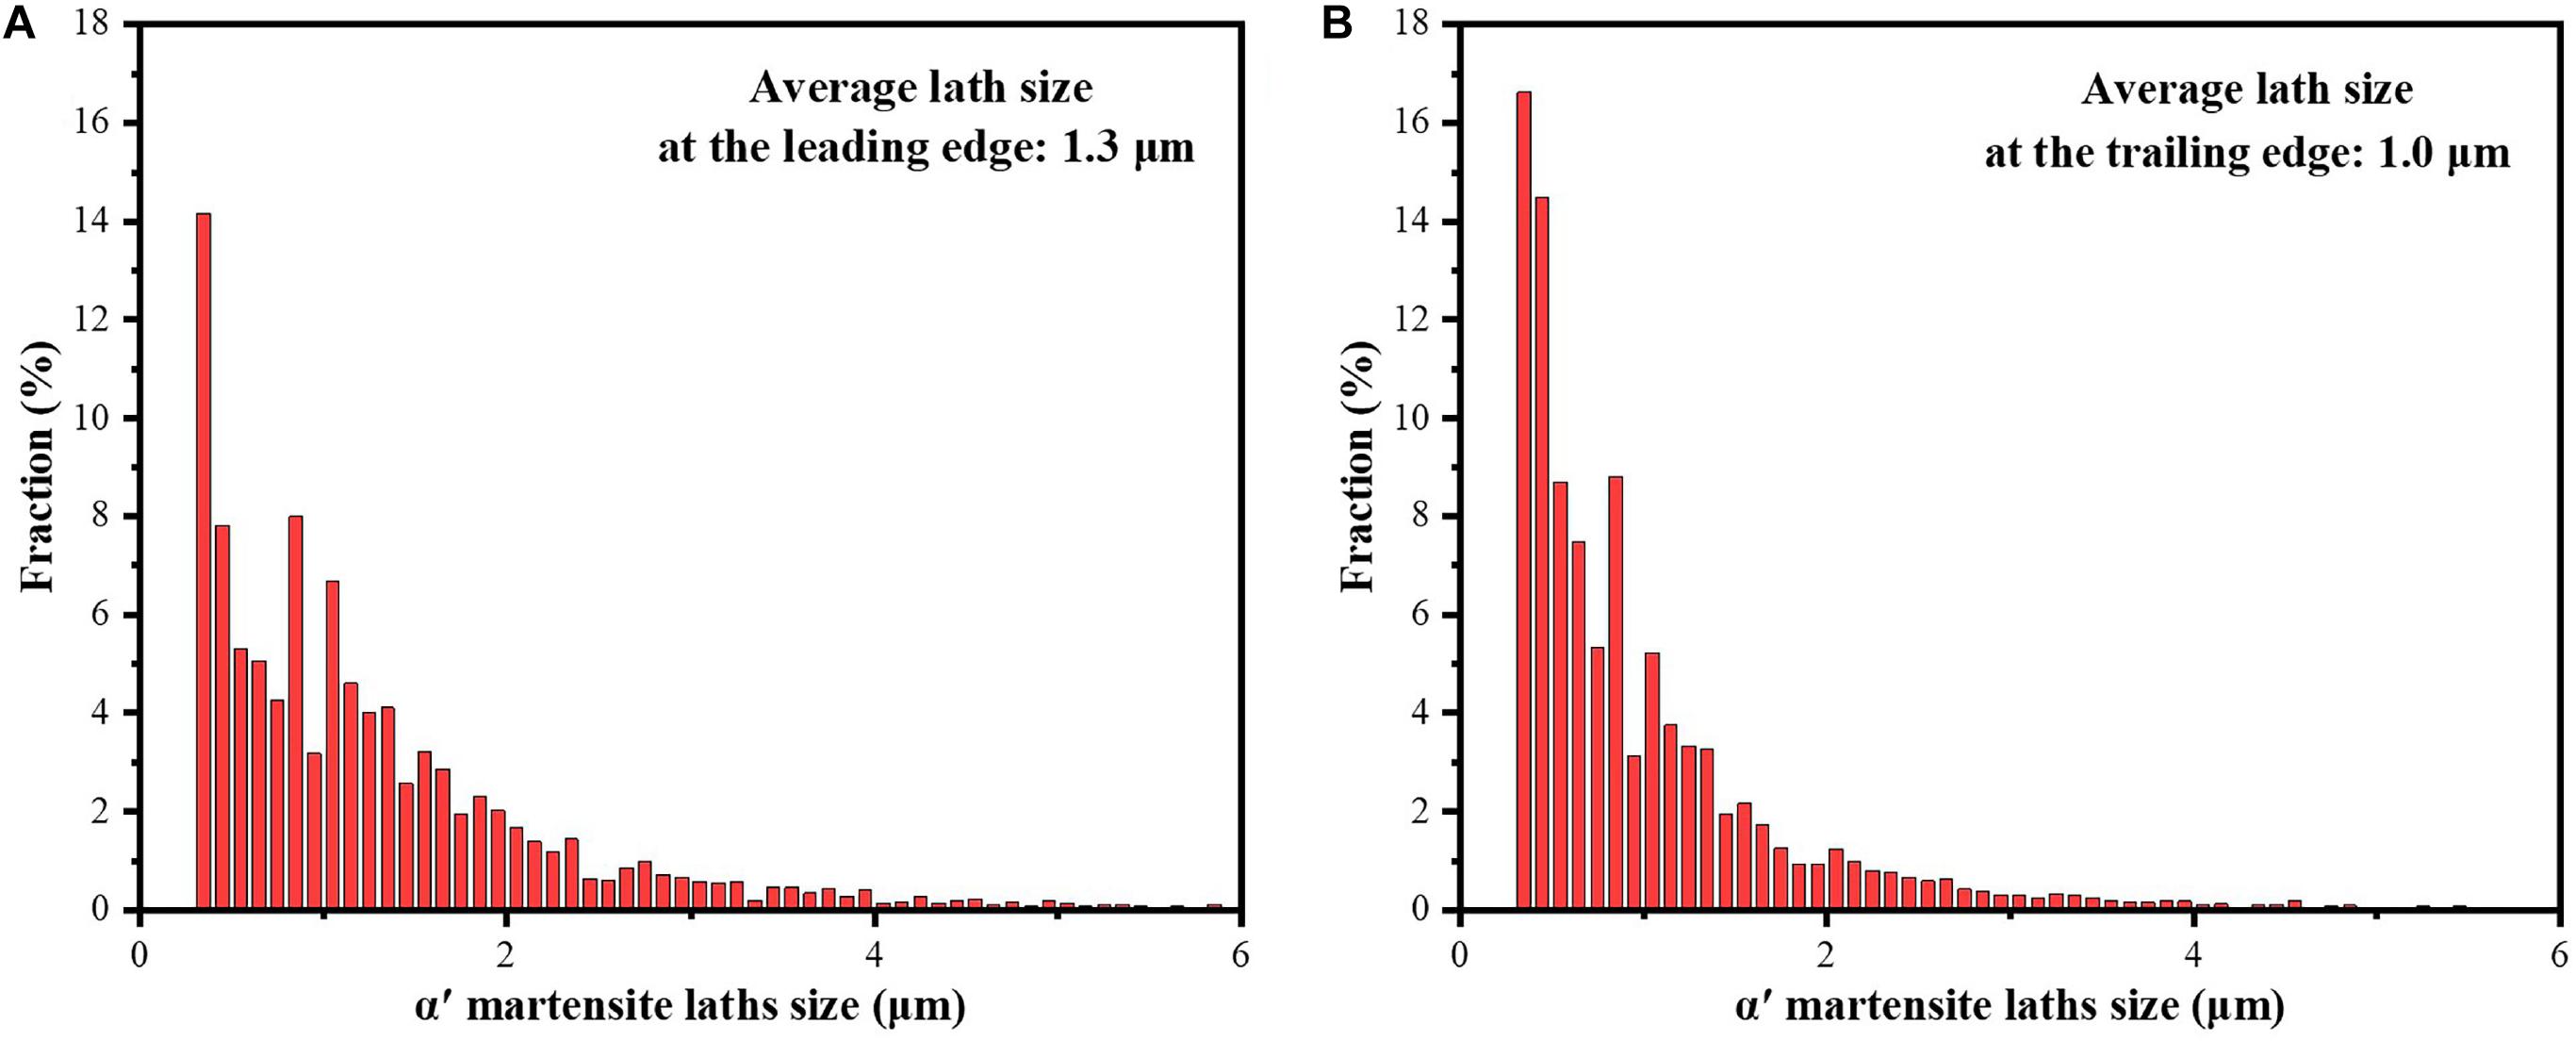
Figure 5. The size of α′ martensite laths, (A) at the leading edge, (B) at the trailing edge.
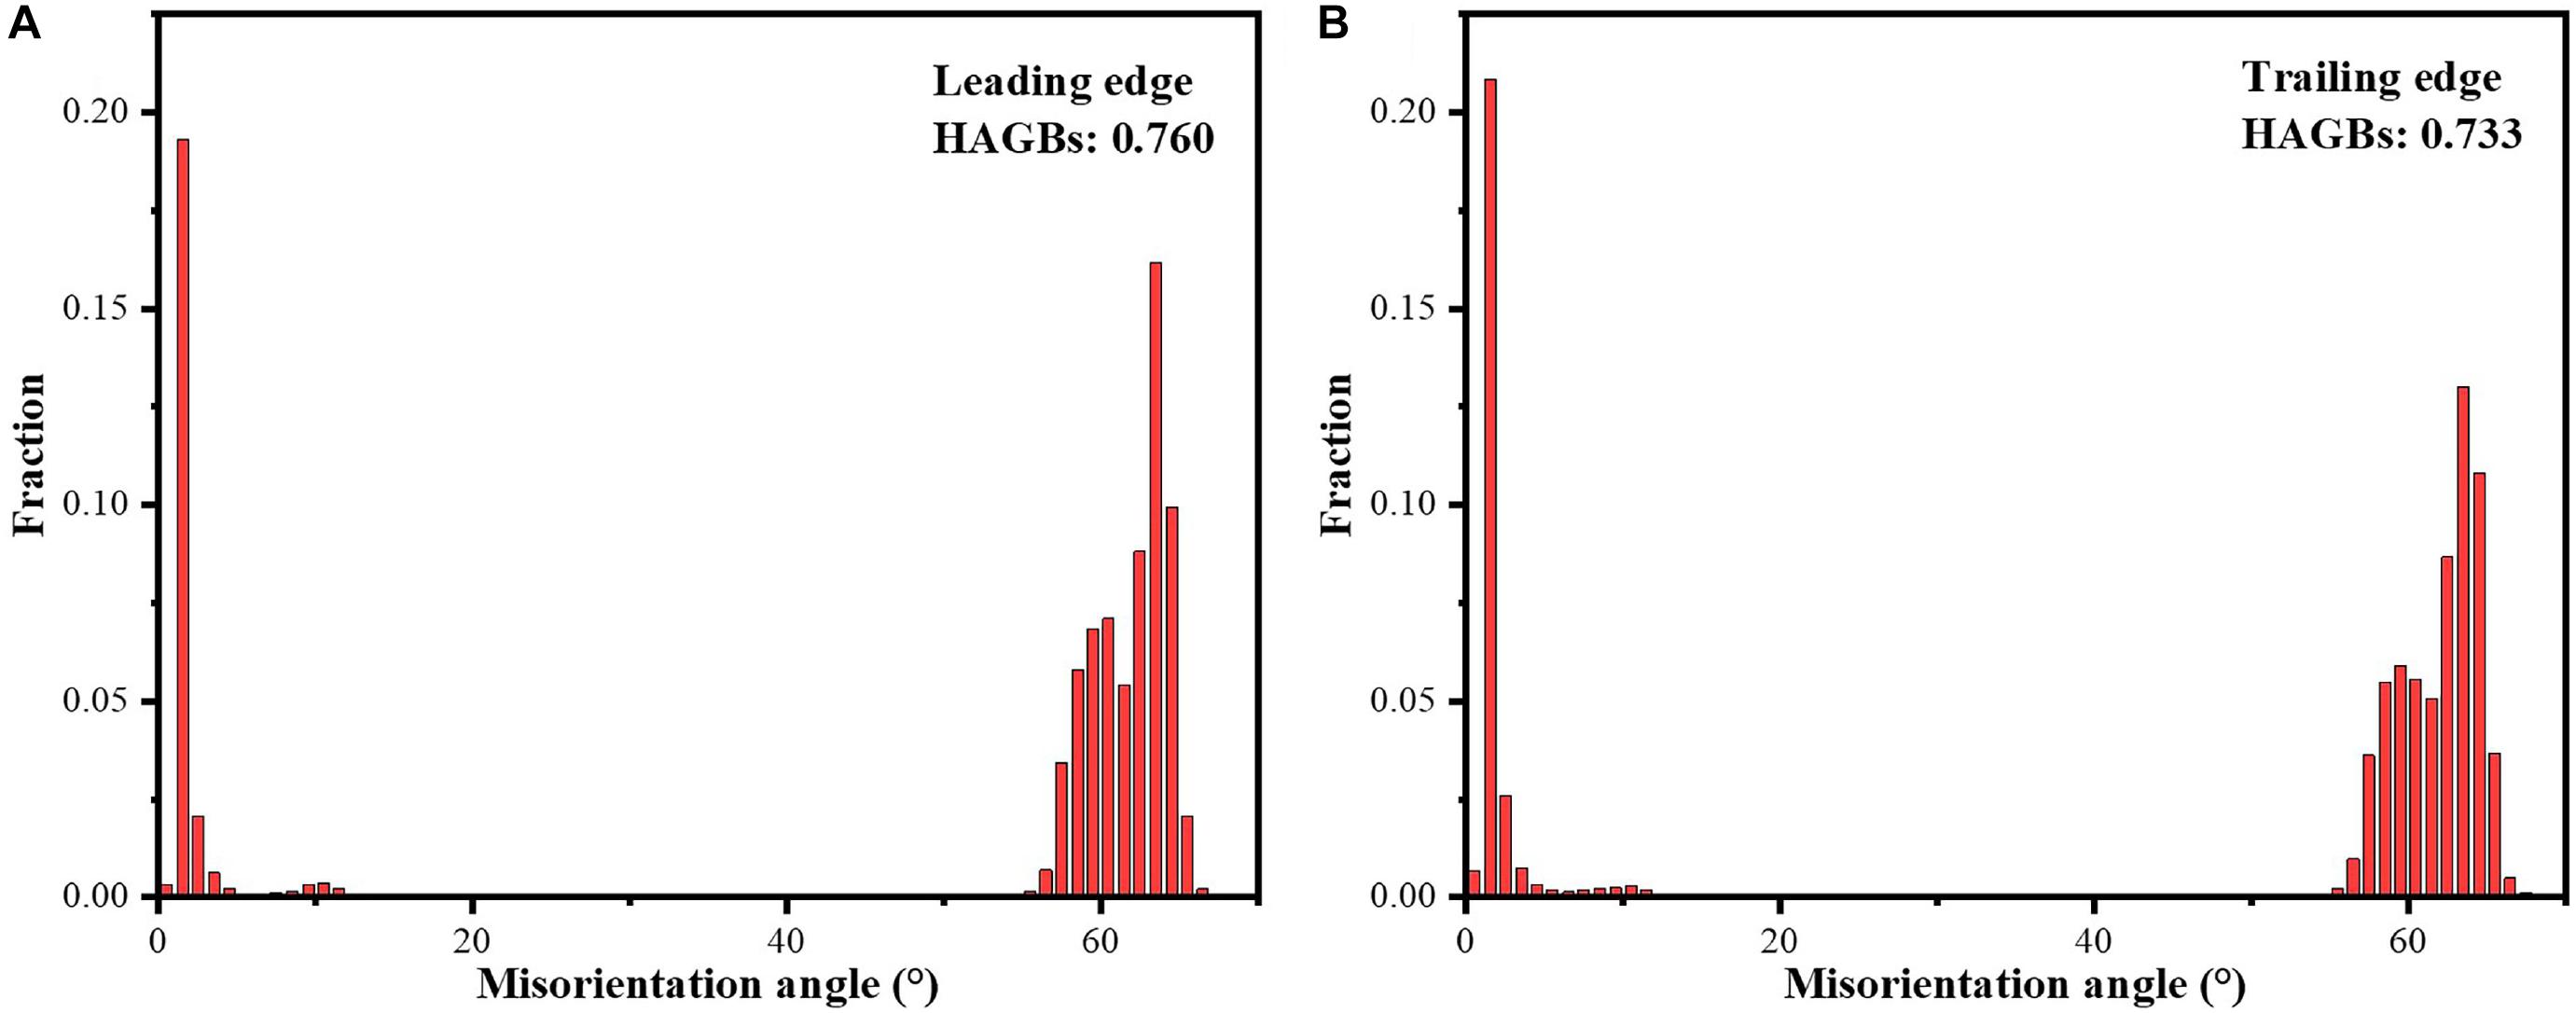
Figure 6. Misorientation number of the blade, (A) at the leading edge, (B) at the trailing edge.
Dimensional Deviation
The dimensional deviation of the blade at the pressure surface and suction surface are shown in Figure 7. The chromatogram on the right side of Figure 7 indicates the magnitude of the dimensional deviation, where yellow and red represent positive deviation, and blue represents negative deviation. The darker the color, the larger the deviation value, and the lightest green color indicates that the deviation value is close to zero. The large area of light blue at the tenon is observed in Figure 7, which indicates that the deformation of the tenon is inward and small. Figures 7a,b illustrate the dimensional deviation of the blade at the pressure surface and the suction surface, respectively. The positive and negative deviation at pressure surface are opposite those at suction surface. The middle part of the pressure surface is mainly positive deviation and the two edges are negative deviation. While, the middle part of the suction surface is mainly negative deviation and the two edges are positive deviation. The overall deformation tendency of the blade is that the thicker portion deformed toward the pressure side and the edges deformed toward the suction side. That indicates that the blade has a tensile stress along the two edges during SLM process.
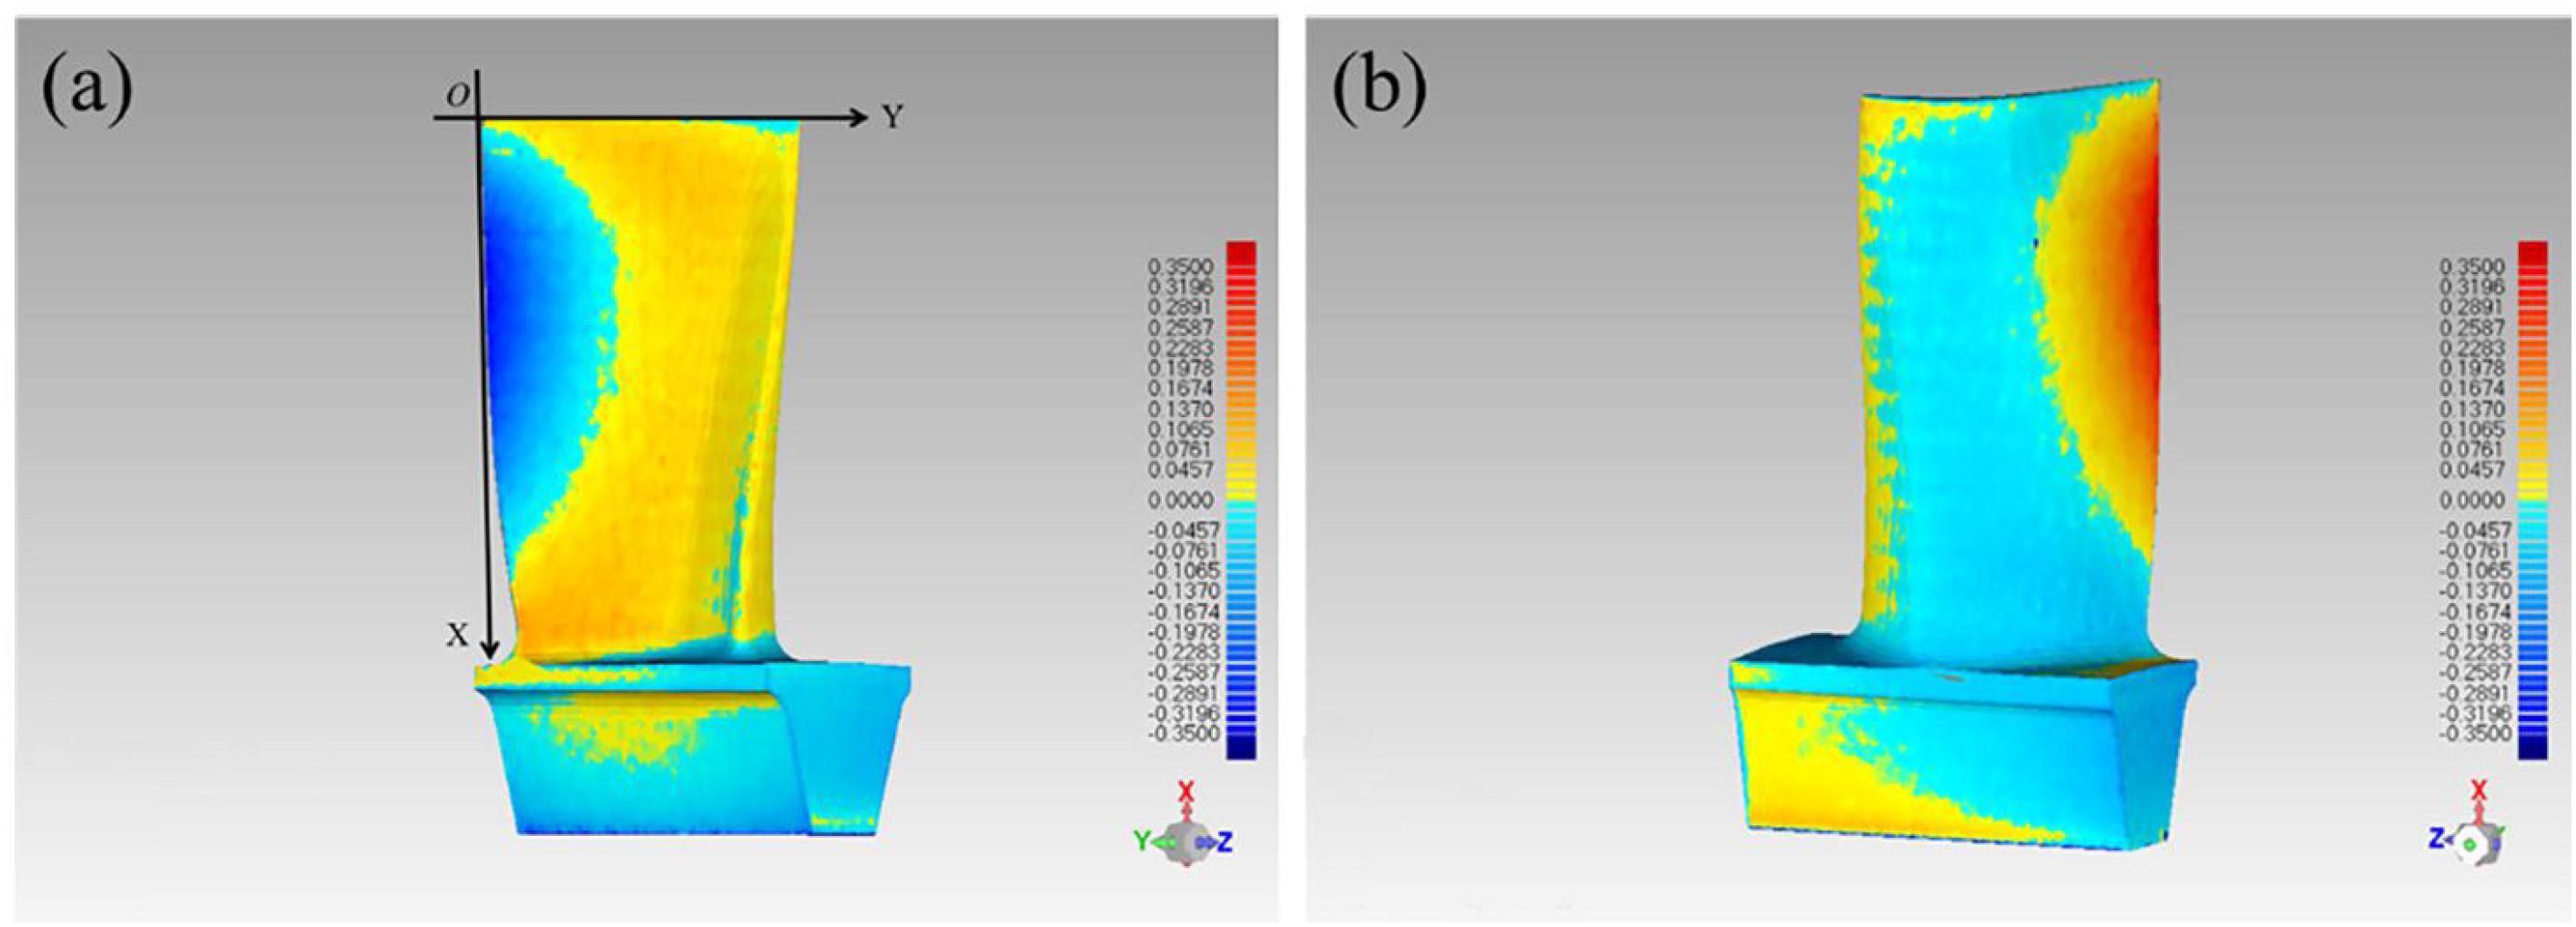
Figure 7. Dimensional deviation of the blade, (a) the pressure surface, (b) the suction surface.
To observe the dimensional deviation distribution of the leading edge, trailing edge, and middle part of the blade, six lines were marked in these three parts of the blade as shown in Figure 8. The line 1, line 2, and line 3 are marked on pressure surface in Figure 8A. The line 4, line 5, and line 6 are marked on suction surface in Figure 8B. The deviation direction of each point on the line taken from the pressure surface (Figure 8A) is exactly opposite to the corresponding part on the suction surface (Figure 8B), but the deviation values are similar. Therefore, the dimensional deviation on the pressure surface are analyzed predominantly. The fluctuation of the dimensional deviation value is small at the leading edge (ranged from −0.06 to 0.04 mm, line 1) in Figure 8A. The dimensional deviation of line 1 is the negative deviation at both ends and the positive deviation is in the middle (Figure 8A). The dimensional deviation of middle part line 2 is positive, which ranged from 0.02 to 0.13 mm. At the trailing edge line 3, the dimensional deviation shows a significant parabolic change with height increasing and the deviation directions of the ends are opposite to the middle. The magnitude of the deviation is between −0.5 to 0.2 mm, mainly negative deviation (Figure 8A, line 3). It can be deduced from the above discussion that the dimensional deviation at the trailing edge of the blade is much bigger than that of the other parts and has a significant parabolic tendency.
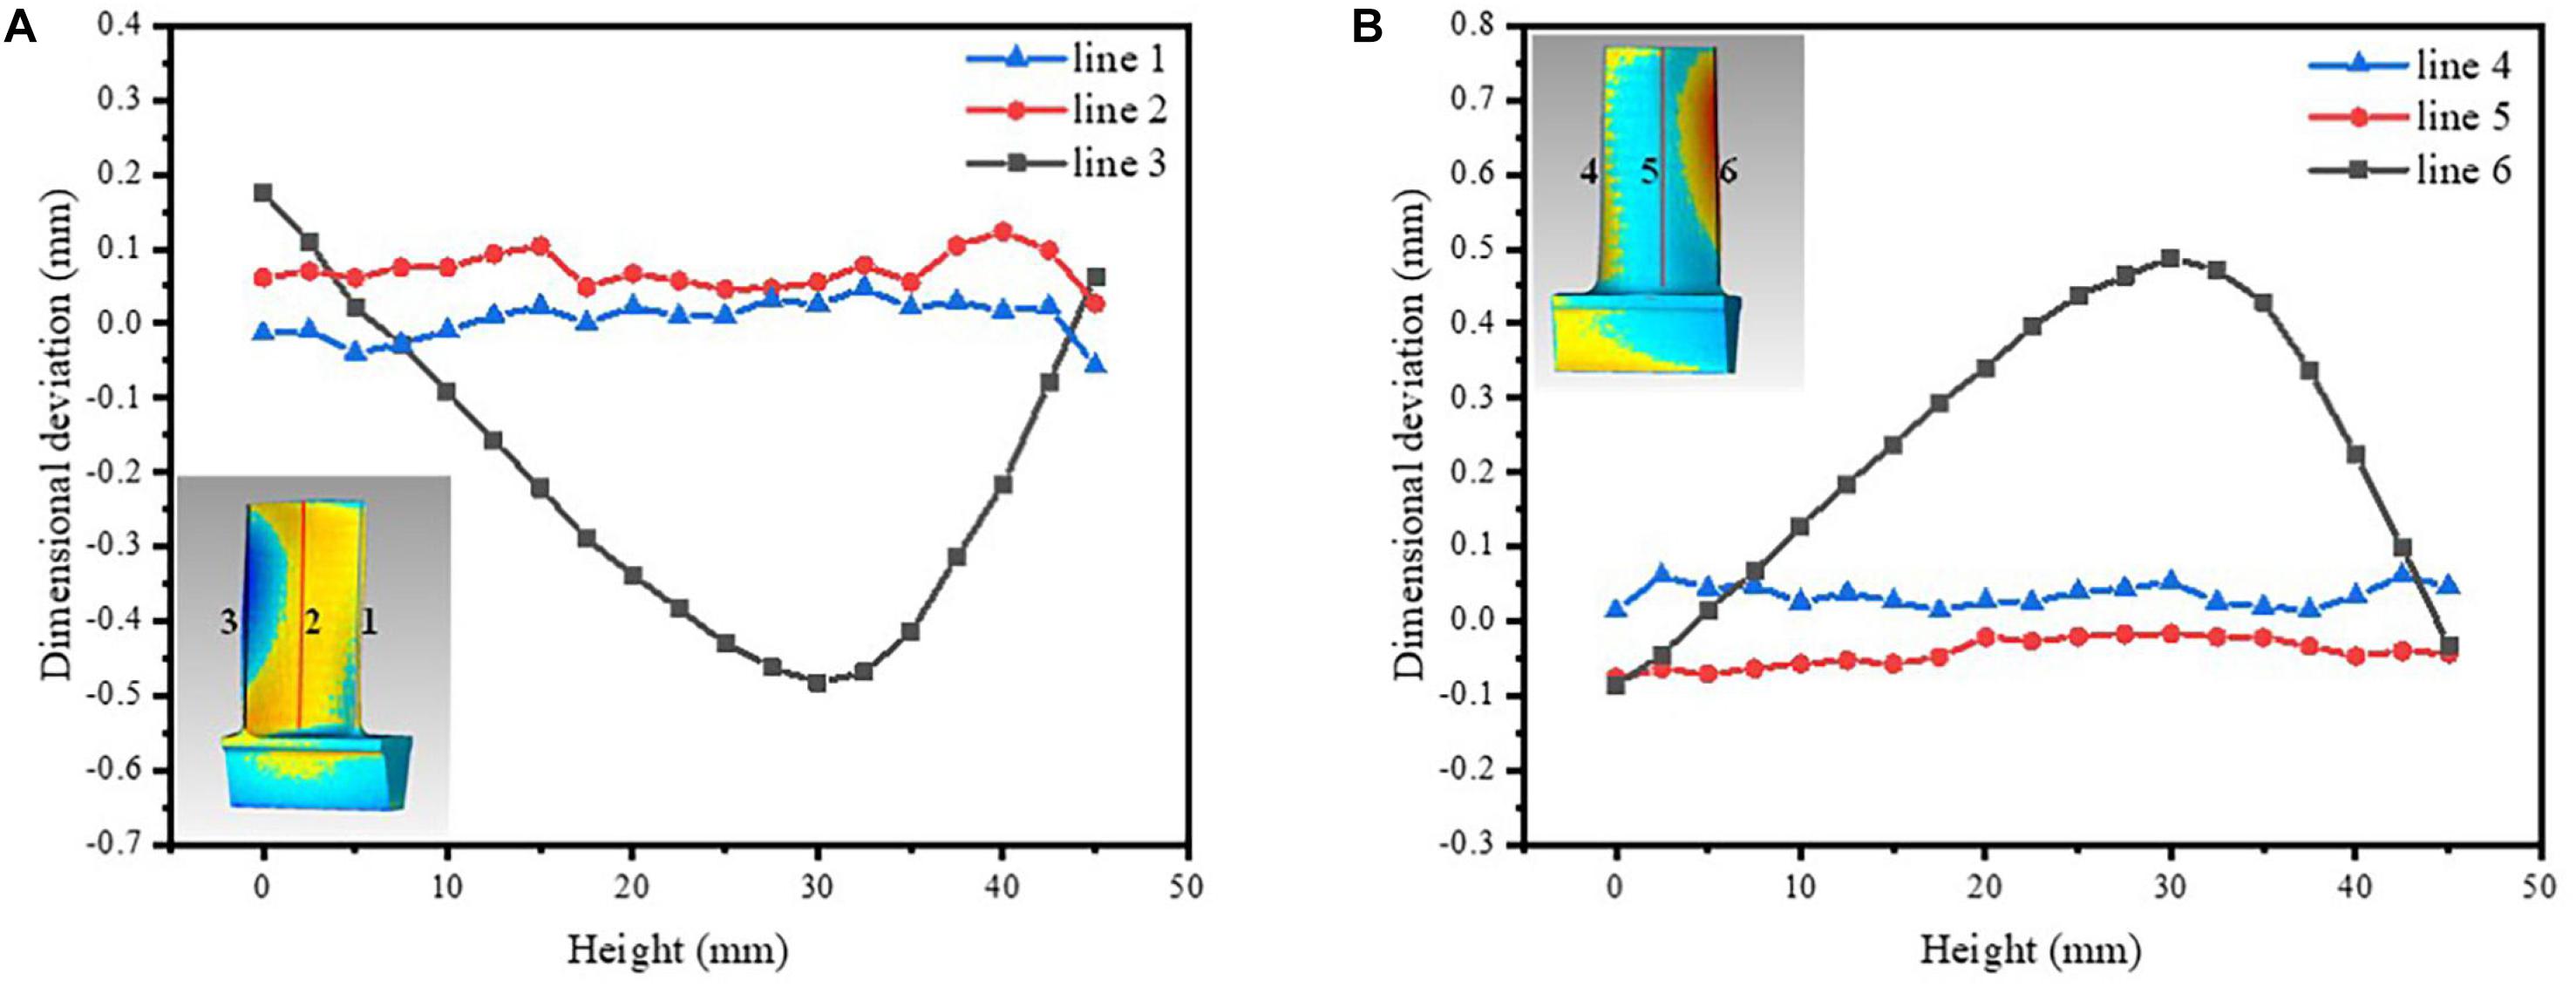
Figure 8. Line charts of the dimensional deviation – the height size of blade, (A) on the pressure surface, (B) on the suction surface.
Therefore, another three lines at the trailing edge of the pressure surface, denoted as line 7, line 8, and line 9, respectively, are taken into consideration as shown in Figure 9. As the line gets closer to the middle part, the curvature of the parabola and the deviation value become smaller and the positive deviation of both ends become larger. The variation of the dimensional deviation presents an interesting parabolic law at the trailing edge of the blade is shown in Figures 7–9. The boundary line between the positive and negative deviation at the trailing edge is similar to a parabola.
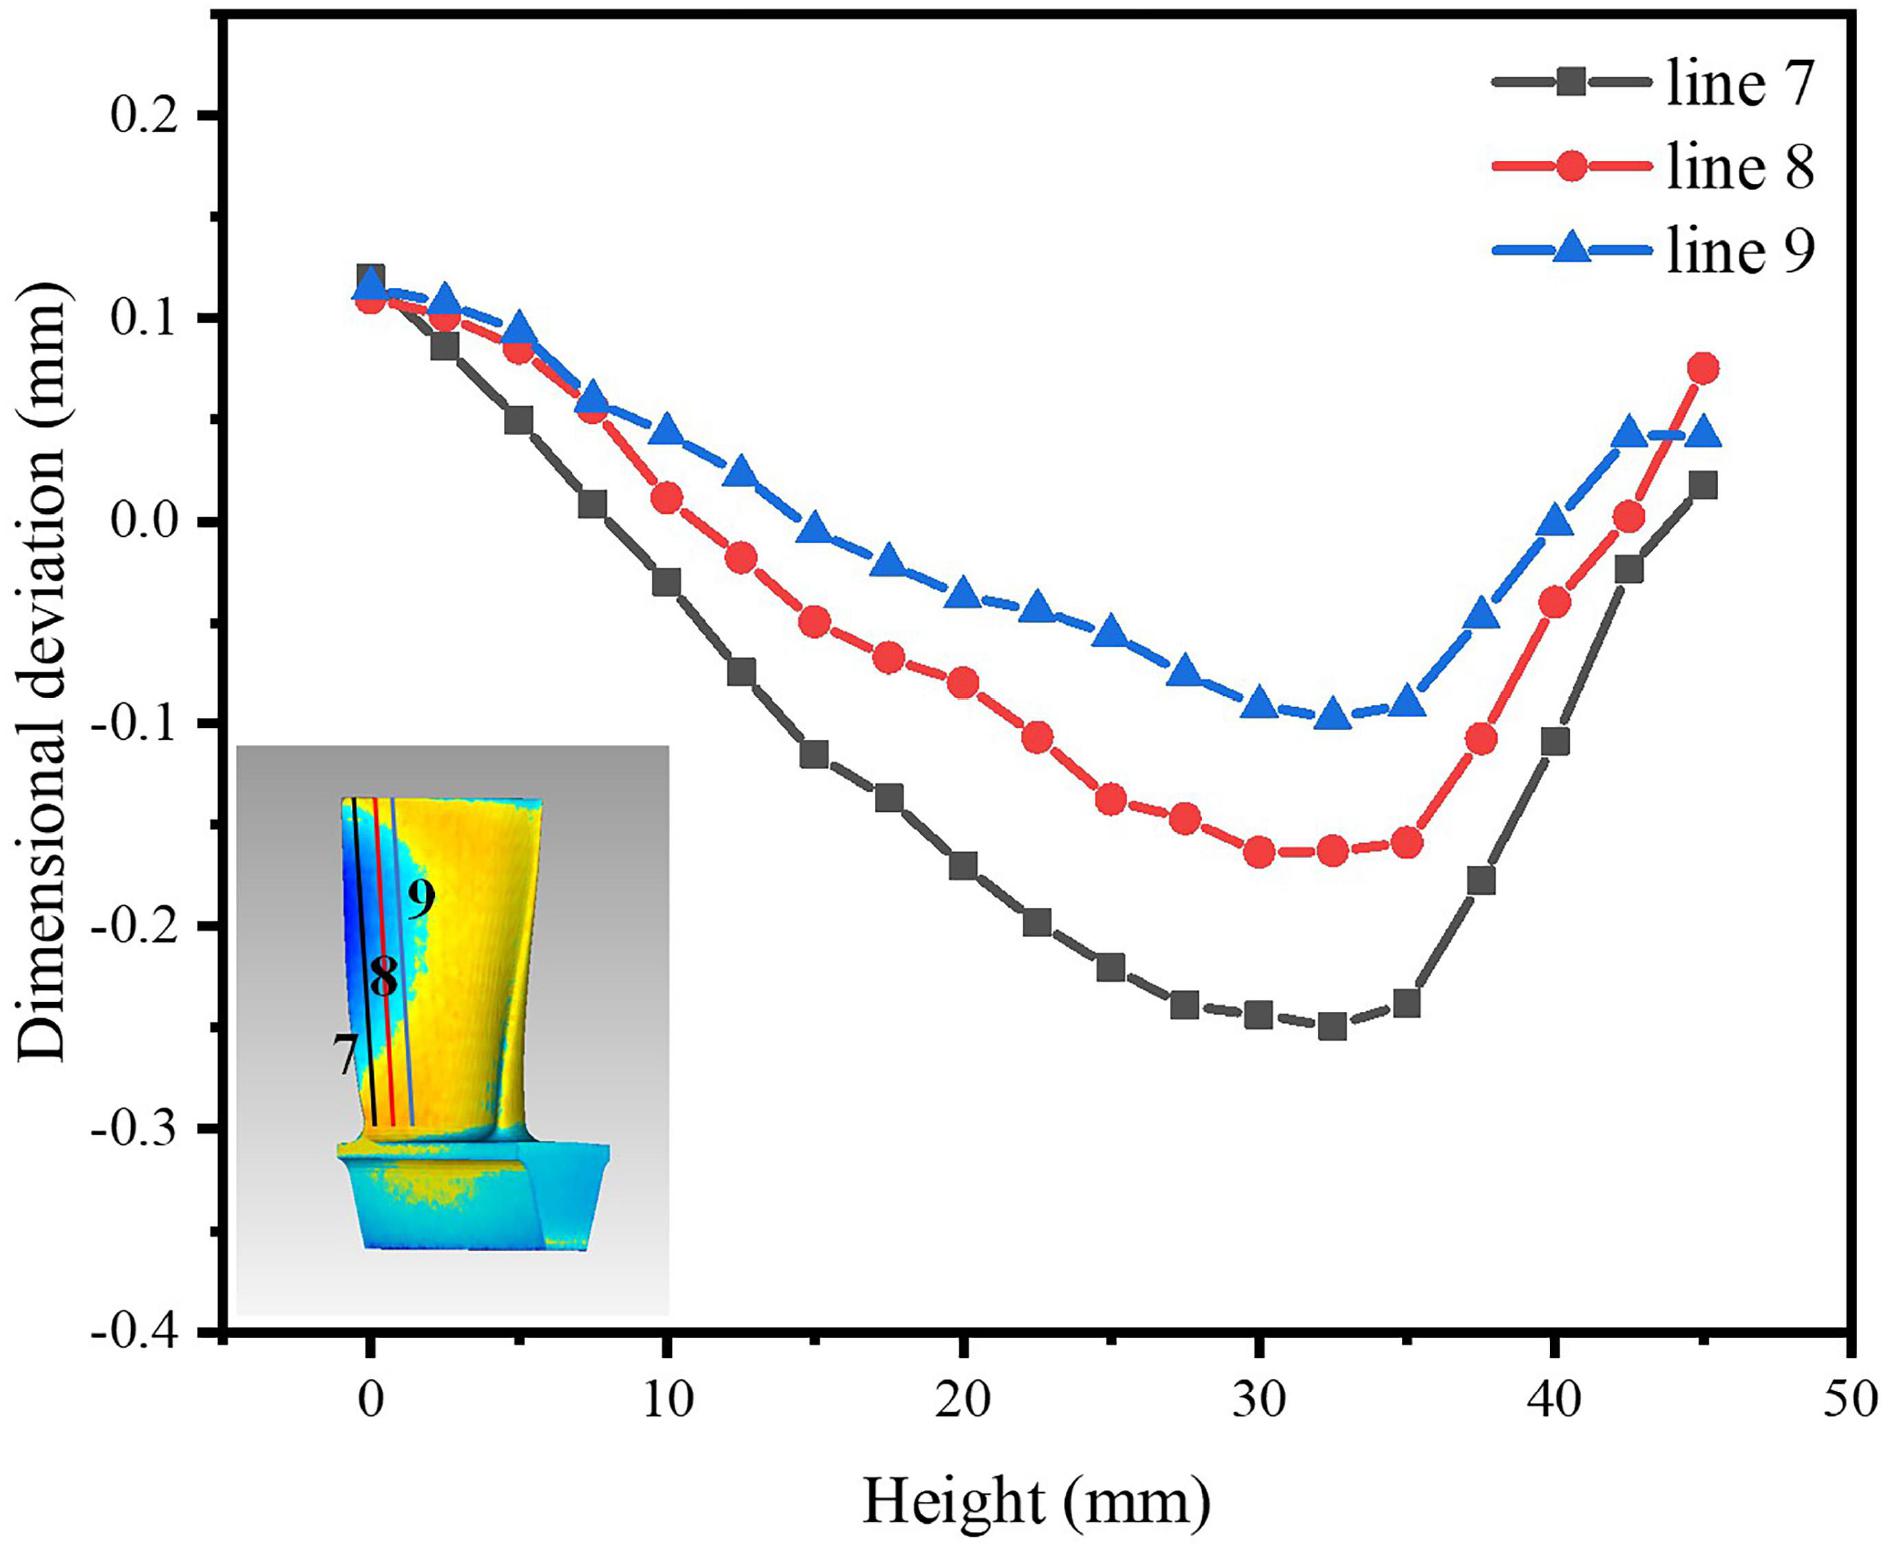
Figure 9. Dimensional deviation at the trailing edge.
The effect of the blade height on the parabolic trend was investigated at the trailing edge, seven blade samples with different heights (27.5, 30, 32.5, 35, 37.5, 40, and 42.5 mm) were produced. The deviation analysis of seven blade samples were obtained by three-dimensional scanning with a blue-ray projector. The parabolic law was observed at the trailing edge of all of the blade samples, as shown in Figure 10. A Cartesian coordinate system was created to fit the parabolas of the pressure surfaces of all blades to obtain quadratic equation in the following form:
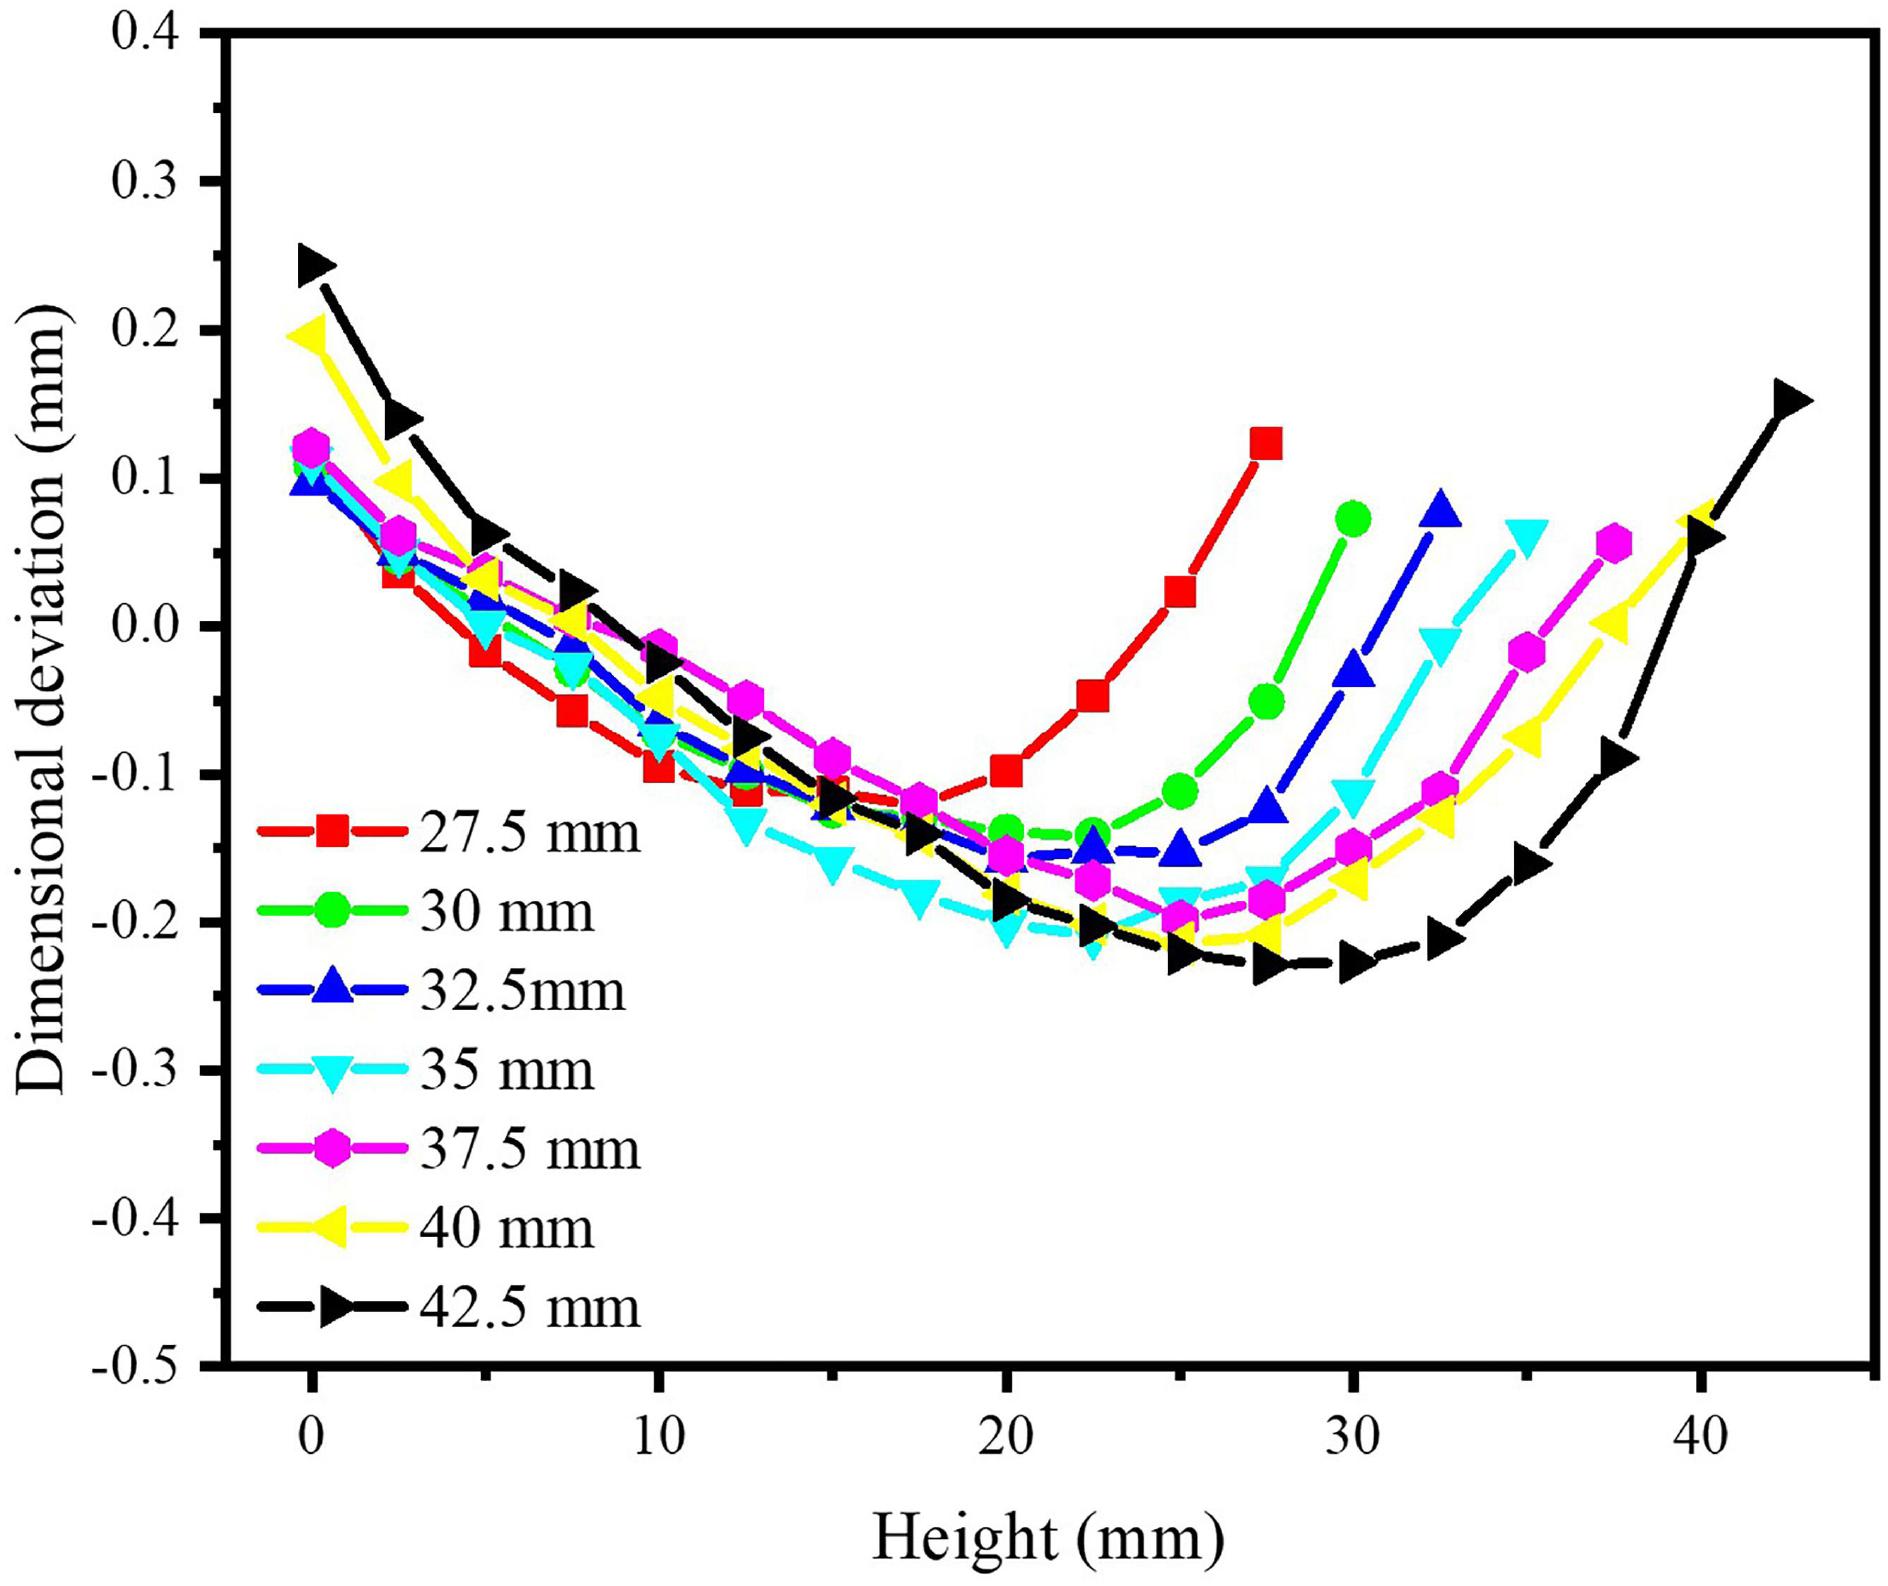
Figure 10. Dimensional deviation analysis at the trailing edge of seven blades samples (27.5, 30, 32.5, 35, 37.5, 40, and 42.5 mm).
After fitting the parabola of all the blade body samples, the results show that as the height of the blade body increases from 22.5 to 42.5 mm, the a value decreases from 0.07 to 0.03, the b value increases from 12 to 20, and the c value fluctuates within the range of 10–14, which indicates that as the height of the blade increases, the range of the negative deviation at the trailing edge increases in the height direction. No significant change can be observed in the lateral direction.
Because the surface roughness of the blade is small (about 6 μm), the influence of the surface roughness on the dimensional deviation is very small. So, the surface roughness is not discussed.
Stress Analysis
In the process of SLM, not only elastic deformation but also plastic deformation will occur in the molten pool and thermal stress will occur when the molten pool is cooled and solidified. A molten pool is a stress-free zone under the laser beam. Heat affected zones is suppressed by the surrounding cooler material. Therefore, compressive stress-strain generated in heat affected zones. Correspondingly, after the laser beam leaves, the temperature decreases rapidly in molten pool. There is tensile stress in molten pools. There is compressive stress in heat affected zones and cooler material zones. If the stress exceeds the material’s yield stress (σ yield), the strain will be partly elastic (εe), and partly plastic (εp).
According to the above discussion, the transient stress field of SLM process can be regarded as a thermal elasto-plastic problem of the molten zone. It is assumed that the volume of material is invariance during plastic deformation; the deformation of the material follows the von Mises yield criterion; the isotropic strengthening criterion and the Prandtl-Reuss plastic flow criterion are followed in the plastic deformation zone; in small time increments, the thermal stress-strain and thermodynamic properties change linearly with temperature. The elastic relation of the stress increment and strain increment is given as (Yilbas and Arif, 2001; Li et al., 2017a):
where [D] is elastic-plastic matrix, dε is the total strain increment, and [C] is a temperature dependent vector. In plastic deformation, the total strain increment is given as (Yilbas and Arif, 2001; Hussein et al., 2013):
where dεe is elastic strain increment, dεT is the plastic strain increment, and dεp is the thermal strain increment. In the plastic zone, the yield function is expressed as (Dai and Shaw, 2004):
where f0 is a function of yield stress related to plastic strain and temperature. According the von Mises yield criterion, the equivalent stress is:
where σ1, σ2, and σ3 are the main stresses (Li et al., 2018). When the equivalent stress σequ is greater than or equal to σs (yield strength), the material enters a plastic deformation state. The flow criterion describes the direction in which plastic strain develops when the material enters the yield state. The plastic strain increment has the following relationship with the stress state (Patil and Yadava, 2007):
with λ being the hardening parameter. The total strain increment dε is determined by the displacement increment {dδ} = [du dv dw]T using the following relation (Hussein et al., 2013):
where [B] is the matrix relating the displacement and strain; {dδ} is derived by Jun and Korsunsky (2010):
where [K] is the stiffness matrix and {dF} is the load vector. The thermal strain increment {dεT} is expressed as (Hussein et al., 2013):
where A is the thermal expansion coefficient matrix.
According to the above thermal elasto-plastic theoretical formulas, the thermal stress of the blade was calculated during the SLM process. Using ANSYS Additive software to simulate the stress field during SLM process and the thermal stress distribution diagrams of blade are shown in Figure 11. The equivalent stress distribution of the blade is shown in Figure 11a. The blade tenon is connected to the substrate, and the fixed substrate has a great constraint on the tenon, which caused a large von Mises stress at the tenon (Figure 11a). The tenon has a large restraint on the thin-walled blade body, which caused great stress at the joint between the blade body and the tenon (Figure 11a). The deformation is limited by stresses at the tenon and between blade body and tenon during the SLM process. So, the dimensional deviations of the tenon and the lower end of the blade body are small. The stresses on edges of the blade are much larger than that at the middle (Figure 11a). After the laser sweeps to the edge, the temperature of edge is no longer affected by the high temperature of adjacent molten pool, resulting in a temperature gradient greater than that of other. In addition, the stress at the trailing edge is larger than that at the leading edge can be observed in Figure 11a, which is related to the thinner wall at the trailing edge. When the laser heating a new layer of powder, material below a new layer of powder is heat treated, part of the stress is eliminated. The X-component of stress along the scanning direction is shown in Figure 11b. The Y-component of stress orthogonal to the scanning direction is shown in Figure 11c. The Z-component of stress along the building direction is shown in Figure 11d. Because of the large tensile stress along the edges of the blade body, the edges deform toward the suction side. The deviation at the leading edge is smaller than that at the trailing edge due to the thicker wall and the greater restriction of the surrounding material.
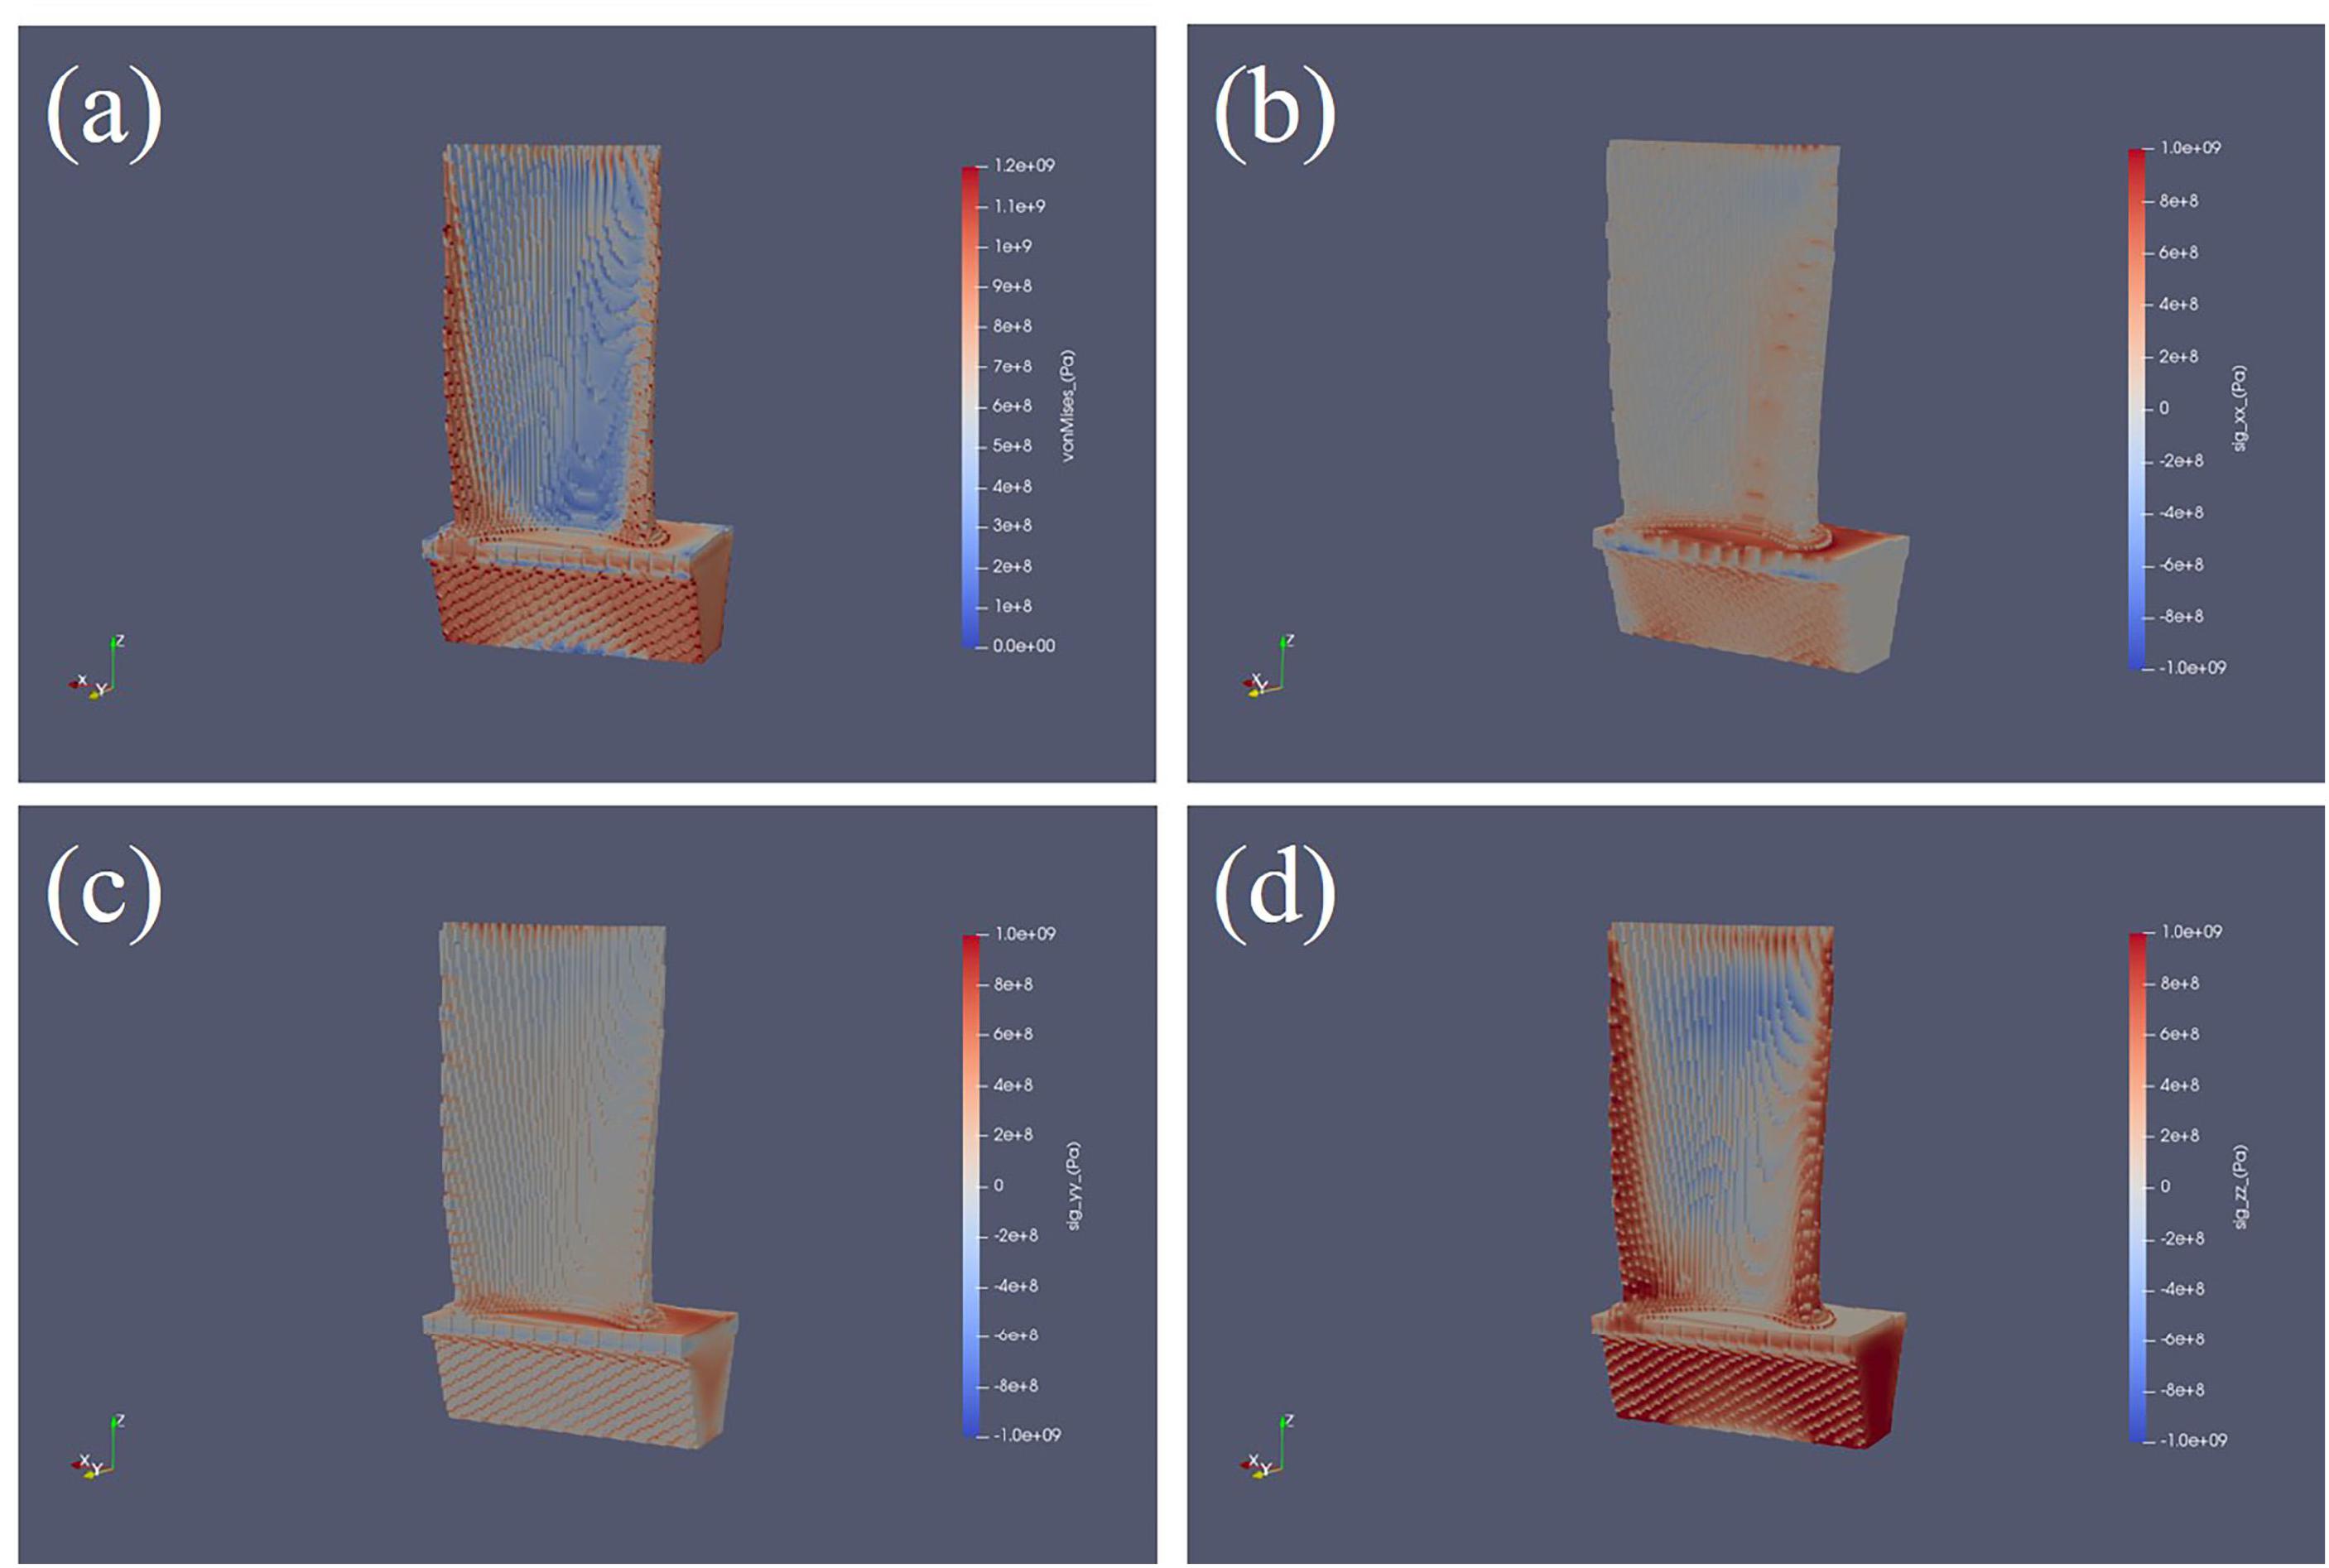
Figure 11. Thermal stress distribution diagrams. (a) Equivalent stress distribution. (b) X-component of stress along the scanning direction. (c) Y-component of stress orthogonal to the scanning. (d) Z-component of stress along the building direction.
Residual Stress
The surface residual stress was measured by XRD at several points on the edges of the pressure surface of the blade body. As shown in Figure 12, six points and four points were selected at the trailing edge and leading edge, respectively. Obviously, the residual stresses are mainly tensile stress at the edges of blade. The stresses in the longitudinal direction (along the building direction) are larger than those in the transverse direction. From Figure 12A, the maximum residual stress is located in the joint of the leading edge and the tenon, which is in agreement with the simulation of the thermal stress. Nearly all the stress is released at the top of the blade when it is cut off from built platform. The residual stress at the top of the blade is minimal because it formed during SLM process without any constraint. Figure 12B shows compressive stresses in the transverse direction at the leading edge. But the residual stress at the top of the blade is also tensile stress, which is consistent with the distribution of thermal stress by the simulation in Figure 12. The surface residual stress of the blade is tensile stress at the edge and compressive stress inside the blade body, respectively.
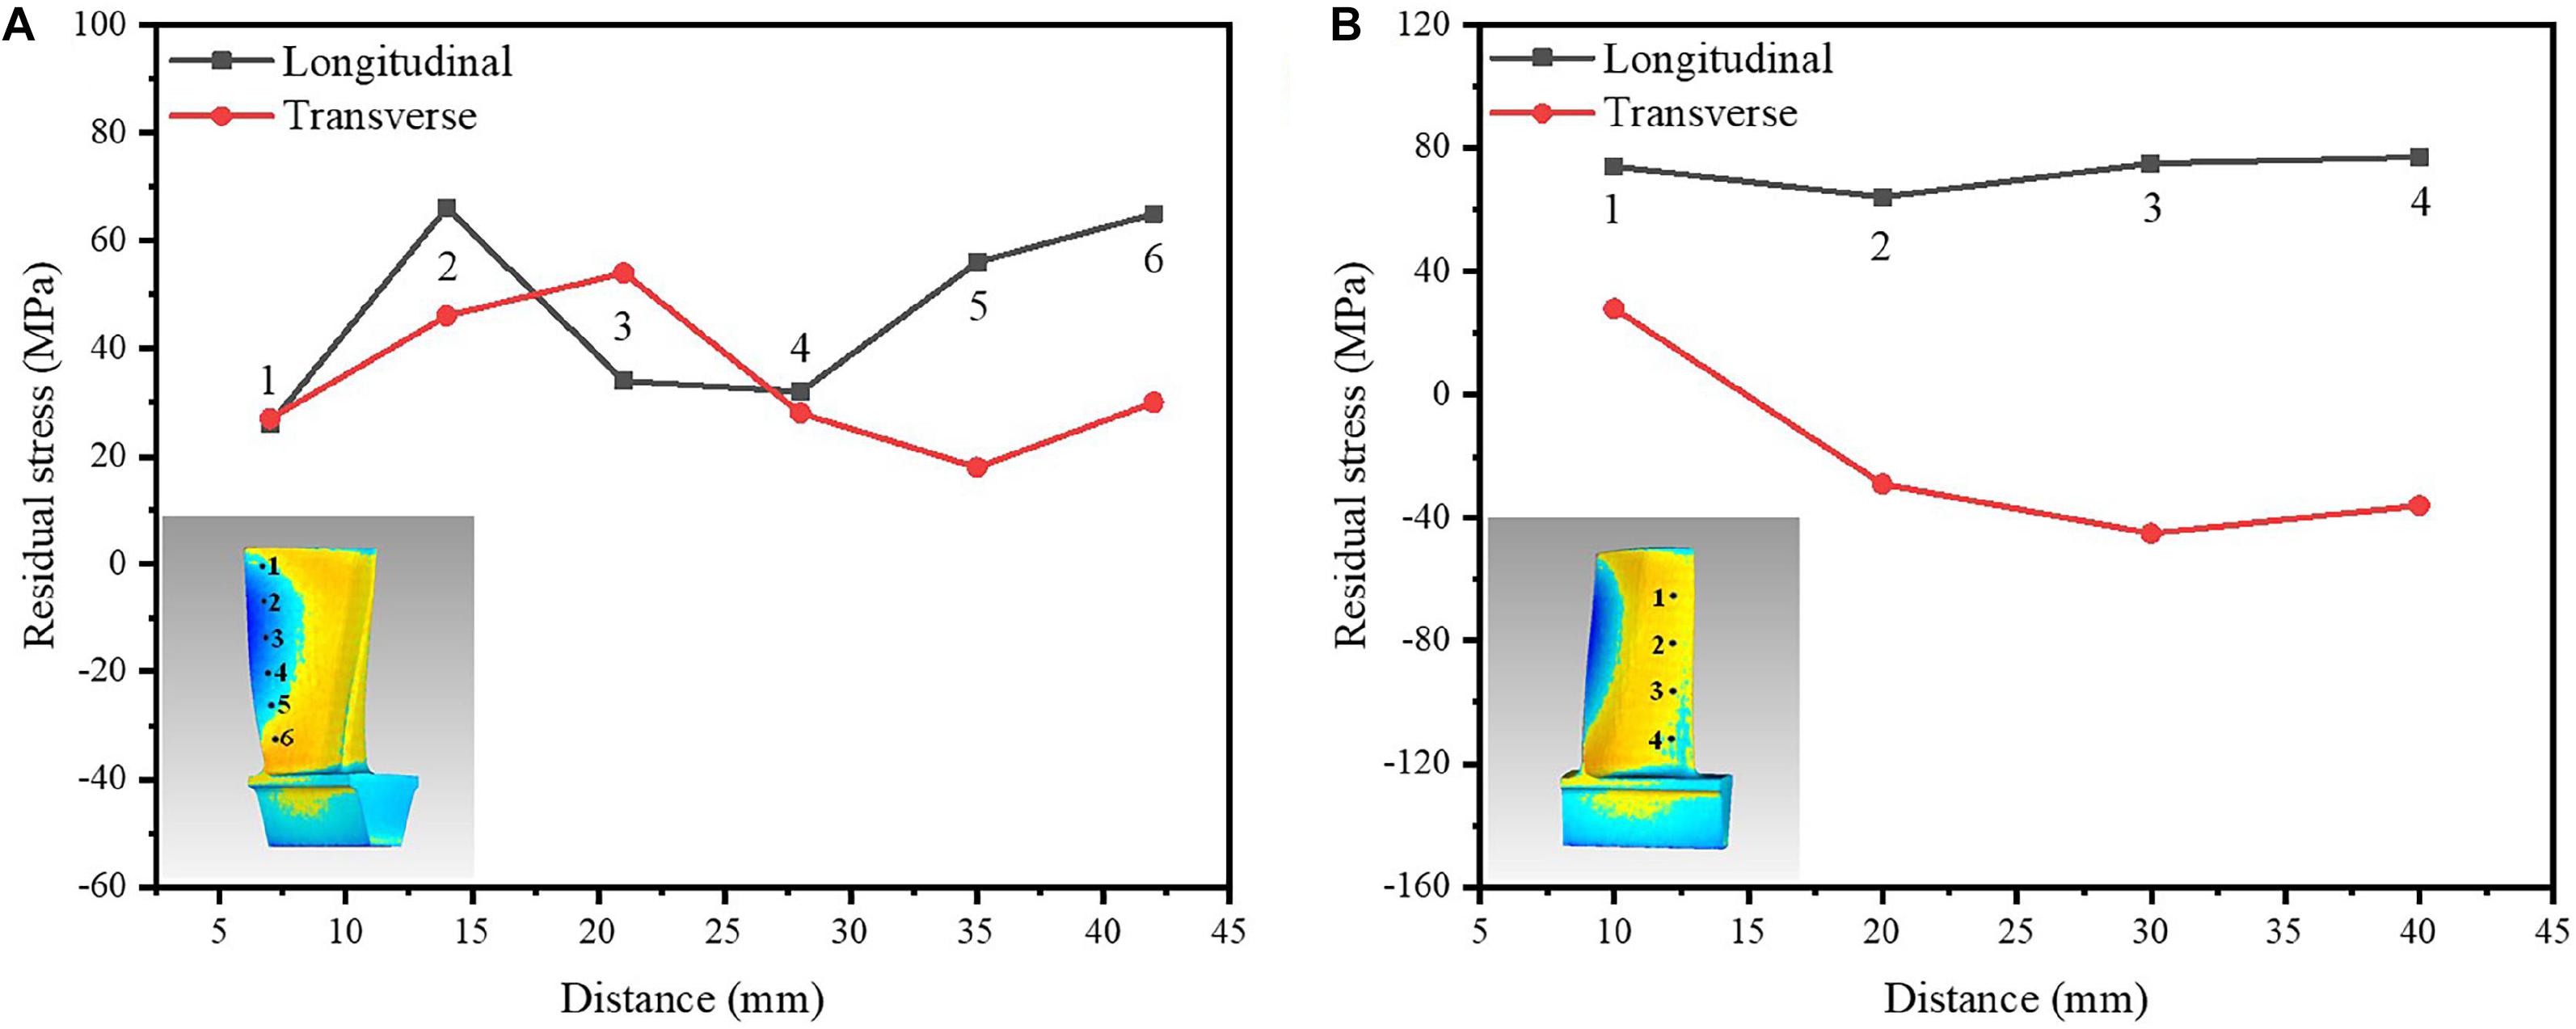
Figure 12. Residual stress of the blade, (A) the trailing edge, (B) the leading edge.
Conclusion
In this study, the dimensional deviation, thermal stress and residual stress generated in SLM process of Ti6Al4V blade have been investigated, and the following conclusions can be listed.
(1) Only the α′ martensite phase was detected in SLM treated Ti6Al4V blade. The grain size at the trailing edge are finer than those at the leading edge, and the ratio of the high-angle grain boundary at the trailing edge is smaller than that at the leading edge.
(2) Both edges of the blade body are deformed to the suction side and the largest deformation is at the trailing edge. The deviation directions of the two ends at the trailing edge are opposite to that of the middle part, and the boundary between the positive and the negative deviation exhibits a parabolic law. The higher the height of the blade body, the larger the negative deviation range.
(3) The thermal stress of the blade calculated by the thermal elasto-plastic theory are very big at the tenon and the joint between the blade body and the tenon, due to the strong restraint of the surrounding material. The large tensile stress along the edges of the blade body caused the edges to deform toward the suction side of the blade. The residual stress distribution of the pressure surface by the XRD measured has a good agreement with the calculated thermal stress distribution.
Data Availability Statement
The raw data supporting the conclusions of this article will be made available by the authors, without undue reservation, to any qualified researcher.
Author Contributions
ML and JL designed the experiments and wrote the manuscript. ML, JL, DY, and BH carried out the experiments. ML, JL, and DY analyzed the experimental results.
Funding
This work was supported by the National Natural Science Foundation of China (Grant Nos. 51504151 and 51875349) and Shanghai Science and Technology Committee Innovation Grants (17JC1400600 and 17JC1400603).
Conflict of Interest
The authors declare that the research was conducted in the absence of any commercial or financial relationships that could be construed as a potential conflict of interest.
References
Cheng, B., Shrestha, S., and Chou, K. (2016). Stress and deformation evaluations of scanning strategy effect in selective laser melting. Addit. Manuf. 12, 240–251. doi: 10.1016/j.addma.2016.05.007
Cui, C., Hu, B., Zhao, L., and Liu, S. (2011). Titanium alloy production technology, market prospects and industry development. Mater. Des. 32, 1684–1691. doi: 10.1016/j.matdes.2010.09.011
Dai, K., and Shaw, L. (2004). Thermal and mechanical finite element modeling of laser forming from metal and ceramic powders. Acta Mater. 52, 69–80. doi: 10.1016/j.actamat.2003.08.028
Emmelmann, C., Kranz, J., Herzog, D., and Wycisk, E. (2013). “Laser additive manufacturing of metals,” in Laser Technology in Biomimetics, eds V. Schmidt and M. Belegratis, (Heidelberg, FL: Springer), 143–162.
Gnäupel-Herold, T. (2012). A software for diffraction stress factor calculations for textured materials. Powder Diffr. 27, 114–116. doi: 10.1017/s0885715612000267
Greitemeier, D., Palm, F., Syassen, F., and Melz, T. (2017). Fatigue performance of additive manufactured TiAl6V4 using electron and laser beam melting. Int. J. Fatigue. 94, 211–217. doi: 10.1016/j.ijfatigue.2016.05.001
Herzog, D., Seyda, V., Wycisk, E., and Emmelmann, C. (2016). Additive manufacturing of metals. Acta Mater. 117, 371–392.
Hussein, A., Hao, L., Yan, C., and Everson, R. (2013). Finite element simulation of the temperature and stress fields in single layers built without-support in selective laser melting. Mater. Des. 52, 638–647. doi: 10.1016/j.matdes.2013.05.070
Jun, T.-S., and Korsunsky, A. M. (2010). Evaluation of residual stresses and strains using the Eigenstrain Reconstruction Method. Int. J. Solids Struct. 47, 1678–1686. doi: 10.1016/j.ijsolstr.2010.03.002
Kruth, J.-P., Deckers, J., Yasa, E., and Wauthlé, R. (2012). Assessing and comparing influencing factors of residual stresses in selective laser melting using a novel analysis method. P. I. Mech. Eng. B.-J. Eng. 226, 980–991. doi: 10.1177/0954405412437085
Li, C., Liu, J. F., Fang, X. Y., and Guo, Y. B. (2017a). Efficient predictive model of part distortion and residual stress in selective laser melting. Addit. Manuf. 17, 157–168. doi: 10.1016/j.addma.2017.08.014
Li, C., Zhang, X., Chen, Y., Carr, J., Jacques, S., Behnsen, J., et al. (2017b). Understanding the residual stress distribution through the thickness of atmosphere plasma sprayed (APS) thermal barrier coatings (TBCs) by high energy synchrotron XRD; digital image correlation (DIC) and image based modelling. Acta Mater. 132, 1–12. doi: 10.1016/j.dib.2017.06.016
Li, Y., Zhou, K., Tan, P., Tor, S. B., Chua, C. K., and Leong, K. F. (2018). Modeling temperature and residual stress fields in selective laser melting. Int. J. Mech. Sci. 136, 24–35. doi: 10.1016/j.ijmecsci.2017.12.001
Liu, R., Wang, Z., Sparks, T., Liou, F., and Newkirk, J. (2017). “13 - Aerospace applications of laser additive manufacturing,” in Laser Additive Manufacturing, ed. M. Brandt, (Sawston: Woodhead Publishing), 351–371. doi: 10.1016/b978-0-08-100433-3.00013-0
Manvatkar, V., De, A., and DebRoy, T. (2015). Spatial variation of melt pool geometry, peak temperature and solidification parameters during laser assisted additive manufacturing process. Mater. Sci. Tech.Lond 31, 924–930. doi: 10.1179/1743284714y.0000000701
Mercelis, P., and Kruth, J. P. (2006). Residual stresses in selective laser sintering and selective laser melting. Rapid Prototyping J. 12, 254–265. doi: 10.1098/rspa.2018.0295
Mukherjee, T., Zhang, W., and DebRoy, T. (2017). An improved prediction of residual stresses and distortion in additive manufacturing. Comput. Mater. Sci. 126, 360–372. doi: 10.1016/j.commatsci.2016.10.003
Patil, R. B., and Yadava, V. (2007). Finite element analysis of temperature distribution in single metallic powder layer during metal laser sintering. Int. J. Mach. Tool. Manu. 47, 1069–1080. doi: 10.1016/j.ijmachtools.2006.09.025
Rossini, N. S., Dassisti, M., Benyounis, K. Y., and Olabi, A. G. (2012). Methods of measuring residual stresses in components. Mater. Des. 35, 572–588. doi: 10.1016/j.matdes.2011.08.022
Seabra, M., Azevedo, J., Araújo, A., Reis, L., Pinto, E., Alves, N., et al. (2016). Selective laser melting (SLM) and topology optimization for lighter aerospace componentes. Procedia Struct. Integr.ity 1, 289–296. doi: 10.1016/j.prostr.2016.02.039
Shuhui, H., Yingying, Z., and Debin, S. (2013). Application of thermohydrogen processing to Ti6Al4V alloy blade isothermal forging. Mater. Sci. Eng. A 561, 17–25. doi: 10.1016/j.msea.2012.10.056
Tian, Y. S., Zhang, Q. Y., Wang, D. Y., and Chen, C. Z. (2008). Analysis of the growth morphology of TiB and the microstructure refinement of the coatings fabricated on Ti-6Al-4V by laser boronizing. Cryst. Growth Des. 8, 700–703. doi: 10.1021/cg0608099
Uhlmann, E., Kersting, R., Klein, T. B., Cruz, M. F., and Borille, A. V. (2015). Additive manufacturing of titanium alloy for aircraft components. Procedia CIRP 35, 55–60. doi: 10.1155/2019/2903920
Vasinonta, A., Beuth, J. L., and Griffith, M. (2006). Process maps for predicting residual stress and melt pool size in the laser-based fabrication of thin-walled structures. J. Manuf. Sci. E-T ASME. 129, 101–109. doi: 10.1115/1.2335852
Vora, P., Mumtaz, K., Todd, I., and Hopkinson, N. (2015). AlSi12 in-situ alloy formation and residual stress reduction using anchorless selective laser melting. Addit. Manuf. 7, 12–19. doi: 10.1016/j.addma.2015.06.003
Xu, X., Lu, Y., Li, S., Guo, S., He, M., Luo, K., et al. (2018). Copper-modified Ti6Al4V alloy fabricated by selective laser melting with pro-angiogenic and anti-inflammatory properties for potential guided bone regeneration applications. Mater. Sci. Eng. C 90, 198–210. doi: 10.1016/j.msec.2018.04.046
Yadroitsev, I., Krakhmalev, P., and Yadroitsava, I. (2014). Selective laser melting of Ti6Al4V alloy for biomedical applications: temperature monitoring and microstructural evolution. J. Alloys Compd. 583, 404–409. doi: 10.1016/j.jallcom.2013.08.183
Yilbas, B. S., and Arif, A. F. M. (2001). Material response to thermal loading due to short pulse laser heating. Int. J. Heat Mass Transfer 44, 3787–3798. doi: 10.1016/s0017-9310(01)00026-6
Zhang, L., and Attar, H. (2016). Selective laser melting of titanium alloys and titanium matrix composites for biomedical applications: a review. Adv. Eng. Mater. 18, 463–475. doi: 10.1002/adem.201500419
Zhang, L., and Chen, L. (2019). A review on biomedical titanium alloys: recent progress and prospect. Adv. Eng. Mater. 21:1801215. doi: 10.1002/adem.201801215
Zhang, L., Liu, Y., Li, S., and Hao, Y. (2018a). Additive manufacturing of titanium alloys by electron beam melting: a review. Adv. Eng. Mater. 20, 1700842. doi: 10.5301/jabfm.5000371
Zhang, L., Zhang, S., Zhu, H., Hu, Z., Wang, G., and Zeng, X. (2018b). Horizontal dimensional accuracy prediction of selective laser melting. Mater. Des. 160, 9–20. doi: 10.1016/j.matdes.2018.08.059
Keywords: selective laser melting, microstructure, dimensional deviation, thermal elasto-plastic theory, residual stress
Citation: Li M, Li J, Yang D and He B (2020) Dimensional Deviation Management for Selective Laser Melted Ti6Al4V Alloy Blade. Front. Mater. 7:42. doi: 10.3389/fmats.2020.00042
Received: 05 November 2019; Accepted: 07 February 2020;
Published: 27 February 2020.
Edited by:
Lechun Xie, Wuhan University of Technology, ChinaReviewed by:
Zhiyang Wang, Australian Nuclear Science and Technology Organisation, AustraliaKaijie Lin, Nanjing University of Aeronautics and Astronautics, China
Yi Yang, University of Shanghai for Science and Technology, China
Copyright © 2020 Li, Li, Yang and He. This is an open-access article distributed under the terms of the Creative Commons Attribution License (CC BY). The use, distribution or reproduction in other forums is permitted, provided the original author(s) and the copyright owner(s) are credited and that the original publication in this journal is cited, in accordance with accepted academic practice. No use, distribution or reproduction is permitted which does not comply with these terms.
*Correspondence: Jiuxiao Li, bGlqaXV4aWFvQDEyNi5jb20=