 Robert Balzer1
 Harald Behrens1*
 Tina Waurischk2
 Stefan Reinsch2
 Ralf Müller2
 Philipe Kiefer3
 Joachim Deubener3
 Michael Fechtelkord4
- 1Institute of Mineralogy, Leibniz University Hannover, Hanover, Germany
- 2Bundesanstalt für Materialforschung und -prüfung (BAM), Division Glass, Berlin, Germany
- 3Institute of Non-Metallic Materials, Clausthal University of Technology, Clausthal-Zellerfeld, Germany
- 4Mineralogy and Geophysics, Institute of Geology, Ruhr-University Bochum, Bochum, Germany
To understand the influence of water and alkalis on aluminosilicate glasses, three polymerized glasses with varying ratios of Na/K were synthesized [(22. 5-x)Na2O-xK2O-22.5 Al2O3-55 SiO2 with x = 0, 7.5, and 11.25]. Subsequently, these glasses were hydrated (up to 8 wt% H2O) in an internally heated gas pressure vessel. The density of hydrous glasses linearly decreased with water content above 1 wt%, consistent with the partial molar volume of H2O of 12 cm3/mol. Near-infrared spectroscopy revealed that hydroxyl groups are the dominant species at water content of <4 wt%, and molecular water becomes dominating at water content of >5 wt%. The fraction of OH is particularly high in the pure Na-bearing glass compared to the mixed alkali glasses. 27Al magic angle spinning-NMR spectroscopy shows that aluminum is exclusively fourfold coordinated with some variations in the local geometry. It appears that the local structure around Al becomes more ordered with increasing K/Na ratio. The incorporation of H2O reinforces this effect. The differential thermal analysis of hydrous glasses shows a significant mass loss in the range of glass transition already during the first upscan, implying the high mobility of water in the glasses. This observation can be explained by the open structure of the aluminosilicate network and by the low dissociation enthalpy of H2O in the glasses (≈ 8 kJ/mol). The effect of the dissolved H2O on the glass transition temperature is less pronounced than for other aluminosilicate glasses, probably because of the large fraction of Al in the glasses.
Introduction
Alkali aluminosilicate glasses are a class of materials that is widely used in commercial applications as chemical strengthened cover glass for consumer electronics (Scholze, 1988; Ellison and Gomez, 2010; Varshneya, 2010a,b; Allan et al., 2013). Furthermore, these systems constitute more than 50% of natural rhyolitic and granitic magmas (Tuttle and Bowen, 1958; Johannes and Holtz, 1996). Of particular interest is the Na2O-Al2O3-SiO2 (NAS) system because, on the one hand, sodium ions are highly mobile in ion-exchange processes used for chemical strengthening and, on the other hand, this system contains a number of geologically important minerals such as albite, jadeite, and nepheline (Toplis et al., 1997a). Thus, it has often been used as a model system for granitic magmas.
The structure and thus the related properties of aluminosilicate glasses and melts mainly depend on the ratio between Al and the charge-balancing network modifier (e.g., Na) as this determines the degree of polymerization of the structure (Mysen and Richet, 2018). In subaluminous compositions (Na/Al = 1), all Al3+ is charge-balanced by alkali, and the structure basically consists of a fully polymerized network of SiO4 and AlO4 tetrahedra (Mysen et al., 1981; Toplis et al., 2000). However, as shown by 17O NMR spectroscopy for K2O-Al2O3-SiO2 (KAS) glasses with 60 mol% SiO2, the subaluminous compositions may contain non-bridging oxygen on the 1% level (Thompson and Stebbins, 2011).
In peralkaline compositions (Na/Al > 1), the excess of alkali relative to aluminum causes a depolymerization of the network with formation of non-bridging oxygen (Toplis et al., 1997a). In peraluminous compositions (Na/Al <1), the amount of alkali is insufficient for the charge compensation of Al3+ in tetrahedral coordination, and aluminum can have a network-modifying role as indicated by the highly coordinated AlO5 and AlO6 species (Mysen et al., 1981; Toplis et al., 1997a; Doweidar, 1998). Additionally, as suggested by Lacy (1963) and others (Toplis et al., 2000; Kuryaeva, 2004; Xue and Kanzaki, 2007), the excess Al3+ may form triclusters with three AlO4 tetrahedra sharing a common oxygen atom. Furthermore, it was found that the type of charge-balancing cation affects the formation of non-bridging oxygen and thus the degree of polymerization. For instance, for subaluminous compositions, it was found that the abundance of non-bridging oxygen increases in alkaline earth aluminosilicates compared to that in alkali aluminosilicate glasses (Wu and Stebbins, 2009; Mysen and Richet, 2018).
Dissolving water in glasses and melts can dramatically affect their physical and mechanical properties. For example, small amounts of water can strongly reduce the viscosity and enhance the rates of structural relaxation and phase separation in melts (Zhang et al., 2003; Whittington et al., 2004; Del Gaudio et al., 2007; Zietka et al., 2007). Furthermore, the mechanical strength and fatigue resistance of glasses can be lowered (Wiederhorn, 1967; Lee and Tomozawa, 1999). In silicates and aluminosilicates, the effect of water on physical properties was found to be rather similar to that of alkali oxides (Shaw, 1963; Dingwell et al., 1996). On the other hand, in borate glasses, protons play a very different role compared to alkali cations due to the weaker Si-O-B bonds compared to the Si-O-Al bonds and due to the strong localization of protons at single oxygen (Reinsch et al., 2016).
It is well known that water in glasses occurs as hydroxyl groups and as molecular water (Scholze, 1960; Stolper, 1982a; Stuke et al., 2006). In melts, the interaction between molecular water and hydroxyl groups can be described by the following homogeneous reaction:
where O is an anhydrous oxygen. Assuming an ideal mixing of H2O, O, and OH species, the equilibrium constant K for the above reaction is:
where the square brackets indicate mole fractions calculated on a single-oxygen basis. As shown in several papers on aluminosilicates, the measured water speciation in glasses at room temperature corresponds to the equilibrium water speciation in the melt, frozen-in at the fictive temperature (Tf) during cooling (Dingwell and Webb, 1990; Zhang et al., 1995; Behrens and Stuke, 2003).
The OH and H2O species behave differently within the network structure of glasses and melts (Behrens et al., 2007). Therefore, not only the quantification of water species but also the understanding of the mechanisms of incorporation of water in the silicate structure is of great importance for both material and earth sciences.
The present study is devoted to the investigation of the influence of different charge-balancing cations as well as the effect of water on the structure of aluminosilicate glasses. Three different glasses (22.5-x)Na2O-xK2O-22.5Al2O3-55SiO2 (x = 0, 7.5, and 11.25) were prepared, wherein Na2O was successively substituted by K2O. These glasses have high Al/Si ratios, close to 1. A comparison with literature data for other polymerized glasses with low Al/Si ratios [e. g., albite (NaAlSi3O8) with Al/Si = 0.33 or the natural alkali aluminosilicate rhyolite with Al/Si ≈ 0.20] allows conclusions about the effect of Al/Si ratio on glass and melt properties. The variation of water content of these highly polymerized glasses was achieved by high pressure–high temperature synthesis using an internally heated pressure vessel (IHPV). Fourier-transform infrared (FTIR) spectroscopy and nuclear magnetic resonance (NMR) spectroscopy were performed to analyze the speciation of dissolved water and the structural changes of the glass network upon hydration. The glass transition was studied using differential thermal analysis (DTA), providing also information about the mobility of hydrous species in the glass structure. These findings about the interaction of water with the glass structures may improve our understanding of corrosion as well as the crack propagation mechanisms of glasses.
Experimental and Analytical Methods
Starting Materials
Three aluminosilicate glasses were prepared using Na2CO3, K2CO3, Al2O3, and SiO2 powders. These powders were carefully mixed using a 3D shaker mixer (Turbula®, WAB, Switzerland) and filled into a Pt-Rh10 crucible before melting in a chamber furnace. The temperature was raised to 1,973 K (NAS glass) and 2,023 K (NKAS glasses), respectively, and kept for 2 h. Afterwards, the melts were quenched by pouring them into water. To achieve good homogeneity, the glasses were crushed, re-melted, and quenched–poured onto a graphite plate. Clear bubble-free glasses were obtained by this method.
The bulk composition of the air-melted glasses was analyzed by X-ray fluorescence spectrometry (XRF; PANalytical MagiX PRO, Almelo, Netherlands) equipped with a 4-kW Rh tube. For calibration, standard glasses NIST 1412, NIST 1411, NRS 93a, NBS 620, and BAM S005b were used.
To verify the XRF analyses, the bulk compositions were additionally measured using electron microprobe analyses (EMPA). The measurements were performed using a Cameca SX-100 microprobe, and each glass was analyzed at 50 different positions to probe its homogeneity. The measurement conditions included a beam current of 15 nA, an acceleration voltage of 15 kV, a defocused beam of 5-μm spot size, and counting times of 10 to 20 s. Similar values were obtained by both analytical methods (Table S1) and revealed that all glasses have a slight excess of alkalis [(Na+K)/Al ratio >1]. The EMPA measurements further provide evidences that the glasses are homogeneous over several millimeters.
Synthesis of Hydrated and Compacted Glasses
Hydrated glasses with H2O contents up to 8 wt% were synthesized in platinum capsules (25 mm in length and inner diameter of 6 mm). The water contents were always below the solubility limits at synthesis conditions. To achieve homogeneous initial water distribution, glass powder, and distilled water were alternately filled into the capsules. The powder–water mixture was compacted with a steel piston between loading steps to minimize air bubble inclusion. To obtain a cylindrical shape, round platinum lids were welded onto the open end of the capsules after loading. The capsules were heated in a drying oven at 373 K for several hours and subsequently weighed to test for possible leakage.
Syntheses were performed in an IHPV at 500 MPa and 1,523–1,873 K for 20 h using Ar as pressure medium. Two different setups were used depending on the desired water content of the glasses. For water-poor glass (up to 4 wt% H2O), a high temperature (HT) equipment was used and single capsules were hung up with a platinum wire in the hot zone of the sample holder (controlled by S-type thermocouples). The liquidus of the water-rich glasses (> 4 wt% H2O) is low enough that these samples could be synthesized in the normal temperature (NT) device controlled by K-type thermocouples. Here up to three capsules have been placed in the hot zone of the sample holder. In both cases, the samples were quenched isobarically to avoid pressure-induced structural changes and to prevent water loss from the hydrated glasses. The cooling rates in the glass transition region were 6–7 K/s for the HT device and ~3.5 K/s for the NT device. A detailed description of the vessel and procedures is given by Berndt et al. (2002).
All hydrous glass cylinders were transparent and contained neither bubbles nor crystals. To check for homogeneity of the water distribution in the glasses, ~5-mm-thick slices were cut from both ends of the cylinders and subsequently analyzed by Karl–Fischer titration (KFT).
To study the effect of pressurization on glass properties, the anhydrous glasses were compacted in the range of glass transition using a cold seal pressure vessel (CSPV) with Ar as pressure medium (Wondraczek and Behrens, 2007). Producing such compacted water-poor glasses from melts in an IHPV was not possible due to the high melting temperatures (1,973–2,023 K). For compaction, cylindrical samples were drilled out of the glasses and placed in a CSPV. Pressure of 500 MPa was applied to the samples before the pre-heated furnace was pulled over the autoclave. The temperature was increased to 15 K above Tg (based on DTA measurements on starting glasses) and kept for 30 min. Afterwards, the autoclave was removed from the furnace and cooled with a compressed air bell whereby the pressure was kept constant by manual pumping. The initial cooling rate was typically 3 K/s for this procedure. All compacted glass cylinders were transparent and show no visible changes to their appearance.
Density Determination
The density of dry and of hydrous glasses was determined by the buoyancy method. In doing so, the weight of single pieces (100–500 mg in mass) was measured in air and in ethanol.
Karl–Fischer Titration
The total water content of hydrous glasses was determined by pyrolysis and subsequently by KFT as described in Behrens (1995), Behrens et al. (1996), and Behrens and Stuke (2003). For the analysis, ca. 10–15 mg of glass fragments was loaded into small platinum crucibles and heated up rapidly to 1,573 K. To avoid an explosive release of H2O during heating, they were pressed firmly together at the top. The results are shown in Table S2.
Differential Thermal Analysis
The fictive temperature, Tf, and the glass transition temperature, Tg, were determined by DTA in air using 10–20 mg of glass pieces placed in Pt crucibles (thermobalance TAG 24 Setaram, Caluire, France). In order to register a possible loss of water, the thermal gravimetric (TG) signal was simultaneously recorded during DTA measurements. The same type of analysis and data evaluation was applied, e.g., to hydrous borate (Bauer et al., 2015; Reinsch et al., 2016) and phosphate (Balzer et al., 2019) glasses.
In general, four heating and cooling cycles at 10 K min−1 were applied. The first heating cycle was used to determine the fictive temperature Tf of the glasses since the initial state of the glasses represents the cooling history during synthesis. The Tg of nominally dry glasses was determined by the following three cycles. The definition of Tf and Tg is based on the onset of the endothermic step in the DTA curve according to Mazurin (2007) and Mazurin and Gankin (2007). For hydrous samples, only Tf could be determined because a massive loss of water occurred during the first upscan. The Tf values and the average values of Tg (anhydrous glasses) are shown in Table S2 and are similar to the values of albite glasses (1,007–1,068 K) reported in Arndt and Häberle (1973), Toplis et al. (1997b), and Whittington et al. (2004). The large scatter of the Tg values of albite glasses is probably due to the small deviations from Na/Al =1.
Infrared Spectroscopy
The network structure of the glasses was investigated by mid-infrared (MIR) spectroscopy of KBr-pressed pellets in the range from 370 to 4,000 cm−1 using an FTIR spectrometer (Bruker Vertex 80v). The spectrometer is equipped with a globar light source, a KBr beam splitter, and a pyroelectric deuterated, L-alanine-doped triglycerine sulfate detector. One milligram of glass powder and 199 mg KBr were mixed and pressed into a pellet at 100 kN. A pure KBr pellet was measured as reference to examine the contribution of contamination of KBr to the spectrum in the range of OH stretching vibrations.
Additionally, mid-infrared spectra have been measured on glass sections polished on both sides using an FTIR spectrometer (Bruker IFS 88) to investigate the fundamental OH stretching vibrations. The spectrometer is linked with an IR microscope Bruker IR scope II equipped with a mercury–cadmium–tellurium detector. Absorption spectra were measured in the range between 600 and 6,000 cm−1 with a spectral resolution of 2 cm−1 using a KBr beam splitter and a globar light source. For each sample and background (air) measurement, 50 scans were accumulated.
Near-infrared (NIR) spectra were recorded on thick sections (ca. 300 μm) to analyze the speciation of dissolved water in the glasses. The same setup was applied as for the MIR measurements on thin sections, except that a tungsten light source and a CaF2 beam splitter were used. The spectral resolution was 4 cm−1, and 100 scans were accumulated for each spectrum. To test the homogeneity of water distribution, sections were prepared from the top and the bottom of the synthesized glass body, and each sample was analyzed at least three times at different positions. Sample thickness was determined using a digital micrometer (Mitutoyo Absolute) with a precision of ±2 μm.
27Al Magic Angle Spinning-NMR Spectroscopy
To analyze the Al coordination in the glasses, 27Al magic angle spinning (MAS)-NMR spectra were acquired on selected samples (anhydrous and with 8 wt% H2O) at room temperature using a Bruker ASX 400 WB spectrometer. Measurements were performed at a Larmor frequency of 104.27 MHz using a standard Bruker 4-mm probe with a spinning speed of 12.5 kHz. AlCl3 (1 M) was processed as a secondary reference standard. To ensure homogeneous excitation, a single pulse duration of 0.6 μs was applied. The recycle delay was 0.1 s, and 16,000 scans were accumulated. 27Al spectra were processed using the DMFit 2015 program (Massiot et al., 2002).
Results
Water Distribution in the Glasses
The difference in water content at the bottom and at the top of the glass body is small for glasses with <4 wt% H2O and often close to the analytical error (Table S2). In contrast, the deviation is more distinct in some samples with water content above 4 wt%. These deviations could be the result of an initial inhomogeneous water distribution during the sample preparation. The diffusion data reviewed by Zhang and Ni (2010) indicate that water diffusion in aluminosilicate melts is too slow to achieve a homogeneous water distribution over distances longer than 1 cm within the synthesis times.
In the following, we refer to the average of the KFT data for a discussion of the results of bulk methods (e.g., density and NMR spectroscopy). For methods with high spatial resolution (i.e., IR spectroscopy), however, the KFT measurements on adjacent pieces are used.
Density
The densities of anhydrous glasses compacted at 500 MPa are about 1% higher than the glasses melted at ambient pressure (Table S2, Figure 1A). This increase in density upon compression is similar to that of silicate and aluminosilicate glasses reported by Wondraczek and Behrens (2007), Wondraczek et al. (2009). The addition of 1 wt% H2O induced a slight increase in the density of NAS and NKAS(1:1) glasses but a small decrease in the case of NKAS(2:1) glass. At higher water content, all three glasses show a linear dependence of density on water content, consistent with the ideal mixing of oxide component with H2O component. According to Richet et al. (2000), the partial molar volume of water can be directly obtained by extrapolation of the tangents in Figure 1B to 100 mol% H2O. The derived molar volumes (NAS: 11.8 ± 0.1 cm3 mol−1, NKAS(2:1): 12.0 ± 0.1 cm3 mol−1, and NKAS(1:1): 12.1 ± 0.2 cm3 mol−1) are in excellent agreement with the values reported for silicate and aluminosilicate glasses (11.5–12.5 cm3 mol−1; Richet et al., 2000).
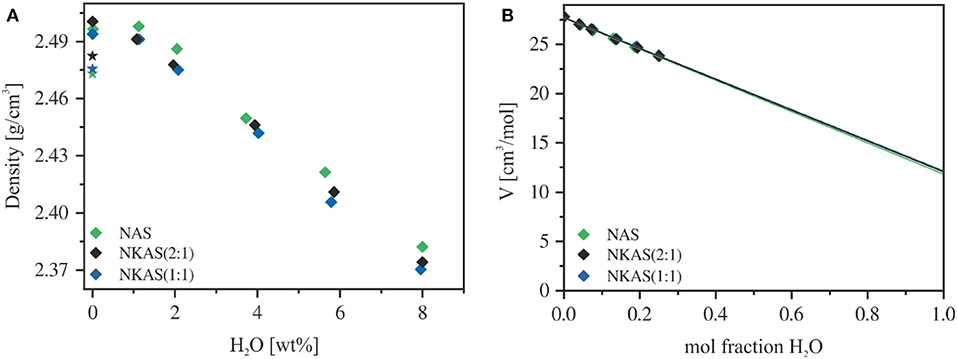
Figure 1. Density (A) and molar volume (B) of aluminosilicate glasses. The air-melted glasses are represented by a star and the compacted glasses (500 MPa) by diamonds. Errors are smaller than the symbol size.
Differential Thermal Analysis-Thermal Gravimetric Measurements
Repeated DTA–TG measurements on dry glasses show good reproducibility, although the endothermic step at the glass transition is very weak. An example is given in Figure 2A. Due to the less pronounced effects at the glass transition, the determination of Tf and Tg has higher uncertainty than commonly reported for other glasses. Based on reproducibility, we estimate the error to be below ±10 K.
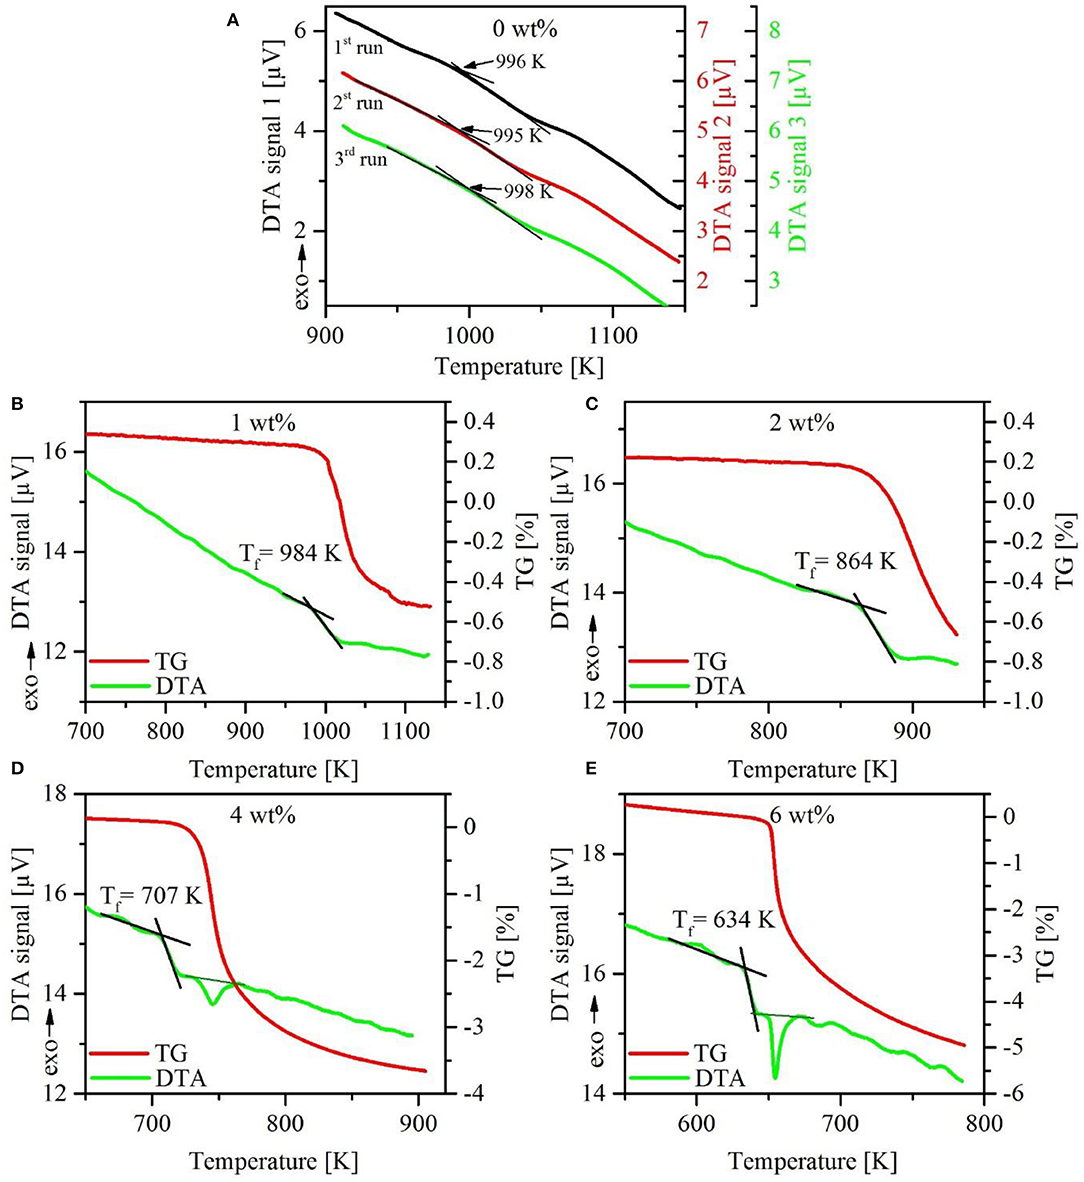
Figure 2. Comparison of the first three upscans of DTA measurements on dry NKAS(2:1)start glass. Note the very weak endothermic signal at the glass transition (A). First upscan of DTA–TG analysis of hydrous NKAS(2:1) glasses with DTA curves (green solid lines) and corresponding mass loss (red solid lines) (B–E). Note the onset of dehydration close to Tf.
As mentioned above, only the fictive temperatures could be determined for hydrous glasses because of the dramatic decrease in the TG signal in the regime of Tf or shortly above. Microscopic inspection gives evidence for bubble formation in some of the post-DTA samples, but not in all. Another mechanism for water release may be spontaneous crack formation as observed with hydrous albitic glasses during heating below the glass transition (Indris et al., 2005).
Results for NKAS(2:1) are displayed in Figure 2. A Tf value of 984 K was determined for the glass containing 1 wt% H2O. At already 10 K above this temperature, a dramatic decrease in TG by around 0.5 wt% occurred within a very small temperature interval. At 2 wt% H2O, Tf was found to be at 864 K and the massive decrease of TG starts immediately (Figure 2C). At 4 wt% (Figure 2D) and 6 wt% H2O (Figure 2E), Tf is at 707 and 634 K, respectively, and the loss of mass is around 20 K higher. Here it can be possible to distinguish between the endothermic step of Tf and the endothermic peak caused by the release of water. Similar trends were observed in the other hydrous glasses [NAS and NKAS(1:1)]. At higher water content (8 wt%), the DTA curves show large irregularities and Tf cannot be constrained. Considering these problems, it is clear that the fictive temperature of hydrous glasses has a very large error, which we estimate to be about 15%.
Mid-Infrared Spectroscopy
The MIR spectra of the aluminosilicate glasses [NAS, NKAS(2:1), and NKAS(1:1)] in KBr-pressed pellets are shown in Figure 3. The spectra can be divided into two regions. The first region comprises lattice vibrations in the range between 400 and 1,250 cm−1, while the second region originates from OH stretching vibration in the range between 3,250 and 3,700 cm−1 (Stolper, 1982a,b).
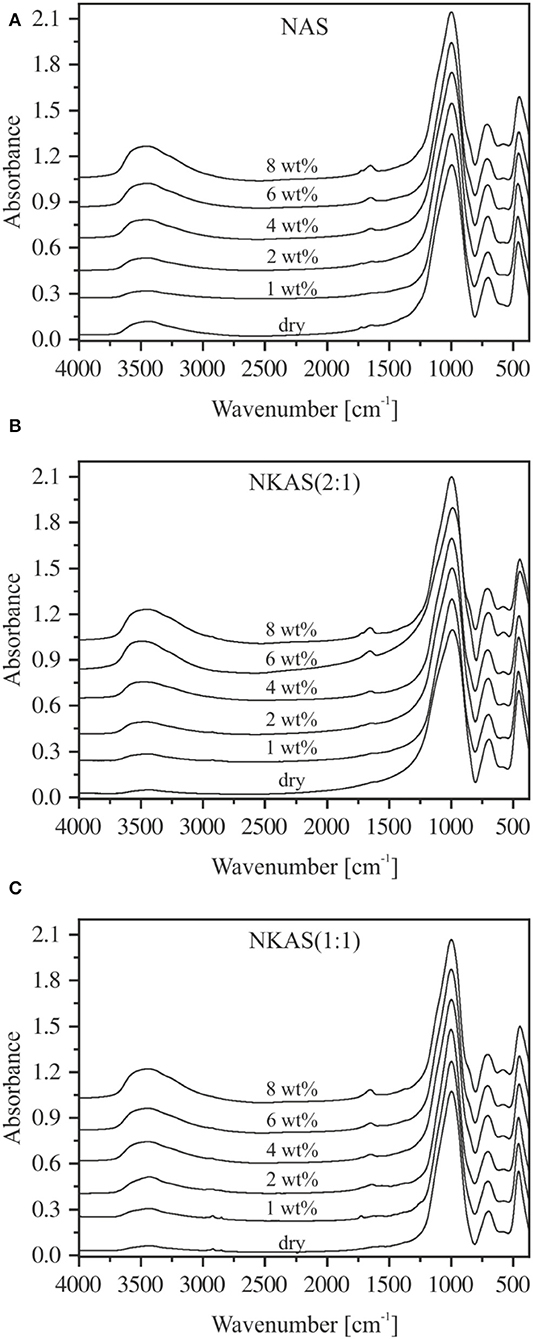
Figure 3. MIR spectra of KBr-pressed pellets of NAS (A), NKAS(2:1) (B), and NKAS(1:1) (C). The spectra were normalized to the absorption peak of ~996 cm−1 and shifted vertically for clarity. Nominal water contents are indicated.
In the first region, three main bands are clearly visible. The absorption band at ~450 cm−1 is related to the bending vibrations of Si–O–Si and Si–O–Al linkages (Handke and Mozgawa, 1993; Sroda and Paluszkiewicz, 2008). The ~700 cm−1 band is caused by the symmetric stretching vibrations of Si–O–Al bonds between SiO4 and AlO4 tetrahedra (Tarte, 1967; Handke and Mozgawa, 1993; Handke et al., 1994; Sroda and Paluszkiewicz, 2008), while the band at ~1,000 cm−1 corresponds to the asymmetric stretching vibration of Si–O–Al bonds (Handke and Mozgawa, 1993; Handke et al., 1994; Stoch and Sroda, 1999; Sroda and Paluszkiewicz, 2008).
A closer look at the band structures in this region reveals some differences in peak position and shape. For instance, the bands at ~450 and ~700 cm−1 in anhydrous glasses shift slightly to lower wavenumbers when Na is substituted by K. On the other hand, the position of the 1,000 cm−1 band is the same in all three anhydrous glasses.
The addition of water results in some changes in the structure of the MIR bands. In pure sodium aluminosilicate glasses (Figure 3A), the peak at 458 cm−1 (dry glass) shifts to 448 cm−1 (8 wt%) and its intensity decreases, while the peak at 702 cm−1 (dry glass) shifts to 708 cm−1 (8 wt%). The intensity of the latter remains unchanged. The peak position and the intensity of the 1,000 cm−1 band is constant, but at water contents above 4 wt% a shoulder at ~854 cm−1 appears that is probably related to SiOH groups (Acocella et al., 1984; Rüscher et al., 2011). In addition, a small peak at 575 cm−1 evolves at water contents above 4 wt%. According to Tarte (1967), Handke et al. (1994), and Sroda and Paluszkiewicz (2008), this peak is related to the stretching vibrations of the four- and the six-membered ring systems of Si–O and Al–O tetrahedra.
Similar trends upon hydration are visible in NKAS(2:1) and NKAS(1:1) glasses (Figures 3B,C). The addition of water results in a peak shift and a decrease of intensity of the 456 cm−1 band (dry glass) to 446 cm−1 (8 wt%) [NKAS(2:1)] and from 454 to 444 cm−1 [NKAS(1:1)], respectively. In NKAS(2:1) glasses, the band of the symmetric stretching vibration of Si–O–Al bonds shifts from 698 cm−1 (dry glass) to 706 cm−1 (8 wt%). In NKAS(1:1) glasses, this peak shifts from 696 cm−1 (dry glass) to 704 cm−1 (8 wt%). At 4 wt% H2O, the SiOH-related shoulder is visible at 852 cm−1 [NKAS(2:1)] and 850 cm−1 [NKAS(1:1)], respectively, while the peak position and the intensity of the main absorption band at 996 cm−1 do not change. As in NAS glasses, a peak at 575 cm−1 becomes visible. These features are more pronounced in the mixed alkali glasses (Figures 3B,C) than in the sodium aluminosilicate glasses (Figure 3A).
As the water content increases, a small peak near 1,650 cm−1 appears, which becomes more pronounced with growing water content. According to Scholze (1960), Bartholomew et al. (1980), and Stolper (1982b), this peak is caused by the bending vibration of H2O molecules. In the high wavenumber range, broadbands between 3,250 and 3,700 cm−1 are visible in all glasses, with a maximum at 3,400 cm−1 and a small shoulder toward lower wavenumbers. These bands are related to the OH stretching vibrations of weakly to moderately H-bound hydrous species (Scholze, 1959; Zarubin, 1999) and become more pronounced with increasing water content. However, in some cases, noticeable deviations from this trend are visible in Figure 3. A comparison of these bands to the spectra of pure KBr pellets shows that the pressed pellets are sensitive to water adsorption during sample preparation. This effect cannot be eliminated by the subtraction of a spectrum of pure KBr pellets since the interfaces between glass powder and salt may contribute significantly to the spectra in this range. Thus, using KBr-pressed pellets, we cannot obtain reliable information about the shape of the OH stretching vibration bands.
The spectra of thin sections (~80 μm) do not suffer from this problem (Figure 4). However, due to high absorbances and difficulties in preparing sections <40 μm, the MIR spectra could be obtained only for glasses containing up to 2 wt% H2O. In the range of OH stretching vibrations, the absorption spectra of hydrous NAS glasses resemble the spectra of other aluminosilicate glasses, (e.g., Stolper, 1982a; Jewell et al., 1993; Tamic et al., 2001; Behrens et al., 2004; Robert et al., 2013) with the peak maximum near 3,500 cm−1 and an asymmetric tailing toward a lower wavenumber. These features are characteristic for weakly H-bonded hydrous species in glasses (Franz and Kelen, 1966; Zarubin, 1999). At water contents above 1 wt%, the sharp bend of the bending vibrations of H2O molecules develops at 1,650 cm−1, which is superimposed by a wide broadband system originating from glass network vibrations (Bartholomew et al., 1980; Stolper, 1982a,b; Newman et al., 1986; Behrens and Stuke, 2003). The MIR spectra of NKAS(2:1) and NKAS(1:1) glasses are similar to those of NAS glasses.
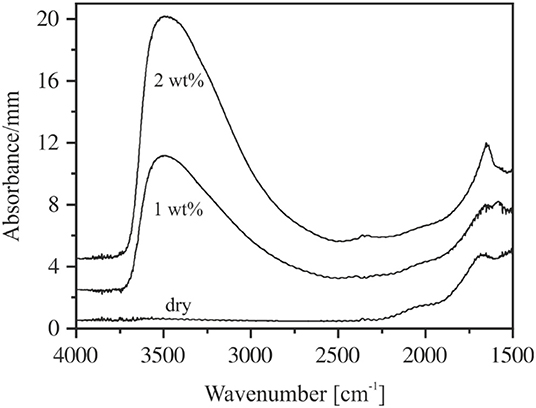
Figure 4. MIR spectra of thin sections of NAS containing 0–2 wt% H2O. The irregularities at 2,350 cm−1 are due to differences in CO2 during background and sample measurements. The spectra are shifted vertically for clarity. Nominal water contents are indicated.
In order to separate the water-related peaks from the network vibration features, the spectrum of each dry glass was subtracted from the spectra of water-bearing glasses, as shown in Figure 5. For glasses containing ca. 1 wt% H2O, the peak at 1,650 cm−1 has noticeable intensity only for the NAS glass (Figure 5A). In glasses containing 2 wt% H2O, the intensity of the H2O bending peak is similar in all glasses.
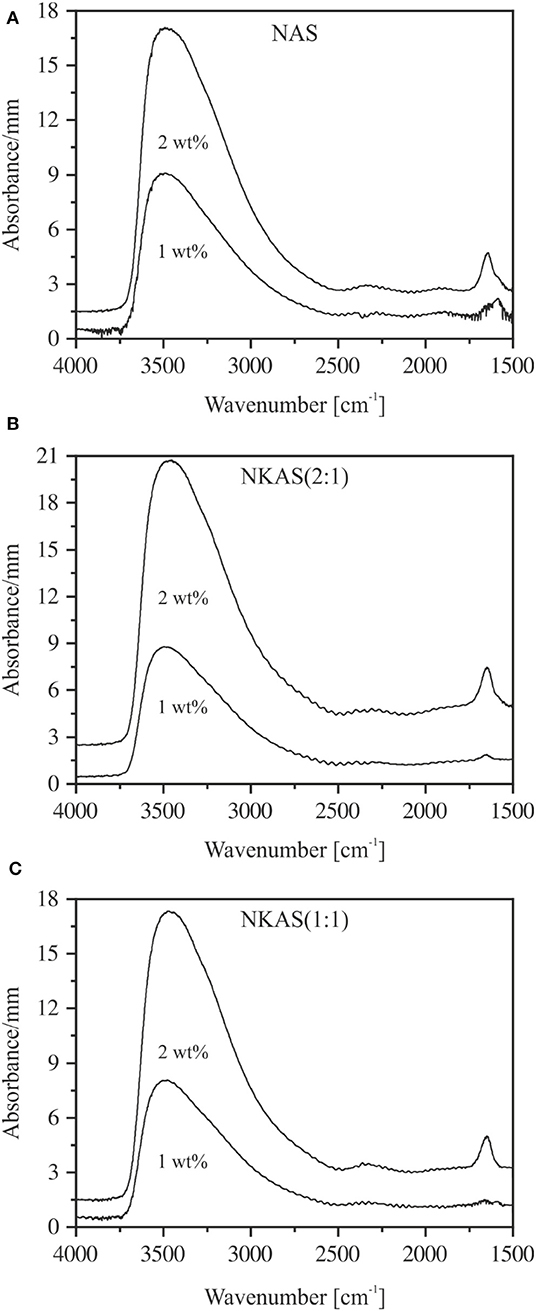
Figure 5. The subtraction spectra of NAS (A), NKAS(2:1) (B), and NKAS(1:1) (C) illustrate the water-related peaks at 3,500 and 1,650 cm−1. The spectra were normalized to sample thickness and shifted for clarity.
To quantify the water contents of the nominally dry glasses (Table 2), the linear molar absorption coefficient for the band at 3,500 cm−1 (ε3500) was determined using the hydrous glasses with up to 2 wt% H2O. The basic assumption is that the absorbance at the peak maximum represents the total water content measured by KFT. This approach is justified since the shape of the OH stretching vibration does not depend on the water content. The total water content of cH2Ot is given as
where A3500 refers to the absorbance of the band at 3,500 cm−1, ρ refers to the density in g L−1, and d refers to the sample thickness (in cm). The values of ε3500 decrease when K is substituted for Na (Table 1). Compared to other aluminosilicate glasses, the ε3500 values are relatively low. For instance, in fully polymerized albite glasses, Silver and Stolper (1989) and Yamashita et al. (1997) determined a value for ε3500 of 70 L mol−1 cm−1. For rhyolite compositions, ε3500 values between 88 and 100 L mol−1 cm−1 are reported (Newman et al., 1986; Yamashita et al., 1997; Leschik et al., 2004), and for basaltic compositions, values of 65 L mol−1 cm−1 are also reported (Yamashita et al., 1997; Shishkina et al., 2010). On the other hand, the ε3500 values of our glasses are similar to those for float glass and soda lime silicate glasses (~40 L mol−1 cm−1) as determined by Harder et al. (1998) and others (Behrens and Stuke, 2003; Suzuki et al., 2015).
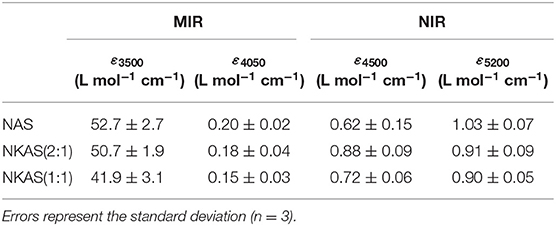
Table 1. Average values of the linear molar absorption coefficient ε for water-related bands in aluminosilicate glasses.
In part, the differences in ε3500 can be explained by the degree of polymerization of the glasses, i.e., ε3500 becomes smaller as the ratio of non-bridging oxygen over tetrahedral cations (NBO/T) increases. However, at constant NBO/T, an increased Al/Si ratio appears to lower ε3500, as indicated by the comparison of our data to albite composition. Furthermore, the nature of the charge-compensating cation also seems to play an important role.
Using these ε3500 values, the water contents of the air-melted glasses are 0.015 ± 0.002 wt% (NAS), 0.019 ± 0.005 wt% NKAS(2:1), and 0.013 ± 0.003 wt% NKAS(1:1). Such contents are typical for aluminosilicate glasses melted at air (Scholze, 1960). Compaction of the glass bodies near Tg in the cold seal pressure vessel does not change the water content. Water diffusivity is too slow at these temperatures to equilibrate the glass cylinders with the pressure medium.
Near-Infrared Spectroscopy
The NIR spectra of NAS, NKAS(2:1), and NKAS(1:1) containing up to 8 wt% H2O are shown in Figure 6. Strong absorption bands at ~5,200, ~4,500, and ~4,050 cm−1 are visible in the plotted range between 6,000 and 3,700 cm−1. Analogous to silicate glasses, the band at 4,050 cm−1 is attributed to the combination of OH stretching vibration with a low wavenumber lattice vibration (Wu, 1980; Stolper, 1982a; Bauer et al., 2015, 2017). The absorption band near 4,500 cm−1 represents the combination of stretching and bending vibrations of hydroxyl groups connected to tetrahedrally coordinated silicon (Si–OH) (Wu, 1980; Stolper, 1982a; Nowak and Behrens, 1995; Behrens et al., 1996). This assignment is supported by the MIR spectra, i.e., the band at 4,500 cm−1 originates from a combination of OH stretching vibration at 3,500 cm−1 and a Si–OH stretching vibration near 1,000 cm−1 (Figure 3). The absorption band at 5,200 cm−1 is related to the combination of stretching and bending modes of H2O molecules (Bartholomew et al., 1980; Behrens and Stuke, 2003; Stuke et al., 2006).
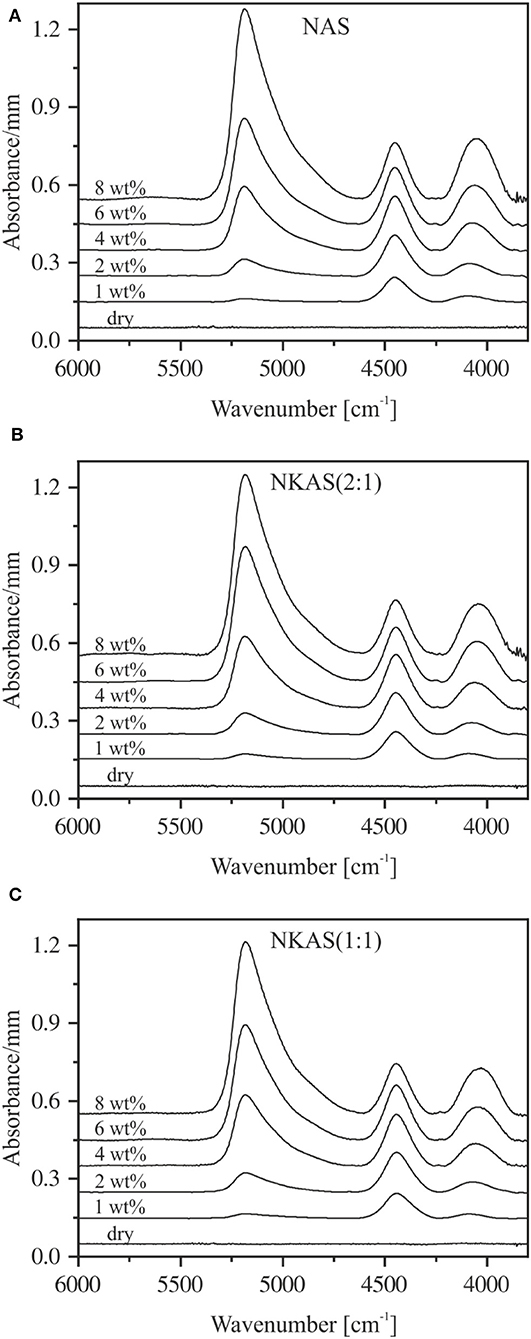
Figure 6. Baseline-corrected near-infrared spectra of NAS (A), NKAS(2:1) (B), and NKAS(1:1) (C) containing 0–8 wt% H2O. The spectra were normalized to sample thickness and vertically shifted for clarity. Nominal water contents are indicated.
All these NIR bands are visible at water contents >1 wt%, whereby their intensities increase with increasing water content. The peaks of ~4,050, ~4,500, and ~5,200 cm−1 shift toward a lower wavenumber when K2O is substituted for Na2O. A noticeable peak shift upon hydration is not observed for any of these peaks (Table 2).
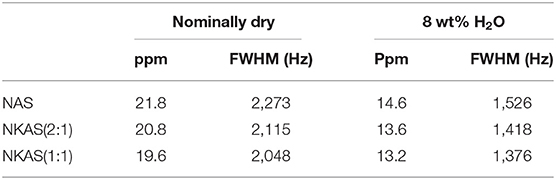
Table 2. Full-width at half-maximum (FWHM) of 27Al MAS-NMR signals (in ppm) and Hz for anhydrous and hydrous glasses.
To use the NIR bands for the determination of the species concentration and the total water content of the glasses, the choice of baseline is crucial. As discussed by Withers and Behrens (1999), the highest reproducibility for aluminosilicate glasses can be achieved using tangential baselines. This method of baseline correction is illustrated in Figure 7.
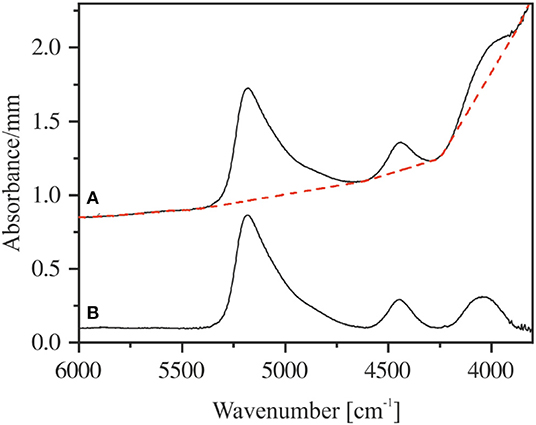
Figure 7. Measured near-infrared spectrum of NKAS(2:1) 8-I with the applied tangential baseline (red dashed line) (A). Corresponding baseline-corrected spectrum (B). The spectra are shifted for clarity.
As shown in Figure S1, the absorbance of the 4,050 cm−1 band, normalized to sample thickness and density, is proportional to the total water content. The linear correlation indicates that both the OH groups and the H2O molecules contribute to this band. The linear molar absorption coefficient (ε4050) of this band was derived by the slope of data points and decreases when Na is replaced by K (Table 3). The ε4100 values are much lower than those determined for rhyolite (0.68 L mol−1 cm−1), basalt (0.51 L mol−1 cm−1), and albite (0.94 L mol−1 cm−1) glasses (Stolper, 1982a; Withers and Behrens, 1999), consistent with the low ε3500 values of the Al-rich alkali aluminosilicate glasses.
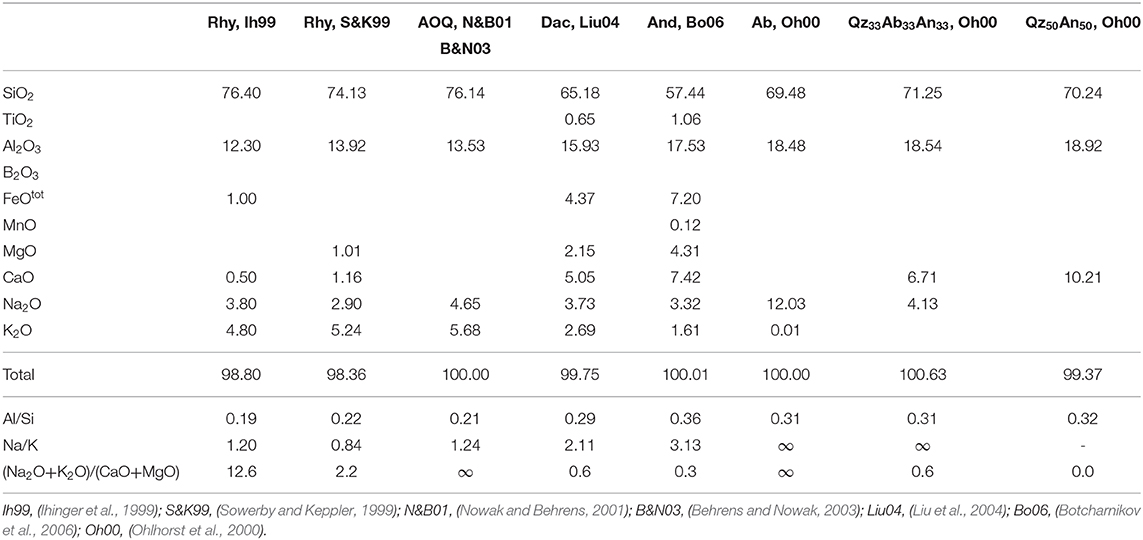
Table 3. Compositional data in wt% of the aluminosilicate melts plotted in Figure 12.
Assuming that the combination bands at ~4,500 and ~5,200 cm−1 represent the total water content and that the absorption coefficients are independent of the water content, a simple calibration can be performed to determine the linear molar absorption coefficient for both bands (Equations 4–6) (Newman et al., 1986; Behrens et al., 1996; Withers and Behrens, 1999; Balzer et al., 2019):
where cOH denotes the content of water dissolved as OH groups and cH2O denotes the content of molecular H2O. The linear molar absorption coefficients ε can be derived by a linear regression of Equation (7) which is obtained by the combination of Equations (4–6):
In a graphical representation of this relationship (Figure 8), the linear molar absorption coefficients of the NIR absorption bands are given by the intercepts with the corresponding axis. This approach was successfully applied to a variety of glass systems, e.g., silicates (Stuke et al., 2006; Yamashita et al., 2008), aluminosilicate (Nowak and Behrens, 1995; Behrens et al., 1996; Ihinger et al., 1999; Schmidt et al., 2001), borosilicates (Bauer et al., 2017), borates (Bauer et al., 2015), and phosphates (Balzer et al., 2019).
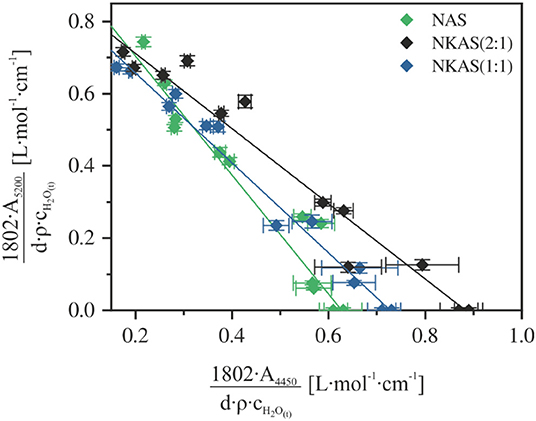
Figure 8. Calibration plot for the determination of the linear molar absorption coefficient of the near-infrared bands at 4,450 and 5,200 cm−1 in aluminosilicate glasses.
Values of ε4500 and ε5200 resulting from this approach are shown in Table 1. The ε4500 value increases when 7.5 mol% K2O is incorporated at the expense of 7.5 mol% Na2O. This behavior is consistent with the findings on other aluminosilicate glasses (Behrens et al., 1996). However, a further substitution of Na2O by K2O leads to a decrease of ε4500. In contrast, ε5200 continuously decreases with the K2O content.
The linear molar absorption coefficients of ε4500 and ε5200 in our glasses are much lower compared to those of other aluminosilicate glasses, e.g., albite glasses as reported by Withers and Behrens (1999). They obtained values of 1.21 L mol−1 cm−1 (ε4450) and 1.46 L mol−1 cm−1 (ε5200), respectively, choosing the same baseline correction for their spectra. This comparison shows that higher alkali contents in polymerized aluminosilicate glasses lead to lower absorption coefficients. These findings are consistent with those of the investigations on sodium silicate glasses made by Yamashita et al., where a decrease of the molar absorption coefficient with the Na2O content of the glasses was observed (Yamashita et al., 2008).
27Al Magic Angle Spinning-NMR Spectroscopy
The 27Al MAS-NMR spectra of NAS, NKAS(2:1), and NKAS(1:1) exhibit similar features (Figure 9). The main resonance of the central transition in the spectra of nominally dry NAS glass is centered at 55.9 ppm, with the typical asymmetric extension toward lower values resulting from the distribution of quadrupolar parameters of 27Al arising from the disordered nature of the glass (Zeng et al., 2000; Wu and Stebbins, 2009) (Figures 10A,C). According to previous studies (Engelhardt and Michel, 1987; Merzbacher, 1990; Stebbins and Farnan, 1992; Toplis et al., 1997a, 2000; Sen et al., 1998; Schmidt et al., 2000; Xue and Kanzaki, 2007; Wu and Stebbins, 2009; Sukenaga et al., 2010; Stebbins et al., 2013), this peak is assigned to tetrahedrally coordinated Al (AlIV). In the range of 13 ppm, a weakly pronounced shoulder is visible. Typically, this resonance is caused by octahedral coordinated Al (AlVI). The first spinning sidebands of the main resonance are located at 178 and−62 ppm.
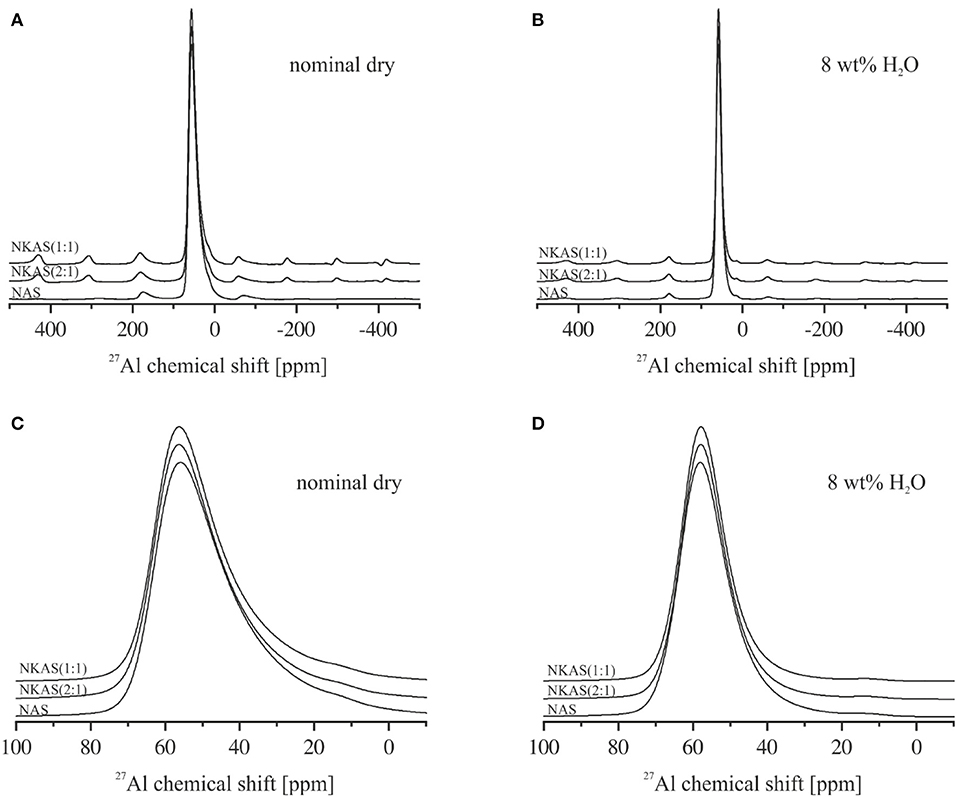
Figure 9. 27Al magic angle spinning (MAS)-NMR spectra of anhydrous glasses (A) and magnification of the main resonance of the central transition between 100 and −10 ppm (C). 27Al MAS-NMR spectra of hydrous glasses bearing 8 wt% (B) and magnification of the main resonance between 100 and −10 ppm (D). All spectra are normalized to the AlIV resonance (~55 ppm) and shifted vertically for comparison.
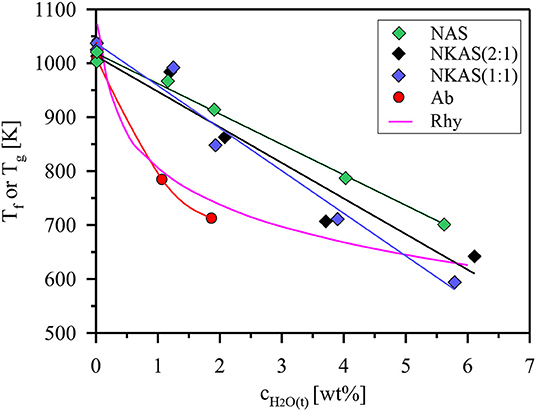
Figure 10. Fictive temperature (Tf) of Al-rich alkali aluminosilicate glasses as a function of the total water content. For comparison, trends of glass transition temperatures (Tg) defined by a viscosity of 1012 Pas are shown for rhyolite (Rhy) and albite (Ab) composition (Zhang et al., 2003; Whittington et al., 2004).
In anhydrous mixed alkali glasses [NKAS(2:1) and NKAS(1:1)], the main resonance shifts by 0.4 ppm to higher values (Figures 10A,C). With increasing substitution of K for Na, a decrease of the full-width at half maximum occurs (Table 2). The shoulder at 13 ppm becomes more pronounced when Na2O is exchanged for K2O.
According to Stebbins and Farnan (1992), Stebbins et al. (2013) and others (Toplis et al., 2000; Neuville et al., 2006; Xue and Kanzaki, 2007; Wu and Stebbins, 2009), a fivefold coordinated aluminum (AlV) produces a signal at around 30–40 ppm in aluminosilicate glasses. Such a high Al coordination was found not only in glasses with divalent modifier cations, e.g., CAS (CaO-Al2O3-SiO2) (Neuville et al., 2004) and MAS (MgO-Al2O3-SiO2) (Toplis et al., 2000) but also in binary Al2O3-SiO2 glasses (Stebbins and Farnan, 1992). AlV species were also found in NAS (Na2O–Al2O3-SiO2) and KAS (K2O–Al2O3-SiO2) glasses quenched from melts at pressures above 10 GPa (Stebbins et al., 2013). We do not observe such species in our spectra, but the presence of a small fraction of AlV cannot be ruled out as the signal could be covered by the broad tail of the AlIV peak.
The signals of the hydrous glasses containing 8 wt% H2O (Figures 9B,D) are more symmetric and significantly narrower compared to the anhydrous glasses, which are also documented by the smaller FWHM (Table 2). The main resonance in all three compositions, attributed to AlIV, is slightly shifted to higher values and is located at 58 ppm. As the main resonance becomes narrower, the signal at 13 ppm becomes better resolved, but its intensity does not seem to have changed. In their 27Al MAS-NMR study on hydrous sodium aluminosilicate glasses, Zeng et al. (2000) also observed a small signal near 13 ppm. They suggest that this signal originates from the surface reaction during sample preparation. Since the peak does not change significantly with glass composition for our samples, we agree with this statement. Another explanation would be a small percentage of crystalline relics such as corundum, but a microscopic examination gave no indication for the presence of crystalline phases.
Discussion
Effect of Water on the Fictive Temperature
The Tf values of anhydrous glasses are very similar and do not differ from the subsequent Tg determinations by more than 12 K (Table S2). Thus, we conclude that the fictive temperatures are directly comparable to the Tg values reported in literature. Upon hydration, the fictive temperature of the glasses continuously decreases, which is consistent with literature data for other aluminosilicate glasses (Zhang et al., 2003; Whittington et al., 2004; Bouhifd et al., 2006; Del Gaudio et al., 2007). However, the initial effect of addition of water is much weaker than that observed for albite and rhyolite glasses (Figure 10). The data plotted for rhyolite are calculated using the viscosity model of Zhang et al. (2003). The model is based on data for 11 natural and synthetic aluminosilicate compositions which have in common a low Al/Si (0.18–0.25), a high excess of alkali compared to alkaline earth elements, and an almost subaluminous composition (NKC/Al of 0.86–1.04). Parallel plate viscometry was used by Whittington et al. (2004) to measure the viscosity of albite glasses (Al/Si = 0.32) containing up to 2 wt% H2O. At higher water contents, this method failed for the hydrous albite glass because of the rapid water loss of the samples. Since water loss is even more severe for our Al-rich glasses, we did not try to experimentally determine the melt viscosity.
The development of Tf upon hydration can be approximated for our aluminosilicate glasses by straight lines. Deviations from this trend reflect the possible error of DTA measurements. The Tf values of NAS glasses are systematically higher compared to NKAS(2:1) and NKAS(1:1), i. e., the effect of water on the reduction of Tf is stronger for the mixed alkalis. Compared to the rhyolite composition, the effect of added water is weaker for water-poor glasses (<1.5 wt% H2O) but stronger for water-rich glasses (>2 wt% H2O). These changes are most likely associated with structural modifications by an increase of the Al/Si ratio and the alkali content of the glasses.
Structure of Aluminosilicate Glasses
The nominal composition of our glasses is subaluminous, but all glasses contain a small excess of charge-balancing cations (e.g. Na+, K+) which shifts the melt into the peralkaline region. The NBO/T ratio based on EMPA data is still very close to 0 [NAS: 0.039 ± 0.001, NKAS(2:1): 0.052 ± 0.002, and NKAS(1:1): 0.027 ± 0.002]. In such glasses, Al is in tetrahedral coordination (Engelhardt and Michel, 1987; Kohn et al., 1989; Mysen, 1990; Neuville et al., 2004; Xue and Kanzaki, 2007; Wu and Stebbins, 2009; Mysen and Richet, 2018), which is also evidenced by the 27Al MAS-NMR spectra of our anhydrous glasses. Assuming that the Al avoidance principle (Loewenstein rule) is obeyed (Loewenstein, 1954; Yildirim and Dupree, 2004) and ignoring the small amount of NBO, each AlO4 tetrahedron is connected to four SiO4 tetrahedra. However, the broadness of the 27Al MAS-NMR signal and its asymmetric tail toward a lower chemical shift indicate large variations in the local geometry of the AlO4 tetrahedra. The SiO4 tetrahedra can be linked to four AlO4 tetrahedra [Q4(4 Al)] or to three AlO4 tetrahedra and one SiO4 tetrahedra [Q4(3 Al)]. Based on the EMPA data, the Al/Si ratio in our glasses is about 0.77. Thus, based on composition, we expect the ratio of Q4(4 Al)/(Q4(3 Al) to be close to 1. This is of course a simplifying approach. 17O NMR spectroscopy gives evidence that NaAlSiO4 glass has roughly 10% each of Al–O–Al and Si–O–Si, but in this glass with Al/Si of 1:1 the tendency to form Al–O–Al is probably particularly pronounced (Lee and Stebbins, 2000).
In principle, the 29Si MAS-NMR spectra could provide information about the Q species in the glasses. However, for aluminosilicates, the signals are typically very broad and the contributions from different species cannot be separated properly (Kohn et al., 1992; Zhang and Ni, 2010). Therefore, we did not perform 29Si MAS-NMR spectroscopy on our glasses.
The decrease in FWHM (Table 2) of the AlO4 resonance, when Na2O is exchanged for K2O, can be explained by the higher cation field strength of Na+ compared to that of K+. The higher cation field strength of Na+ in NAS glasses causes a higher degree of disorder than in the mixed alkali glasses (Navrotsky et al., 1985; Romano et al., 2001) since Na+ has a higher interaction with T–O–T bonds which results in the distortion of the tetrahedra geometry (Navrotsky et al., 1985; Stebbins and Farnan, 1992).
The 27Al MAS-NMR spectra give clear evidence that after hydration Al is still in tetrahedral coordination. The question is whether the hydrolysis of the T–O–T bonds generates Al connected to an OH group and three SiO4 tetrahedra (Q3AlOH species) or all Al still connected to SiO4 tetrahedra (Q4Al). The shift of the AlIV signal toward higher frequency and the decrease in the FWHM upon hydration are very similar to that found by Kohn et al. (1989) and Zeng et al. (2000) for albite glass. Based on spectra simulations, Zeng et al. (2000) concluded that the change of the lineshape of the 27Al MAS-NMR spectra of NaAlSi3O8 glasses with increasing water content does not preclude the formation of Q3AlOH, but the narrowing of the linewidth can be attributed to the ordering of Q4Al with increasing water content. Such “ordering” can occur, for instance, through the elimination of highly strained Q4Al sites by reaction with water. On the other hand, according to Zeng et al. (2000), the shift of the signal is consistent with the formation of Q3AlOH species. They proposed a water dissolution mechanism in which both SiOH and AlOH groups are formed, the ratio depending on the Al/Si ratio of the glass. According to their prediction, for the NAS glass with Al/Si = 0.77, the AlOH/SiOH should be close to 1. However, the model of Zeng et al. (2000) suggests that NaOH groups are also formed upon water dissolution in the melts. According to Xue and Kanzaki (2007), free hydroxyls (OH groups which are not bound to tetrahedral cations) are favored by more depolymerized melts and alkaline earth cations as network-modifying cations. Thus, free hydroxyl groups are not expected for the glasses under investigation here.
The decrease of disorder with increasing water content is probably only in part the effect of the re-arrangement of the tetrahedral units after the hydrolysis of the T–O–T bond. The frozen-in temperature also decreases with water content, and the disorder of the structure increases with rising temperature (Dubinsky, 2006; Stebbins, 2008).
Water Speciation in Aluminosilicate Glasses
As a common feature, in oxide glasses OH groups are dominating at low water contents, but the fraction of molecular water continuously increases with the total water content. This trend is caused by the decrease of the fictive temperature with total water content (Figure 10) and the increase of the equilibrium fraction of the OH groups with increasing temperature (Nowak and Behrens, 2001; Behrens and Nowak, 2003). The fictive temperature represents the apparent equilibrium temperature for the speciation frozen in the glass (Behrens and Nowak, 2003). As known from literature, the total water content, at which the contents of dissociated H2O and molecular H2O are the same, depends on the glass composition. For instance, in soda-lime borate glasses, the OH groups are the dominant species even at very high water content (~8 wt%) (Bauer et al., 2015). In borosilicate glasses, the intersection point, where the concentration of dissociated water and molecular H2O are the same, is at about 6–7 wt% H2O (Bauer et al., 2017). In (alumino)silicate glasses, this intersection point was found between 3 and 4 wt% H2O (Silver et al., 1990; Schmidt et al., 2001; Behrens and Stuke, 2003; Stuke et al., 2006).
Our data for NKAS(2:1) and NKAS(1:1) are consistent with previous data for aluminosilicate glasses, with intersection points at total water contents of 3.0 and 3.8 wt%, respectively (Figure 11A). The NAS glasses contain a higher fraction of OH groups with the intersection point at 5.9 wt% H2O. Compared with other polymerized alkali aluminosilicates, the fraction of dissociated H2O is higher in our Al-rich glasses (Al/Si≈0.77) than those in albite (Al/Si ≈ 0.32) and in rhyolite (Al/Si ≈ 0.20) glass (Figure 11B). All these glasses were synthesized in the same type of IHPV, and the quench rate was the same, at least, for the water-rich glasses. Hence, differences in thermal history of the samples cannot explain the high OH contents in the Al-rich glasses. However, different fictive temperatures at the same water content (Figure 10) may partially explain this finding.
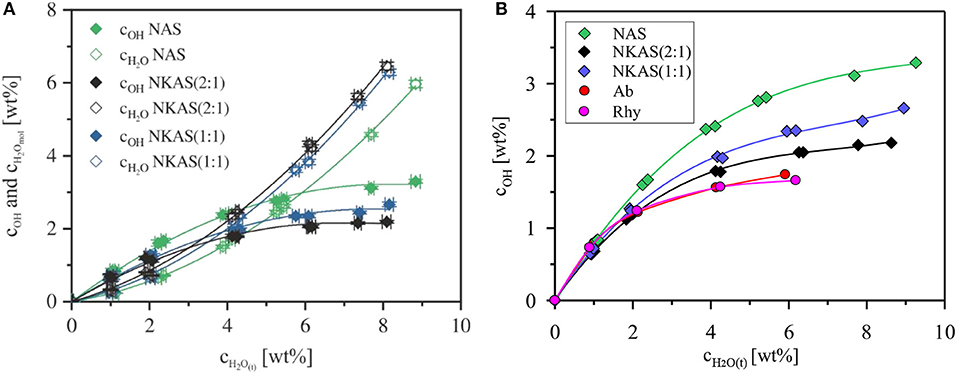
Figure 11. Water species concentration in the glasses NAS, NKAS(2:1), and NKAS(1:1) in function of total water content (A). Comparison of the content of dissociated H2O with albite and rhyolite glasses synthesized and quenched at similar conditions as the glasses of our study (Withers and Behrens, 1999) (B).
To test this hypothesis, we have used the fictive temperature concept to determine the equilibrium water speciation in function of temperature. The kinetics of water species conversion in polymerized aluminosilicate melts is controlled by structural relaxation of the network and, hence, by melt viscosity (Dingwell and Webb, 1990; Zhang et al., 1995; Behrens and Nowak, 2003). Thus, the fictive temperature of glass represents the equilibrium temperature for the speciation of H2O measured in the glasses. Behrens and Nowak (2003) have demonstrated the applicability of this concept for a rhyolite-like composition. The equilibrium constants for speciation of dissolved water in the melts derived by the concept of fictive temperature were consistent with in situ measurement in melts at high pressure and temperature as well as with experiments in which the glasses were equilibrated for longer times in the range of glass transition and subsequently rapidly cooled to room temperature. Figure 12 compares the equilibrium constant for water speciation (Equations 2) with other data for aluminosilicate melts. The water speciation data published so far cover a narrow range in the ln K vs. 1/T space. Considering the compositions given in Table 3, there is little effect of composition on equilibrium water speciation in the melt within the Al/Si range of 0.19–0.36, the Na/K range of 0.84–∞, and the (Na2O + K2O)/(CaO + MgO) range of 0–∞. The only clear trend from literature data is the decrease of ln K when Ca2+ is substituted for 2 Na+ in melts with Al/Si = 0.31 (Ohlhorst et al., 2000).
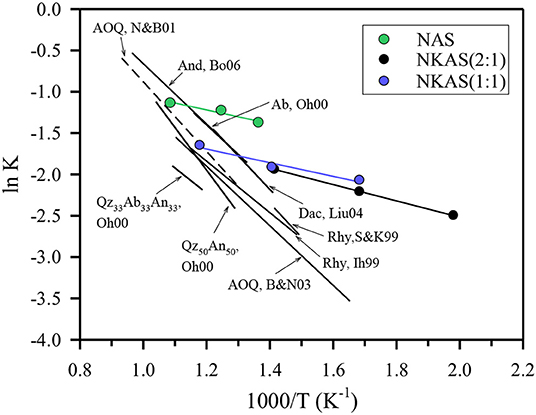
Figure 12. Comparison of the equilibrium constants for water speciation in aluminosilicate. The composition of the reference data are given in Table 3.
The data for the Al-rich alkali aluminosilicate melts fit well to the data for the other compositions at high temperature. However, with increasing water content and, hence, decreasing temperature, the data determined in our study deviate more and more from the other data. The slope m of the straight lines is connected to the standard enthalpy ΔH0 of the water speciation reaction as ΔH0 = Rm, where R is the universal gas constant (Nowak and Behrens, 1995, 2001; Sowerby and Keppler, 1999). Linear regressions for the alkali aluminosilicate glasses were performed only for water contents from 2 to 6 wt%. At lower water content, the error of COH is very high; at higher water content Tfcould not be measured due to rapid water loss. Errors of ΔH0 were estimated assuming an error of Tf of ±15 K and an error of ln K of ±0.1. The derived ΔH0 values of the three alkali aluminosilicate glasses agree within error: 7.0 ± 3.5 kJ mol−1 for NAS, 8.2 ± 4.1 kJ mol−1 for NKAS(2:1), and 6.9 ± 3.4 kJ mol−1 for NKAS(1:1). Thus, lower OH contents at the same temperature in the mixed alkali glasses compared to the pure Na aluminosilicate glasses are not caused by different enthalpies for the dissociation reaction. These differences may be explained by the higher cation field strength of Na+ compared to K+, which facilitates the breaking of neighboring Al–O–Si bonds.
The ΔH0 values are much lower for the Al-rich aluminosilicate than for all the other compositions reported in Table 3. For instance, Nowak and Behrens determined ΔH0 = 35.0 ± 1.2 kJ mol−1 for the rhyolite-like AOQ composition and Ohlhorst et al. (2000) determined ΔH0 = 33.8 ± 3.6 kJ mol−1 for the albite composition. Our interpretation of these trends is that the relative abundance of Si–O–Si and Si–O–Al linkages in the network determines the hydrolysis behavior. In the Al-rich aluminosilicates, there are seven times as many Si–O–Al linkages than Si–O–Si linkages. In the other aluminosilicates, the abundance of both is similar (for And, Bo06 in Figure 12) or Si–O—Si linkages predominate. This implies that the Si–O–Al connections are stabilized against hydrolysis by neighboring Si–O–Si.
Conclusion
Al-rich alkali aluminosilicate glasses consist of an alternating network of AlO4 and SiO4 tetrahedra, which is strongly strained as indicated by 27Al MAS-NMR spectroscopy. Replacing Na+ with K+ reduces the internal tension to some extent, but much more efficient is the incorporation of H2O into the structure, which depolymerizes the network through the formation of SiOH and AlOH groups. The enthalpy of the water dissociation reaction is much lower for the Al-rich melts (Al/Si = 0.77) compared to melts with a low fraction of aluminum (Al/Si <0.40). This implies that Si–O–Si connections are crucial for the stabilization of the network against hydrolysis. As a consequence, the initial decrease of the fictive temperature with the addition of water content is relatively weak in Al-rich alkali aluminosilicates.
Another important finding of our study is the tremendous increase of water mobility in the range of glass transition. According to Behrens and Nowak (1997), water can migrate through polymerized aluminosilicate structures either by the direct jumps of H2O molecules or by the transient reaction of H2O molecules with bridging oxygen forming OH group pairs. Both mechanisms are favored by the fact that the Al–O–Si bonds can be broken more easily than the Si–O–Si bonds. Thus, how large the fraction of the SiO4 tetrahedra connected to the four AlO4 tetrahedra is of crucial importance.
These observations, although mainly constrained for the range of glass transition, may have also implications for the mechanical behavior of glasses at ambient conditions, e.g., for the crack growth behavior. As demonstrated by Waurischk et al. (this issue), larger forces are required for inert crack growth in hydrous microscope slide glass compared to the dry glass. Thus, dissolved water in the glass may act as a toughening agent. A possible explanation is a local stress relief by breaking up the strained bonds through reaction with water species. For Al-rich glasses, one would expect this difference between dry and hydrous glasses to be even more pronounced.
Data Availability Statement
All datasets generated for this study are included in the article/Supplementary Material.
Author Contributions
This paper is a joint project of the research groups in Hannover, Berlin, Clausthal, and Bochum. Syntheses of hydrous glasses were done by RB and HB in Hannover. Dry glasses and DTA measurements were done by TW, SR, and RM in Berlin. Discussion include contributions of PK and JD from Clausthal. MF performed the NMR measurements.
Conflict of Interest
The authors declare that the research was conducted in the absence of any commercial or financial relationships that could be construed as a potential conflict of interest.
Acknowledgments
Financial support by the Deutsche Forschungsgemeinschaft (DFG) through its priority program SPP 1594—Topological Engineering of Ultrastrong Glasses (MU 963/14-2, DE598/22-2, and Be1720/31-2) is gratefully acknowledged. This research is part of the Ph.D. thesis of RB at Leibniz University of Hannover (Balzer, 2019), but the data were re-evaluated and re-interpreted for publication in Frontiers. The authors thank Jonathan Stebbins and a second reviewer for their fruitful comments.
Supplementary Material
The Supplementary Material for this article can be found online at: https://www.frontiersin.org/articles/10.3389/fmats.2020.00085/full#supplementary-material
References
Acocella, J., Tomozawa, M., and Watson, E. B. (1984). The Nautre of dissolved water in sodium silicate glasses and its effect on various properties. J. Non-Crystalline Solids 65, 355–372. doi: 10.1016/0022-3093(84)90058-9
Allan, D. C., Ellison, A. J., and Gomez, S. (2013). “Glass with compressive surface for consumer applications” in United States Patent. Corning, NY: Corning Incorporated.
Arndt, J., and Häberle, F. (1973). Thermal expansion and glass transition temperatures of synthetic glasses of plagiclase-like compositions. Contrib. Mineral. Petrol. 39, 175–183. doi: 10.1007/BF00375739
Balzer, R. (2019). Interaction of water with oxide glass structures, in Institut für Mineralogie. Hannover: Gottfried Wilhelm Leibniz Universität Hannover. p. 111.
Balzer, R., Behrens, H., Reinsch, S., and Fechtelkord, M. (2019). Structural investigation of hydrous phosphate glasses. Phys. Chem. Glasses 60, 49–61. doi: 10.13036/17533562.60.2.041
Bartholomew, R. F., Butler, B. L., Hoover, H. L., and Wu, C. K. (1980). Infrared spectra of a water-containing glass. J. Am. Ceramic Soc. 63, 481–485. doi: 10.1111/j.1151-2916.1980.tb10748.x
Bauer, U., Behrens, H., Fechtelkord, M., Reinsch, S., and Deubener, J. (2015). Water- and boron speciation in hydrous soda-lime-borate glasses. J. Non-Crystalline Solids 423–424, 58–67. doi: 10.1016/j.jnoncrysol.2015.05.004
Bauer, U., Behrens, H., Reinsch, S., Morin, E. I., and Stebbins, J. F. (2017). Structural investigation of hydrous sodium borosilicate glasses. J. Non-Crystalline Solids 465, 39–48. doi: 10.1016/j.jnoncrysol.2017.03.023
Behrens, H. (1995). Determination of water solubilities in high-viscosity melts- an experimental study on NaAlSi3O8 and KAlSi3O8 melts. Eur. J. Mineral. 7, 905–920. doi: 10.1127/ejm/7/4/0905
Behrens, H., and Nowak, M. (1997). The mechanisms of water diffusion in polymerized silicate melts. Contrib. Mineral. Petrol. 126, 377–385. doi: 10.1007/s004100050257
Behrens, H., and Nowak, M. (2003). Quantification of H2O speciation in silicate glasses and melts by IR spectroscopy -in situ versus quench techniques. Phase Transitions 76, 45–61. doi: 10.1080/0141159031000076048
Behrens, H., Romano, C., Nowak, M., Holtz, F., and Dingwell, D. B. (1996). Near-infrared spectroscopic determination of water species in glasses of the system MAlSI3O8 (M=Li,Na,K)-an intralaboratory study. Chem. Geol. 128, 41–63. doi: 10.1016/0009-2541(95)00162-X
Behrens, H., and Stuke, A. (2003). Quantification of H2O contents in silicate glasses using IR spectroscopy - a calibration based on hydrous glasses analyzed by Karl-Fischer titration. Glass Sci. Technol. 76, 176–189.
Behrens, H., Tamic, N., and Holtz, F. (2004). Determination of the molar absorption for the infrared absorption band of CO2 in rhyolitic glasses. Am. Mineral. 89, 301–306. doi: 10.2138/am-2004-2-307
Behrens, H., Zhang, Y., Leschik, M., Wiedenbeck, M., Heide, G., and Frischat, G. H. (2007). Molecular H2O as carrier for oxygen diffusion in hydrous silicate melts. Earth Planet. Sci. Lett. 254, 69–76. doi: 10.1016/j.epsl.2006.11.021
Berndt, J., Liebske, C., Holtz, F., Freise, M., Nowak, M., Ziegenbein, D., et al. (2002). A combined rapid-quench and H2-membrane setup for internally heated pressure vessels-Description and application for water solubility in basaltic melts. Am. Mineral. 87, 1717–1726. doi: 10.2138/am-2002-11-1222
Botcharnikov, R. E., Behrens, H., and Holtz, F. (2006). Solubility and speciation of C-O-H fluids in andesitic melt at T = 1,100–1,300°C and P = 200 and 500 MPa. Chem. Geol. 229, 125–143. doi: 10.1016/j.chemgeo.2006.01.016
Bouhifd, M. A., Whittington, A., Roux, J., and Richet, P. (2006). Effect of water on the heat capacity of polymerized aluminosilicate glasses and melts. Geochim. Cosmochim. Acta 70, 711–722. doi: 10.1016/j.gca.2005.09.012
Del Gaudio, P., Behrens, H., and Deubener, J. (2007). Viscosity and glass transition temperature of hydrous float glass. J. Non-Crystalline Solids 353, 223–236. doi: 10.1016/j.jnoncrysol.2006.11.009
Dingwell, D. B., Romano, C., and Hess, K. U. (1996). The effect of water on the viscosity of a haplogranitic melt under P-T-Xconditions relevant to silicic volcanism. Contrib. Mineral. Petrol. 124, 19–28. doi: 10.1007/s004100050170
Dingwell, D. B., and Webb, S. L. (1990). Relaxation in silicate melts. Eur. J. Mineral. 2, 427–449. doi: 10.1127/ejm/2/4/0427
Doweidar, H. (1998). Density - structure correlations in Na2O-Al2O3-SiO2 glasses. J. Non-Crystalline Solids 240, 55–65. doi: 10.1016/S0022-3093(98)00719-4
Dubinsky, E. V. (2006). Quench rate and temperature effects on framework ordering in aluminosilicate melts. Am. Mineral. 91, 753–761. doi: 10.2138/am.2006.2039
Ellison, A. J., and Gomez, S. (2010). Down-drawable, chemically strengthened glass for cover plate, U.S. Patent, Editor. Corning, NY: Corning Incorporate.
Engelhardt, G., and Michel, D. (1987). High Resolution Solid State NMR of Silicates and Zeolites. Chichester; New York; Brisbane; Toronto; Singapore: John Wiley & Sons, 485.
Franz, H., and Kelen, T. (1966). Erkenntnisse über die Struktur von Alkalisilicatgläsern und -schmelzen aus dem Einbau von OH-Gruppen Glastechnischer Bericht. Glastechnische Berichte. 40, 141–148.
Handke, M., and Mozgawa, W. (1993). Vibrational spectroscopy of the amorphous silicates. Vibrat. Spectroscopy 5, 75–84. doi: 10.1016/0924-2031(93)87057-Z
Handke, M., Mozgawa, W., and Nocun, M. (1994). Specific features of the IR spectra of silicate glasses. J. Mol. Struct. 325, 129–136. doi: 10.1016/0022-2860(94)80028-6
Harder, U., Geißler, H., Gaber, M., and Hähnert, M. (1998). Determination of the water content of alkali lime silica glasses by IR spectroscopy using nuclear reaction analysis for calibration. Glass Sci. Technol. 71, 12–18.
Ihinger, P. D., Zhang, Y., and Stolper, E. M. (1999). The specitation of dissolved water in rhyolitic melt. Geochim. Cosmochim. Acta 63, 3567–3578. doi: 10.1016/S0016-7037(99)00277-X
Indris, S., Heitjans, P., Behrens, H., Zorn, R., and Frick, B. (2005). Fast dynamics of H2Oin hydrous aluminosilicate glasses studied with quasielastic neutron scattering. Phys. Rev. B 71:e064205. doi: 10.1103/PhysRevB.71.064205
Jewell, J. M., Shaw, C. M., and Shelby, J. E. (1993). Effects of water content an aluminosilicate glasses and the relatio to strong-fragile liquid theory. J. Non-Crystalline Solids 152, 32–41. doi: 10.1016/0022-3093(93)90441-Y
Johannes, W., and Holtz, F. (1996). Petrogenesis and Experimental Petrology of Granitic Rocks. Vol. 22. Berlin: Springer. doi: 10.1007/978-3-642-61049-3
Kohn, S. C., Dupree, R., and Golam Mortuza, M. (1992). The interaction between water and aluminosilicate magmas. Chem. Geol. 96, 399–409. doi: 10.1016/0009-2541(92)90068-G
Kohn, S. C., Dupree, R., and Smith, M. E. (1989). A multinuclear magnetic resonance study of the strucutre of hydrous albite glasses. Geochim. Cosmochim. Acta 53, 2925–2935. doi: 10.1016/0016-7037(89)90169-5
Kuryaeva, R. G. (2004). Degree of polymerization of aluminosilicate glasses and melts. Glass Phys. Chem. 30, 157–166. doi: 10.1023/B:GPAC.0000024000.19443.f6
Lee, S. K., and Stebbins, J. F. (2000). Al-O-AL and Si-O-Si sites in framework aluminosilicate glasses with Si/Al=1: quantification of framework disorder. J. Non-Crystalline Solids 270, 260–264. doi: 10.1016/S0022-3093(00)00089-2
Lee, Y.-K., and Tomozawa, M. (1999). Effect of water content in phosphate glasses on slow crack growth rate. J. Non-Crystalline Solids 248, 203–210. doi: 10.1016/S0022-3093(99)00146-5
Leschik, M., Heide, G., and Frischat, G. H. (2004). Determination of H2O and D2O contents in rhyolithic glasses. Phys. Chem. Glasses 45, 238−251.
Liu, Y., Zhang, Y., and Behrens, H. (2004). H2O diffusion in dacitic melts. Chem. Geol. 209, 327–340. doi: 10.1016/j.chemgeo.2004.06.019
Loewenstein, W. (1954). The distribution of aluminum in the tetrahedra of silicates and aluminates. Am. Mineral. 39, 92–96.
Massiot, D., Fayon, F., Capron, M., King, I., Le Calv, S., Alonso, B., et al. (2002). Modelling one- and two-dimensional solid-state NMR spectra. Magnet. Resonance Chem. 40, 70–76. doi: 10.1002/mrc.984
Mazurin, O. V. (2007). Problems of compability of the values of glass transition temperatures published in the world literature. Glass Phys. Chem. 33, 22–36. doi: 10.1134/S108765960701004X
Mazurin, O. V., and Gankin, Y. V. (2007). “Glass transition temperature: problems of measurements and analysis of the existing data”; Proceedings, International Congress on Glass, July 1-6, 2007, Strasbourg, France.
Merzbacher, C. I. (1990). A high-resolution 29Si and 27Al NMR study of alkaline earth aluminosilicate glasses. J. Non-Crystalline Solids 124, 194–206. doi: 10.1016/0022-3093(90)90263-L
Mysen, B. O. (1990). Role of Al in depolymerized, peralkaline aluminosilicate melts in the systems Li2O-Al2O3-SiO2, Na2O-Al2O3-SiO2, K2O-Al2O3-SiO2. Am. Mineral. 75, 120–134.
Mysen, B. O., Virgo, D., and Kushiro, I. (1981). The structural role of aluminum in silicate melts-a Raman spectroscopic study at 1 atmosphere. Am. Mineral. 66, 678–701.
Navrotsky, A., Geisinger, K. L., McMillan, P., and Gibbs, G. V. (1985). The tetrahedral framework in glass and melts - inferences from molecular orbital calculations and implications for structure, thermodynamics, and physical properties. Phys. Chem. Minerals 11, 284–298. doi: 10.1007/BF00307406
Neuville, D. R., Cormier, L., and Massiot, D. (2004). Al environment in tectosilicate and peraluminous glasses: A 27Al MQ-MAS NMR, Raman, and XANES investigation. Geochim. Cosmochim. Acta 68, 5071–5079. doi: 10.1016/j.gca.2004.05.048
Neuville, D. R., Cormier, L., and Massiot, D. (2006). Al coordination and speciation in calcium aluminosilicate glasses: Effects of composition determined by 27Al MQ-MAS NMR and Raman spectroscopy. Chem. Geol. 229, 173–185. doi: 10.1016/j.chemgeo.2006.01.019
Newman, S., Stolper, E. M., and Epstein, S. (1986). Measurement of water in rhyolithic glasses Calibration of an infrared spectroscopic technique. Am. Mineral. 71, 1527–1541.
Nowak, M., and Behrens, H. (1995). The speciation of water in haplogranitic glasses and melts determined by in situ near-infrared spectroscopy. Geochim. Cosmochim. Acta 59, 3445–3450. doi: 10.1016/0016-7037(95)00237-T
Nowak, M., and Behrens, H. (2001). Water in rhyolitic magmas - getting a grip on a slippery problem. Earth Planetary Sci. Lett. 184, 515–522. doi: 10.1016/S0012-821X(00)00343-5
Ohlhorst, S., Behrens, H., Holtz, F., and Schmidt, B. C. (2000). “Water speciation in aluminosilicate glasses and melts,” in Applied Mineralogy in Research, Economy, Technology and Culture. eds D. Rammlmair, J. Mederer, T. H. Oberthür, R. B. Heimann, and H. Pentinghaus. Proc. 6th Int. Conf. Appl. Mineral, (Rotterdam: Balkema, 193–196.
Reinsch, S., Roessler, C., Bauer, U., Müller, R., Deubener, J., Behrens, H., et al. (2016). Water the other network modifier in borate glasses. J. Non-Crystalline Solids 432, 208–217. doi: 10.1016/j.jnoncrysol.2015.10.010
Richet, P., Whittington, A., Holtz, F., Behrens, H., Ohlhorst, S., and Wilke, M. (2000). Water and the density of silicate glasses. Contrib. Mineral. Petrol. 138, 337–347. doi: 10.1007/s004100050567
Robert, G., Whittington, A. G., Stechern, A., and Behrens, H. (2013). The effect of water on the viscosity of a synthetic calc-alkaline basaltic andesite. Chem. Geol. 346, 135–148. doi: 10.1016/j.chemgeo.2012.10.004
Romano, C., Poe, B., Mincione, V., Hess, K. U., and Dingwell, D. B. (2001). The viscosities of dry and anhydrous XAlSi3O8 (X = Li, Na, K, Ca0.5, Mg0.5) melts. Chem. Geol. 174, 115–132. doi: 10.1016/S0009-2541(00)00311-9
Rüscher, C. H., Mielcark, E. M, Wongpa, J., Jathrupitakkul, J., Jirasit, F., and Lohaus, L. (2011). Silicate-, aluminosilicate and calciumsilicate gels for building materials: chemical and mechanical properties during ageing. Eur. J. Mineral. 23, 111–124. doi: 10.1127/0935-1221/2010/0022-2070
Schmidt, B. C., Behrens, H., Riemer, T., Kappes, R., and Dupree, R. (2001). Quantitative determination of water speciation in aluminosilicate glasses- a comparative NMR and IR spectroscopic study. Chem. Geol. 174, 195–208. doi: 10.1016/S0009-2541(00)00316-8
Schmidt, B. C., Riemer, T., Kohn, S. C., Behrens, H., and Dupree, R. (2000). Different water solubility mechanisms in hydrous glasses along the Qz-Ab Join- Evidence from NMR spectroscopy. Geochim. Cosmochim. Acta 64, 513–526. doi: 10.1016/S0016-7037(99)00331-2
Scholze, H. (1959). Der Einbau des Wassers in Gläsern. Der Einfluss des im Glas gelösten Wassers auf das Ultrarot-Spektrum und die quantitative ultrarotspektroskopische Bestimmung des Wassers in Gläsern. 32, 81–88.
Scholze, H. (1960). Zur Frage der Unterscheidung zwischen H2O-Molekülen und OH-Gruppen in gläsern und Mineralen. Die Naturwissenschaften 47, 226–227. doi: 10.1007/BF00602759
Scholze, H. (1988). Glas-Natur, Struktur, Eigenschaften Vol. 3. Berlin; Heidelberg: Springer Verlag. doi: 10.1007/978-3-662-07495-4_2
Sen, S., Xu, Z., and Stebbins, J. F. (1998). Temperature dependent strucural changes in borate, borosilicare and Boroaluminate liquids high resolution 11B, 29Si, 27Al NMR studies. J. Non-Crystalline Solids 226, 29–40. doi: 10.1016/S0022-3093(97)00491-2
Shaw, H. R. (1963). Obsidian-H20 Viscosities at 1,000 and 2,000 bars in the temperature range 700°C to 900°C. J. Geophys. Res. 68, 6337–6343. doi: 10.1029/JZ068i023p06337
Shishkina, T. A., Botcharnikov, R. E., Holtz, F., Almeev, R. R., and Portnyagin, M. V. (2010). Solubility of H2O- and CO2-bearing fluids in tholeiitic basalts at pressures up to 500 MPa. Chem. Geol. 277, 115–125. doi: 10.1016/j.chemgeo.2010.07.014
Silver, L. A., Ihinger, P. D., and Stolper, E. (1990). The influence of bulk composition on the speciation of water in silicate glasses. Contrib. Mineral. Petrol. 104, 142–162. doi: 10.1007/BF00306439
Silver, L. A., and Stolper, E. (1989). Water in Albitic glasses. J. Petrol. 30, 667–709. doi: 10.1093/petrology/30.3.667
Sowerby, J. R., and Keppler, H. (1999). Water speciation in rhyolithic melt determined by in-situ infrared spectroscopy. Am. Mineral. 84, 1843–1849. doi: 10.2138/am-1999-11-1211
Sroda, M., and Paluszkiewicz, C. (2008). The structural role of alkaline earth ions in oxyfluoride aluminosilicate glasses-Infrared spectroscopy study. Vibrat. Spectroscopy 48, 246–250. doi: 10.1016/j.vibspec.2008.02.017
Stebbins, J. F. (2008). Temperature effects on the network structure of oxide melts and their consequences for configurational heat capacity. Chem. Geol. 256, 80–91. doi: 10.1016/j.chemgeo.2008.03.011
Stebbins, J. F., and Farnan, I. (1992). Effects of high temperature on silicate liquid strucutre - a multinuclear NMR study. Science 255, 586–589. doi: 10.1126/science.255.5044.586
Stebbins, J. F., Wu, J., and Thompson, L. M. (2013). Interactions between network cation coordination and non-bridiging oxygen abundance in oxide glasses and melts Insights from NMR spectroscopy. Chem. Geol. 346, 34–46. doi: 10.1016/j.chemgeo.2012.09.021
Stoch, L., and Sroda, M. (1999). Infrared spectroscopy in the investigation of oxide glasses structure. J. Mol. Struct. 511–512, 77–84. doi: 10.1016/S0022-2860(99)00146-5
Stolper, E. (1982a). Water in silicate glasses- an infrared Spectroscopic Study. Contrib. Mineral. Petrol. 81, 1–17. doi: 10.1007/BF00371154
Stolper, E. (1982b). The speciation of water in silicate melts. Geochim. Cosmochim. Acta, 46, 2609–2620. doi: 10.1016/0016-7037(82)90381-7
Stuke, A., Behrens, H., Schmidt, B. C., and Dupree, R. (2006). H2O speciation in float glass and soda lime silica glass. Chem. Geol. 229, 64–77. doi: 10.1016/j.chemgeo.2006.01.012
Sukenaga, S., Nagahisa, T., Kanehashi, K., Saito, N., and Nakashima, K. (2010). Reconsideration of Al coordination in CaO-SiO2-Al2O3-(R2O or RO) Glasses by using High Field Solid Sate 27 Al NMR Spectroscopy. ISIJ Int. 51, 333–335. doi: 10.2355/isijinternational.51.333
Suzuki, T., Konishi, J., Yamamoto, K., Ogura, S., and Fukutani, K. (2015). IR practical extinction coefficients of water in Alkali lime silicate glasses determined by nuclear reaction analysis. J. Am. Ceramic Soc. 98, 1794–1798. doi: 10.1111/jace.13568
Tamic, N., Behrens, H., and Holtz, F. (2001). The solubility of H2O and CO2 in rhyolitic melts in equilibrium with a mixed CO2-H2O fluid phase. Chem. Geol. 174, 333–347. doi: 10.1016/S0009-2541(00)00324-7
Tarte, P. (1967). Infra-red spectra of inorganic aluminates and characteristic vibrational frequencies of AlO4 tetrahedra and AlO6 octahedra. Spectrochim. Acta 23A, 2127–2143. doi: 10.1016/0584-8539(67)80100-4
Thompson, L. M., and Stebbins, J. F. (2011). Non-bridging oxygen and high-coordinated aluminum in metaluminous and peraluminous calcium and potassium aluminosilicate glasses: High-resolution 17O and 27Al MAS NMR results. Am. Mineral. 96, 841–853. doi: 10.2138/am.2011.3680
Toplis, M. J., Dingwell, D. B., Hess, K.-U., and Tommaso, L. (1997b). Viscosity, fragility, and configurational entropy of melts along the join SiO2-NaAlSiO4. Am. Mineral. 82, 979–990. doi: 10.2138/am-1997-9-1014
Toplis, M. J., Dingwell, D. B., and Lenci, T. (1997a). Peraluminous viscosity maxima in Na2O-Al2O3-SiO2 liquids - The role of triclusters in tectosilicate melts. Geochim. Cosmochim. Acta, 61, 2605–2612. doi: 10.1016/S0016-7037(97)00126-9
Toplis, M. J., Kohn, S. C., S.M., E, and Poplett, I. J. F. (2000). Fivefold-coordinated aluminum in tectosilicate glasses observed by triple quantum MAS NMR. Am. Mineral. 85, 1556–1560. doi: 10.2138/am-2000-1031
Tuttle, O. F., and Bowen, N. L. (1958). Origin of Granite in the Light of Experimental Studies in the System NaAlSi3O8-KAlSi3O8-SiO2-H2O. Geological Society of America.
Varshneya, A. K. (2010a). Chemical strengthening of glass: lessons learned and yet to be learned. Int. J. Appl. Glass Sci. 1, 131–142. doi: 10.1111/j.2041-1294.2010.00010.x
Varshneya, A. K. (2010b). The physics of chemical strengthening of glass: room for a new view. J. Non-Crystalline Solids 356, 2289–2294. doi: 10.1016/j.jnoncrysol.2010.05.010
Whittington, A., Richet, P., Behrens, H., Holtz, F., and Scaillet, B. (2004). Experimental temperature-X(H2O)-viscosity relationship for leucogranites and compariosn with synthetic silicic liquids. Trans. Royal Soc. Edinburgh 95, 59–71. doi: 10.1017/S0263593300000924
Wiederhorn, S. M. (1967). Influence of water vapor on crack propagation in soda-lime glass. J. Am. Ceram. Soc. 50, 407–414. doi: 10.1111/j.1151-2916.1967.tb15145.x
Withers, A. C., and Behrens, H. (1999). Temperature-induced changes in the NIR spectra of hydrous albitic and rhyolitic glasses between 300 and 100 K. Phys. Chem. Minerals 27, 119–132. doi: 10.1007/s002690050248
Wondraczek, L., and Behrens, H. (2007). Molar volume, excess enthalpy, and Prigogine-Defay ratio of some silicate glasses with different (P,T) histories. J. Chem. Phys. 127:2794745. doi: 10.1063/1.2794745
Wondraczek, L., Krolikowski, S., and Behrens, H. (2009). Relaxation and Prigogine-Defay ratio of compressed glasses with negative viscosity-pressure dependence. J. Chem. Phys. 130:3141382. doi: 10.1063/1.3141382
Wu, C.-K. (1980). Natrure of incorporated water in hydrated silicate glasses. J. Am. Ceramic Soc. 63, 453–457. doi: 10.1111/j.1151-2916.1980.tb10211.x
Wu, J., and Stebbins, J. F. (2009). Effects of cation field strength on the structure of aluminoborosilicate glasses: high-resolution 11B, 27Al and 23Na MAS NMR. J. Non-Crystalline Solids 355, 556–562. doi: 10.1016/j.jnoncrysol.2009.01.025
Xue, X., and Kanzaki, M. (2007). Al coordination and water speciation in hydrous aluminosilicate glasses: direct evidence from high-resolution heteronuclear 1H-27Al correlation NMR. Solid State Nucl. Magn. Reson. 31, 10–27. doi: 10.1016/j.ssnmr.2006.11.001
Yamashita, S., Behrens, H., Schmidt, B. C., and Dupree, R. (2008). Water speciation in sodium silicate glasses based on NIR and NMR spectroscopy. Chem. Geol. 256, 231–241. doi: 10.1016/j.chemgeo.2008.06.029
Yamashita, S., Kitamura, T., and Kusakabe, M. (1997). Infrared spectroscopy of hydrous glasses of arc magma compositions. Geochem. J. 31, 169–174. doi: 10.2343/geochemj.31.169
Yildirim, E., and Dupree, R. (2004). Investigation of Al-O-Al sites in an Na-aluminosilicate glass. Bull. Mater. Sci. 27, 269–272. doi: 10.1007/BF02708516
Zarubin, D. P. (1999). Infrared spectra of hydrogen bonded hydroxyl groups in silicate glasses. A re-interpretation. Phys. Chem. Glasses 40, 184–192.
Zeng, Q., Nekvasil, H., and Grey, C. P. (2000). In support of a depolymerization model for water in sodium aluminoslicate glasses: Information from NMR spectroscopy. Geochim. Cosmochim. Acta 64, 883–896. doi: 10.1016/S0016-7037(99)00352-X
Zhang, Y., and Ni, H. (2010). Diffusion of H, C, and O Components in Silicate Melts. Rev. Mineral. Geochem. 72, 171–225. doi: 10.2138/rmg.2010.72.5
Zhang, Y., Stolper, E. M., and Ihinger, P. D. (1995). Kinetics of the reaction H2O+O=2OH in rhyolitic and albitic glasses: Preliminary results. Am. Mineral. 80, 593–612. doi: 10.2138/am-1995-5-618
Zhang, Y., Xu, Z., and Liu, Y. (2003). Viscosity of hydrous rhyolitic melts inferred from kinetic experiments, and a new viscosity model. Am. Mineral 88, 1741–1752. doi: 10.2138/am-2003-11-1215
Keywords: alkali aluminosilicate glasses, water speciation, glass transition, infrared spectroscopy, NMR spectroscopy
Citation: Balzer R, Behrens H, Waurischk T, Reinsch S, Müller R, Kiefer P, Deubener J and Fechtelkord M (2020) Water in Alkali Aluminosilicate Glasses. Front. Mater. 7:85. doi: 10.3389/fmats.2020.00085
Received: 10 January 2020; Accepted: 24 March 2020;
Published: 15 May 2020.
Edited by:
Randall Youngman, Corning Inc., United StatesReviewed by:
Jonathan Stebbins, Stanford University, United StatesJingshi Wu, Corning Inc., United States
Copyright © 2020 Balzer, Behrens, Waurischk, Reinsch, Müller, Kiefer, Deubener and Fechtelkord. This is an open-access article distributed under the terms of the Creative Commons Attribution License (CC BY). The use, distribution or reproduction in other forums is permitted, provided the original author(s) and the copyright owner(s) are credited and that the original publication in this journal is cited, in accordance with accepted academic practice. No use, distribution or reproduction is permitted which does not comply with these terms.
*Correspondence: Harald Behrens, aC5iZWhyZW5zQG1pbmVyYWxvZ2llLnVuaS1oYW5ub3Zlci5kZQ==