 Yongdian Han1,2
 Yankun Zhang1,2Hongyang Jing1,2Zhanqi Gao1,2Lianyong Xu1,2,3*Zhiqiang Zhang1,2Lei Zhao1,2
- 1School of Materials Science and Engineering, Tianjin University, Tianjin, China
- 2Tianjin Key Laboratory of Advanced Joining Technology, Tianjin University, Tianjin, China
- 3State Key Laboratory of Engines, Tianjin University, Tianjin, China
The influences of microstructure and elemental distribution on pitting corrosion resistance and passive film in different regions of a super duplex stainless steel welded joint were investigated. The banded microstructure disappeared after welding and transformed to the coarse equiaxed ferrite grains in the heat-affected zone. Three types of austenitic microstructure formed in the weld center, only two types occurred in the weld cap and weld root. It is found that the elements Ni and N were enriched in austenite, while Cr and Mo were concentrated in the ferrite. The Cr2N was found precipitating in some specific regions with a lower austenite content, which led to the relatively poorer resistance to pitting corrosion in the heat-affected zone, weld root, and weld cap. The ferrite observed in each studied region of the joint was prone to experiencing selective corrosion due to its lower pitting resistance equivalent number. The content of Cr in the region around the Cr2N disappeared, so that Cr-depletion was formed as the original location of pitting. The electrochemical impedance spectroscopy results also showed that no difference exists in the passive film structure in all of the regions of the joint, and regular banded microstructure was helpful to the passive film.
Introduction
The wide application of steel cannot be separated from the welding process. Only when the quality of the welding joint has assurance, so do duplex stainless steels (Lu, 2010; Leif, 2012). Duplex stainless steel (DSS) is a family of two-phase alloys, consisting of austenite (A) and ferrite (F) with various compositions. The DSS combines the excellent properties of ferrite stainless steel and austenitic stainless steel. Hence, it exhibits superior strength and stress-corrosion cracking resistance of the former, as well as good ductility and toughness of the latter (Ha et al., 2014). Super duplex stainless steel (SDSS) is the third generation of duplex stainless steels. The contents of chromium and nickel in SDSS are higher than that in DSS. And SDSS is famous for its high pitting resistance equivalent number (PREN) value—mostly higher than 40. Due to its high alloy contents and excellent corrosion resistance, it is widely used in petrochemical and offshore platforms as pressure vessels and pipelines which have a high requirement for corrosive properties (Barteri et al., 1987; El-Yazgi and Hardie, 1998; Taban, 2008; Taban and Kaluc, 2011; Chail and Kangas, 2016).
There are many welding methods suitable for super duplex stainless steels. Among these methods, gas tungsten arc welding (GTAW) is most widely used due to its stability and high quality (Tavares et al., 2007; Leif, 2012; Udayakumar et al., 2013; Xu et al., 2013; Zhang et al., 2016). Multi-layer and multi-pass welding tends to be applied to a sheet which is over 3 mm in thickness. Because of the reheating influence from the successive welding processing, the welded joint performs an inhomogeneous microstructure in different regions (Hosseini et al., 2016). For the SDSS, the first layer is implemented without preheat and the last layer is without subsequent weld heat treatment. Thus, these two special layers may preform different microstructures and properties with the weld center. In addition, the weld cap and weld root would contact with different corrosive mediums simultaneously in some applications. For example, the outside of a submarine pipeline is subjected to the seawater, while the inside of that maybe subjected to the oil medium. Therefore, in-depth study on the overall and local corrosion behavior of SDSS joints is required.
The mechanical and corrosive properties of the weld metal and joint mainly depend on the ratio of the two phases and the secondary precipitation that varies with different welding parameters. Some welding specifications are recommended to obtain excellent properties for the SDSS welding joint through previous research (Tavares et al., 2007). First of all, the heat input should not be too low, otherwise an insufficient transformation of the austenite may occur. Meanwhile, a too high heat input can cause a slower cooling rate, which may lead to the formation of detrimental secondary precipitates in the SDSS joint (Muthupandi et al., 2003). Ramkumar et al. (2014) conducted a comparative analysis of a DSS welded joint center, where the 6 mm plate was welded by using two filler metals. The author also reported that the mechanical properties were greatly influenced by the austenite/ferrite ratio. Brytan studied the corrosion characterization of lean duplex stainless steel (1.4662) UNS S82441 welded joint and reported that welded joints show a lower corrosion resistance compared to the non-welded parent metal, and introducing heat input properly is beneficial for corrosion resistance by increasing austenitic phase content (Brytan et al., 2016). The pure Argon is often used as the protective gas to form the SDSS weld joint because the nitrogen-supplement protective gas needs to be mixed before welding, which has a decreasing efficiency.
However, studies on microstructure and corrosion resistance of different typical regions of the DSS and SDSS joints are few according to the current literatures. Zhang et al. reported that, for the UNS S31803 sheet weldment, the critical pitting temperature of the weld root (around 45°C) was always lower than the weld centre (around 50°C) when GTAW was used for a 14 mm-thickness plate regardless of shielding gas. This can be attributed to the presence of Cr2N phase and a lower austenite friction (Zhang et al., 2017). While He et al. (2015) reported that the critical pitting temperature of 2,507 base metal was about 71°C, the author also proposed two different circuit models of 2,507 below and above the critical pitting temperature. Kim et al. (2011) discussed the choice of value of the nitrogen coefficient and found that some values in the recommended range were not suitable for SDSS. Cui et al. investigated the influence of temperature on the passivation behavior of 2,507 in a special solution medium. The author reported that the thickness of passive film decreases with the increase of temperature. However, the passive film on the weld metal or joint was not studied in detail (Cui et al., 2017). In summary, most of the previous studies of UNS S32750 focused on the base metal, and the weld metal of UNS S32750 was studied as a whole. For the case of local regions, in the weld cap and weld root, few detailed researches were focused.
Accordingly, the microstructure and corrosive properties of different regions in the welding joint of UNS S32750 made by using tungsten inert gas welding under pure Ar shielding gas were investigated in this study.
The microstructure characteristics, element segregation and secondary precipitates of these zones (including the cap, weld center, weld root, the joint and the base metal) were investigated by the optical microscopy, scanning electron microscopy, transmission electron microscopy, energy dispersive spectroscopy. The resistance to pitting corrosion and passive film were studied through potentiostatic polarization, and electrochemistry impedance spectroscopy methods.
Materials and Methods
Materials and Welding Procedure
An 8 mm-thickness plate of UNS S32750 super duplex stainless steel was used as the base metal (BM). The as-received steel plate was solution-treated and hot-rolled followed by being quenched in water. The GTAW technique was used to prepare the SDSS joints. The ER2594 filler wire with 1.2 mm diameter, which had similar chemical compositions to the base metal, was used in this welding procedure. The mass percent of chemical compositions of the base metal and filler metal are listed in Table 1.
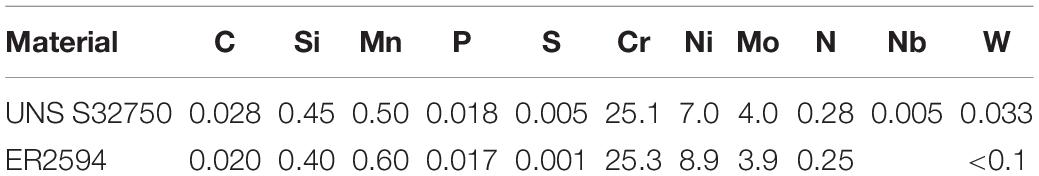
Table 1. Chemical compositions of the base metal and filter wire in mass percent (wt%).
The groove angle was 60°, the root gap was 2–3 mm and the root face was 1–2 mm. The backing shielding gas of pure Ar was applied in the process of welding and was maintained total passes to prevent oxidation of the microstructure. A total of 8 passes were conducted in the GTAW process (weld root: 1 pass, weld filler: 5 passes, and weld cap: 2 passes). The recommended welding interpass temperature is <150°C (Leif, 2012; Ramkumar et al., 2015). The heat input can be calculated using the following formula:
where Q is heat input (kJ/mm); U is welding voltage (10–14 V); I is welding current (80–120 A); v is welding speed (1.1–1.7 mm/s); η is welding thermal efficiency (GTAW: 0.65). Thus, the actual welding heat input was within 0.4–0.9 KJ/mm for each pass. Table 2 shows the relationship between heat input and interpass temperature of each pass. All the actual welding parameters were within the recommended range (Tavares et al., 2007; Leif, 2012).
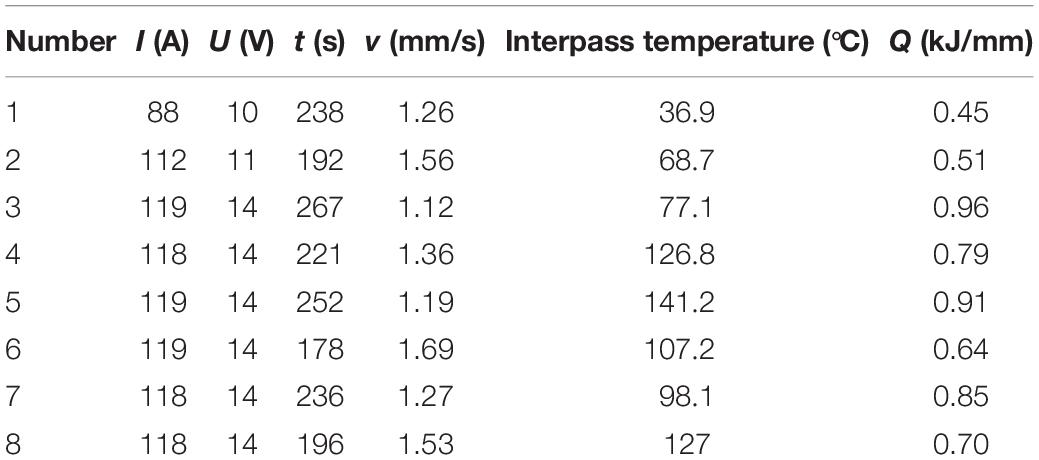
Table 2. The relationship between heat input and interpass temperature of each pass.
Microstructure Characterization
The cross-sectional specimen of the GTAW joint was wet, ground successively from 280 to 2,000 grit paper, polished with diamond pastes, cleaned in water and alcohol, and then dried before being etched and observed. To distinguish different phases, the prepared joint was etched using modified Beraha II etchant solution (60 ml H2O + 30 ml HCl + 1 g K2S2O5) for about 10 s. The microstructure of the UNS S32750 joint was observed by optical metallography (OM, ZEISS–Axio Vert.A1) and scanning electron microscopy (SEM, FEI–Nano SEM 430) coupled with EDS. The austenite contents of weld root, weld center, weld cap, HAZ, and BM were respectively counted by the OM with Pro-Image software. The OM system coupled with Pro-Image software provided a nice functional module to calculate different phase contents (Westin, 2010). At least 10 OM images in each region were collected at 500× magnification and then processed, including grayness transform, image adjustment, binary extraction and calculation. Finally, the average value came out as the content. While the contents of alloying elements in austenite and ferrite in different regions were measured by the coupled EDS to study the influence of elements partition on pitting. The quantitative calibrations of alloying elements were conducted with the corresponding standard samples.
Electrochemical Measurements
To evaluate the corrosive resistance of different regions in the SDSS joints, electrochemical measurements were performed in a three-electrode cell with an electrochemical workstation (Gamry Interface 1000). A platinum foil, saturated calomel electrode (SCE) and the tested specimen were respectively used as auxiliary electrode, reference electrode and work electrode. The exposed area of the test specimens was constant (0.196 cm2). It should be noted that the joint sample was a mixed zone (weld metal + HAZ + BM). Each specimen was ground from 240 to 2,000 abrasive paper and then polished. In case of crevice corrosion, the surroundings of the specimens were sealed with silicone during installing the work electrode process.
The test solution of critical pitting temperature was 1 mol/L NaCl according to ASTM G150 standard (Astm-G150,2013). Critical pitting temperature (CPT) of the specimen was obtained from the potentiostatic polarization curve. The solution was bubbled with high pure N2 at 0.1 L/min for 30 min to deoxidize before each test. All the electrochemical tests started by applying a constant potential of −1 V (all the potential in this paper were vs SCE) for 0.5 h to remove the surface oxides of the sample. Then a potential of 0.75 V was applied and the solution temperature was increased at 1°C/min until the current density exceeded 100 μA/cm2 where the temperature was defined as the CPT. To ensure reproducibility of the results, the electrochemical experiment of each specimen was performed in triplicate.
Electrochemical impedance spectroscopy (EIS) tests were carried out after cathode polarization at −1 V to remove oxides and stabilization for 0.5 h at open circuit potential in NaCl solution of 3.5 wt% at 35°C. Ten points were collected for each order of magnitude of ten when the frequencies were from 100 kHz to 10 mHz. The amplitude sinusoidal voltage was set as 10 mV. The impedance spectra of each sample were collected and then fitted and analyzed with the Zview-Impedance software.
Results
Microstructure Characterization and Element Partition
The weld profile preformed smoothly and no welding defects like porosity were detected by non-destructive examination. The macrostructure of the cross section of the joint is shown in Figure 1. The microstructures in the typical zones of the whole joint welded by GTAW are presented in Figure 2. The statistical results of phase contents of austenite in different zones counted by the Pro-Image software are shown in Figure 3. Furthermore, fine precipitates were found under SEM in the root pass, cap passes, and HAZ, as presented in Figure 4 in different magnifications. The Cr2N in different regions observed by TEM were presented in Figure 5.
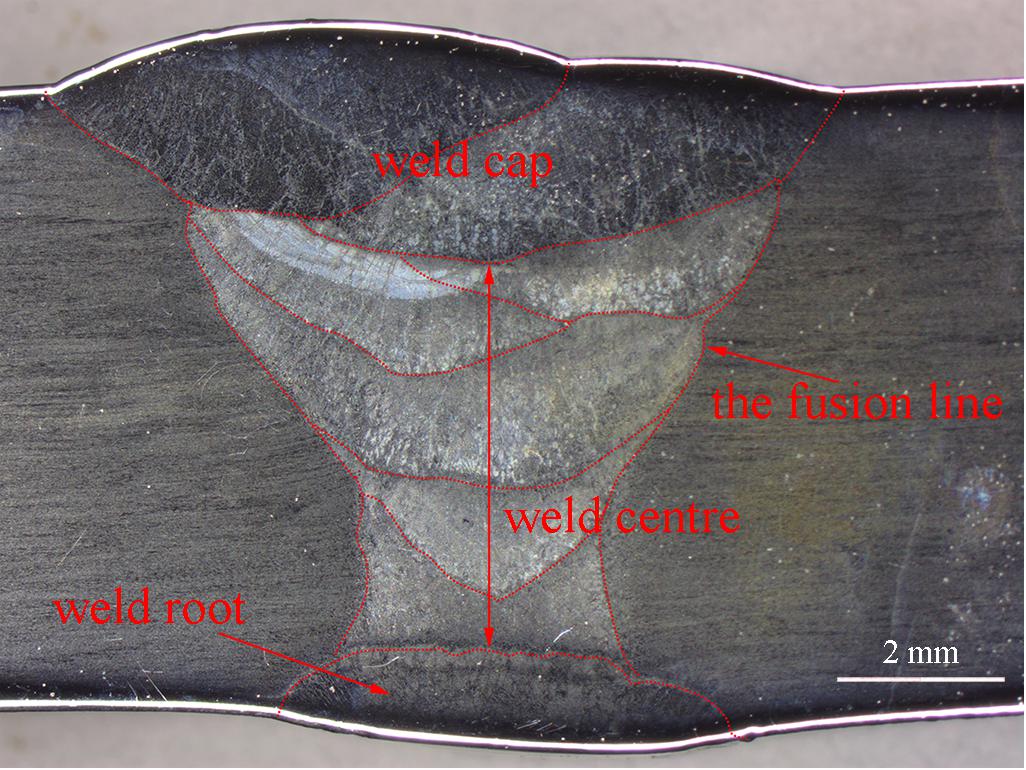
Figure 1. The macrostructure and the different regions of the cross section of the joint welded by GTAW.
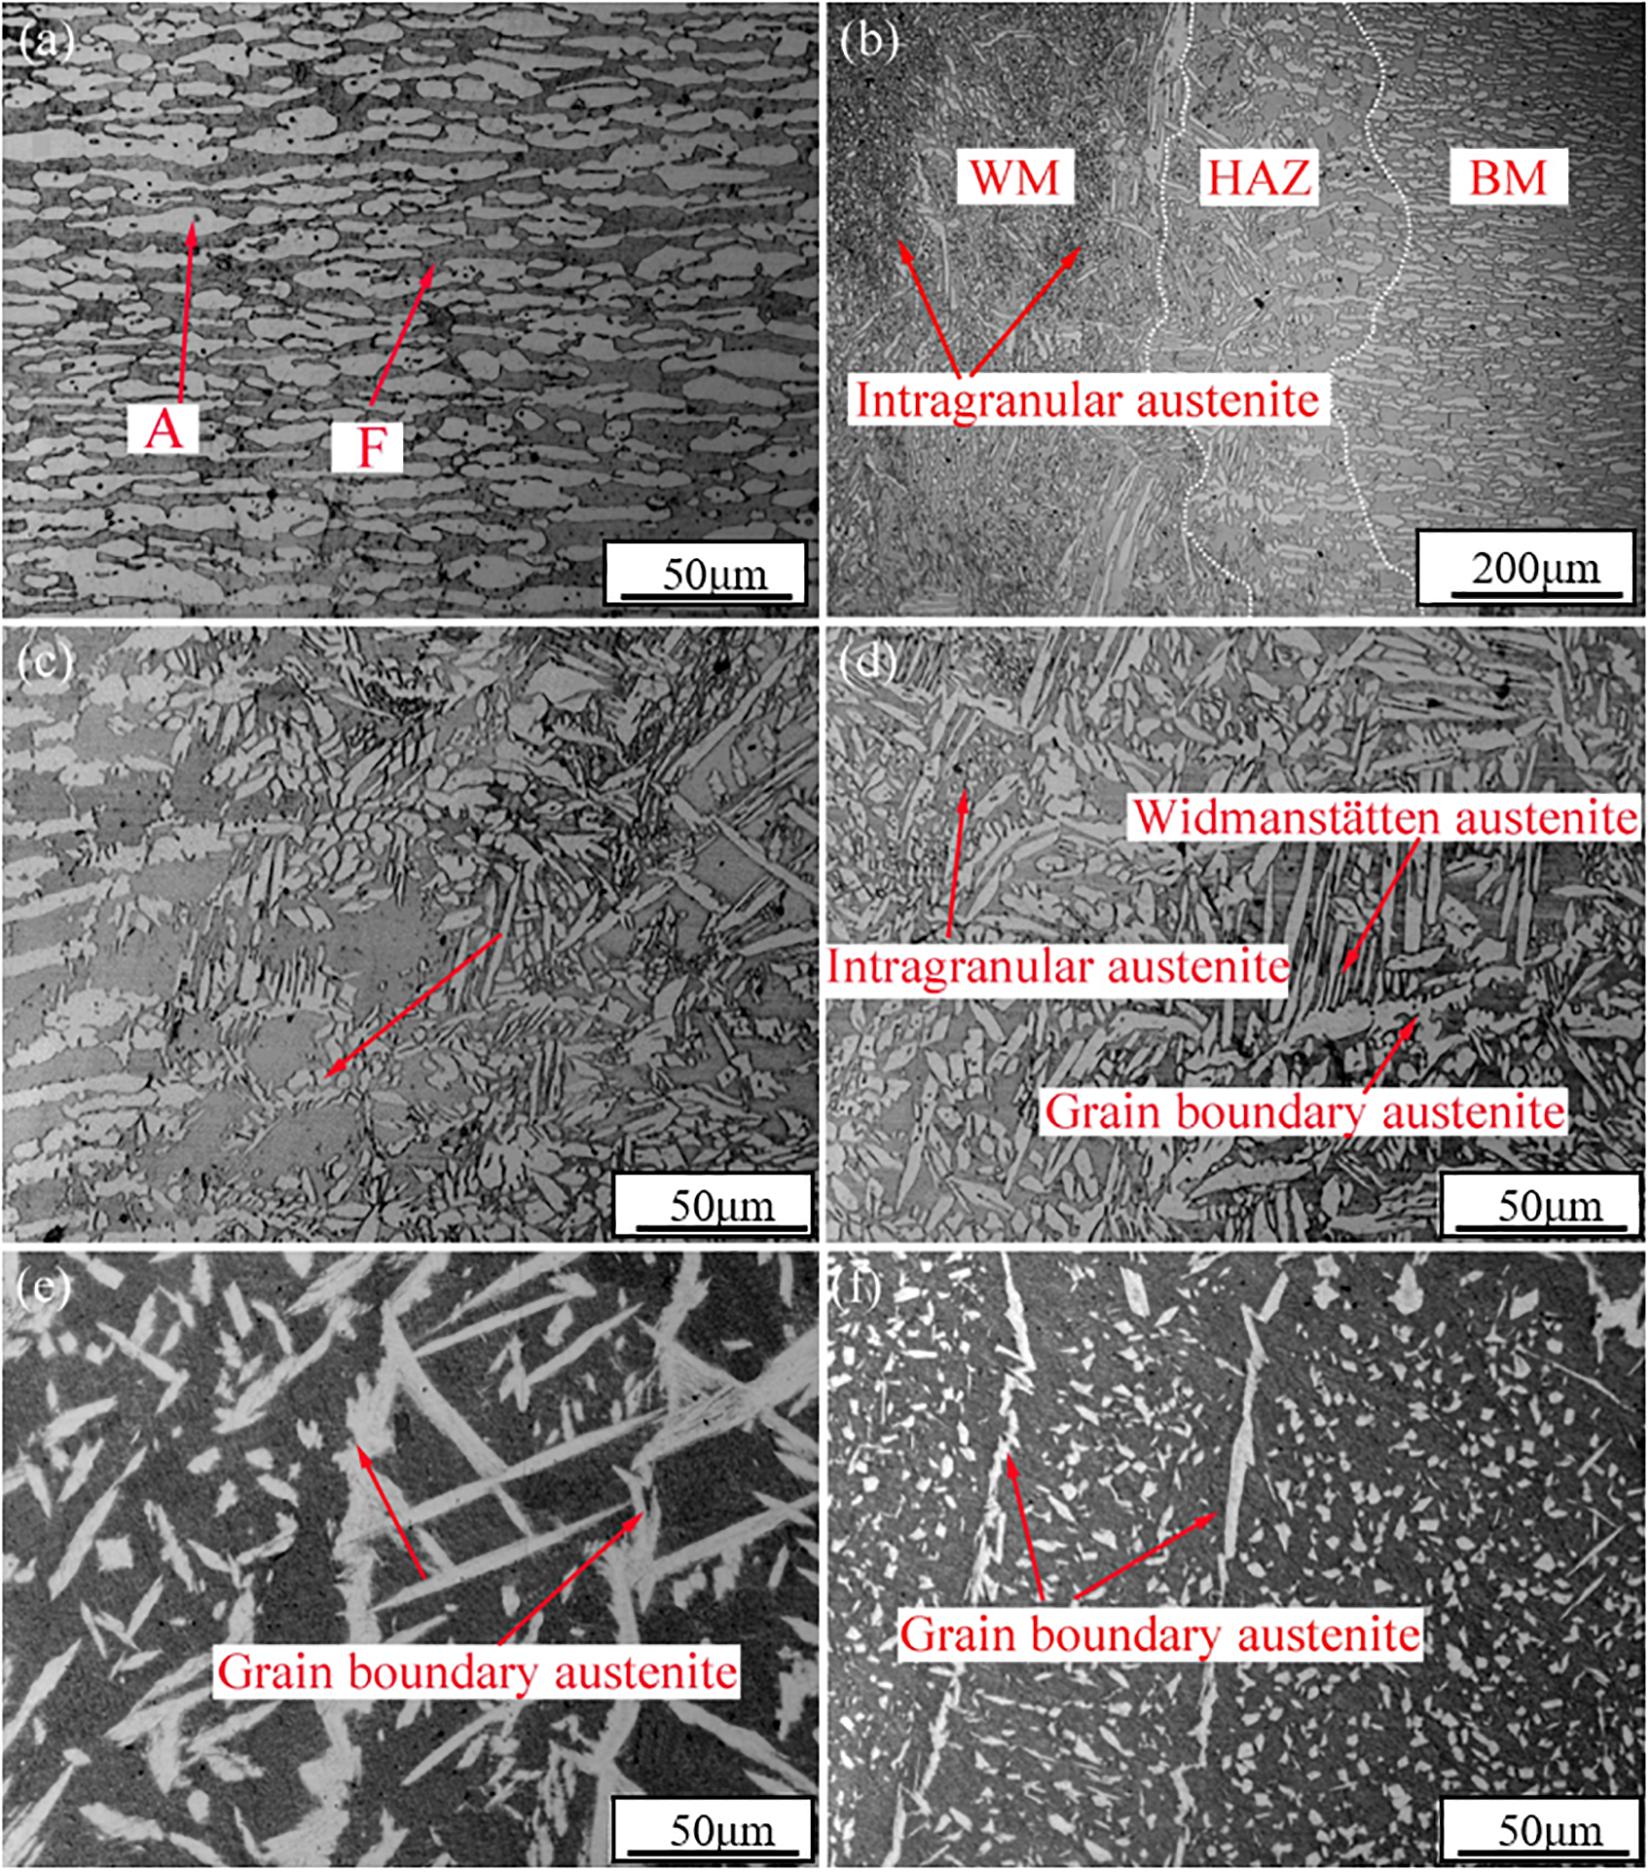
Figure 2. The optical microstructures in different zones of the joint welded by GTAW: (a) the base metal; (b) the joint; (c) the heat-affect zone; (d) the weld center; (e) the weld cap; (f) the weld root.
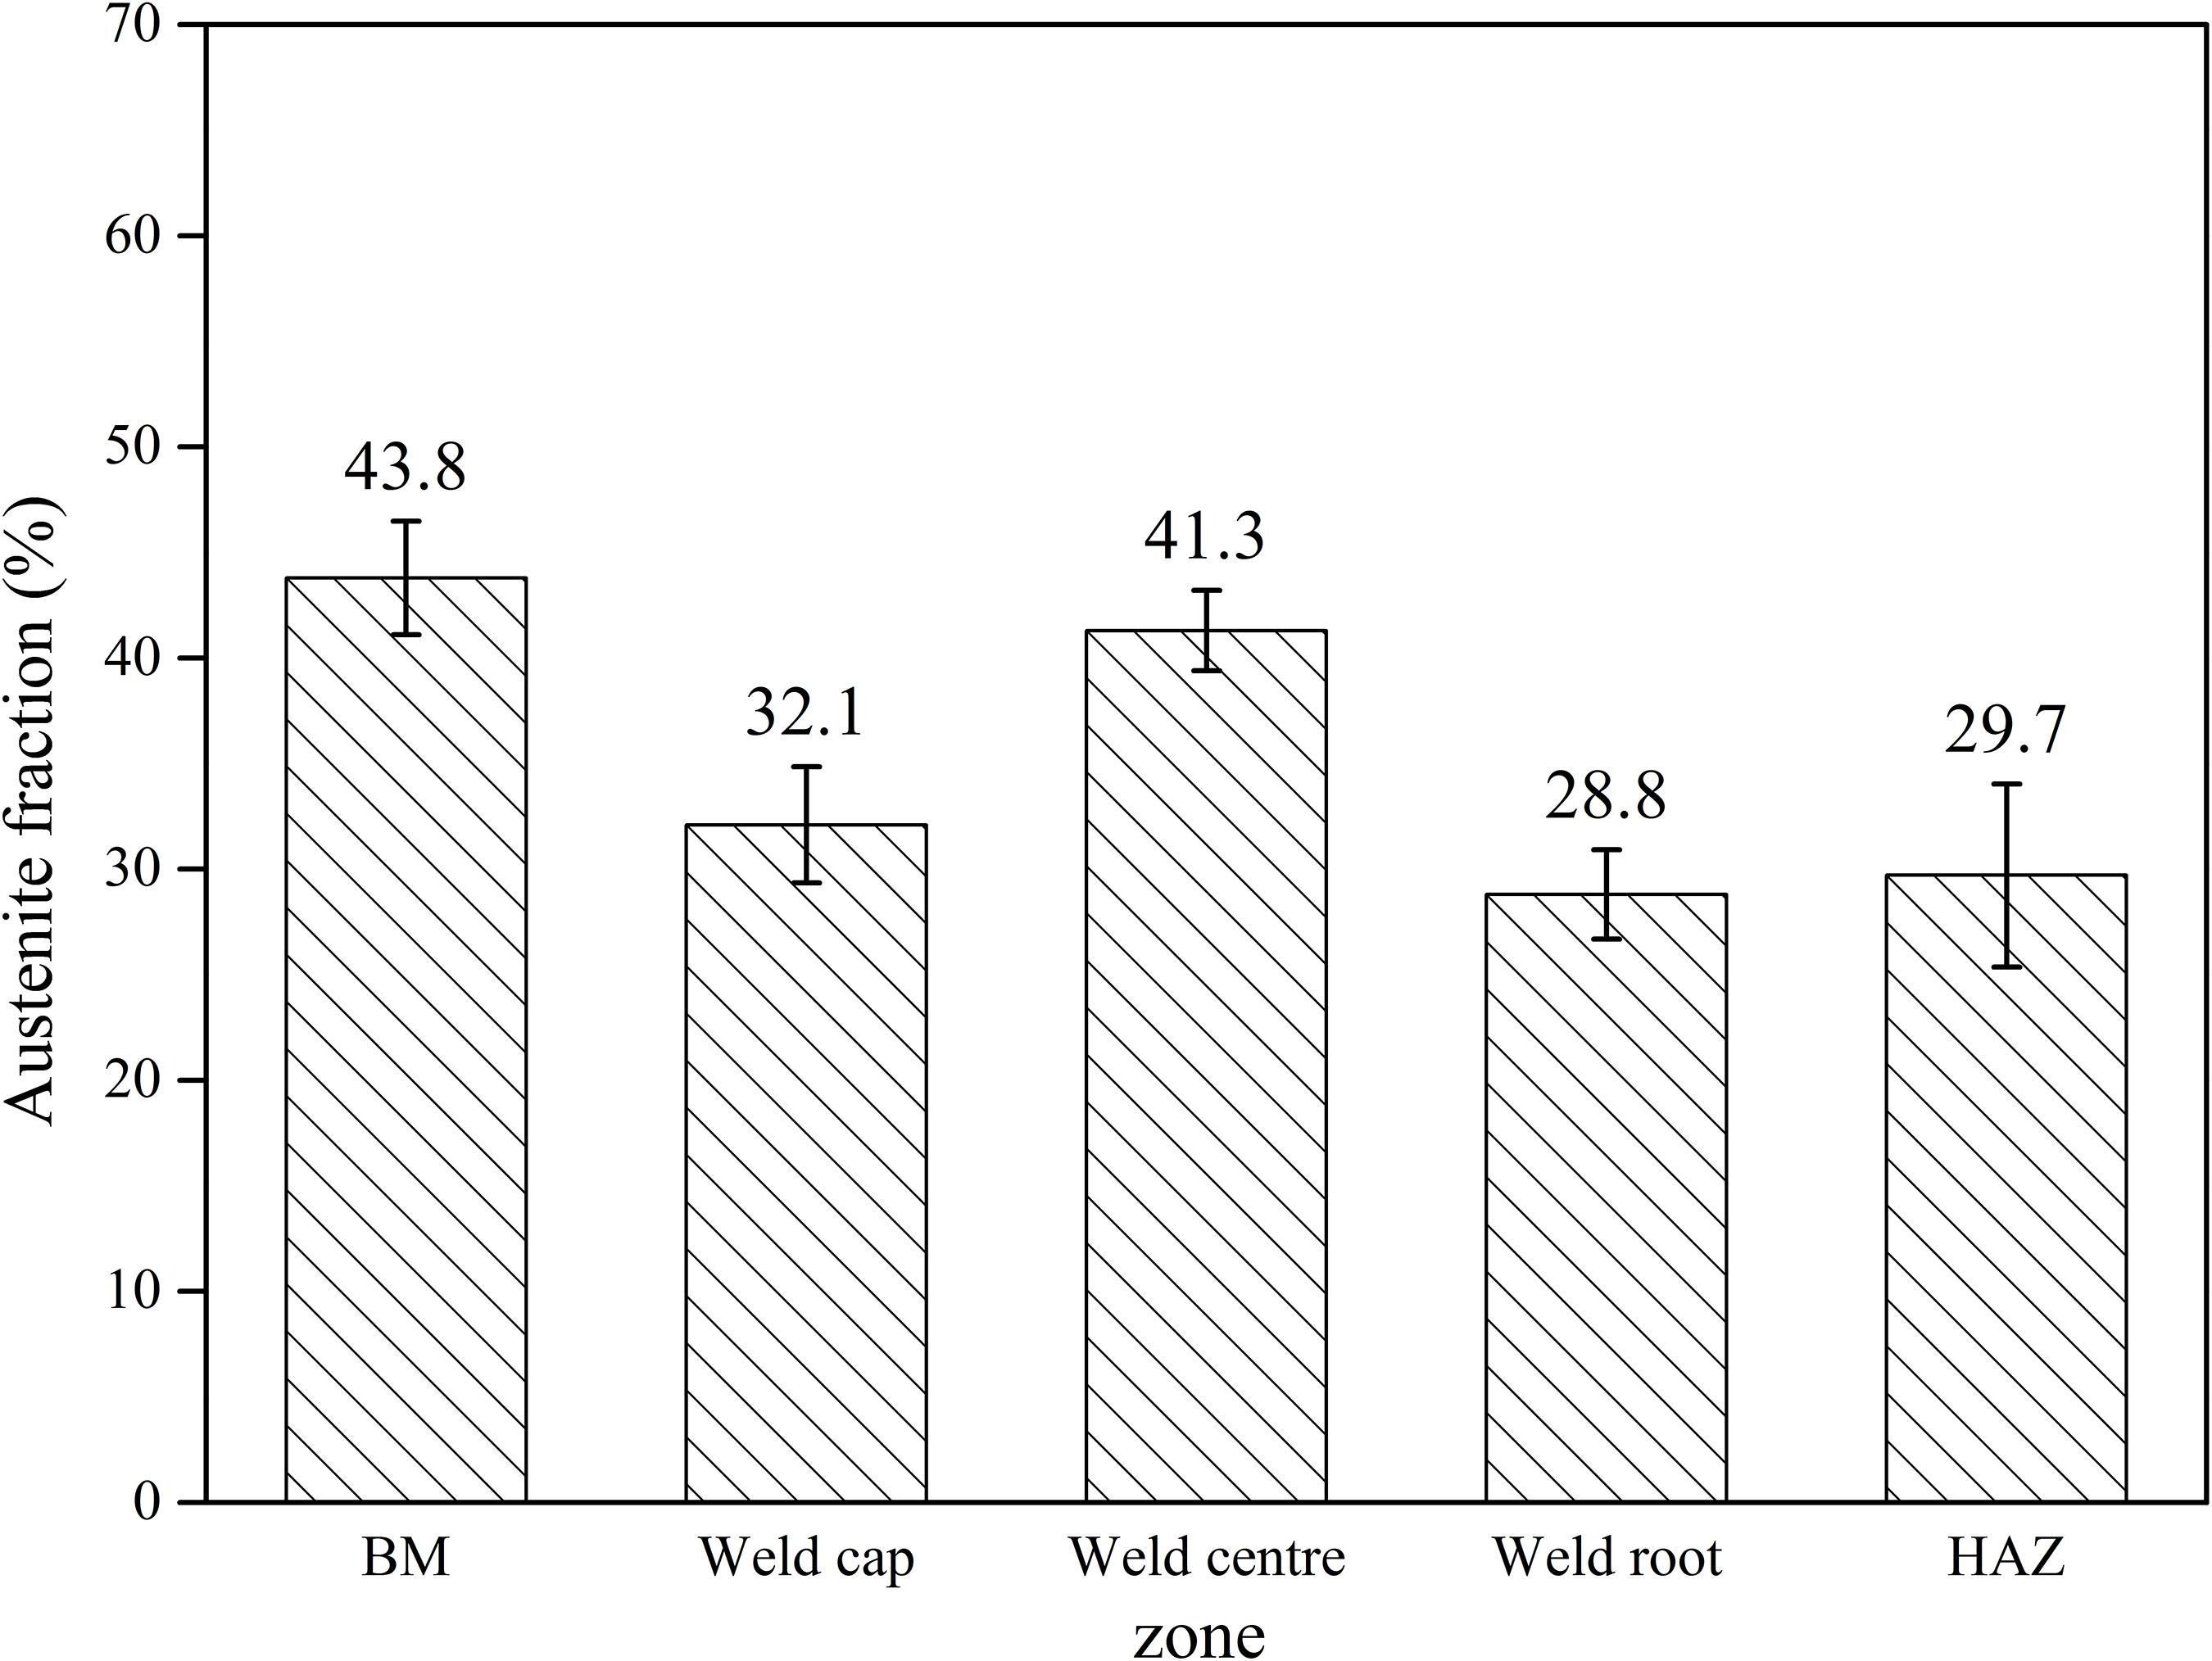
Figure 3. The average austenite contents in different zones of the weld joint counted by Pro-Image.
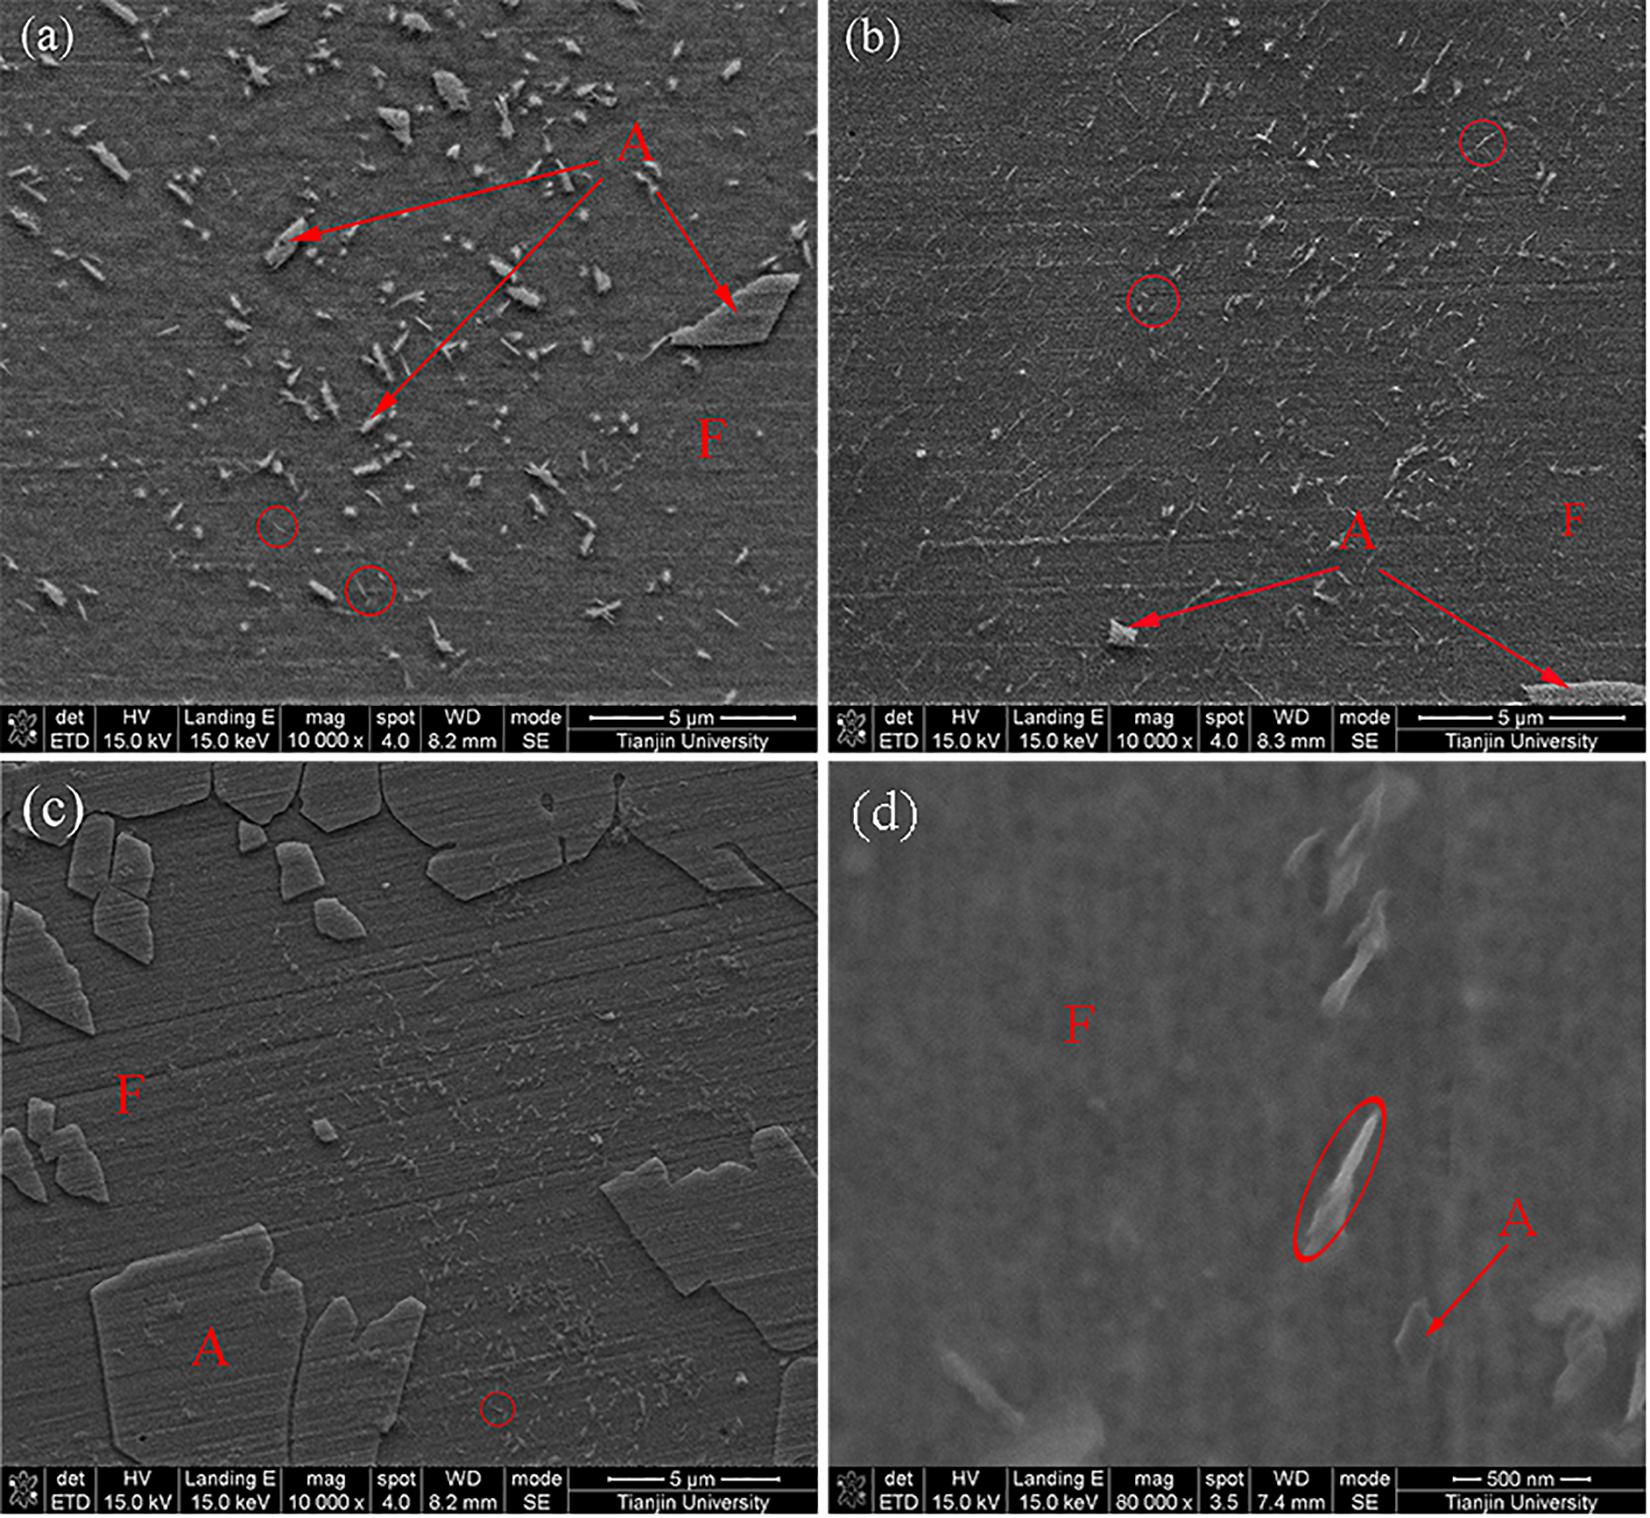
Figure 4. The precipitates observed by SEM: (a) the fine precipitates in the weld cap; (b) the weld root; (c) the HAZ; (d) the HAZ in high magnification.
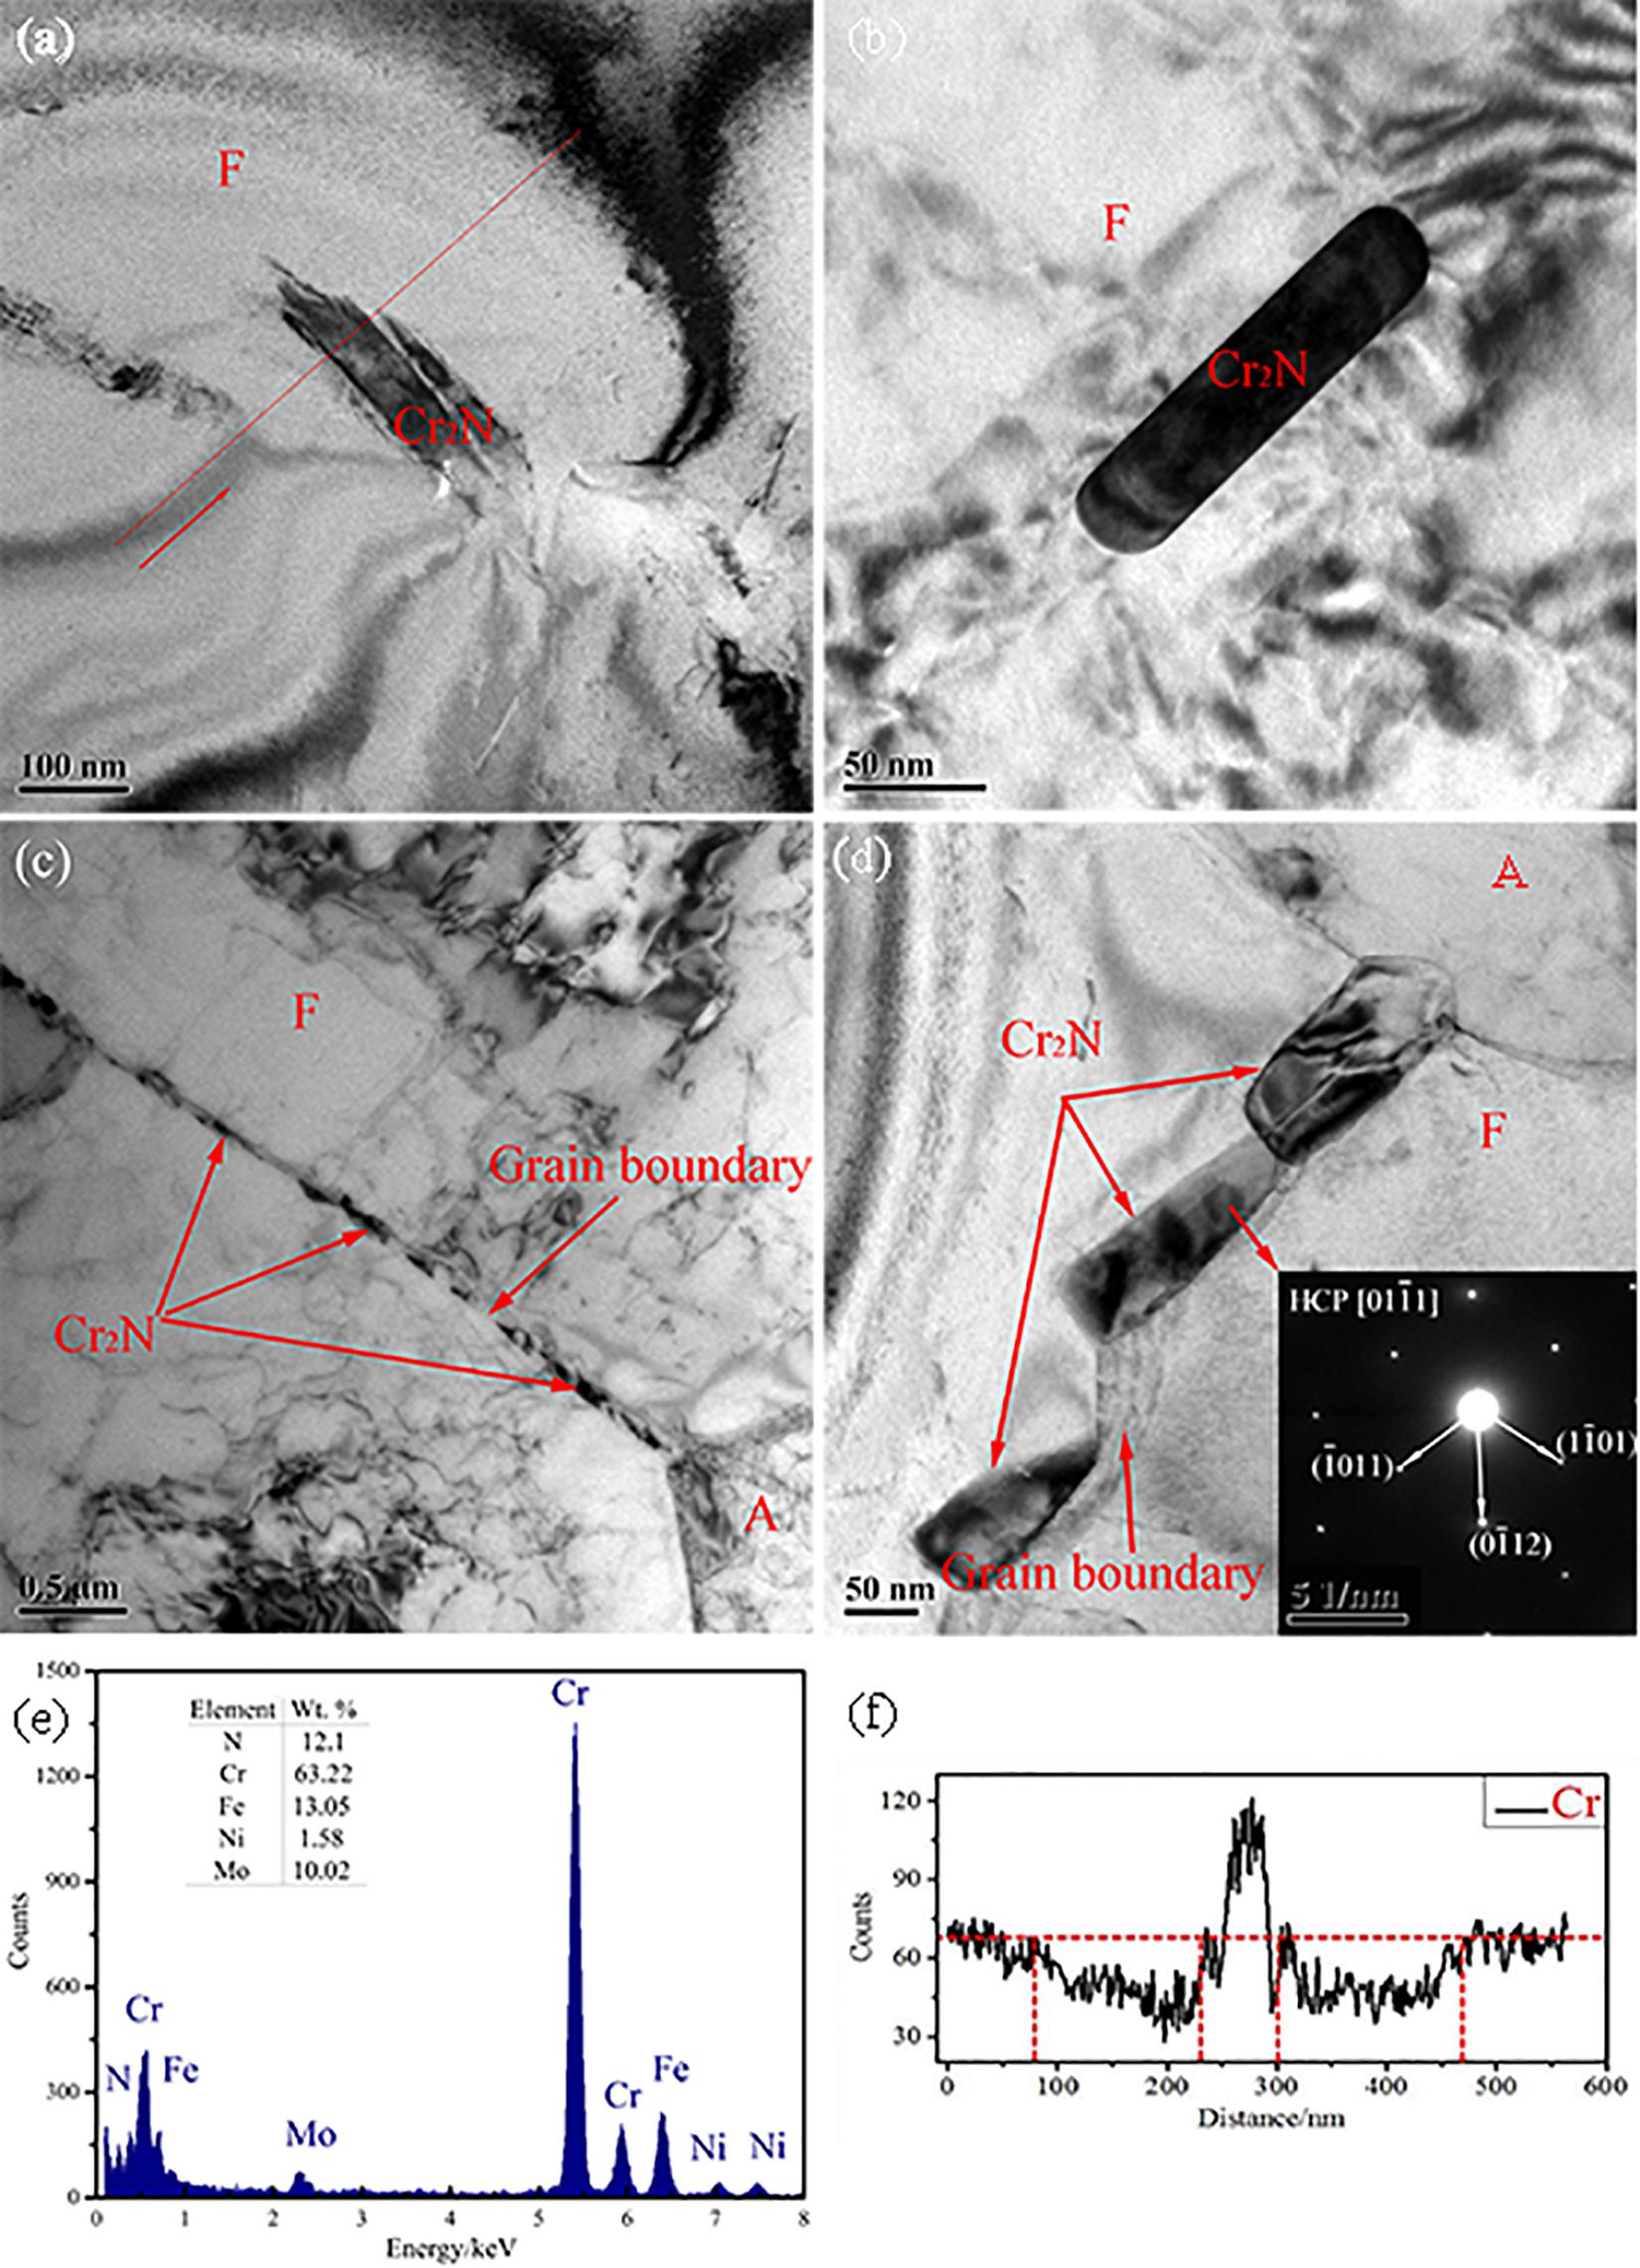
Figure 5. The Cr2N observed by TEM: (a) the weld cap; (b) the weld root; (c) the HAZ; (d) the HAZ in high magnification; (e) the chemical of the precipitate in panel (a) tested by EDX; (f) the line analysis of Cr content adjacent to Cr2N.
The austenite microstructure appears to be white and the ferrite matrix microstructure appears to be gray under the optical microscope. The base metal (labeled in Figure 2) consisted of elongated and banded structures of ferrite and austenite phases, and the molten metal turned to ferrite and then transformed to austenite with the decrease in temperature. According to the precipitating location of austenite, the austenite can be divided into three types: grain boundary austenite (GBA), Widmanstäten-type austenite (WA), and intragranular austenite (IGA) (Muthupandi et al., 2003; Zhang et al., 2012; Udayakumar et al., 2013).
The vicinities of the fusion line under different magnifications are shown in Figures 2b,c. Equiaxed grains were produced and maintained in HAZ. However, excessive growth was observed both in the grain boundary austenite and intra-grain austenite in the weld center. The very fine and dense intragranular austenite could be clearly observed in Figure 2d. There was a large difference in microstructure among the cap pass, the root passes, and the weld center. Firstly, the amount of austenite in the cap and the root passes were much lower than the weld center. The austenite content in the weld centre (41.3) was roughly the same as that of the base metal (43.8), while the austenite content in other areas was much lower than that of the weld center (approximately 30%). Successively, the austenite microstructure in each zone showed different morphologies. GBA and IGA were the main morphologies in the root and cap passes, while they were rarely to be observed in the WA. Eventually, the size of IGA in the weld root was smaller than that in the weld cap, as shown in Figures 2e,f.
Differences in quantity and size exist between these zones as shown in Figure 4, there were a smaller amount of precipitates observed in the cap than the root passes, and most of these precipitates were in micron size, while a large number of precipitates in nanoscale size could be found in the HAZ. The precipitates in nanoscale size were identified to be Cr2N and others were fine austenite in the cap and root passes through EDX and high-resolution TEM analysis. While the precipitates in the HAZ were mainly Cr2N. Besides, no Cr2N was found in the weld center. The amount of Cr2N in the HAZ was roughly three times than that in the weld cap and root.
The spectrum of the Cr2N and the line analysis of Cr content adjacent to the Cr2N in Figure 5a was shown in Figures 5e,f. The Cr2N presented a short rod-shape morphology, the width of which was about 50 nm. Besides this, a mass of Cr2N was also found at the grain boundaries in the ferrite under TEM shown in Figure 5c. The Cr2N could be divided into two types: intra-granular Cr2N and inter-granular Cr2N in the light of precipitation location. In addition, a Cr-depletion zone about 150–200 nm in both sides would appear around each Cr2N precipitate as shown in Figure 5f which was also reported in the DSS by Brytan et al. (2016) and Zhao et al. (2018).
Element Partition
The average contents of the main alloying elements (Cr, Mo, Ni, and N) in each phase of different zones obtained by EDS are listed in Table 3. The PREN values of different phases in the weld metal and HAZ were calculated in Table 3 and then presented in Figure 6.
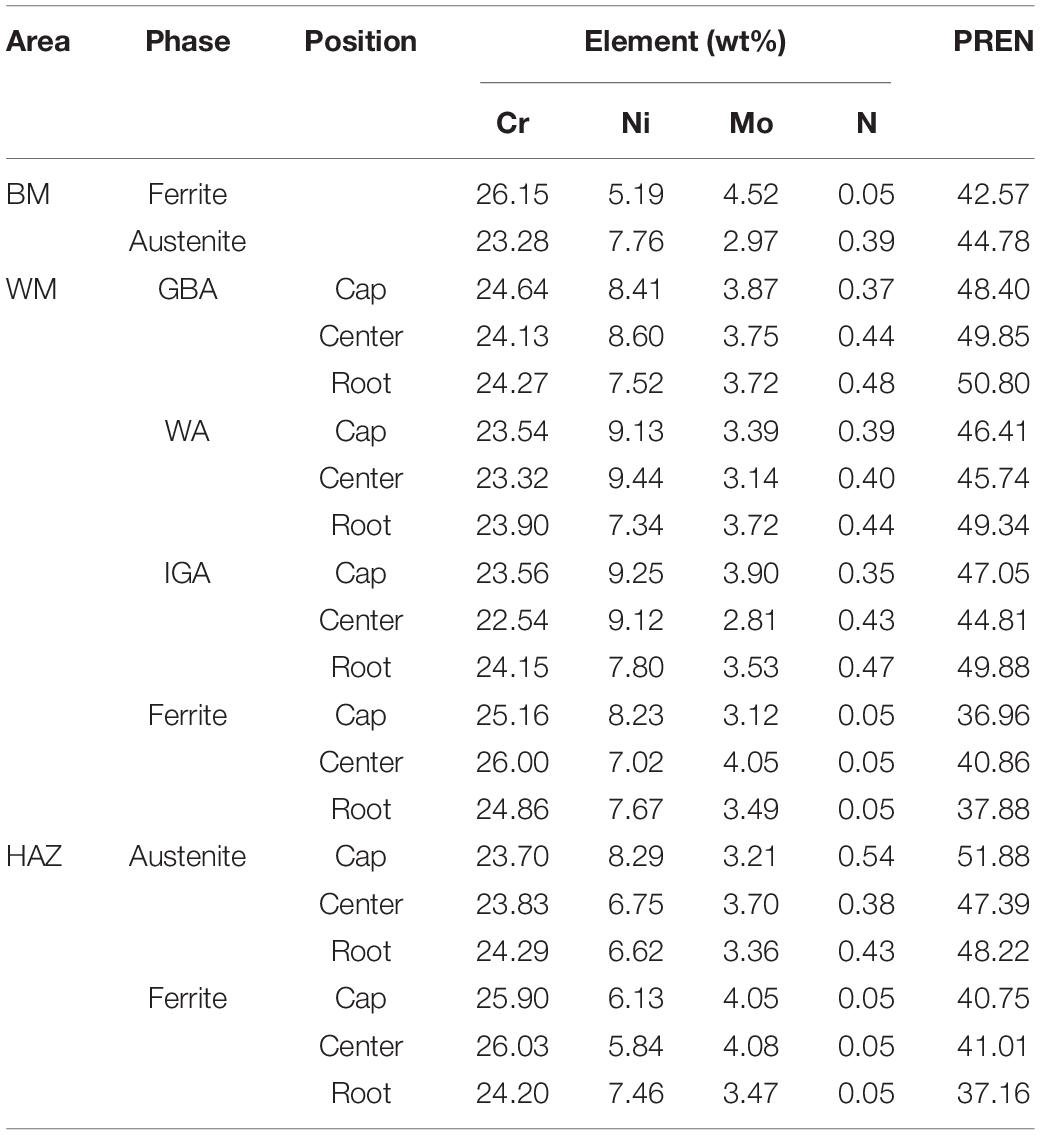
Table 3. Chemical composition and PREN value of different phases in different regions in the GTAW joint with pure Ar shielding.
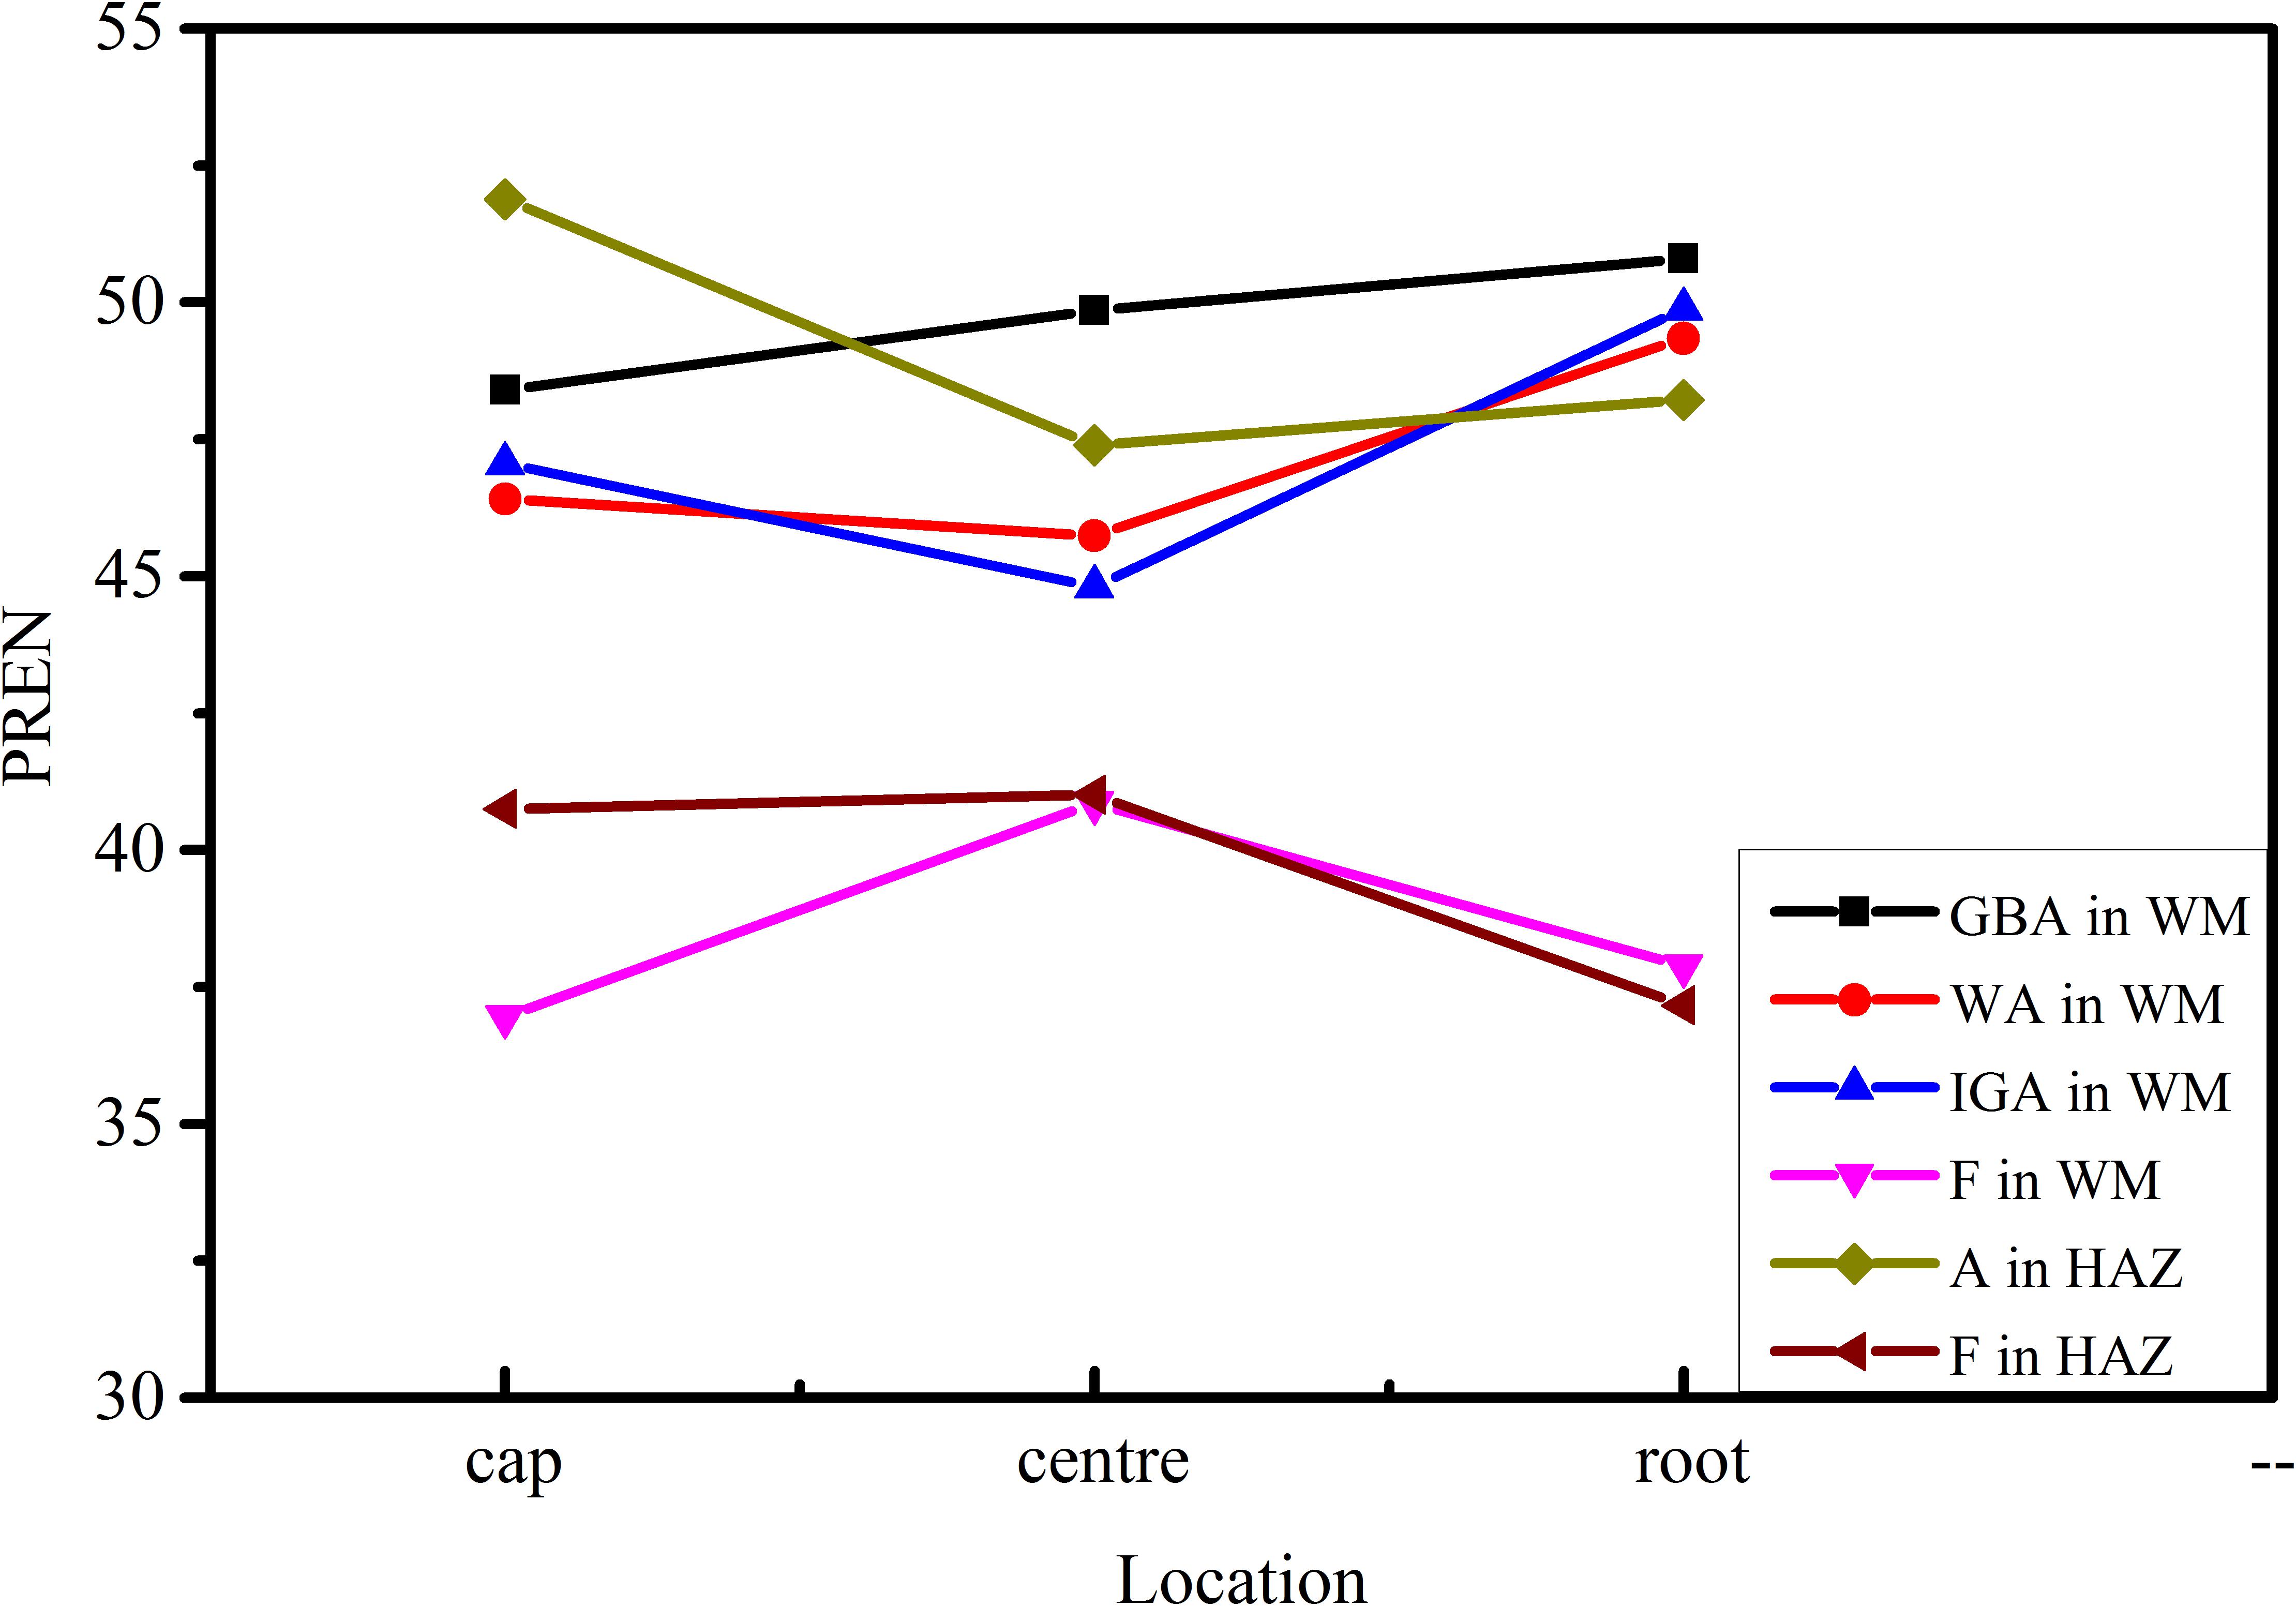
Figure 6. The PREN values of austenite and ferrite in the weld joint.
Table 3 showed that the alloying element diffusion of the weld center was more intense than the other regions, which could be confirmed by the bigger content difference in two phases on thickness and width directions of the plate in the weld center than that of other regions. In addition, contents of Cr and Mo were higher and Ni content was lower in grain boundary austenite compared with the other two types of austenite microstructure.
It can be seen from Figure 6 that all austenite microstructures present a higher PREN value than the ferrite in each region. Besides, the PREN value of austenite in the weld center preformed relatively lower than the weld cap and root except for the GBA in the weld metal.
Pitting Corrosion Resistance
Figure 7 presents the typical curves of current density against temperature for the different zones of welded joint and the BM after the CPT test in de-aerated 1 M NaCl solution. Figure 8 presents the pits morphologies of BM after CPT tests observed by SEM, the pits in the WM are presented in Figure 9, and the HAZ is shown in Figure 10.
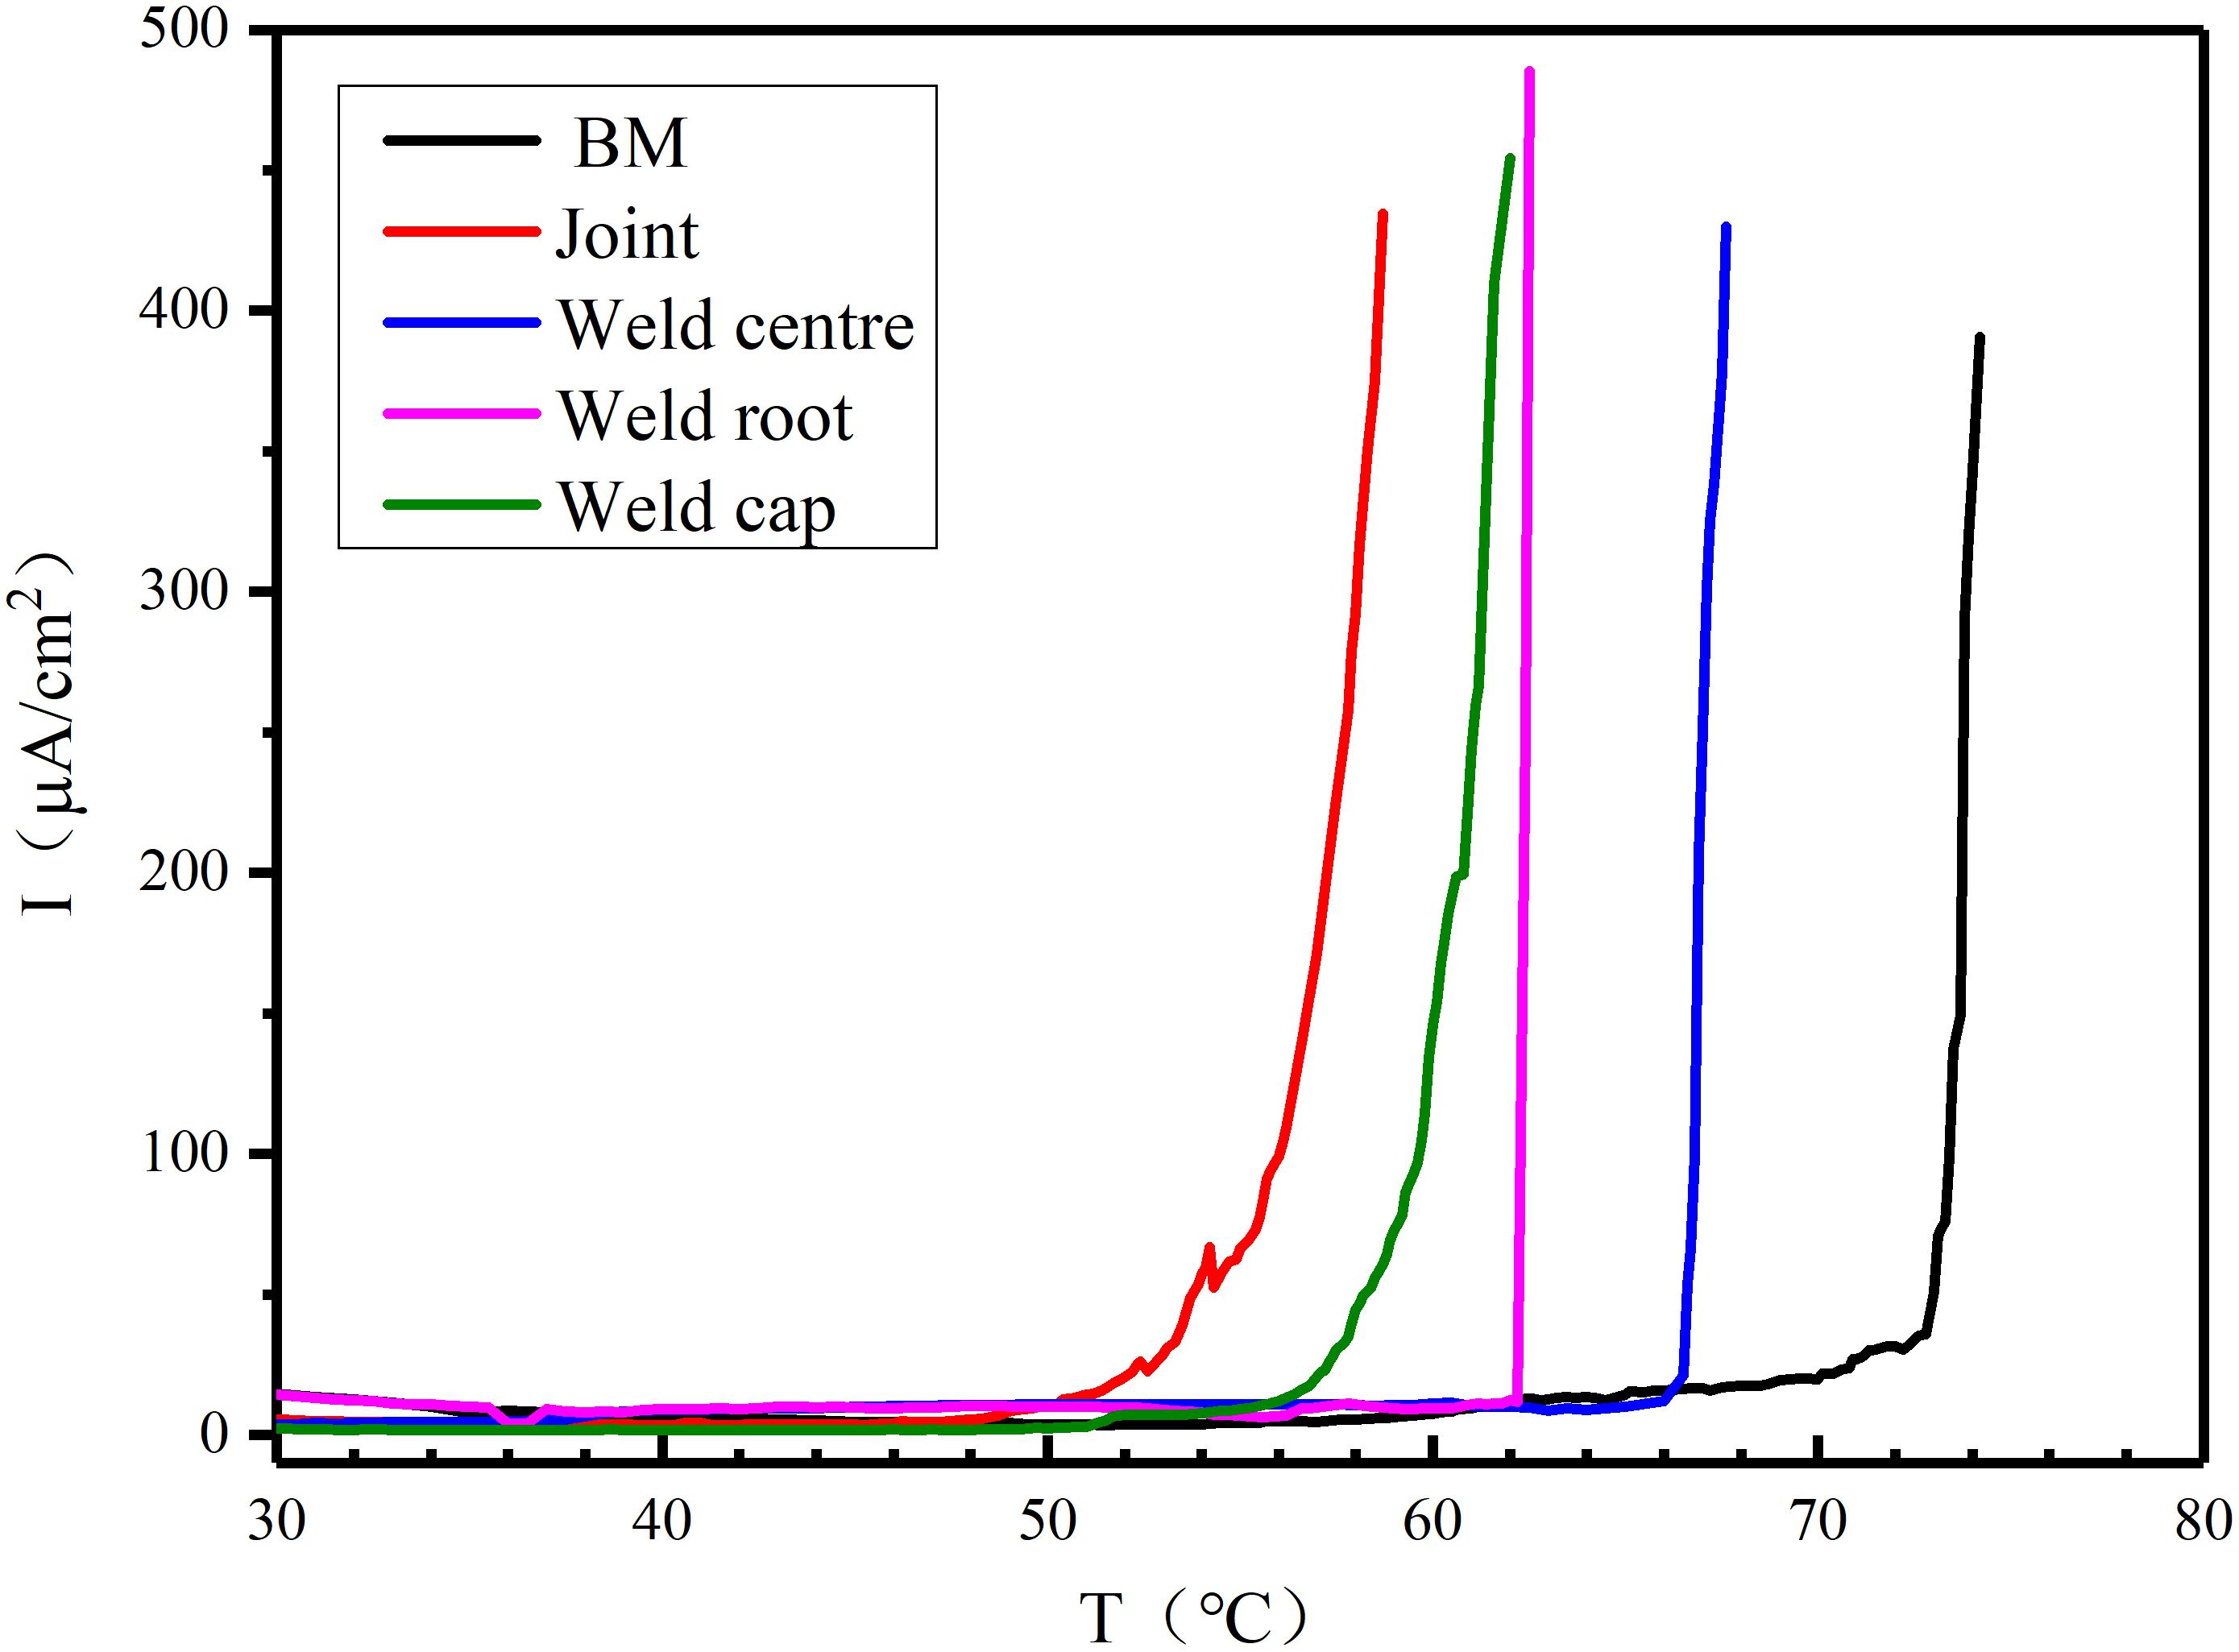
Figure 7. The typical curves of the current density against temperature obtained by the potentiostatic polarization tests in 1 M NaCl solution.

Figure 8. Pits morphologies in BM after CPT tests: (a) SEM and (b) high-magnification SEM.
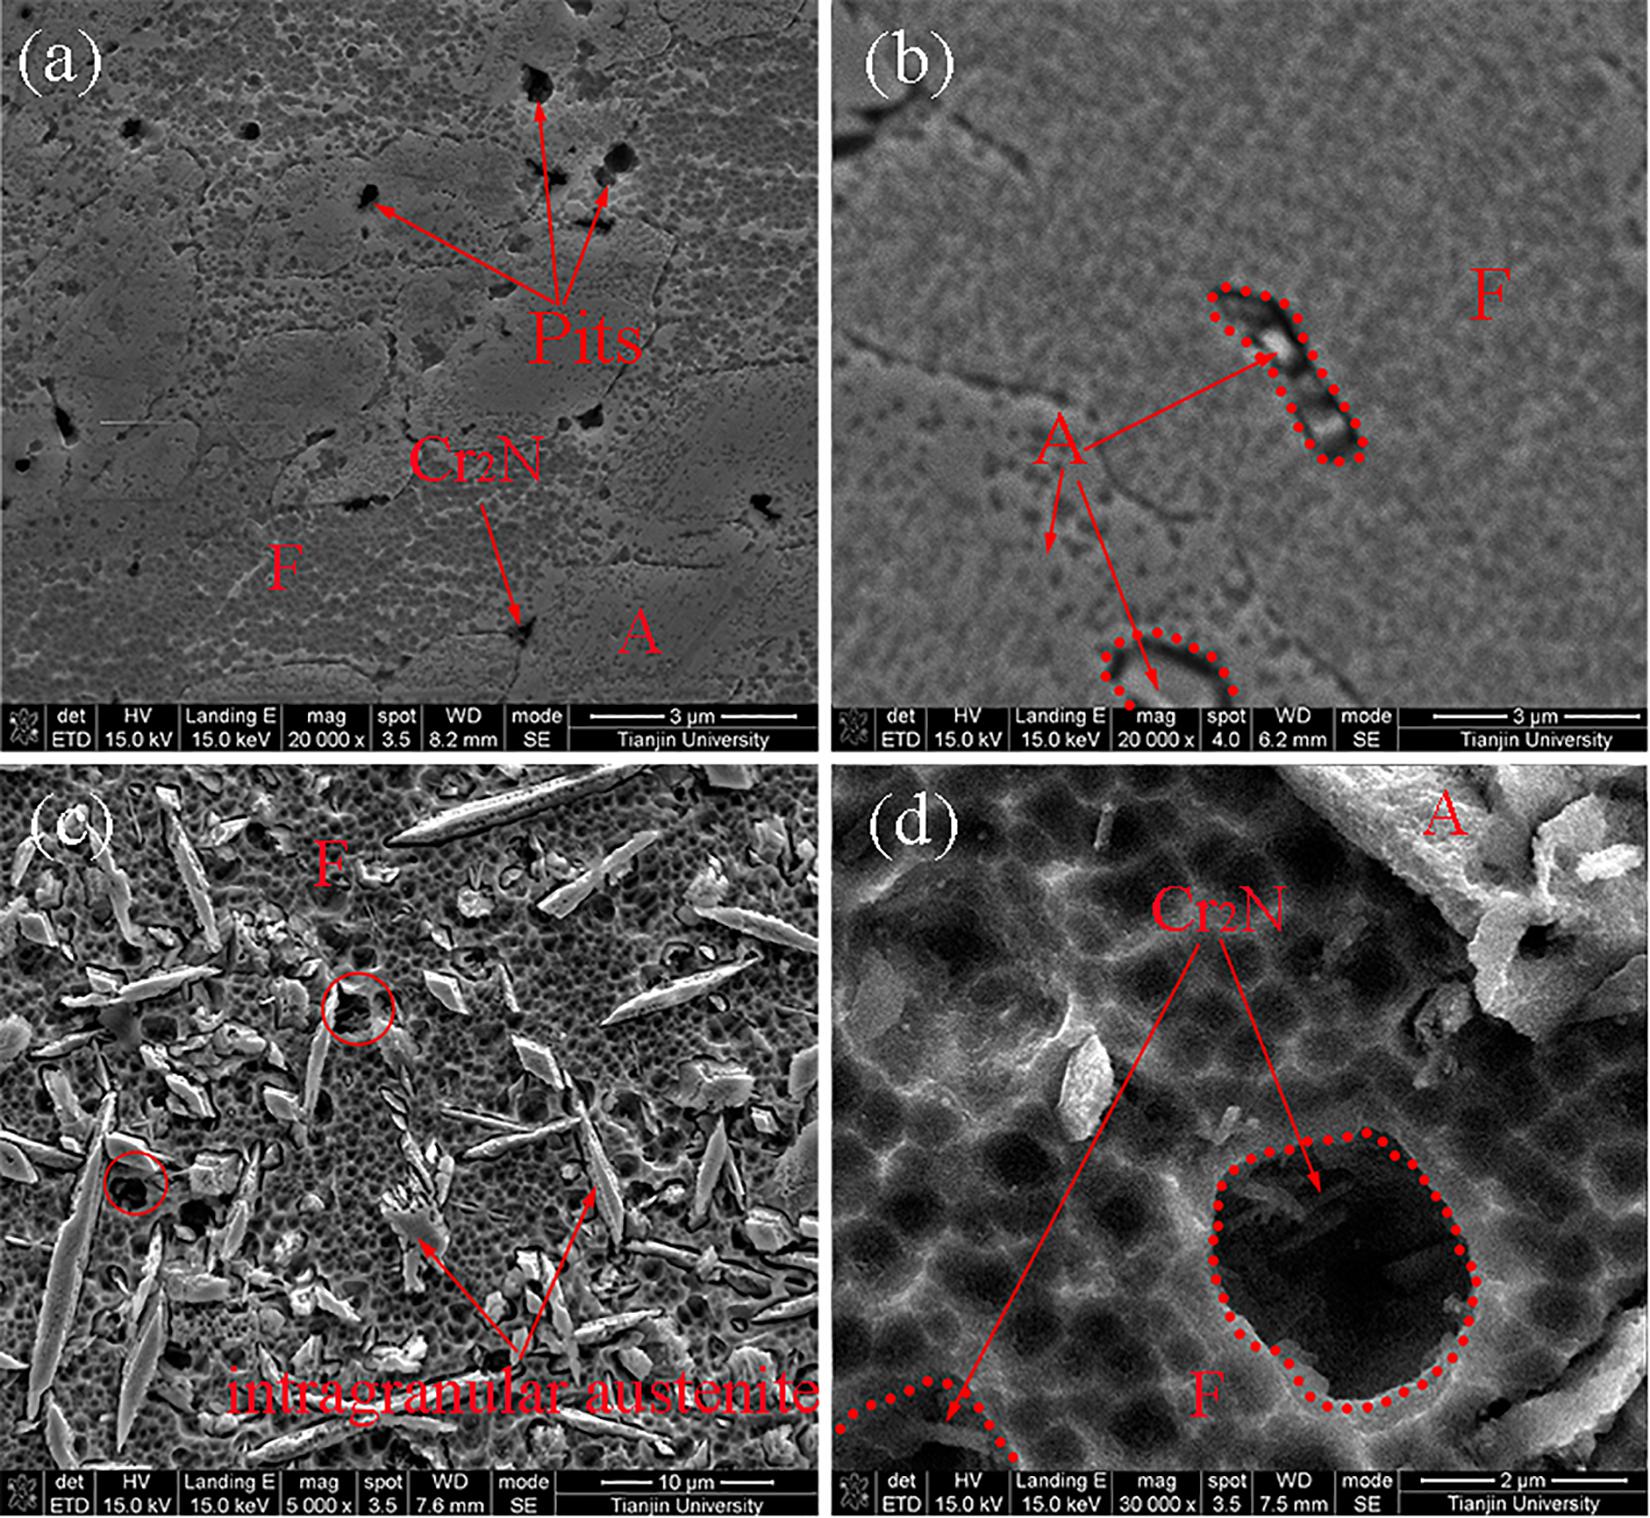
Figure 9. SEM pits morphologies in WM after CPT tests: (a) the weld cap, (b) the weld center, (c,d) the HAZ.
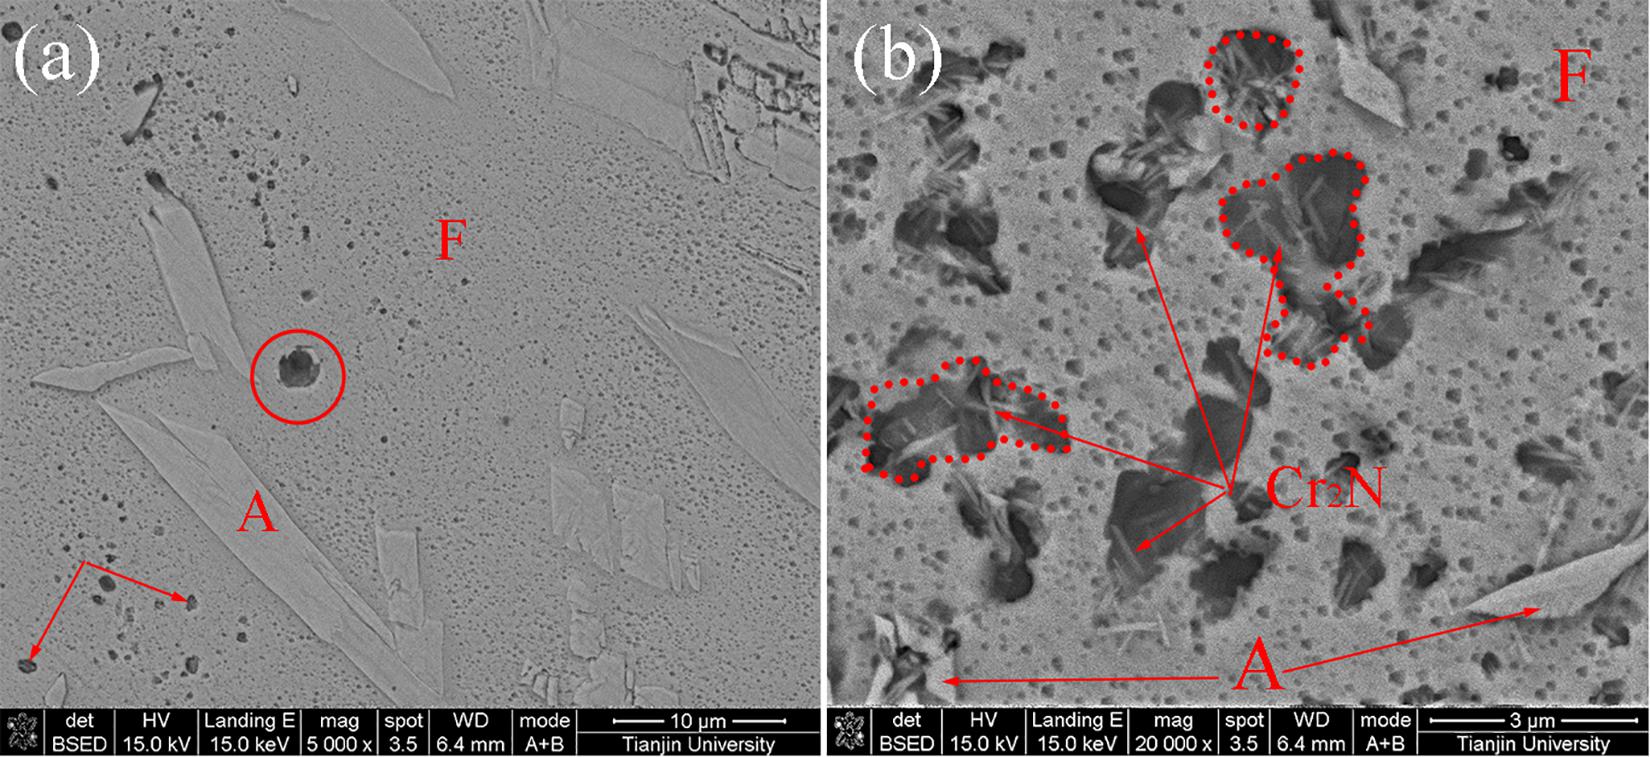
Figure 10. Pits morphologies in HAZ after CPT tests: (a) SEM and (b) high-magnification SEM.
It could be clearly observed that the value of the current density was much less than 100 μA/cm2 and close to zero in the initial heating process. As the temperature was gradually raised to the critical pitting temperature, a tendency of exponential growth of the current density could be found. The BM exhibited excellent pitting corrosion resistance with the CPT of 73.4°C. The CPTs of the weld cap, weld center and weld root in thickness direction were 59.7 66.7, and 62.2°C, respectively while the weld joint presented the lowest CPT value (56.1°C).
As shown in Figure 8, the pitting position was the interface between ferrite and austenite in BM. As shown in Figure 9, almost all pitting occurred at ferrite and the phase boundary of A/F in each zone of the weld metal, while the HAZ performed more serious pits than the WM in the ferrite under the same magnification as presented in Figure 10. The base metal in Figure 8 presented the lightest corrosion effect with only a few pits in the interface between the two phases than other regions in the joint. In addition, the pits in the weld cap, weld root and the HAZ were mainly in the surroundings of the Cr2N in ferrite phase, as shown in Figures 9, 10. Therefore, the pits in different regions performed variously in counts and morphologies. The pits occurred in the interface in the BM were larger but in a very small number, while in other zones the pits were smaller but with a higher content.
Electrochemical Impedance Spectroscopy Analysis
Figures 11, 12 show fitting results of electrochemical impedance spectroscopy (EIS) for different regions of the welded joint in the form of Nyquist and Bode plots. Relevant electrical equivalent circuits (EEC) were selected to interpret the data and illustrated in Figure 13. The results of the fitting parameter using the EEC are listed in Table 3.
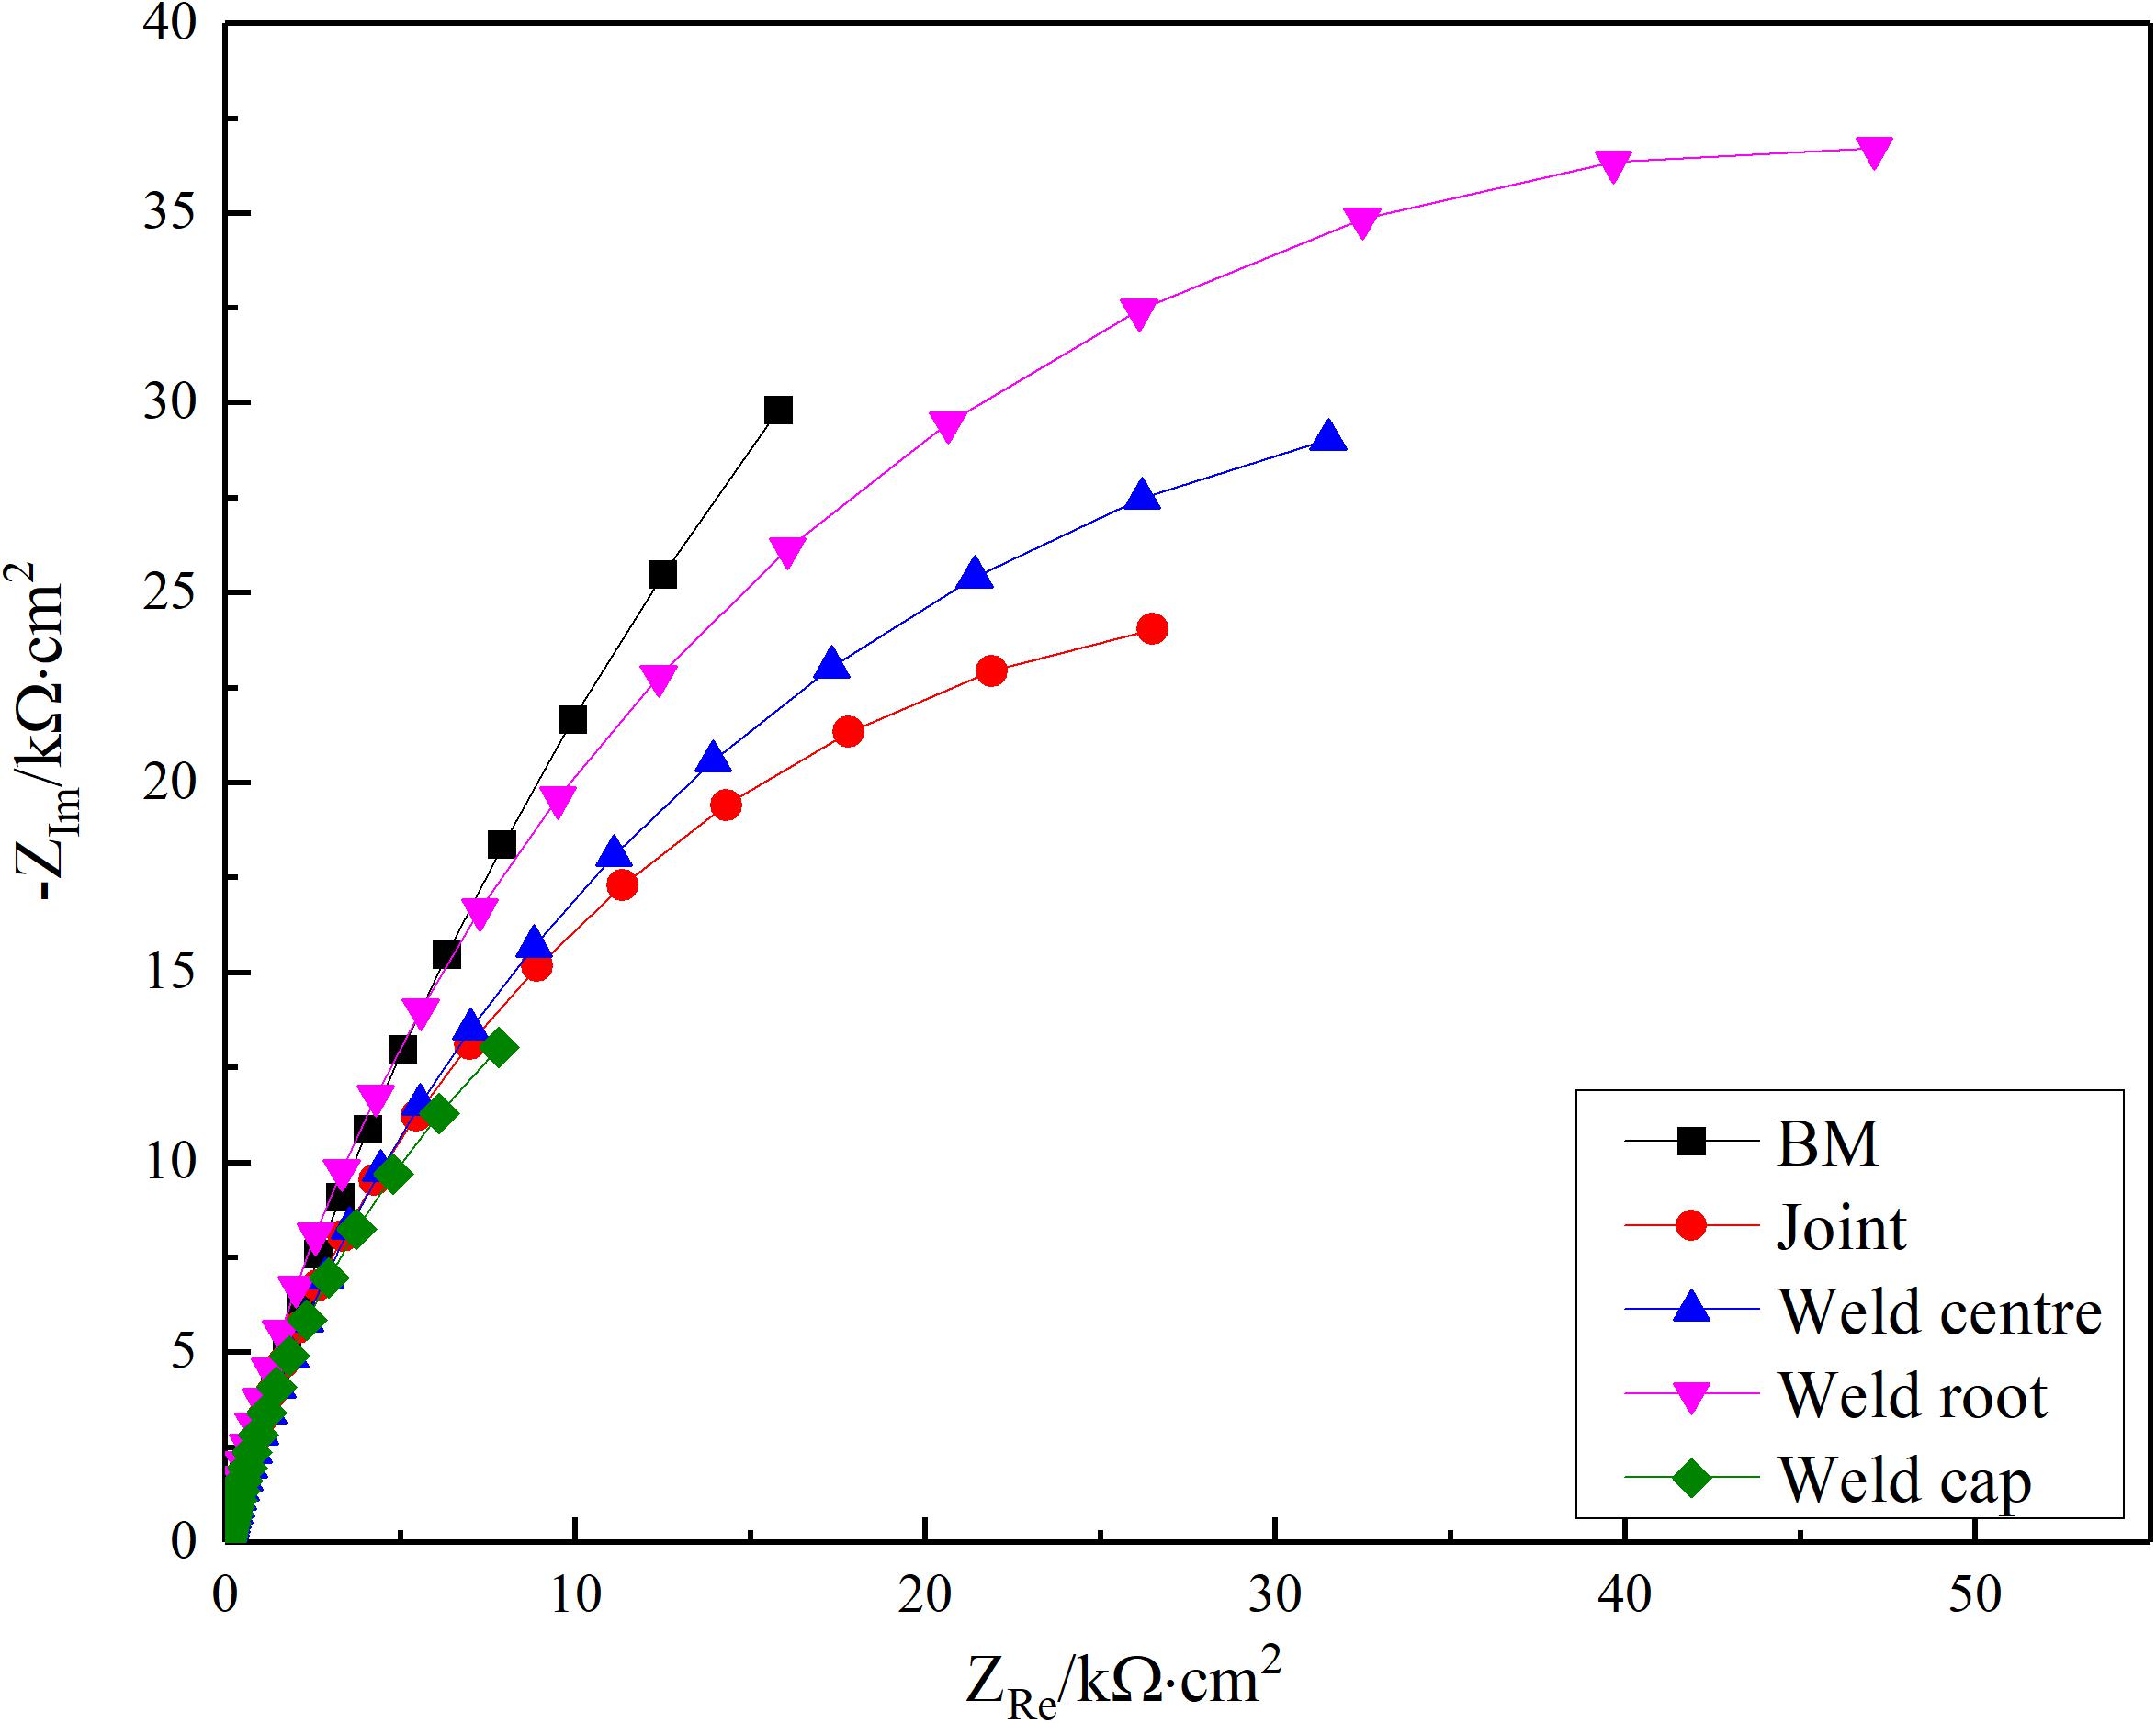
Figure 11. EIS fitting results of different zones of the weld joint: Nyquist.
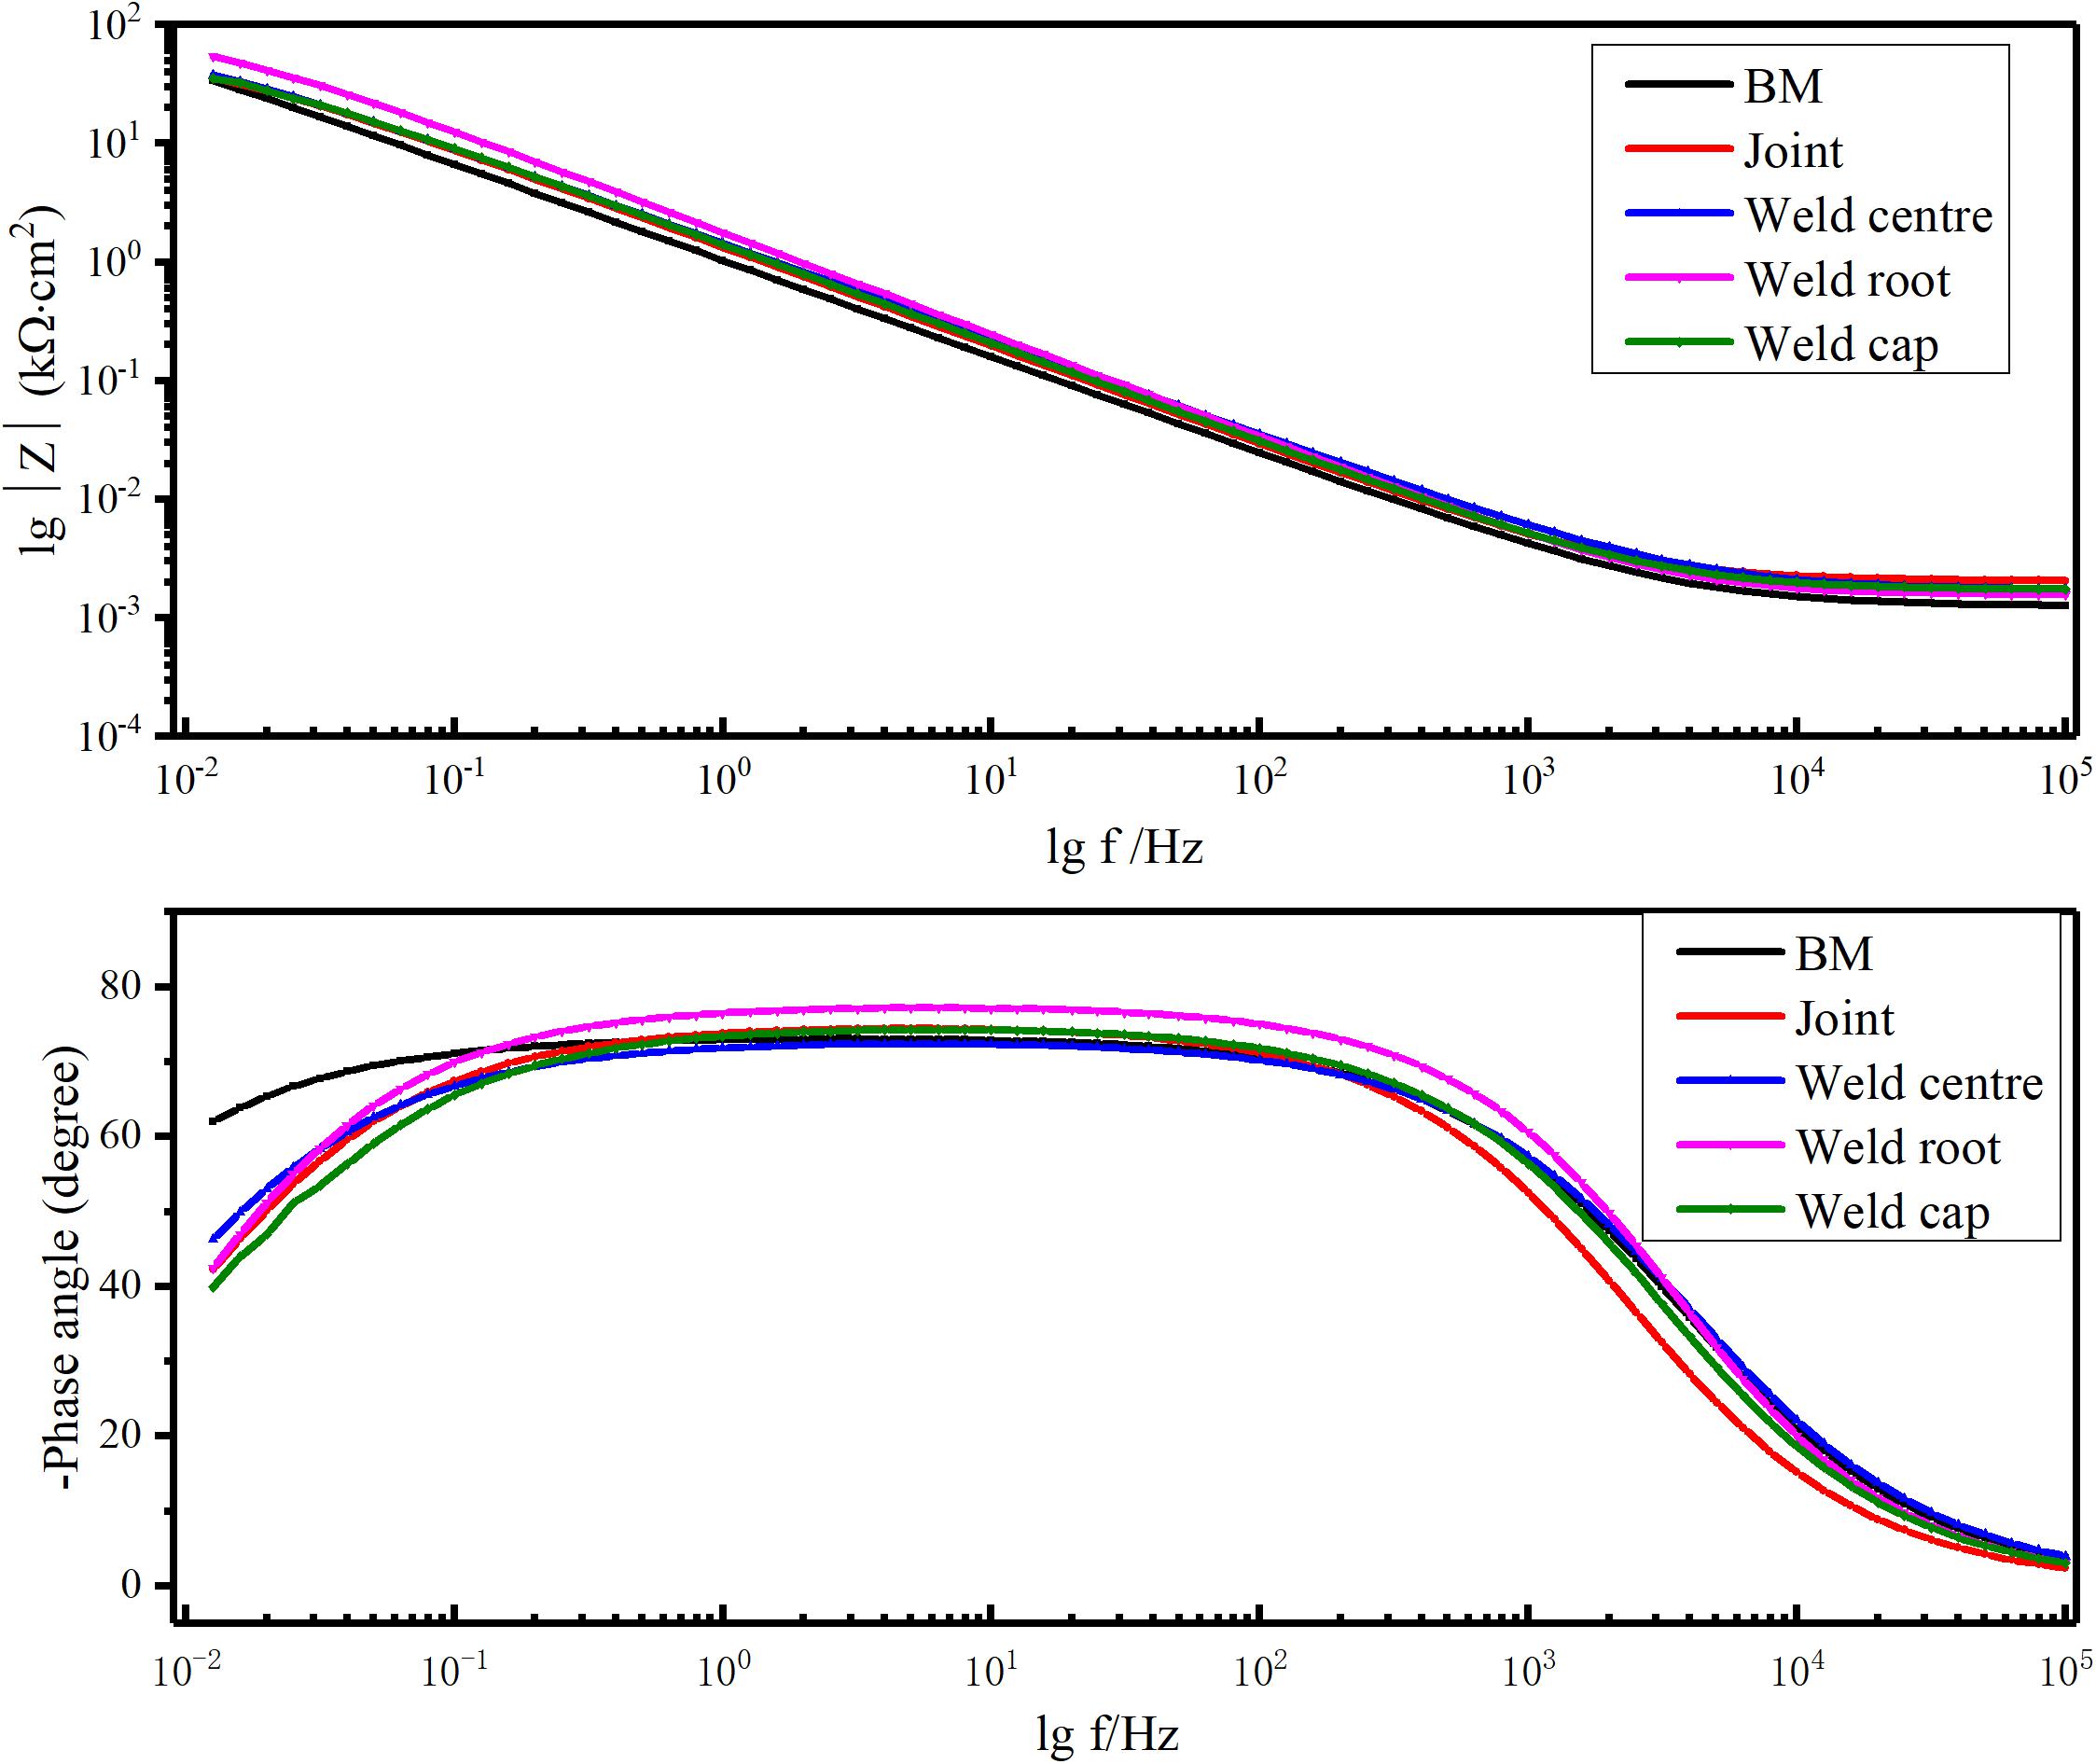
Figure 12. EIS fitting results of different zones of the weld joint: Bode.
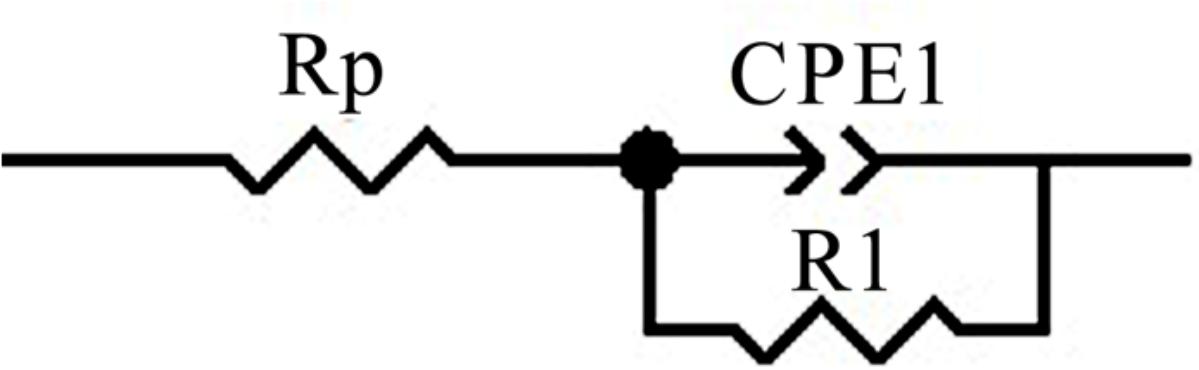
Figure 13. Electrical equivalent circuits (EEC) model to interpret the impedance spectra on the surface of samples.
In the Nyquist diagram, all the specimens had an apparent capacitive arc, and the diameter of the capacitive arc varied in the different test zones of the joint under the same test conditions. The impedance spectra did not show diffusion resistance, and thus the material transfer control could be negligible in this process. All the regions of the weld’s metal (weld cap, weld center and weld root) and the joint presented lower diameter of the capacitive arc than the BM.
In the Bode diagram, the amplitude and phase of all the samples kept the same variation trend with the frequency. The phase under high frequency was roughly constant and tended to be close to zero. In the region of intermediate frequencies, the phase angles reached their maximum values.
In Figure 13, the constant phase element (CPE) was used to represent the non-ideal capacitor which can be attributed to the inhomogeneous distribution of the surface of the work electrode. The impedance of a CPE was defined as
where Z represents the impedance of a CPE, Y is the magnitude of CPE, w and n are the angular frequency and the phase, respectively. The capacitor is considered to be ideal when n = 1, while capacitor is non-ideal when 0.5 < n < 1 due to the dispersion effect. The CPE is considered as a resistance when n = 0 (Macdonald, 1987; He et al., 2015; Cui et al., 2017). According to the n value in all different test zones of the welded joint, the CPE is closed to capacitance, double layer capacitance (Cdl) should be calculated as follows (Zhang et al., 2020):
In Figure 13, CPE in this circuit reflected the electrical characteristic of the passive film. The Rp is the resistance of the solution, R1 is the resistance of charge transfer of the passive film. The value of n, Y, R1, Rp, and Cdl were calculated by Zview-Impedance software from the best fitted EEC as shown in Table 4. The n values in all samples were relatively close. The R1 on the weld metal was changed from 53.8 to 96 kΩ cm2, while R1 of the base metal was 165.3 kΩ cm2 which was much higher than all the regions of the weld metal. The R1 of the weld root was a little larger than the weld cap. The trend of R1 showed good agreement with the pitting results, while Y was not always consistent with the CPTs. Besides, the trend of Cdl in different regions of the welded joint was similar to the Y.
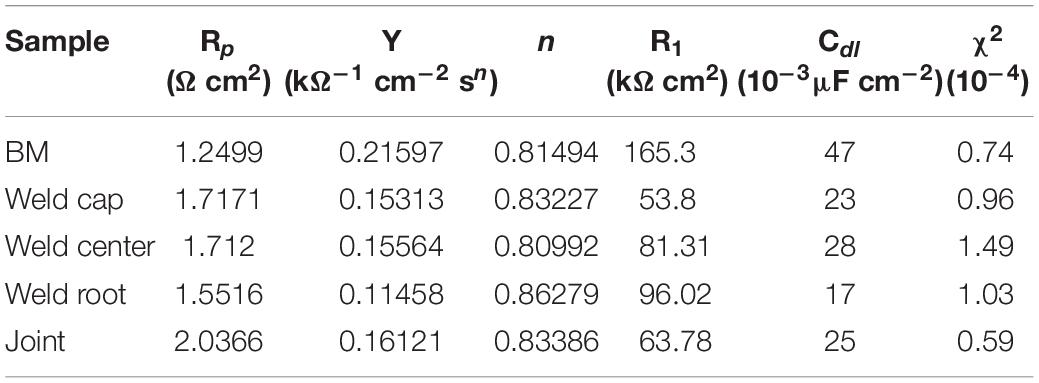
Table 4. The fitted electrochemical parameters for EIS of different regions.
Discussion
Microstructure Characterization
The base metal (labeled in Figure 2) consisted of elongated and banded structures of ferrite and austenite phases, which was the characteristic of being rolled. The difference in amount of austenite resulted from the multi-pass welding sequence. The austenite friction in HAZ and the weld root were close to 30% which is usually considered as the minimum value for theory and industry application. Besides, morphologies could be explained through the fact that the weld cap and root could not experience preheating or reheating respectively, which led to less nucleation and growing time for austenite. The difference of IGA in the weld cap and root was mainly caused by the heat input (the cap: 0.75 kJ/mm; the root: 0.45 kJ/mm). The higher heat input resulted in a longer growth time for austenite in the weld cap. Therefore, the microstructures of the joint were resulted from the combined effect from the heat input and welding sequence of the multi-passes welding. Besides, the width of the HAZ was approximately 150–200 μm, which is much narrower than the same region investigated by other researchers due to the larger thickness, lower initial temperature and smaller heat input of the base metal (Zhao et al., 2018). A narrower HAZ would reduce the influence of deterioration because the harmful precipitates have less possibility to occur (Muthupandi et al., 2003).
Cr2N was found in ferrite and the interface of A/F, the weld cap, root and HAZ as shown in Figures 4, 5. The pretty fine Cr2N in the weld cap have not been reported by earlier researchers. At the solidus temperatures, the nitrogen stability in ferrite was high, but the solubility decreased and thus the ferrite became supersaturated in nitrogen during cooling process. Therefore, the Cr2N was prone to precipitate at the ferrite phase due to the extremely small solubility of N in ferrite (theoretical maximum: 0.05 wt%) (Tavares et al., 2007; Zhang et al., 2012). The weld cap, weld root and the HAZ experienced larger cooling rate than the weld center so that the nitrogen did not have enough time to diffuse from ferrite to austenite. Hence, the above-mentioned zones were the priority nucleation position for Cr2N.
Element Partition
The microstructure and the partitioning behavior of alloying elements play an important role in determining the pitting resistance of the SDSS. Alloying elements tend to solute into different phases during the rapid heating and cooling process in the welding process. As is generally accepted in solution-treated SDSS, the ferrite stabilizing elements (Cr and Mo) were obviously partitioned in the ferrite, while the austenite was enriched with the austenite stabilizing elements (Ni, and N), as shown in the Table 3.
Due to the extremely small solubility of nitrogen in ferrite compared with other elements, the content of N in ferrite was considered to reach its theoretical maximum even considering the measurement error. The saturation value in the BM was about 0.05 wt% although the welding and heat treatment process would slightly change the nitrogen contents to an extent low enough to ignore (Cervo et al., 2010; Zhang et al., 2012; Jiang et al., 2014; Hosseini et al., 2016). Thus, this value can be generally adopted as the nitrogen contents in ferrite of each region.
The HAZ underwent a fast cooling, and as a result the alloying elements had no time to diffuse into the two phases sufficiently. While the weld cap and the weld root had a relatively large cooling rate compared with the weld center. Thus, the contents of alloying elements in the two phases were roughly smaller in these zones. The content differences in austenite could be interpreted by the kinetics theory. The grain boundary austenite was nucleated and grew prior to the other two types of austenite because it has a higher crystal boundary energy. Therefore, the element diffusion occurred and produced a great difference between ferrite and the side-plate WA.
Pitting corrosion resistance was primarily governed by the austenite amount and the distribution of alloying elements, and it could also be influenced by the secondary phase. A common method to judge the resistance to pitting corrosion of stainless steel was to use the PREN. In general, a higher PREN represents better resistance to pitting corrosion (Merello et al., 2003). The global pitting corrosion resistance of the SDSS joint was determined by the PREN of the weaker phase (with less resistance to the medium). The PREN was related to three essential alloying elements (Cr, Mo, and N), and the PREN of each single phase in different zones of the joint was specifically calculated by the following formula:
The coefficient (R) for the nitrogen content recommended by other researchers was from 16 to 30 for the DSS (Zhang et al., 2009; Yang et al., 2012; Cui et al., 2017). While the most common value was taken as 16, 20, and 30. Kim et al. calculated the difference of PREN between the ferrite and austenite using two nitrogen factors, and found it did not correspond to the initial pitting corrosive location when R was 16 (Kim et al., 2012). Zhang et al. (2012) chose 20 as the coefficient due to its accuracy in nitrogen content. Thus, R = 30 is adopted in this paper with the consideration of the unequal solubility of N in two phases and the actual corrosion position which would be presented later.
The PREN values of austenite are much higher than the commercial stainless steel (about 37) (Zhang et al., 2012, 2017; Brytan et al., 2016), and the ferrite with a lower PREN value in each region was estimated to be the weak phase which was prone to experience selective corrosion first, especially in the root. Besides, the PREN value of the weld center preformed relatively lower than the weld cap and root due to the low Cr and Mo contents which could be attributed to the diffusion.
Pitting Corrosion Resistance
The typical curves in Figure 7 implied that the specimen surfaces were well protected by the passive film at low temperature. As the temperature was gradually raised, a tendency of exponential growth of the current density indicated that the pitting occurred at the surface of specimen. The CPT of BM was much higher than the other zones of the welded joint and the second generation of the DSS [approximately 50°C (Brytan et al., 2016)]. The weld center preformed higher CPT with higher austenite since it has lower PREN. Even though the HAZ was too narrow to be detected individually, the CPT of the HAZ can be considered as much lower than other two zones. Because the joint was a mixed microstructure including the BM, the HAZ and the weld center, this also reflected the fact that the HAZ was the weakest zone in the joint to resist corrosion.
The pits morphologies in the different areas of the welded joint after CPT tests observed by SEM are presented in Figures 8–10. Almost all pitting occurred at ferrite and the phase boundary of A/F in each zone of the weld metal, which was in accordance with the PREN value in Figure 6. Due to the large gradient of alloying elements content and PREN as well as the long boundaries between austenite and ferrite, the narrow pits in the weld metal in the interface of austenite/ferrite formed along the borders, which did not perform a circular shape as Figure 9c. The pit was imitated at the interface then propagated into the ferrite phase because of the lower PREN value mentioned before. In addition, the pits in the weld cap, weld root and the HAZ were mainly in the surroundings of the Cr2N in ferrite phase, which could be attributed to the Cr-depletion zone around the Cr2N as presented in Figure 5 mentioned by some researchers (Garzón et al., 2007). The Cr2N in the pit was observed after the CPT test (shown in Figure 14), the content of Cr in the region around the Cr2N was disappeared, pitting occurred and extended toward to ferrite at the same time, suggesting that the Cr-depletion zone cause the pitting.
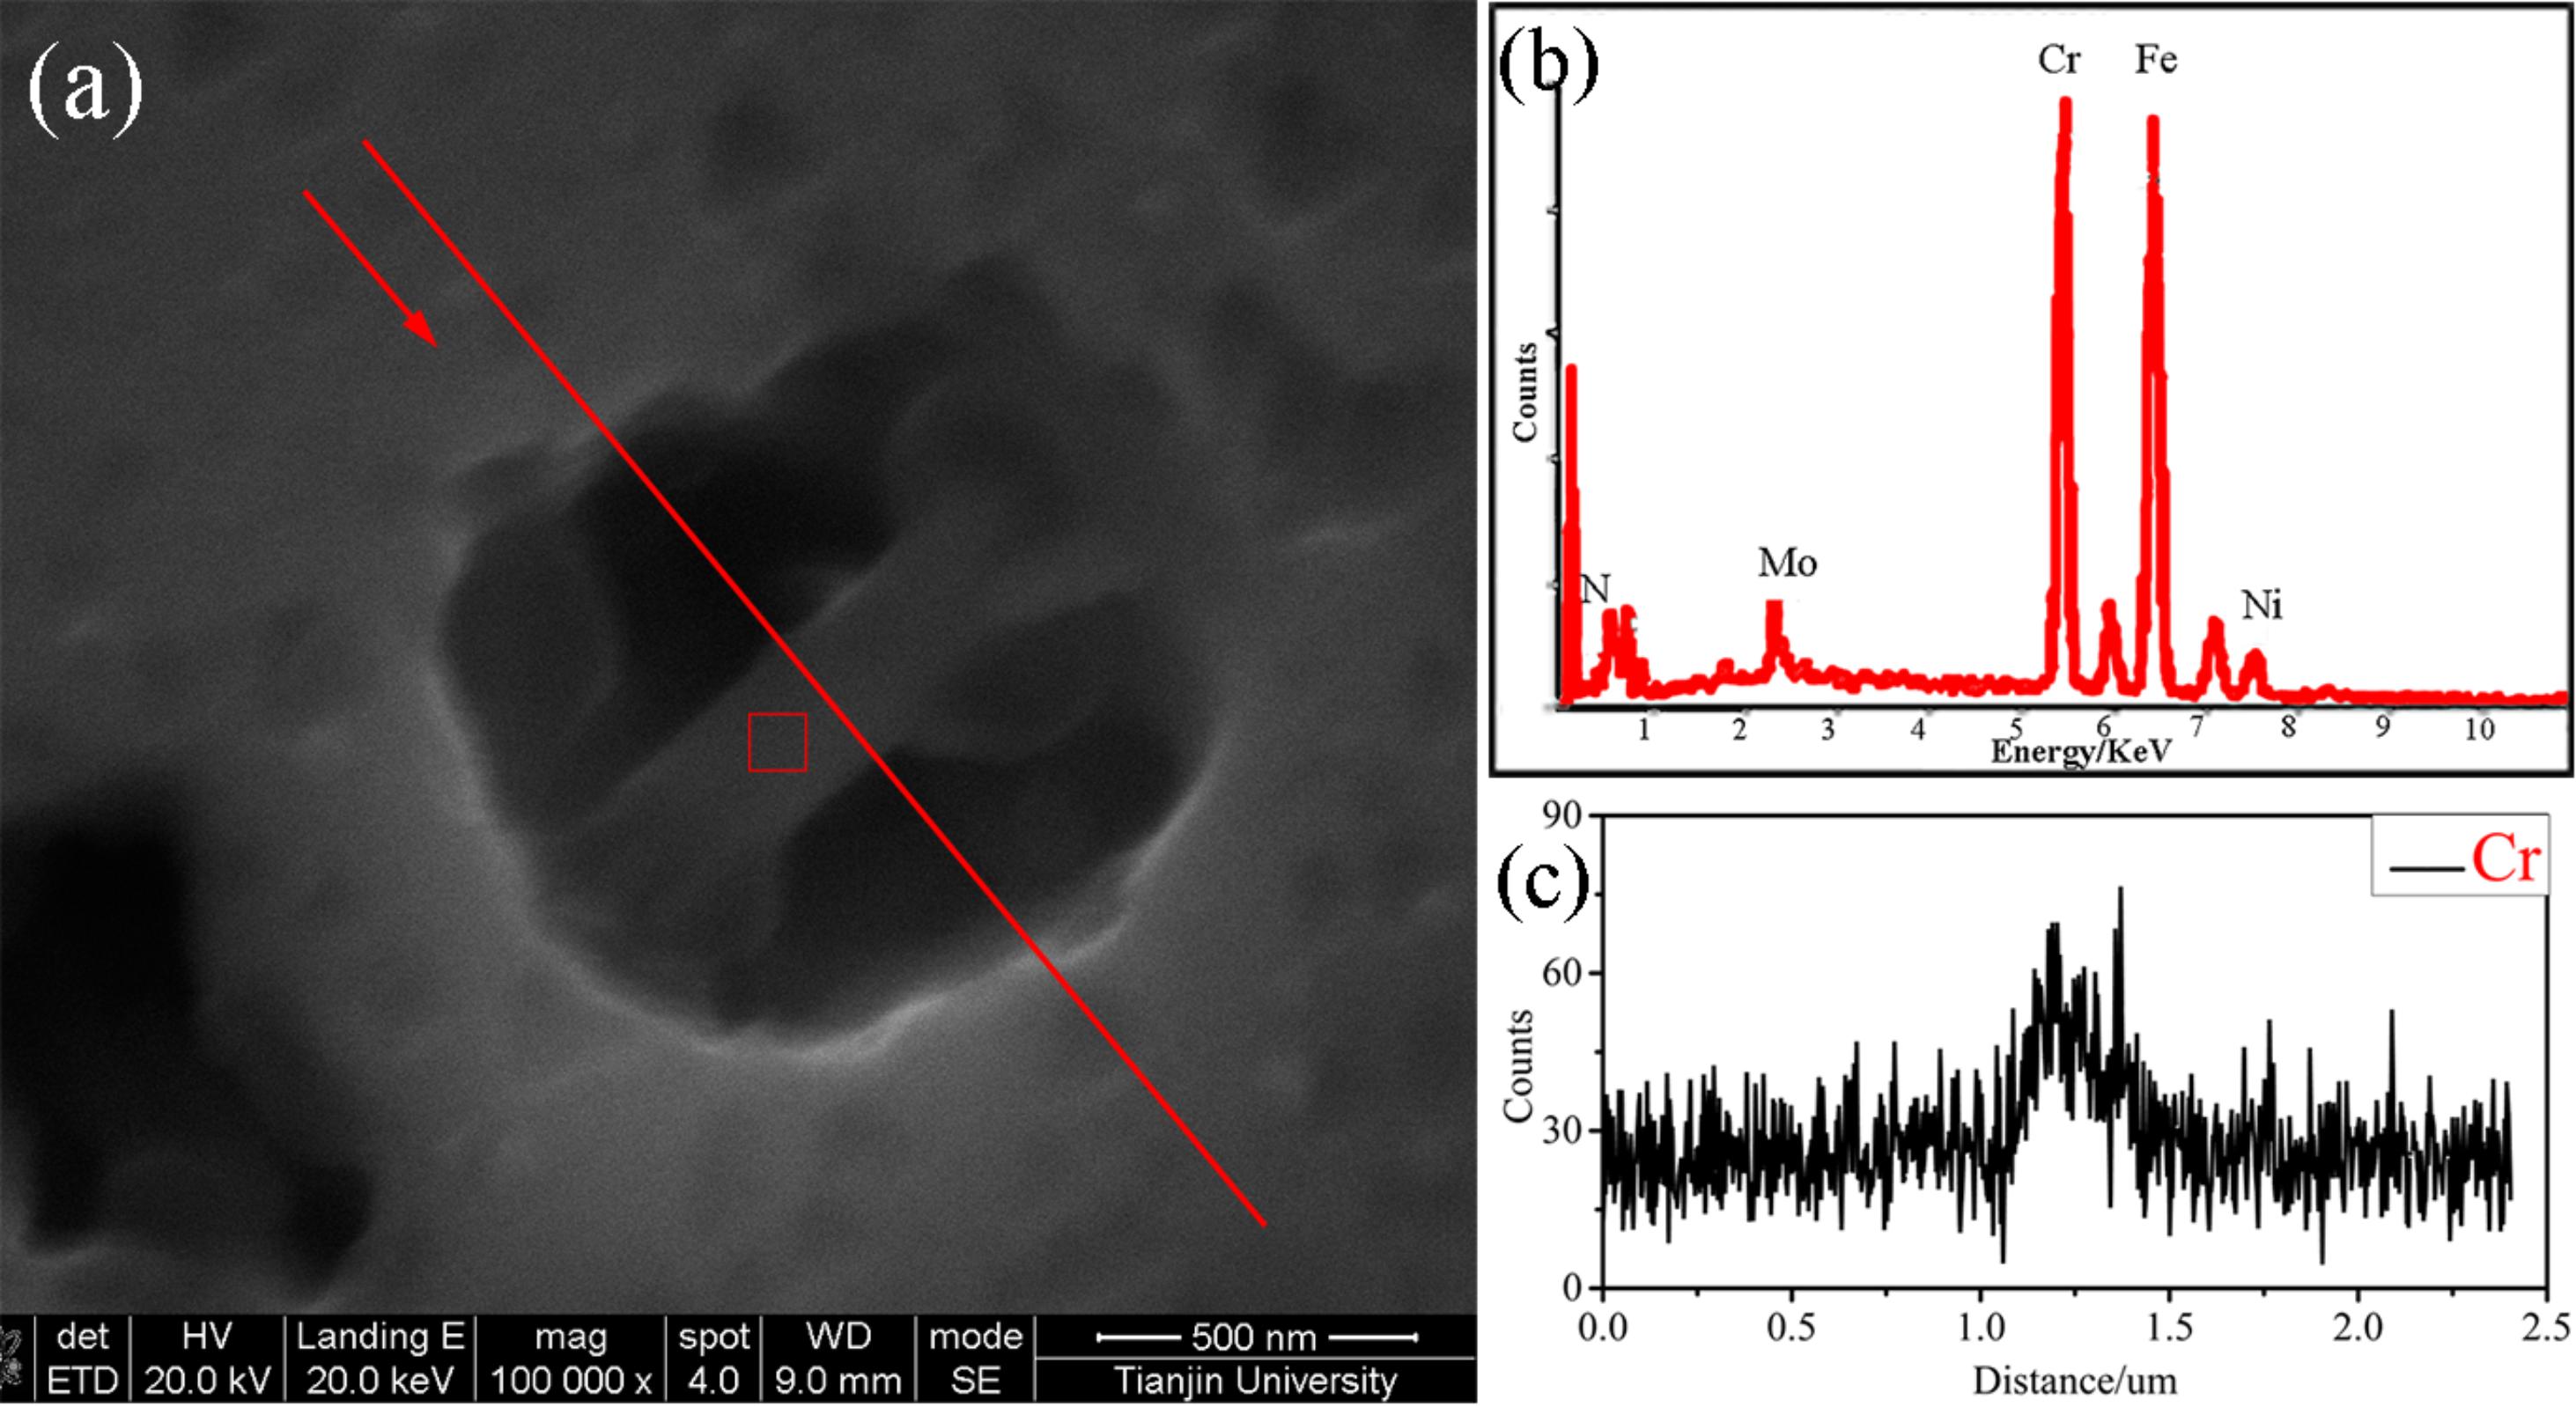
Figure 14. The Cr2N in the pits observed by SEM: (a) pits morphologies, (b,c) corresponding EDS point scanning and line scanning results.
Electrochemical Impedance Spectroscopy Analysis
In the Nyquist diagram, the apparent capacitive arc indicated that the biased potential created similar passive films on the surface of the local region of the joint. And the diameter of the capacitive arc varied with regions suggested that the protective effect of the passive film was different in each region. The larger diameter of the capacitive arc means a more difficult charge transfer and a larger impedance of the passive film. The BM had the largest capacitive arc where the passive film formed by the non-welded parent was more protective, which was confirmed by the CPT results.
In the Bode diagram, the phase under high frequency was close to zero, confirming that the passive film of the tested sample has great resistant properties. Characteristic responses of capacitive behavior are reflected by the maximum phase in. At low frequencies range intermediate frequencies, the presence of greater phase means denser passive film and fewer defects such as pores. The analysis also shows that the passive film formed by the base metal and the weld center were denser.
The circuit’s model consisting of components can be used to simulate the electrochemical system with different parameters as shown in Figure 13. Specifically, since pitting was barely detected on the sample after the EIS test, the passive film was suspected to have no pores or at least the inner layer remains compact. Besides, this model had the minimum fitting errors for the original testing data, the chi-squared value (χ2) showed that the experimental and simulated data had a satisfactory agreement (<0.001).
The results of the fitting parameter using the EEC are listed in Table 3, the similar n suggests the presence of a good capacitive performance of the surface film. The decrease in value Y and Cdl and increase in R1 represent that the passive film turned out to be thicker and thus more protective. Though the trend of R1 showed good agreement with the pitting results, the trend of Y and Cdl vary in different regions and are not consistent with the CPTs, suggesting the character of the passive film was not simple. The BM performed the largest R1. The high austenite content and regular banded microstructure of the base metal positively stabilized the passivation process and accelerated the formation of the surface oxide layer which is more homogenous and resistant. The resistance of the weld root with lower austenite content was a little larger than the weld center and cap which is probably relevant to its fine and homogeneous distributed IGA. It can be speculated that the more uniform the microstructure preforms, the higher impedance is. According to the plots and fitting parameters, it could be seen that the structure of the passive film in different regions was identical, it did not change with the austenite contents and morphologies. What’s more, the properties of the passive film varied in different regions, but the changes in related parameters were not a single trend like the factor of temperature (Cui et al., 2017).
Conclusion
(1) The weld center of the joint presented a slightly lower austenite content than the base metal, while the austenite contents in the weld cap, weld root and HAZ were nearly due to the welding sequence. Besides, the austenite in the weld root and weld cap mainly presented two morphologies with barely WA which can be observed in the weld center.
(2) The alloying elements in the weld center developed a serious partition due to the middle welding sequence and relatively lower cooling rate than the weld cap, weld root and HAZ in horizontal and vertical direction in the cross section. In addition, the relevant elements enriched obviously in the grain boundary austenite as firstly nucleated.
(3) The ferrite in the WM (including the weld center, weld cap and weld root), HAZ and BM had relatively lower PREN values than the austenite, resulting in preferential pitting corrosion at the interface of ferrite and austenite due to the large gradient of PREN values.
(4) The different zones of the joint had lower CPT value than the base metal because of the lower austenite content and the precipitations in ferrite, especially the HAZ. The weld center had a high CPT which was second only to that of the BM. The Cr-depleted region around Cr2N was attacked, disappeared and then the pits extended toward to ferrite.
(5) EIS analysis shows that the passive film structure of all the samples was single layer which had no pores in its passive film, meaning the microstructure of austenite contents and morphologies had no influence on the passive film structure. However, it can be speculated that the more uniform the microstructure preforms, the higher impedance is.
Data Availability Statement
All datasets generated for this study are included in the article/supplementary material.
Author Contributions
YH: conceptualization, writing – review and editing, and funding acquisition. YZ: methodology, formal analysis, and writing – original draft. HJ: resources. ZG: validation. LX: visualization. ZZ: project administration. LZ: supervision.
Funding
This work was supported by the National Natural Science Foundation of China (grant number 51575382); and Marine Economic Innovation and Development of Regional Demonstration Projects of China (grant number BHSF 2017-22).
Conflict of Interest
The authors declare that the research was conducted in the absence of any commercial or financial relationships that could be construed as a potential conflict of interest.
References
Astm-G150 (2013). Standard Test Method for Electrochemical Critical Pitting Temperature Testing of Stainless Steels. West Conshohocken: American Society for Testing and Materials.
Barteri, M., Mancia, F., Tamba, A., and Montagna, G. (1987). Engineering diagrams and sulphide stress corrosion cracking of duplex stainless steels in deep sour well environment. Corros. Sci. 27, 1239–1250. doi: 10.1016/0010-938x(87)90112-0
Brytan, Z., Niagaj, J., and Reiman, L. (2016). Corrosion studies using potentiodynamic and EIS electrochemical techniques of welded lean duplex stainless steel UNS S82441. Appl. Surf. Sci. 388, 160–168. doi: 10.1016/j.apsusc.2016.01.260
Cervo, R., Ferro, P., and Tiziani, A. (2010). Annealing temperature effects on super duplex stainless steel UNS s32750 welded joints. I: microstructure and partitioning of elements. Mater. Sci. 45, 4369–4377. doi: 10.1007/s10853-010-4310-1
Chail, G., and Kangas, P. (2016). Super and hyper duplex stainless steels: structures, properties and applications. Procedia Struct. Integr. 2, 1755–1762. doi: 10.1016/j.prostr.2016.06.221
Cui, Z. Y., Wang, L. W., Ni, H. T., Hao, W. K., Man, C., Chen, S. S., et al. (2017). Influence of temperature on the electrochemical and passivation behavior of 2507 super duplex stainless steel in simulated desulfurized flue gas condensates. Corros. Sci. 118, 31–48. doi: 10.1016/j.corsci.2017.01.016
El-Yazgi, A. A., and Hardie, D. (1998). Stress corrosion cracking of duplex and super duplex stainless steels in sour environments. Corros. Sci. 40, 909–930. doi: 10.1016/s0010-938x(98)00022-5
Garzón, C. M., Serna, C. A., Brandi, S. D., and Ramirez, A. J. (2007). The relationship between atomic partitioning and corrosion resistance in the weld-heat affected zone microstructures of UNS S32304 duplex stainless steel. J. Mater. Sci. 42, 9021–9029. doi: 10.1007/s10853-007-1881-6
Ha, H. Y., Jang, M. H., Lee, T. H., and Moon, J. (2014). Interpretation of the relation between ferrite fraction and pitting corrosion resistance of commercial 2205 duplex stainless steel. Corros. Sci. 89, 154–162. doi: 10.1016/j.corsci.2014.08.021
He, J., Yan, M., Yang, L., Moradi, M., Song, Z., Jiang, Y., et al. (2015). Electrochemical corrosion and critical pitting temperature of S32750 super duplex stainless steel in NaCl solution. J. Chin. Soc. Corr. Pro. 35, 106–112.
Hosseini, V. A., Wessman, S., Hurtig, K., and Karlsson, L. (2016). Nitrogen loss and effects on microstructure in multipass TIG welding of a super duplex stainless steel. Mater. Des. 98, 88–97. doi: 10.1016/j.matdes.2016.03.011
Jiang, Y., Sun, T., Li, J., and Xu, J. (2014). Evaluation of Pitting Behavior on Solution Treated Duplex Stainless Steel UNS S31803. J. Mater. Sci. Technol. 30, 179–183. doi: 10.1016/j.jmst.2013.12.018
Kim, S., Jang, S., Lee, I., and Park, Y. (2011). Effects of solution heat-treatment and nitrogen in shielding gas on the resistance to pitting corrosion of hyper duplex stainless steel welds. Corros. Sci. 53, 1939–1947. doi: 10.1016/j.corsci.2011.02.013
Kim, S. T., Lee, I. S., Kim, J. S., Jang, S. H., Park, Y. S., Kim, K. T., et al. (2012). Investigation of the localized corrosion associated with phase transformation of tube-to-tube sheet welds of hyper duplex stainless steel in acidified chloride environments. Corros. Sci. 64, 164–173. doi: 10.1016/j.corsci.2012.07.014
Leif (2012). Welding duplex stainless steels — a review of current recommendations. Weld. World 56, 65–76. doi: 10.1007/bf03321351
Macdonald, J. R. (1987). Impedance spectroscopy: emphasizing solid materials and systems. J. Electroceram. 28, 189–195.
Merello, R., Botana, F. J., Botella, J., Matres, M. V., and Marcos, M. (2003). Influence of chemical composition on the pitting corrosion resistance of non-standard low-Ni high-Mn–N duplex stainless steels. Corros. Sci. 45, 909–921. doi: 10.1016/s0010-938x(02)00154-3
Muthupandi, V., Srinivasan, P. B., Seshadri, S. K., and Sundaresan, S. (2003). Effect of weld metal chemistry and heat input on the structure and properties of duplex stainless steel welds. Mater. Sci. Eng. A 358, 9–16. doi: 10.1016/s0921-5093(03)00077-7
Ramkumar, K. D., Mishra, D., and Raj, B. G. (2015). Effect of optimal weld parameters in the microstructure and mechanical properties of autogeneous gas tungsten arc weldments of super-duplex stainless steel UNS S32750. Mater. Des. 66, 356–365. doi: 10.1016/j.matdes.2014.10.084
Ramkumar, K. D., Thiruvengatam, G., Sudharsan, S. P., Mishra, D., Arivazhagan, N., and Sridhar, R. (2014). Characterization of weld strength and impact toughness in the multi-pass welding of super-duplex stainless steel UNS 32750. Mater. Des. 60, 125–135. doi: 10.1016/j.matdes.2014.03.031
Taban, E. (2008). Toughness and microstructural analysis of superduplex stainless steel joined by plasma arc welding. J. Mater. Sci. 43, 4309–4315. doi: 10.1007/s10853-008-2632-z
Taban, E., and Kaluc, E. (2011). Welding behaviour of duplex and superduplex stainless steels using laser and plasma ARC welding processes. Weld. World 55, 48–57. doi: 10.1007/bf03321307
Tavares, S. S. M., Pardal, J. M., Lima, L. D., Bastos, I. N., Nascimento, A. M., and Souza, J. A. D. (2007). Characterization of microstructure, chemical composition, corrosion resistance and toughness of a multipass weld joint of superduplex stainless steel UNS S32750. Mater. Charact. 58, 610–616. doi: 10.1016/j.matchar.2006.07.006
Udayakumar, T., Raja, K., Abhijit, A. T., and Sathiya, P. (2013). Experimental investigation on mechanical and metallurgical properties of super duplex stainless steel joints using friction welding process. J. Manuf. Process. 15, 558–571. doi: 10.1016/j.jmapro.2013.06.010
Westin, E. M. (2010). Microstructure and Properties of Welds in the Lean Duplex Stainless Steel LDX 2101. Metallurgi Och Metalliska Material. Stockholm: Royal Institute of Technology.
Xu, Y. Q., Yang, S. Y., Xu, K. W., Ma, H. W., and Wang, P. Y. (2013). Super duplex stainless steel 2507 and the research on its welding technique. Electric Welding Machine. 43, 6–12.
Yang, Y., Wang, Z., Tan, H., Hong, J., Jiang, Y., Jiang, L., et al. (2012). Effect of a brief post-weld heat treatment on the microstructure evolution and pitting corrosion of laser beam welded UNS S31803 duplex stainless steel. Corros. Sci. 65, 472–480. doi: 10.1016/j.corsci.2012.08.054
Zhang, L., Zhang, W., Jiang, Y., Deng, B., Sun, D., and Li, J. (2009). Influence of annealing treatment on the corrosion resistance of lean duplex stainless steel 2101. Electrochim. Acta 54, 5387–5392. doi: 10.1016/j.electacta.2009.04.023
Zhang, Y. J., Song, B., Ming, J., Yan, Q., Wang, M., Cai, C., et al. (2020). Corrosion mechanism of amorphous alloy strengthened stainless steel composite fabricated by selective laser melting. Corros. Sci. 163:108241. doi: 10.1016/j.corsci.2019.108241
Zhang, Z., Wang, Z., Jiang, Y., Tan, H., Han, D., Guo, Y., et al. (2012). Effect of post-weld heat treatment on microstructure evolution and pitting corrosion behavior of UNS S31803 duplex stainless steel welds. Corros. Sci. 62, 42–50. doi: 10.1016/j.corsci.2012.04.047
Zhang, Z. Q., Jing, H. Y., Xu, L. Y., Han, Y. D., and Zhao, L. (2016). Investigation on microstructure evolution and properties of duplex stainless steel joint multi-pass welded by using different methods. Mater. Des. 109, 670–685. doi: 10.1016/j.matdes.2016.07.110
Zhang, Z. Q., Jing, H. Y., Xu, L. Y., Han, Y. D., Zhao, L., and Zhang, J. L. (2017). Influence of microstructure and elemental partitioning on pitting corrosion resistance of duplex stainless steel welding joints. Appl. Surf. Sci. 394, 297–314. doi: 10.1016/j.apsusc.2016.10.047
Keywords: super duplex stainless steel, welding, microstructure, elemental partitioning, pitting corrosion, electrochemical impedance spectroscopy
Citation: Han Y, Zhang Y, Jing H, Gao Z, Xu L, Zhang Z and Zhao L (2020) Microstructure and Corrosion Studies on Different Zones of Super Duplex Stainless Steel UNS S32750 Weldment. Front. Mater. 7:251. doi: 10.3389/fmats.2020.00251
Received: 17 October 2019; Accepted: 13 July 2020;
Published: 24 September 2020.
Edited by:
Daniel John Blackwood, National University of Singapore, SingaporeReviewed by:
Jian Chen, University of Western Ontario, CanadaShaojun Yuan, Sichuan University, China
Copyright © 2020 Han, Zhang, Jing, Gao, Xu, Zhang and Zhao. This is an open-access article distributed under the terms of the Creative Commons Attribution License (CC BY). The use, distribution or reproduction in other forums is permitted, provided the original author(s) and the copyright owner(s) are credited and that the original publication in this journal is cited, in accordance with accepted academic practice. No use, distribution or reproduction is permitted which does not comply with these terms.
*Correspondence: Lianyong Xu, eHVsaWFueW9uZ0B0anUuZWR1LmNu