 Wei Wang
 Xie-dong Zhang1
 Lin Wu
- 1School of Transportation, Wuhan University of Technology, Wuhan, China
- 2CCCC Second Highway Consultants Co., Ltd., Wuhan, China
Multi-bolt shear connectors (MBSCs), arranging bolts as a group in several rows, can be applied in prefabricated steel–concrete composite beams or bridges (SCCBs) to reduce the construction time and meet the requirements of sustainable development. The mechanical behavior of bolt shear connectors has been broadly investigated in recent years, but they were mainly focused on the normal arrangement. The shear performance of MBSCs is not consistent with that of the same number of single bolts. In this study, a three-dimensional (3D) finite element model (FEM) was developed to investigate the multiple bolts effect and its mechanical performance. Material non-linearities and the interactions among all components were included in the FEM. The accuracy and reliability of the proposed FEM were initially verified against the available push-out test results. The validated FEM further studied the load–slip relationship, shear capacity, and shear stiffness of the MBSCs. A parametric study was carried out to determine the effect of the bolt spacing, bolt row numbers, the concrete strength, and the bolt diameter on the shear performance of MBSCs. Based on the extensive parametric analyses, design recommendations considering the multiple bolts effect for predicting the shear resistance per bolt in multi-bolt connectors were proposed and verified.
Introduction
Steel–concrete composite structures (SCCBs) have been widely used in civil engineering construction as they take full advantage of both materials. Mechanical shear connectors are the key element to guarantee the composite bond action between the steel and concrete, which are applied to transfer the longitudinal shear forces across the interface of steel girders and concrete plates. Among various kinds of mechanical shear connectors, welded and headed studs are the most common because of their convenient construction, favorable mechanical properties, and comprehensive research achievements (Ollgaard et al., 1971; Lam and Ellobody, 2005; Lam, 2007; Xue et al., 2012; Xu et al., 2012; Spremic et al., 2013; Ding et al., 2017). However, from the perspective of sustainable development, the conventional SCCBs, of which the headed shear studs are welded on the top of the steel beams and cast into concrete slabs, are complicated and inefficient to disassemble and reuse in the process of building replacement, rehabilitation, or strengthening. As fasteners, high-strength bolts are commonly employed in steel structures because of their outstanding characteristics (i.e., fatigue performance, tight connection, and convenience for dismantling). Meanwhile, they can also be utilized as demountable mechanical shear connectors in substitution of the headed studs in SCCBs. Several studies have reported the SCCBs by applying the high-strength bolt connectors.
Previously, Dallam (1968) and Marshall et al. (1971) experimentally validated that the ultimate shear capacity of the bolted connections is greater than that of the headed studs. And the high-strength bolt can be used as the shear connectors applied in SCCBs. Following this, Dedic and Klaiber (1984) evaluated two methods of installing high-strength bolts as mechanical shear connectors in the rehabilitation work by push-out tests, showing that the high-strength bolts can function as shear connectors with comparable strength to headed studs. Besides, Kwon et al. (2010, 2011) performed a series of experimental tests to study the shear performance for three types of postinstalled bolted shear connectors subjected to static and fatigue loading. However, their research mainly focused on the strengthening of the existing non-composite bridges rather than the sustainable construction.
Additionally, Pavlović et al. (2013) revealed that employing the high-strength bolts as shear connectors in prefabricated SCCBs could improve the construction efficiency, with a similar shear capacity to steel studs. Various types of novel demountable bolted shear connectors that are manufactured from headed studs or conventional bolts were developed by researchers (Dai et al., 2015; Suwaed and Karavasilis, 2017; Yang et al., 2018; Chen et al., 2019; Kozma et al., 2019) to accelerate the construction of SCCBs and conform to sustainability. They conducted a series of push-off tests to explore the shear performance and the practicality of bolted connectors in the composite construction. Zhang et al. (2019, 2020) carried out push-off tests and FE analysis on high-strength friction-grip bolt (HSFGB) connectors in prefabricated SCCBs and proposed design formulas for predicting the shear-bearing capacity per bolted connector. Moreover, Liu et al. (2015, 2016, 2017) and Ataei et al. (2016, 2019) studied the structural behavior of HSFGB shear connectors in prefabricated composite beams with geopolymer concrete by performing comprehensive tests and FE analysis, and the practical design recommendations were also presented for estimating the shear resistance and the load–slip response of bolted connectors. Recently, Yang et al. (2020) conducted push-out tests to investigate the 16 mm multi-bolt connectors, and the results showed that, due to the multiple bolts effect, the average shear capacity per bolt in multi-bolt connectors was lower than that of the customarily arranged bolts.
Although demountable multi-bolt shear connectors (MBSCs) applied in SCCBs, as shown in Figure 1, can increase the construction speed, the load distribution per bolt in MBSCs is not uniform, and its mechanical properties are different from that of per bolt in the usual arrangement. Previous researches studies mainly focused on the shear behavior of the traditional single-row bolt connectors, and the investigation on the multiple bolts effect and its shear performance is quite limited. This study will focus on this point. Due to the higher computational efficiency and the lower economic cost of numerical techniques than that of experiments, an accurate and efficient 3D non-linear finite element method (FEM) of the push-off tests was developed and verified initially. The geometric and material non-linearities of all components, such as concrete, the high-strength bolt, and the steel beam, were taken into account in the modeling. Then, the validated model was further used to predict the mechanical behavior of MBSCs. Furthermore, a parametric study was performed to explore the effects of several essential variables, including bolt spacing, bolt row numbers, the concrete strength, and the bolt diameter on shear capacity, shear stiffness, and the load-slip response per bolt in MBSCs. Finally, an empirical prediction formula per bolt connection resistance was proposed.
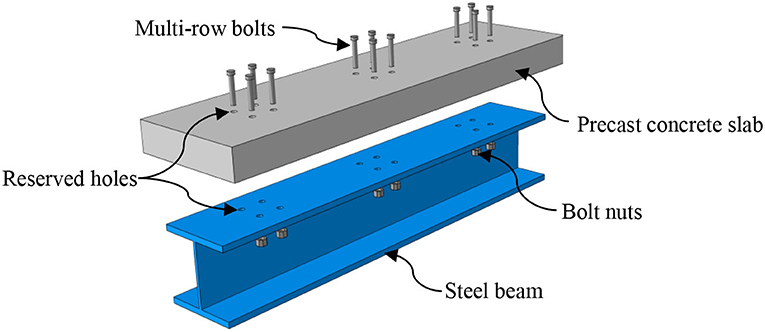
Figure 1. Prefabricated steel–concrete beam with multi-bolt shear connectors (MBSCs).
Finite Element Model
A non-linear 3D FEM was developed using the software ABAQUS/Standard 6.14 (Abaqus, 2014) to study the structural performance of bolt shear connectors in push-off tests. To obtain the accurate results from the FE analysis, all components, such as the concrete plate, the high-strength bolt, and the steel girder, as well as steel bars, were suitably modeled to match the real condition. Both geometric, material non-linearities and complicated contact interactions of all structural components were considered in this study.
Model Geometry
Supplementary Figure 1 shows the front view of the push-off test specimens in Chen et al. (2019), Zhang et al. (2019), and Zhang et al. (2020). All specimens consisted of a steel beam attached by two prefabricated concrete slabs. Four high-strength bolts were mounted on each specimen between the concrete plate and the steel beam to achieve the bond composition. All structural components of experimental specimens, such as the concrete slab, the steel girder, bolt connectors, and reinforcements, were modeled in the FEM.
Finite Element Mesh
An 8-node linear brick element with reduced integration (C3D8R) was introduced to mesh and model the concrete slab, the steel beam, and the bolt connector. The reinforcement cages embedded in the concrete slab were simulated by the 2-node linear 3D truss elements (T3D2) with a linear approximation of displacement. Figure 2 describes the meshing details and the load diagram of the FEM developed in this study. Due to the symmetry of the tested specimens and the loading condition, only one-quarter of the push-off test specimen was modeled. The threaded part with the hexagon head of the high-strength bolt was simplified to round bars with equivalent section diameters. To ensure the simulation accuracy and reduce the computational time, a fine mesh scale (2.5 mm) was used for bolted shear connectors, regions around the concrete holes, as well as the steel holes, while a coarse mesh scale (30 mm) was adopted for the concrete slabs and steel beams.
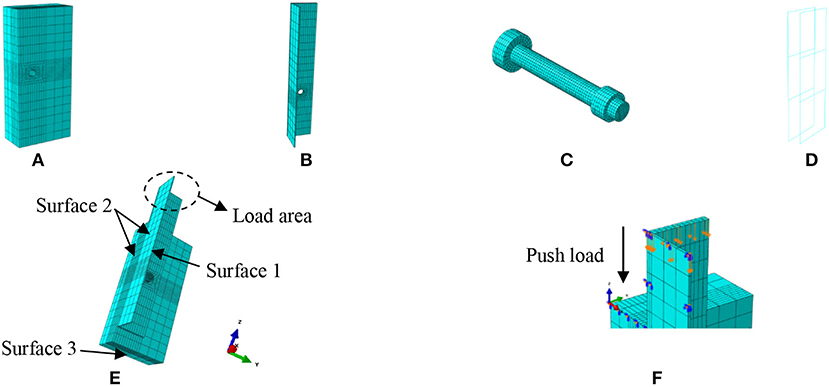
Figure 2. Mesh generation and load diagram of finite element method (FEM): (A) concrete plate; (B) steel beam; (C) bolt shear connector; (D) steel cage; (E) FEM; and (F) load diagram of FEM.
Material Modeling
The material constitutive models of the concrete proposed by Ding et al. (2011) were validated by the experiments in compression and tension with strength ranging from 20 to 140 MPa. They were applied for the concrete slab in this study. The stress–strain relationship of the concrete is expressed in Equation (1), as shown in Supplementary Figure 2:
where y = σ/f c and x = ε/εc are the stress and strain of the core concrete to uniaxial compressive concrete, respectively; σ and ε are the stress and strain of the core concrete, respectively; f c (=0.4) denotes the uniaxial compressive strength of the concrete, εc (=383 × 10−6) denotes the strain corresponding to f c; and f cu represents the compressive cubic strength of the concrete. ρsv is the stirrup reinforcement ratio. A (=9.1) is the ratio of the initial tangent modulus to the secant modulus at peak stress, and B is equal to 1.6(A-1)2, which controls the decrease in the elastic modulus along the ascending branch of the axial stress vs. strain relationship. In this study, the concrete damaged plasticity (CDP) model with the key plastic parameters (Ding and Yu, 2006), as shown in Supplementary Table 1, was utilized to represent the concrete behavior.
An elastic-plastic model with von Mises yield criteria, Prandtl–Reuss flow rule, and isotropic strain hardening was applied to depict the material behavior of the steel girder and bars. The stress–strain relationship of steel is given as follows (Ding et al., 2011):
where σi and εi are the equivalent stress and strain of the steel, respectively; f y and f u (=1.5f y) are the yield strength and the ultimate strength of the steel, respectively; εy, εst (=12εy), and εu (=120εy) are the yield strain, the hardening strain, and the ultimate strain of the steel, respectively; and Es is the elastic modulus.
A trilinear model presented by Loh et al. (2006) was applied to model the material behavior of the high-strength bolt, and the stress–strain relationship is represented as follows, which was also utilized by Chen et al. (2019) and Liu et al. (2015, 2016).
where σbt, εbt, and εbty are considered as the equivalent stress, the equivalent strain, and the yield strain of the high-strength bolt, respectively, and f btu and Ebs are the ultimate strength and elastic modulus, respectively.
Boundary Conditions
Symmetric boundary conditions were applied to the FEM, as illustrated in Figure 2E. All nodes lying in the plane of Surface 1 (the middle plane of the steel girder web) were restricted with the X-direction translation and the Y- and Z-axes rotation (UX = URY = URZ = 0). All nodes at the plane of Surface 2 (the plane of the steel girder flange and the concrete plate) were prevented at the Y-direction translation, as well as the X- and Z-axes rotation (UY = URX = URZ = 0). In addition, the translational and rotational movements were fixed at the bottom plane of the concrete slab (Surface 3).
Interaction and Constraint Conditions
All of the interfaces in FEMs, including the steel–concrete, the steel–bolt, and the bolt–concrete, were simulated by applying the surface-to-surface contact procedure available in ABAQUS. The default HARD contact was set for the normal behavior, while the penalty friction formulation option was adopted for the tangential response. Since the friction property between the steel beam and the concrete slab was not mentioned in push-off tests conducted in Chen et al. (2019) and Zhang et al. (2019, 2020), the contact friction coefficients ranging from 0.1 to 0.4 were studied in this study. The FE calculation results (as presented in Supplementary Figure 3) showed that the friction coefficient between the steel beam and concrete slab was equal to 0.3 and was closer to the tested curve than other values. The friction coefficient in other contact interactions was set as 0.25 according to Liu et al. (2016). The embedded constraint was chosen to simulate the constraint between the concrete plate and the reinforcements. The influences of the relative slip and debonding of the bars regarding concrete plates were not considered.
Load Application and Analysis Steps
The FE calculation mainly proceeded in two analysis steps. First, the bolt pretension was employed by utilizing the BOLT LOAD function available in ABAQUS. Second, push-down loads in the push-off tests were applied on the top surface of the steel girder, as shown in Figure 2E. Figure 2F displays the load diagram of the model.
Validation of FEMs
In this research, push-off tests performed by Chen et al. (2019) and Zhang et al. (2019, 2020) were used to validate the accuracy of the FEMs. The main parameters of the tested specimens and the comparison of the ultimate shear capacity obtained from tested and FEM results are summarized in Table 1. and are defined as the ultimate load captured by the tested and the FEM results, respectively. In this study, was obtained by considering that failure was reached when the concrete reached its ultimate stress or the bolts reached their tensile stress. It can be found that the ultimate load analyzed by FEMs was in good agreement with the test results. The mean value (μ) of the / ratio was 0.987 with a corresponding coefficient of variation (η) being 0.087.
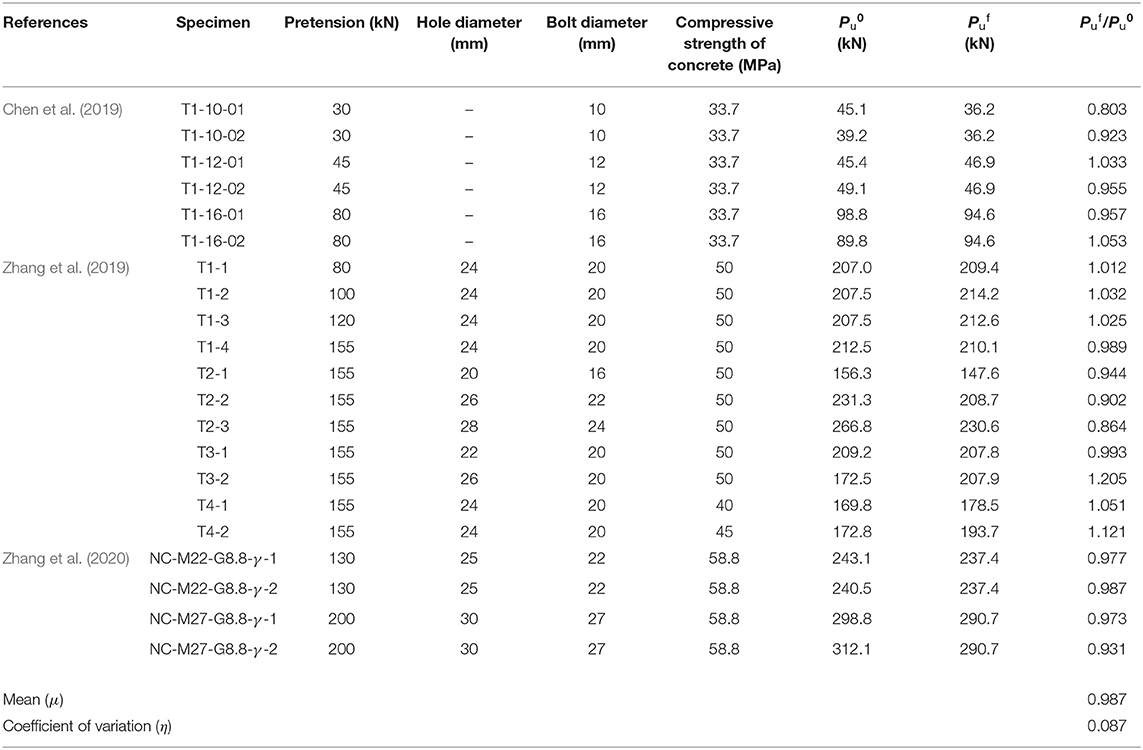
Table 1. Comparison of the ultimate shear capacity obtained from tested (Chen et al., 2019; Zhang et al., 2019, 2020) and finite element (FE) results.
The load–slip curves captured by FEMs were also compared with the tested results, as shown in Figure 3. It was observed that the numerical curves obtained from Zhang et al. (2019) had the same trend as the tested ones, which can be divided into four stages, namely, friction transferring force stage (OA), slipping stage (AB), bolt shank transferring stage (CD), and failure stage (DE). In the OA stage, external force was mainly used to overcome the bond friction force between the steel flange and the slab, in which the slip between both was small, and the stiffness was large. The value of point A can be determined by the bond friction force and the bolt pretension. In the AB stage, a noticeable slippage occurred due to the construction holes, and the slippage value was approximately equal to the sum of the clearance between the hole in the steel girder flange and the bolt and the clearance between the hole in the concrete slab and the bolt. In the BC stage, the bolt shank contacted with the steel beam and the concrete plate and began to bear the force. In this stage, the stress state of the bolt was similar to that of the traditional stud, and it sustained the shear force, the bending moment, and the axial force, simultaneously. In the CD stage, the slips increased with the increase in the load until the specimens failed. As for Chen et al. (2019) and Zhang et al. (2020), owing to the condition that the construction holes were not considered when modeling, the load–displacement curves had no slip stage (see Figures 3A,F). In these comparisons, the load–slip response obtained from FEMs correlated well with the tested counterparts in the initial loading stage. The stiffness of the bolt connectors in the CD stage obtained by FEMs was slightly higher than that of the tested ones as the external load increased. This could be explained that the screw threads in the simplified modeling were not considered. Additionally, the differences between the theoretical and experimental curvatures that were caused by the slip at the steel–concrete interface existed (Zhang et al., 2019).
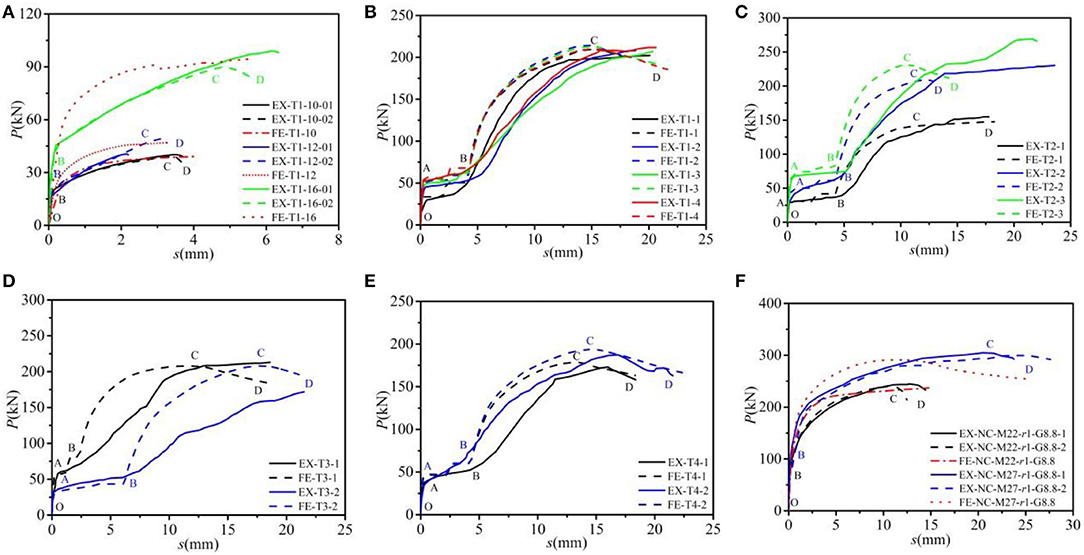
Figure 3. Comparison of load–slip curves between the FEM and tested results (Chen et al., 2019; Zhang et al., 2019, 2020): (A) T1 group (Chen et al., 2019); (B) T1 group (Zhang et al., 2019); (C) T2 group (Zhang et al., 2019); (D) T3 group (Zhang et al., 2019); (E) T4 group (Zhang et al., 2019); and (F) NC group (Zhang et al., 2020).
Figure 4 shows the comparison of failure models obtained by the FE modeling and the tested results (Chen et al., 2019; Zhang et al., 2019, 2020). Two failure models can be observed in the FEM and the tested ones. One failure model was the bolt shear failure occurred when the bolt diameter is relatively small (as shown in Figures 4A,B). The other failure model was the concrete failure with the bolt bending, which occurred in the case where the bolt diameter was relatively large (as shown in Figures 4C,E). In general, a good correlation was observable between the numerical and test results. The FE analyses and the experimental results agreed with each other reasonably well in brief with just a slight discrepancy, implying that the developed FEM could be utilized to predict the fundamental performance of the push-off test with bolt connectors.
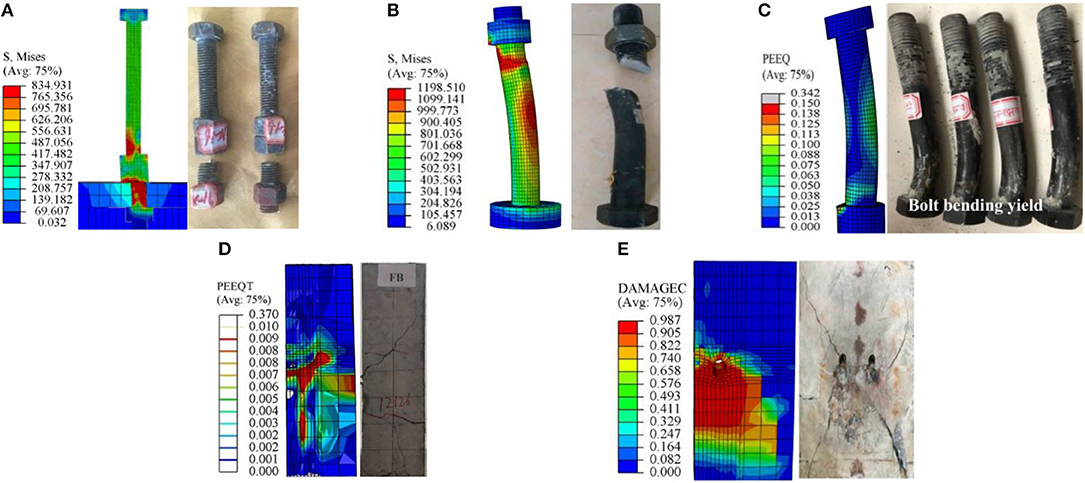
Figure 4. Comparison of failure modes between finite element analysis (FEA) and tested results (Chen et al., 2019; Zhang et al., 2019, 2020): (A) bolt shear failure (T1-16 specimen); (B) bolt shear failure (T2-1 specimen); (C) bolt bending yield (NC-M27-G8.8 specimen); (D) concrete cracks (NC-M27-G8.8 specimen); and (E) concrete failure (T4-1 specimen).
Multiple Bolts Effect Analysis
Finite Element Method
Based on the verification of FEMs shown above, the FE simulation of MBSCs was carried out to investigate the shear behavior and the multiple bolts effect. The geometry of FEMs with MBSCs is shown in Supplementary Figure 1B. To the knowledge of the authors, there are no design codes for the minimum longitudinal spacing of bolted shear connectors applied in SCCBs. According to Eurocode 4 (2004), Chinese design code (GB 50017-2017, 2017), American Association of State Highway and Transportation Officials (2007), and Japan Society of Civil Engineers (2006), the minimum longitudinal spacings of shear studs in SCCBs are, respectively, specified as 5d, 6d, 6d, and 5d or 100 mm. In this study, the bolt spacing ranges from 4d to 8d. Supplementary Table 2 shows the design parameters of FEMs. The layout of 16 mm MBSCs in concrete slabs is presented in Supplementary Figure 4.
Results and Discussion
Figure 5 shows the comparison of the load–slip relationship, the shear bearing capacity, and shear stiffness of the single bolt in MBSCs and the single row arrangement. The blue and green vertical coordinates represent the shear resistance and the shear stiffness, respectively. The shear stiffness kBC was calculated according to the tangent stiffness corresponding to 0.4 times of the peak load in the shear stage (BC):
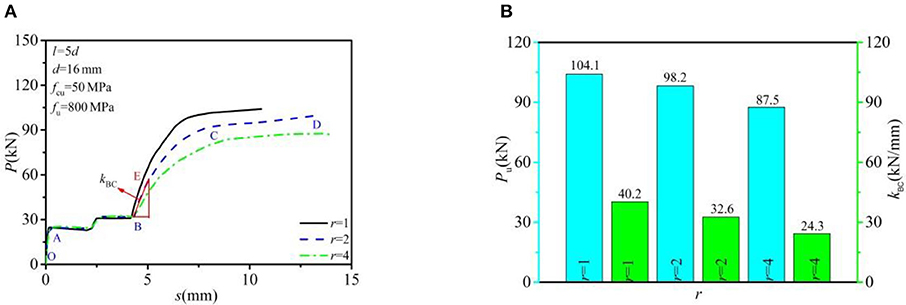
Figure 5. Analyzed results per bolt connectors in MBSCs: (A) load–slip relationship and (B) shear capacity and shear stiffness.
It can be seen that the average shear capacity per bolt in the arrangement of four rows and double rows was 87.5 and 98.2 kN, respectively, which was 84.1 and 94.3% of the single row bolt connection (104.1 kN). The average shear stiffness was 24.3 and 32.6 kN/mm, respectively, and 60.4 and 81.1% of the single row bolt connection (40.2 kN/mm). Therefore, the average shear capacity and the shear stiffness of FEMs with MBSCs were usually less than that of the single row bolt connector, which was mainly affected by the influence of the multiple bolts effect. Due to the clearances between the bolted connectors and the construction holes, it is hard to guarantee that each bolt can uniformly bear shear force.
Supplementary Figure 5 presents the variation of grouped bolt stress vs. load. In the loading process of multi-bolt connectors, the bolt stress increased with the increase in the load and showed the phenomenon of load transfer step by step. When the load was increased from 0 to 0.8Pu, the average load transfer rate of the top and bottom layers increased faster than that of the middle layers. When the load was increased from 0.8Pu to Pu, the average growth rate of bolt transfer load of the top and bottom layers slowed down, while the bolt transfer load of middle layers accelerated.
Figure 6 shows the comparison of failure modes between MBSCs and normally arranged bolt connectors. The compressive DAMAGEC values range from 0.000 to 0.987, representing 0–98.7% damage. The closer the value is to 1 (red), the more serious the material damage is. It can be observed that the maximum stress of bolts at the interface of the steel beam and the concrete slab (M-N) exceeded its tensile strength (800 MPa), resulting in the bolt shear failure. Meanwhile, the part of the bolt embedded in concrete slab (Part I) underwent obvious deformation, while the residual part (Part II) was straight besides the region near the failed shear section. The analyzed bolt shear failure mode in this study was similar to the tested failure mode in Yang et al. (2020) (see Figure 6C). The red contour areas experienced more than 90% damage as for concrete slabs, while the blue contours covered all damaged compression areas. Damaged areas of the concrete slabs were mainly concentrated in the lower side of the holes and extended along the force direction.
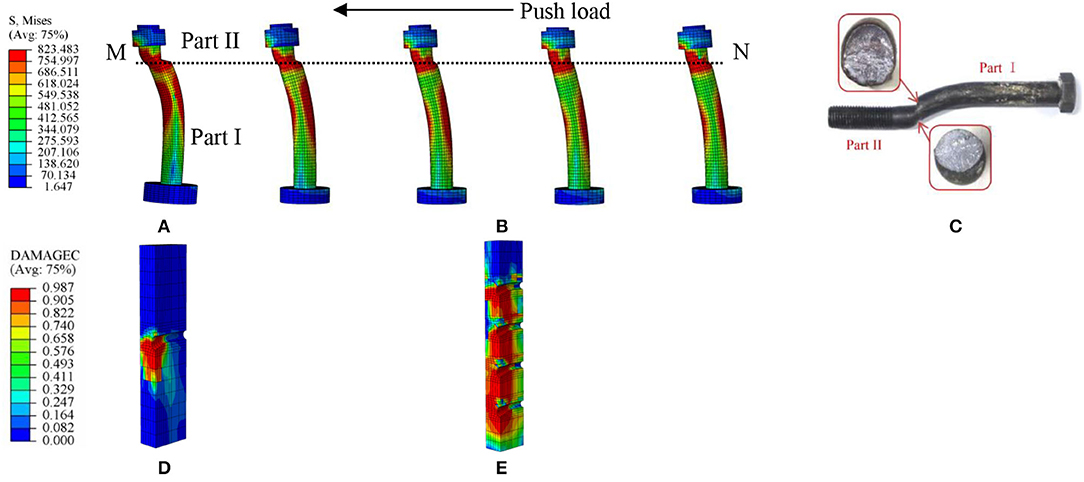
Figure 6. Comparison of failure modes between MBSCs and normally arranged bolted connector: (A) Von Mises stress of bolt connector (r = 1); (B) von Mises stress of MBSCs (r = 4); (C) bolt shear failure (Yang et al., 2020); (D) compression damage of slab (r = 1); and (E) compression damage of the slab (r = 4).
Parametric Study
The parametric studies were carried out to further study the multiple bolt effect and the shear performance of MBSCs. The influential variables, including the concrete strength, the bolt diameter, bolt spacing, and bolt row numbers, are listed in Supplementary Table 2.
Effect of Bolt Spacing
In this study, the concrete strength, bolt row numbers, the bolt diameter, and the bolt strength grade were, respectively, specified as C50, 2, 16 mm, and G8.8 (f u = 800 MPa, f y = 640 MPa). Figure 7 describes the effects of load–slip relationship, shear-bearing capacity, and shear stiffness for a single bolted connector for the bolt spacing (l) ranging from 4d to 8d. In general, both the ultimate shear resistance and the shear stiffness per bolt in MBSCs were lower than the regular arrangement (r = 1). The average shear-bearing capacity of a single bolt in double rows (r = 2) was increased slightly with the increase of bolt spacing and tended to be stable. The load resistance was increased by 6.7% when the bolt spacing was increased from 4d to 8d. As for shear stiffness, the average shear stiffness decreased to different degrees, with an average reduction of 17.8% when bolt spacing increased from 4d to 8d. The average shear capacity and shear stiffness per bolt reached the maximum value when the bolt spacing was 7d. Therefore, 7d could be suggested as the optimal bolt spacing for MBSCs.
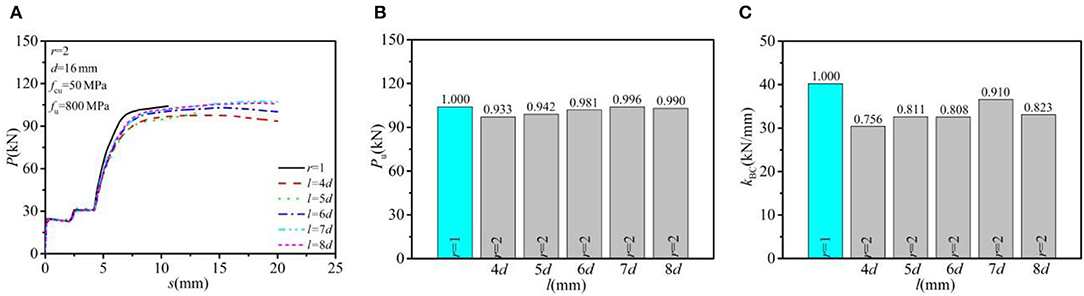
Figure 7. Effect of bolt spacing: (A) load–slip relationship; (B) shear-bearing capacity; and (C) shear stiffness.
Figure 8 plots the analyzed compressive damage on the concrete slab with different bolt spacing. When the bolt spacing was less than 7d, the adjacent concrete slab holes overlapped the compression damage zones. When the bolt spacing was greater than 7d, there were lower compression damage areas (DAMAGEC < 0.5) between the concrete slab holes. To ensure the cooperative force between bolts and concrete, it was recommended that the bolt spacing should not be more than 7d.
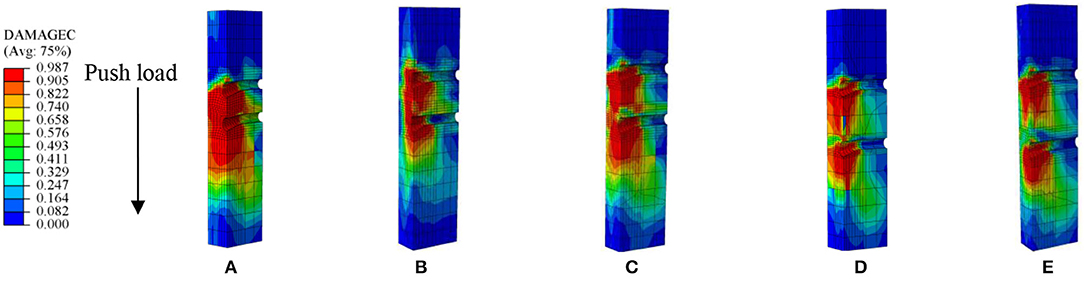
Figure 8. Analyzed compressive damage on the concrete slab: (A) l = 4d; (B) l = 5d; (C) l = 6d; (D) l = 7d; and (E) l = 8d.
Effect of Bolt Row Numbers
In this section, the concrete strength, bolt spacing, and the bolt strength grade were specified as C50, 7d, and G8.8. Four different bolt row numbers (r = 1, 2, 3, 4) were chosen to investigate the influence of this parameter on the load–slip relationship, the shear-bearing capacity, and shear stiffness. The calculated results are presented in Figure 9. The average shear capacity and shear stiffness of a single-bolt connector decreased gradually with bolt row numbers. As for shear capacity, with the increase of bolt row numbers from 1 to 4, the average shear capacity of a single bolt presented a decrease by 14.8% for 12 mm MBSCs, 12.4% for 16 mm MBSCs, 12.8% for 18 mm MBSCs, and 12.9% for 20 mm MBSCs. As for shear stiffness, with the increase of bolt row numbers from 1 to 4, the average shear stiffness of a single bolt reported a decrease by 20.0% for 12 mm MBSCs, 27.8% for 16 mm MBSCs, 36.2% for 18 mm MBSCs, and 26.0% for 20 mm MBSCs.
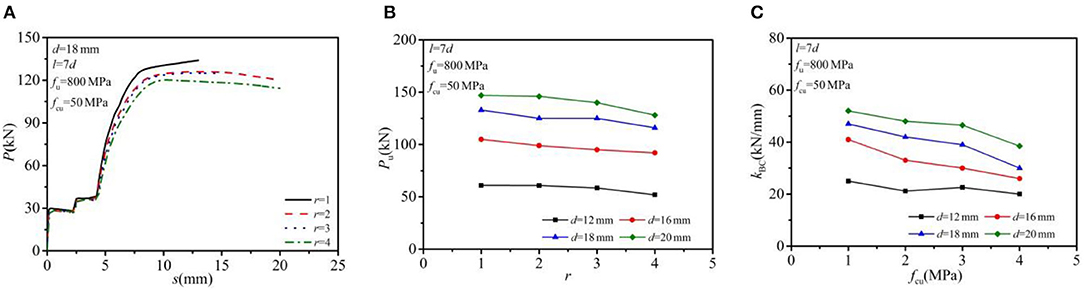
Figure 9. Effect of bolt row numbers: (A) load–slip relationship; (B) shear-bearing capacity; and (C) shear stiffness.
Figure 10 contours the ultimate deformation of FEM with 18 mm MBSCs. Due to the influence of the multiple bolt effect, the stress on the bolts was not uniform, and the bending deformation of bolts on the top layer (near the load) and the deformation of concrete were relatively large.
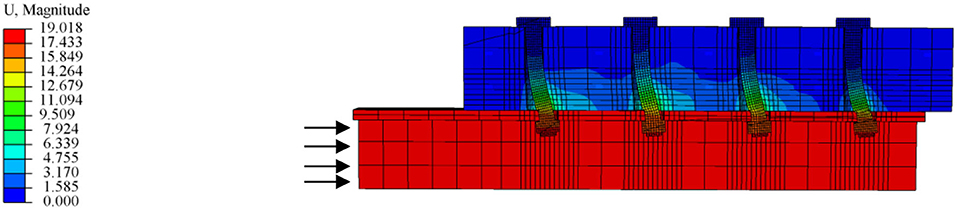
Figure 10. Analyzed ultimate deformation of 18 mm multi-bolt connectors.
Effect of Concrete Strength
The bolt row numbers, bolt spacing, and the bolt strength grade were specified as 2, 5d, and G8.8. Four different nominal concrete strengths f cu ranging from 30 to 60 MPa and four different bolt diameters ranging from 12 mm to 20 mm were taken into account in this investigation. The analyzed results on the load–slip relationship, the shear-bearing capacity, and shear stiffness of a single bolt connector are displayed in Figure 11. The average shear capacity and shear stiffness per bolt increased by the increase of either the concrete strength or the bolt diameter. As for shear capacity, with the increase of concrete strength from C30 to C60, the average shear capacity per bolt exhibited an increase of 14.7% for 12 mm MBSCs, 25.5% for 16 mm MBSCs, 33.5% for 18 mm MBSCs, and 39.3% for 20 mm MBSCs. As for shear stiffness, the average shear stiffness per bolt showed an increase of 39.7% for 12 mm MBSCs, 53.5% for 16 mm MBSCs, 48.7% for 18 mm MBSCs, and 46.6% for 20 mm MBSCs.
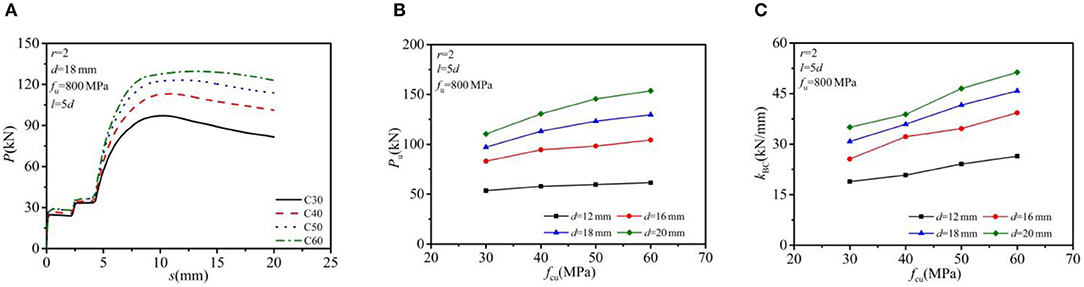
Figure 11. Effect of concrete strength: (A) load–slip curve; (B) shear-bearing capacity; and (C) shear stiffness.
Figure 12 contours some analyzed compressive damaged areas of concrete slabs with 18 mm MBSCs under various concrete strengths. The red areas experienced more than 90% damage, while the blue areas enveloped the whole areas experiencing compressive damage. The damaging area (colored by red) in the slab with the strength of C30 was more extensive than that of C60, indicating that the lower concrete strength caused a more severe and considerable damaging area.
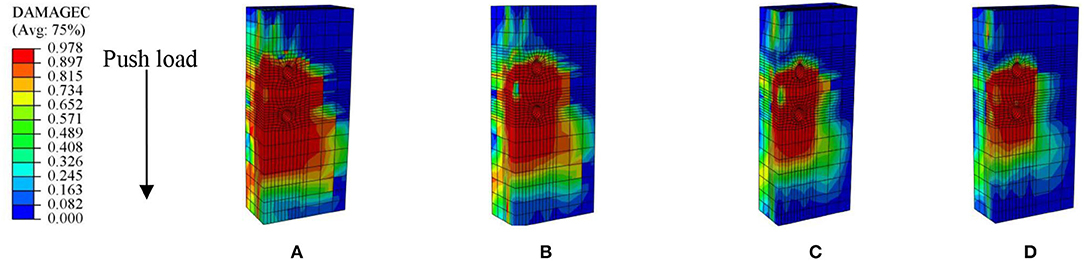
Figure 12. Analyzed compressive damage on the concrete slab with an 18 mm bolt connector: (A) C30; (B) C40; (C) C50; and (D) C60.
Design Recommendations
At present, design recommendations for predicting the ultimate shear resistance (Pu) of bolt shear connectors in SCCBs have been suggested by several researchers (Kwon et al., 2010; Liu et al., 2015; Chen et al., 2019; Zhang et al., 2019; Yang et al., 2020), which are listed in Supplementary Table 3. The units for variables in the expression are N and mm. It can be seen that the calculation formulas proposed by Kwon et al. (2010), Liu et al. (2015), and Yang et al. (2020) took the effective cross-sectional area (Asc) and the tensile strength (f u) of bolt connectors into consideration as the primary influence factors for shear capacity. In fact, the concrete strength (f cu or f ck) influences the shear performance of bolt connectors in SCCBs. Chen et al. (2019) and Zhang et al. (2019) considered this parameter in their calculation of formulas Equations (6) and (7). It should be noted that the proposed formulas Equations (5)–(8) were developed when bolt connectors were in the normal arrangement. Although a modified formula Equation (9) considering the multiple bolts effect was presented, it was based upon the push-off tests with 16 mm MBSCs and was mainly applicable for 16 mm bolt connectors.
Table 2 presents the comparison between the calculated capacities and the test results (Dallam, 1968; Kwon et al., 2010; Dai et al., 2015; Ataei et al., 2016; Du et al., 2017; Chen et al., 2019; Zhang et al., 2019, 2020). represents the results predicted by different equations. It can be seen that the equation suggested by Kwon et al. (2010) was relatively conservative (μ = 0.743, η = 0.220). The values calculated by other formulas Equations (6)–(9) were in good agreement with the test results, in which the values estimated by Equations (6) and (8) were relatively close to the tested. Supplementary Figure 6 presents the comparison of the calculated results from Equations (6) and (8) with the test results. represents the calculated shear resistance. It was seen in comparison that the values predicted by Equation (6) produced more accuracy than Equation (8) on the shear capacity of the bolt connector (η = 0.155 for /, η = 0.220 for /).
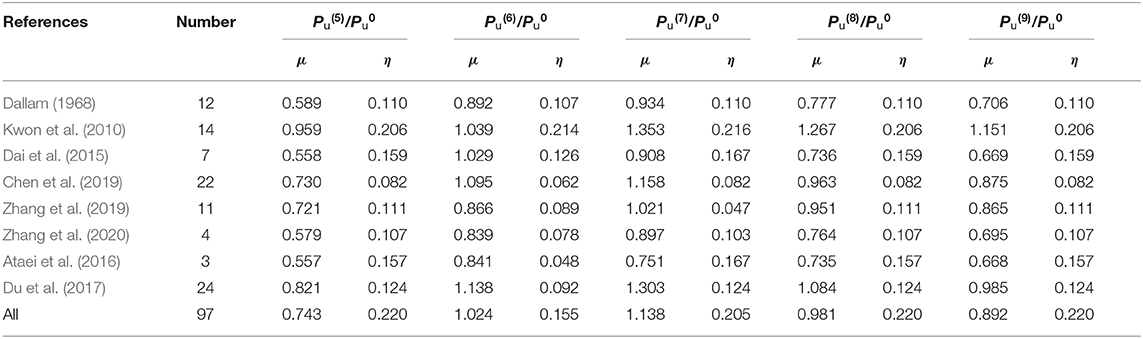
Table 2. Comparison between calculated capacities and test results (Dallam, 1968; Kwon et al., 2010; Dai et al., 2015; Ataei et al., 2016; Du et al., 2017; Chen et al., 2019; Zhang et al., 2019, 2020).
Based on the parametric studies and the comparison results of aforementioned various design formulas, a modified equation considering the multiple bolts effect (α) was suggested for predicting the shear-bearing capacity per bolt connector in MBSCs, which can be expressed as:
where, α = 1.0 when bolts arranged uniformly or r ≤ 2; α = 0.95 when r = 3; α = 0.88 when r = 4.
The shear capacities obtained from the parametric studies and the tested results (Yang et al., 2020) were compared with the values predicted by Equation (10), as shown in Figure 13. The mean values (μ) of / and / were 0.974 and 0.977, with the η of 0.045 and 0.043, respectively. Therefore, the formula Equation (10) proposed in this study to predict the shear-bearing capacity per bolt in MBSCs applied in SCCBs was feasible.
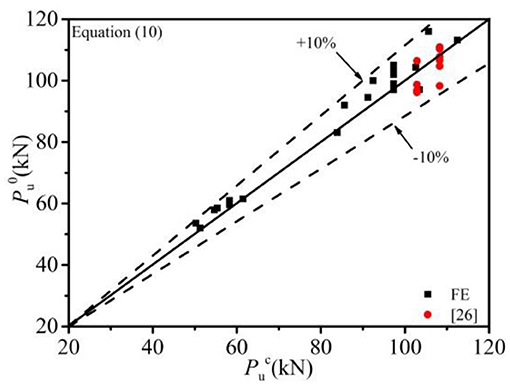
Figure 13. Comparison of the calculated results with the FE example results and the tested (Yang et al., 2020).
Conclusions
The multiple bolts effect and the mechanical behavior of bolt shear connectors in MBSCs were investigated using the FE modeling. A 3D FEM of the push-off tests was developed, and the accuracy of the FEM was validated against the available test results. Based on the verified model, the shear performance of bolt connectors in MBSCs was then studied. Parametric studies were further performed to study the influence of the bolt spacing, bolt row numbers, the concrete strength, and the bolt diameter on the shear resistance, shear stiffness, and the load–slip relationship of bolt connectors in MBSCs. Based on these investigations, the following conclusions were summarized:
1. The 3D non-linear numerical model was capable of accurately predicting the fundamental behavior of the bolt shear connector in push-off tests on the shear resistance and the load–slip relationship.
2. The gap due to bolt–hole clearance affected the distribution of shear among connectors. When the load was increased from 0 to 0.8Pu, the average load transfer rate of the top and bottom layers increased faster than that of the middle layers. When the load increased from 0.8Pu to Pu, the average growth rate of the bolt transfer load of the top and bottom layers slowed down, while the bolt transfer load of middle layers accelerated.
3. Multiple bolts effect made the bolt connectors to sustain an uneven force. The average shear strength and stiffness of the single bolt in MBSCs were lower than that of customarily arranged bolts. The plastic deformation of bolts and concrete slab holes on the upper layer (near the load) was relatively more extensive than that of the other layers.
4. The bolt spacing has little influence on the shear capacity of bolt connectors in MBSCs, but it can reduce its shear stiffness. 7d could be suggested as the optimal bolt spacing. The average shear capacity and stiffness per bolt connectors in MBSCs decreased with the increase of the bolt row numbers and increased with the increase of the bolt diameter and the concrete strength.
5. Based on the comprehensive parametric studies and the formulas proposed by Chen, a practical design formula considering the multiple bolt effect was presented for predicting the shear capacity per bolt in MBSCs, and the estimated results agreed reasonably well with the FE analysis and the test results.
Data Availability Statement
The original contributions presented in the study are included in the article/Supplementary Material, further inquiries can be directed to the corresponding author.
Author Contributions
WW and X-dZ: conceptualization. WW, X-lZ, LW, and H-jZ: investigation. WW: numerical simulation and writing-original draft. X-dZ and LW: writing-review and editing. All authors: read and agreed to the published version of manuscript.
Conflict of Interest
X-lZ was employed by the company CCCC Second Highway Consultants Co., Ltd.
The remaining authors declare that the research was conducted in the absence of any commercial or financial relationships that could be construed as a potential conflict of interest.
Supplementary Material
The Supplementary Material for this article can be found online at: https://www.frontiersin.org/articles/10.3389/fmats.2021.625425/full#supplementary-material
References
American Association of State Highway and Transportation Officials (2007). LFRD Bridge Design Specifications, 4th Edn. Washington, DC: American Association of State Highway and Transportation Officials.
Ataei, A., Bradford, M., and Liu, X. (2016). Experimental study of composite beams having a precast geopolymer concrete slab and deconstructable bolted shear connectors. Eng. Struct. 114, 1–13. doi: 10.1016/j.engstruct.2015.10.041
Ataei, A., Zeynalian, M., and Yazdi, Y. (2019). Cyclic behaviour of bolted shear connectors in steel-concrete composite beams. Eng. Struct. 198:109455. doi: 10.1016/j.engstruct.2019.109455
Chen, J., Wang, W., Ding, F., Xiang, P., Yu, Y., Liu, X., et al. (2019). Behavior of an advanced bolted shear connector in prefabricated steel-concrete composite beams. Materials 12:2958. doi: 10.3390/ma12182958
Dai, X., Lam, D., and Saveri, E. (2015). Effect of concrete strength and stud collar size to shear capacity of demountable shear connectors. J Struct Eng. 141, 1–10. doi: 10.1061/(ASCE)ST.1943-541X.0001267
Dallam, L. (1968). High strength bolt shear connectors-pushout tests. J. Proc. 65, 767–769. doi: 10.14359/7511
Dedic, D., and Klaiber, F. (1984). High-strength bolts as shear connectors in rehabilitation work. Concrete Int. 6, 41–46.
Ding, F., Yin, G., Wang, H., Wang, L., and Guo, Q. (2017). Static behavior of stud connectors in bi-direction push-off tests. Thin Walled Struct. 120, 307–318. doi: 10.1016/j.tws.2017.09.011
Ding, F., Ying, X., Zhou, L., and Yu, Z. (2011). Unified calculation method and its application in determining the uniaxial mechanical properties of concrete. Front. Architect. Civil Eng. China 5, 381–393. doi: 10.1007/s11709-011-0118-6
Ding, F., and Yu, Z. (2006). Strength criterion for plain concrete under multiaxial stress based on damage Poisson's ratio. Acta Mech. Solida Sin. 19, 307–316. doi: 10.1007/s10338-006-0637-1
Du, H., Zhang, B., Hu, X., Kou, L., and Xia, Y. (2017). Experimental study on shear behavior of bolt connectors in steel-concrete composite beams. J. Build. Struct. 38, 308–314. doi: 10.14006/j.jzjgxb.2017.S1.043
Eurocode 4 (2004). Design of Composite Steel and Concrete Structures, Part 1.1: General Rules and Rules for Buildings. Brusseles.
GB 50017-2017 (2017). Code for Design of Steel Structures. Beijing: China Architecture and Building Press.
Japan Society of Civil Engineers (2006). Guideline for Performance Verification of Steel Concrete Hybrid Structures. Tokyo: Japan Society of Civil Engineers.
Kozma, A., Odenbreit, C., Braun, M., Veljkovic, M., and Nijgh, M. (2019). Push-out tests on demountable shear connectors of steel-concrete composite structures. Structures 21, 45–54. doi: 10.1016/j.istruc.2019.05.011
Kwon, G., Engelhardt, M., and Klingner, R. (2010). Behavior of post-installed shear connectors under static and fatigue loading. J. Construct. Steel Res. 66, 532–541. doi: 10.1016/j.jcsr.2009.09.012
Kwon, G., Engelhardt, M., and Klingner, R. (2011). Experimental behavior of bridge beams retrofitted with postinstalled shear connectors. J. Bridge Eng. 16, 536–545. doi: 10.1061/(ASCE)BE.1943-5592.0000184
Lam, D. (2007). Capacities of headed stud shear connectors in composite steel beams with precast hollowcore slabs. J. Construct. Steel Res. 63, 1160–1174. doi: 10.1016/j.jcsr.2006.11.012
Lam, D., and Ellobody, E. (2005). Behavior of headed stud shear connectors in composite beam. J. Struct. Eng. 1, 96–107. doi: 10.1061/(ASCE)0733-9445(2005)131:1(96)
Liu, X., Bradford, M., and Ataei, A. (2017). Flexural performance of innovative sustainable composite steel-concrete beams. Eng. Struct. 130, 282–296. doi: 10.1016/j.engstruct.2016.10.009
Liu, X., Bradford, M., Chen, Q., and Ban, H. (2016). Finite element modelling of steel–concrete composite beams with high-strength friction-grip bolt shear connectors. Finite Elements Anal. Design 108, 54–65. doi: 10.1016/j.finel.2015.09.004
Liu, X., Bradford, M., and Michael, S. (2015). Behavior of high-strength friction-grip bolted shear connectors in sustainable composite beams. J. Struct. Eng. 141, 1–12. doi: 10.1061/(ASCE)ST.1943-541X.0001090
Loh, H., Uy, B., and Bradford, M. (2006). The effects of partial shear connection in composite flush end plate joints part II-analytical study and design appraisal. J. Construct. Steel Res. 62, 391–412. doi: 10.1016/j.jcsr.2005.07.010
Marshall, W., Nelson, H., and Banerjee, H. (1971). An experimental study of the use of high-strength friction-grip bolts as shear connectors in composite beams. Struct. Eng. 49, 171–178.
Ollgaard, J., Slutter, R., and Fisher, J. (1971). Shear strength of stud connectors in lightweight and normal-weight concrete. AISC Eng. J. 8, 55–64.
Pavlović, M., Marković, Z., Veljković, M., and Budevac, D. (2013). Bolted shear connectors vs. headed studs behavior in push-out tests. J. Constructi. Steel Res. 88, 134–149. doi: 10.1016/j.jcsr.2013.05.003
Spremic, M., Markovic, Z., Veljkovic, M., and Budjevac, D. (2013). Push-out experiments of headed shear studs in group arrangements. Adv. Steel Construct. 9, 139–160. doi: 10.18057/IJASC.2013.9.2.4
Suwaed, A., and Karavasilis, T. (2017). Novel demountable shear connector for accelerated disassembly, repair, or replacement of precast steel-concrete composite bridges. J. Bridge Eng. 22, 1–18. doi: 10.1061/(ASCE)BE.1943-5592.0001080
Xu, C., Sugiura, K., Wu, C., and Su, Q. (2012). Parametrical static analysis on group studs with typical push-out tests. J. Construct. Steel Res. 72, 84–96. doi: 10.1016/j.jcsr.2011.10.029
Xue, D., Liu, Y., Yu, Z., and He, J. (2012). Static behavior of multi-stud shear connectors for steel-concrete composite bridge. J. Construct. Steel Res. 74, 1–7. doi: 10.1016/j.jcsr.2011.09.017
Yang, F., Liu, Y., Jiang, Z., and Xin, H. (2018). Shear performance of a novel demountable steel-concrete bolted connector under static push-out tests. Eng. Struct. 160, 133–146. doi: 10.1016/j.engstruct.2018.01.005
Yang, T., Liu, S., Qin, B., and Liu, Y. (2020). Experimental study on multi-bolt shear connectors of prefabricated steel-concrete composite beams. J. Construct. Steel Res. 173:106260. doi: 10.1016/j.jcsr.2020.106260
Zhang, Y., Chen, B., Liu, A., Pi, Y., Zhang, J., Wang, Y., et al. (2019). Experimental study on shear behavior of high strength bolt connection in prefabricated steel-concrete composite beam. Composites Part B 159, 481–489. doi: 10.1016/j.compositesb.2018.10.007
Keywords: steel–concrete composite beam, multi-bolt connector, push-off test, FEM, multiple bolts effect, shear bearing capacity
Citation: Wang W, Zhang X-d, Zhou X-l, Wu L and Zhu H-j (2021) Study on Shear Behavior of Multi-Bolt Connectors for Prefabricated Steel–Concrete Composite Beams. Front. Mater. 8:625425. doi: 10.3389/fmats.2021.625425
Received: 03 November 2020; Accepted: 29 March 2021;
Published: 30 April 2021.
Edited by:
Xuemei Liu, The University of Melbourne, AustraliaReviewed by:
Zhang Tao, Zhengzhou University of Aeronautics, ChinaShikun Lu, Xi'an University of Technology, China
Copyright © 2021 Wang, Zhang, Zhou, Wu and Zhu. This is an open-access article distributed under the terms of the Creative Commons Attribution License (CC BY). The use, distribution or reproduction in other forums is permitted, provided the original author(s) and the copyright owner(s) are credited and that the original publication in this journal is cited, in accordance with accepted academic practice. No use, distribution or reproduction is permitted which does not comply with these terms.
*Correspondence: Lin Wu, d2wyNTY3MjRAd2h1dC5lZHUuY24=