 Francesco Valentini
 Luca Fambri
 Andrea Dorigato
 Alessandro Pegoretti
- Department of Industrial Engineering and Istituto Nazionale di Scienza e Tecnologia dei Materiali (INSTM) Research Unit, University of Trento, Trento, Italy
New materials capable of storing thermal energy in view of building applications have been developed from the foaming of ethylene-propylene diene monomer (EPDM) rubber with the addition of paraffin as a phase change material (PCM) at a melting temperature of about 21°C. Considering that the EPDM foams prepared by using traditional chemical blowing agents are generally characterized by a rather elevated environmental load, the salt leaching technique has been selected (and optimized) for the production of an EPDM foam with geometrical density of 0.41 g/cm3. It has been demonstrated that the produced foams were capable of retaining up to 62 wt% of paraffin after a 38-days leaking test. The role of the absorption of paraffin on the thermal and mechanical properties of the produced foams has been investigated. The effective thermal energy of the PCM content (PCMeff) measured by differential scanning calorimetry (DSC) was 52% both in the heating and cooling scans. Shore A test, compression set (CS) test, and quasi-static compression test above and below the thermal transition of the selected PCM have been performed, and a strong dependence of materials in respect to the testing temperature has been observed, with paraffin acting as a hardener above its melting point and as a softener below its melting point. Moreover, the evaluation of the thermal energy storage (TES) performance of the foams by monitoring their surface temperature during a heating/cooling process revealed that the time required from the samples to reach the set temperature due to the presence of paraffin was three times higher in comparison to the reference sample without paraffin. Moreover, in the plateau due to paraffin melting/crystallization, heating/cooling rates of around 0.4°C/min have been found, which are much lower with respect to that of a reference sample (>1.5°C/min). Thermal efficiency and thermal intervals for the application of EPDM/paraffin have been determined in a most accurate manner and therefore have been performed DSC at a heating/cooling rate of 1°C/min. These TES-EPDM foams exhibited a thermal capacity of 120–128 J/g with an operative interval in the range from −20°C to 40°C. The produced foams were capable of maintaining their geometry after being subjected to 240 heating/cooling cycles between 0 and 40°C, and their residual TES capacity was higher than 90% for all the samples (about 95% for the materials tested on aluminum substrate). The most interesting properties for TES applications were found for the produced foams via salt leaching with 60–80 microns NaCl.
Introduction
In order to limit the consequences caused by global warming, it is necessary to find the solutions capable of limiting the energy consumption of buildings. In recent years, the environmental regulations issued by governments, as a response to the continuous increase in the worldwide energy demand, have stimulated the research on innovative thermal energy storage (TES) technologies (Mofijur et al., 2019). Alexiadis (2007) showed that the human activity-related CO2 emissions has become a main driving force in global warming and, moreover, housing and tertiary buildings are responsible for the consumption of 46% of the energy demand and for the release of 19% of the CO2 emissions (Hongois et al., 2011). Considering that the annual solar energy incident on buildings is greater than the energy needs for hot water and heating, the possibility of storage of this thermal energy can become an innovative way to reduce the energy demand (Hongois et al., 2011). Energy storage systems are based on the accumulation of different forms of energy (thermal, electrical, chemical, etc.) when available in order to use it in a later time (Hongois et al., 2011; Fernandes et al., 2012; Anisur et al., 2013). TES systems store seasonal or daily thermal energy in a storage medium in order to use it in a later time (i.e., the energy stored in summer in order to be used in winter; Hongois et al., 2011) or to limit the energy absorption peaks due to air conditioning of buildings (Bo et al., 2004; Meshgin et al., 2012). In order to store a large amount of thermal energy, latent heat TES systems are of particular interest: their working principle is the transition of the material from a physical state to another state and for this reason they are called phase change materials (PCMs) (Bo et al., 1999; Peng et al., 2004; Borreguero et al., 2010; Dorigato et al., 2017b). Examples of PCM are paraffin waxes (Pielichowska and Pielichowski, 2014; de Gracia and Cabeza, 2015; Fredi et al., 2017; Galvagnini et al., 2020; Valentini et al., 2021), polyethylenglycol (PEG; Dorigato et al., 2019), and fatty alcohols (Valentini et al., 2020). Paraffins are organic PCMs widely used for the thermoregulation of buildings (Borreguero et al., 2010; Castellon et al., 2010), sportswear (Rigotti et al., 2018), smart fabrics (Fallahi et al., 2010; Salaün et al., 2010; Fredi et al., 2018), due to their low cost, a high heat of fusion, noticeable chemical stability, and a broad range of melting temperatures (Bo et al., 1999, 2004; Peng et al., 2004). For a practical use, the PCMs need to be confined by encapsulation (Fredi et al., 2018, 2019) or by the stabilization of shape (Phadungphatthanakoon et al., 2011; Dorigato et al., 2017a; Fredi et al., 2017) in order to avoid their leakage after the melting process. The stabilization of shape can be performed by using polymer matrices such as high-density polyethylene (Hong and Xin-shi, 2000), polypropylene (Krupa et al., 2007), poly(methylmethacrylate) (Sari et al., 2009), polyurethane copolymers (Cao and Pengsheng, 2006), acrylic resins (Kaygusuz et al., 2008), styrene–butadiene–styrene rubber, and ethylene-propylene diene monomer (EPDM) rubber (Valentini et al., 2021).
Rubber foams are expanded materials whose porosity has been obtained by means of chemical or physical blowing agents, which are widely used for the production of thermal insulators, gaskets, and impact sound deadening products (Dutta and Cakmak, 1992; Yamsaengsung and Sombatsompop, 2008; Wimolmala et al., 2009). Physical blowing agents (such as water, hydrocarbons, etc.) expand as a consequence of a pressure decrease or temperature increase (Saechtling, 2006) while chemical blowing agents (such as sodium and potassium carbonates, azodicarbonamide, etc.) cause the expansion of a material due to their decomposition at a high temperature and the release of specified gases (CO2, nitrogen; Michaeli and Sitz, 2010; Stehr, 2015; Hopmann et al., 2016). Expanded rubbers can be made of natural rubber (NR; Kim et al., 2007; Najib et al., 2011; Bashir et al., 2012) or synthetic rubber such as styrene-butadiene rubber (SBR; Nah et al., 2001; Choi et al., 2004), acrylonitrile butadiene rubber (NBR; El Lawindy et al., 2002; Mahmoud et al., 2006), chlorinated polyethylene rubber (CPE; Zhang et al., 2010), polychloroprene rubber (CR; Bardy et al., 2005), and EPDM rubber (El Lawindy et al., 2002; Zakaria et al., 2007; Yamsaengsung and Sombatsompop, 2009; Valentini et al., 2021). Especially, EPDM foams are used in the production of gaskets, O-rings, window seals, belts, the electrical insulation of cables, and waterproofing membranes (Datta, 2001).
In the current context of environmental concerns regarding human activities, the reduction of the foaming agents-related impact should be also considered. Most of them are indeed hazardous for the human health and their use is not allowed in the EU (Hopmann et al., 2016; European Chemical Agency, 2020). A potential alternative to the use of commercial foaming agents is a technique of salt leaching: it consists of the dispersion of water-soluble particles (i.e., sodium chloride) in the material during the production process and of the subsequent dissolution in hot water, with the formation of a porous cellular network (Oh et al., 2003; Mosanenzadeh et al., 2013; Scaffaro et al., 2016c,d). This technology has been successfully proposed for the production of porous polymeric scaffolds for tissue engineering (Scaffaro et al., 2016b,c,d), monolayer rubber stamps made of NBR rubber (Trakanpruk and Rodthong, 2008), and soft sensor made of silicon rubber (Chen et al., 2019).
Despite the lower environmental impact related to the production of elastomeric foams by using a technique of “particle leaching,” only few studies have been reported in the open literature on this topic (Trakanpruk and Rodthong, 2008; Chen et al., 2019). Moreover, no studies regarding the use of this technology for the production of elastomeric foams capable of stabilizing the shape of paraffin can be found in the open literature.
On the basis of these considerations and considering the need of novel materials for the reduction of energy consumption of buildings, the aim of this work is an application of the salt leaching technique for the production of the paraffin-containing EPDM rubber foams and TES-EPDM foams, which are as promising materials for TES applications.
Materials and Methods
Materials
A commercial paraffin wax was properly selected as a PCM to store/release thermal energy in a thermal interval close to room temperature, i.e., Rubitherm RT21HC, with a melting point of 20–23°C and a heat storage capacity (ΔHm) of about 190 J/g, as declared in the technical data sheet of the producer (Rubitherm GmbH-Berlin, Germany; Rubitherm, 2020).
Ethylene-propylene diene monomer rubber Vistalon® 2504, containing 58 wt% of ethylene and 4.7 wt% of ethylidene norbornene, with 25 MU of Mooney viscosity (ML 1+4 at 125°C, according to ASTM D1646) was purchased from Exxon Mobil (Irving, TX, USA). Sulfur (a vulcanizing agent), zinc oxide (a curing activator), and stearic acid (a curing activator and lubricating agent) were supplied by Rhein Chemie (Cologne, Germany). Carbon black N550 (a reinforcing filler) was purchased from Omsk Carbon group (Omsk, Russia). Zinc dibutyl dithiocarbamate (ZDBC) and tetramethylthiuram disulfide (TMTD), accelerators, were obtained from Vibiplast srl (Castano Primo, MI, Italy). PEG with a molecular weight of 2,000 Da was acquired from Alfa Aesar (Kandel, Germany) and was used to connect salt particles and to improve the leaching efficiency.
The elastomeric compound used for the preparation of the samples consisted of Vistalon® 2504 (100 phr), sulfur (3 phr), zinc oxide (3 phr), stearic acid (1 phr), carbon black (20 phr), ZDBC (2.5 phr), and TMTD (0.87 phr). The reference quantity of Vistalon® 2504 used for the preparation of the samples was 13.6 g.
Sodium chloride (density 2.16 g/cm3), of commercial grade, was ground and sieved in two fractions by using a 230- and 200-mesh sieve in order to obtain two set of granulometries in the range of 60–80 μm and 80–100 μm, respectively. These granulometries were selected in accordance with the results of the previous studies because they allowed to minimize the residual salt content and to optimize the homogeneity of the material (Zonta et al., 2021). The ground salt particles were then dried and stored in an oven at 60°C.
Sample Preparation
Ethylene-propylene diene monomer foams were prepared by melt compounding in an internal mixer (Thermo Haake Rheomix® 600), equipped with counter rotating rotors. The compounding temperature was fixed at 40°C while the rotor speed was set at 50 rpm. First, EPDM was fed into the mixer with the carbon black and mixed for 5 min, then the vulcanizing agent and the additives were added and mixed for 5 min. Then, 305 phr of NaCl and 30 phr of PEG were gradually added into the mixer in order to obtain a fine and homogeneously dispersed powder. The total mixing time was equal to 15 min. The vulcanization process of the resulting compounds was carried out in a hot press under a pressure of 2 bars and at a temperature of 170°C for 20 min. Finally, NaCl and PEG were removed by leaching in a bath of demineralized water at a temperature of 80°C for 3 h. The samples were then dried overnight in an oven at 60°C. In this way, square sheets of EPDM foams (110 × 110 × 5 mm) were obtained. The production process and the relative parameters used in this work have been optimized in the previous studies on these systems (Zonta et al., 2021). A preliminary analysis of this work was carried out in order to verify the optimal amount of salt used for the leaching process. Samples containing 285, 305, and 325 phr of salt were prepared: it was verified that a higher amount led to a loss of salt during the mixing process, which leads to an inhomogeneous mixing, while a lower NaCl amount led to the presence of a high content of residual salt due to an inefficient interconnection in the leaching process.
The addition of paraffin to the material has been carried out by a direct immersion of the vulcanized samples within a RT21HC bath, preheated at 40°C, and occurred within 60 s. The EPDM foam was firstly floated in the molten paraffin and then rapidly sank; after the evolution of air bubbles the TES-EPDM foam was extracted and dropped. The determination of the effective paraffin content within the foams was made through leaking tests (see Section Experimental Techniques). A schematic representation of the process is shown in Figure 1A.
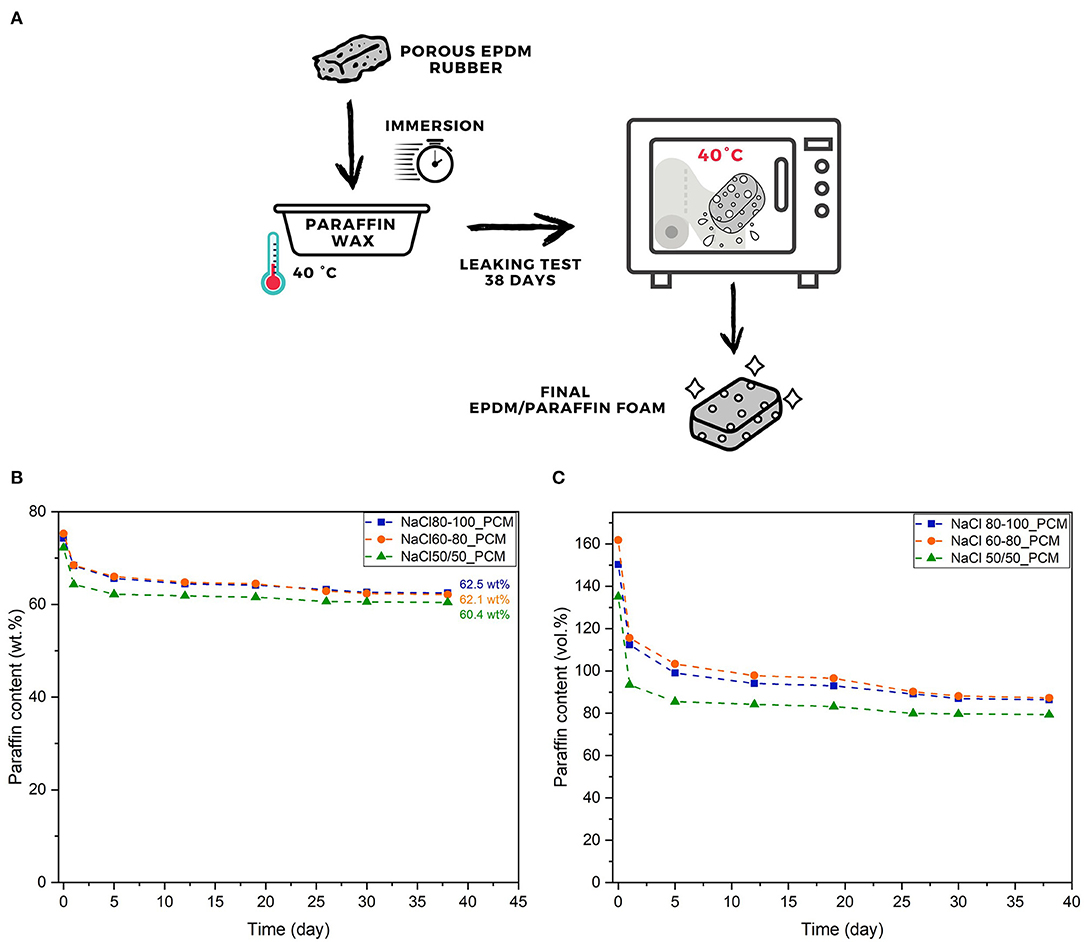
Figure 1. Scheme of a paraffin impregnation process for the production of the thermal energy storage (TES) ethylene-propylene diene monomer (EPDM) foam (A) and the results of the leaking tests at 40°C in terms of: (B) paraffin weight percentage, and (C) paraffin volume percentage up to 38 days.
The prepared EPDM and TES-EPDM foams are: NaCl 60-80 (without PCM), NaCl 80-100_PCM, NaCl 60-80_PCM, and NaCl 50/50_PCM. The names are composed by the term NaCl followed by the size of the salt in microns used for the production. The sample NaCl 50/50 was produced by using 50 wt% of salt particles with a size of 60–80 μm and using 50 wt% of salt with a size of 80–100 μm. As a reference material without paraffin, the sample NaCl 60-80 was selected (Zonta et al., 2021). In order to identify the foams with paraffin, the suffix PCM was used.
Experimental Techniques
The capability of the prepared materials to retain paraffin has been investigated through a leaking test performed in an oven at 40°C. Foam specimens after the immersion in paraffin were placed in an oven on an absorbent paper towel, and the mass of the specimens was monitored for a period of 38 days in order to determine the maximum quantity of paraffin that they were capable of retaining. The residual paraffin content was calculated as a fraction of weight and volume with respect to the weight of each sample without paraffin. The samples were then used for a subsequent characterization.
The cryofractured surfaces of the foams were observed through a Jeol IT300 scanning electron microscope (SEM), operating at an accelerating voltage of 10 kV in the case of 1000x magnification and at 20 kV in the case of 100x magnification. Before the observations, the samples were metallized under vacuum through the deposition of a thin electrically conductive Pt/Pd coating.
Pycnometric density (ρpicn) measurements were conducted by using an AccuPycII 1330 helium pycnometer (Micrometrics Instrument Corporation, Norcross, GA, USA) operating at a temperature of 23°C. For each sample, 30 measures were performed. Geometrical density [ρgeom; i.e., mass over the total volume inclusive of solid phase, closed and open porosity (OP)] was determined on cylindrical specimens (5 mm thickness and 10 mm diameter) by measuring the mass through an analytical Gibertini E42 balance (0.1 mg sensitivity) and their dimensions by using a caliper (resolution of 0.01 mm). Five specimens were tested for each sample. Following the ASTM D6226 standard, it was possible to calculate the total porosity (Ptot) and the percentage of OP according to Equations (1, 2):
where ρbulk is the density of the bulk materials (also taking into account the paraffin content) calculated by considering the relative amount of EPDM and paraffin (determined after a 38-day leaking test) and by considering the density of EPDM [i.e., 1.042 g/cm3, in agreement with the values given in the literature (Wang et al., 2006)] and of liquid paraffin (i.e., 0.77 g/cm3, in accordance with the technical data sheet).
An investigative study on the thermal degradation behavior of the prepared materials was carried out by thermogravimetric analysis (TGA), in order to assess the influence of the foaming process on the degradation resistance of the materials. TGA was performed through a TA-I Q5000 IR thermobalance (sensitivity 1 × 10⁻⁴ mg) under a nitrogen flow (10 cm3/min) in a temperature interval between 30 and 700°C, at a heating rate of 10°C/min. The temperature associated to a mass loss of 2% (T2%), the temperature associated to the maximum degradation rate (Tpeak), the mass loss in the range of 100–230°C (m100−230), the residual mass at 230°C (m230), the mass loss in the range of 230–415°C (m230−415), the residual mass at 415°C (m415), and the residual mass at 700°C (m700) were determined.
Differential scanning calorimetry (DSC) tests were performed on the prepared foams by using a Mettler DSC30 calorimeter under a nitrogen flow (100 cm3/min) with a thermal cycle of heating/cooling/heating in the range between −30 and 60°C at 10°C/min, and at 1°C/min. By this way, the melting temperature in the first heating scan and the second heating scan (Tm1, Tm2), the crystallization temperature (Tc,), and the specific melting and crystallization enthalpy values (ΔHm1, ΔHc, ΔHm2) were obtained. The volumetric specific enthalpy P was evaluated by multiplying the enthalpy values by the geometrical density of each sample (ρgeom), i.e., as Ph = ΔHm1 × ρgeom and Pc = ΔHc × ρgeom, respectively. In the case of paraffin, the density values reported in the technical data sheet have been used (0.88 g/cm3 in the solid state, 0.77 g/cm3 in the liquid state). Moreover, the effective PCM content in the foams was determined in the first heating scan (), the cooling scan (), and the second heating scan () as the ratio between the specific enthalpy of the samples and the corresponding specific enthalpy values of the neat paraffin, RT21HC (PCM), as shown in Equations (3–5):
where ΔHm1PCM, ΔHcPCM, ΔHm2PCM are, respectively, the specific enthalpy values associated to the melting during the first heating scan, the crystallization in the cooling stage, and melting during the second heating scan of the neat PCM. For testing at 10°C/min, the integration intervals from −20 to 60°C and from 20 to −30°C were selected in heating and cooling, respectively. In the case of a low heating/cooling rate (±1°C/min), the integration of EPDM/paraffin thermograms was reported as the sum of two peaks (the first occurring at around −10°C and the second at around 19°C), and the relative PCM content was also determined.
Shore A hardness tests were performed by using a Hilderbrand Durometer following the ASTM D2240 standard. Square samples of 20 mm wide and 6 mm thick were tested, after pressing an indenter against the specimen for a time equal to 10 s. The tests were performed at 0 and 40°C, i.e., below and above the melting point of paraffin, respectively. At least 10 measurements were performed for each composition.
Compressive properties under quasi-static conditions were measured on squared specimens with dimensions equal to 15 × 15 × 5 mm, through an Instron 5969 tensile testing machine equipped with a load cell of 10 kN and operating at a cross-head speed of 1 mm/min. Compressive modulus, normalized by the geometrical density of each sample (EN), was measured as a secant value between the strain levels of 0.1 and 0.5 mm/mm. The deformation of the samples corresponding to a stress equal to 5 MPa (ε5) has been also evaluated. Moreover, the stress values (normalized by the geometrical density of each sample) corresponding to a deformation of 0.6 mm/mm (σ0.6) have been calculated. At least five specimens were tested for each composition.
Compression set (CS) measurements were carried out in accordance with the ASTM D395-85 standard for 22 h at 70°C and at 0°C. Recovery measurements were made after 30 min. The test specimens had a diameter of 12 mm and a thickness of around 6 mm, while the spacing bars had a thickness of 4.5 mm. In the case of the test at 0°C, the thickness of the specimens was also monitored for 260 min in order to observe the evolution of the CS values as a function of time (due to a temperature increase and consequent paraffin melting).
The CS (Cb) has been evaluated in accordance with Equation (6):
where t0 is the initial thickness of the specimen, ti the final thickness, and tu the thickness of the spacing bars.
The thermal energy performance of the TES-EPDM foams was investigated by monitoring their surface temperature through an IR thermal camera FLIR E60 (emissivity = 0.95). The specimens were preconditioned in an oven at 40°C overnight, and then inserted in a humidostatic chamber at a temperature of 5°C. The surface temperature was then monitored until the thermal equilibrium between the samples and the environment was reached. In the same way, the specimens were cooled in a refrigerator at −20°C overnight, and then inserted in an oven at a temperature of 40°C. The surface temperature was then monitored for 75 min. In the heating tests, the time required to reach a temperature of 30°C (t30) and of 40°C (t40) was evaluated, in the cooling test, the time required to reach a temperature of 10°C (t10) and of 5°C (t5) was determined.
The reliability of the materials in terms of capability of retaining paraffin after several melting/crystallization cycles was evaluated according to the two testing sequences.
Sequence 1: the three TES-EPDM foams were tested for 10 days performing 240 heating/cooling cycles between 0 and 40°C by using an Angelantoni humidostatic chamber. The duration of each cycle was 1 h and each sample was tested on different substrates: letter paper (grammage 80 g/m2), absorbent paper (grammage 40 g/m2), and aluminum foil (thickness 10 μm). The weight of each specimen was taken before and after the test, and the residual PCM content was evaluated. Moreover, the residual TES capacity (Residual TES) was evaluated for the three samples at the end of the first sequence of cycles, considering the residual PCM content and the melting enthalpy evaluated in the second scan of the DSC test at 1°C/min.
Sequence 2: after the cycles described in Sequence 1, the samples were (1) stored for 3 months at room temperature above Tm; (2) then subjected to two short cycles from 0 to 40°C on the same substrate; and (3) eventually stored on the three substrates at 40°C for 7 days and at 0°C for further 7 days. Performance of the three TES-EPDM foams at the end of Sequence 2 was determined in terms of residual PCM content and consequently as Residual TES (residual TES capacity).
Results and Discussion
The capability of the produced foams to retain paraffin has been investigated through leaking tests. The results are presented in Figures 1B,C.
From the results presented in Figure 1B, it is possible to observe that the produced samples present a similar absorption behavior and are capable of absorbing a huge amount of paraffin (up to 75 wt%). The excess of paraffin is mainly lost on the 1st day of leaking test due to the high paraffin residues present on the surface of the samples. Starting from the 5th day of leaking test, the paraffin loss is very low and is ~0 after 30 days. The sample NaCl 80-100_PCM shows the highest paraffin content at the end of the test (i.e., 62.5 wt%) followed by the NaCl 60-80_PCM (62.1 wt%) and by the NaCl 50/50_PCM (60.4 wt%). From the results presented in Figure 1C, it is possible to observe that the produced foams are capable of absorbing up to 160 vol% of paraffin and this huge absorption is possible due to a volume increase in the EPDM foam upon the addition of PCM. The trend of paraffin loss shown in Figure 1C confirms that the leakage of paraffin occurs mainly within the first 5–10 days of the test and after a period of 38 days the sample NaCl 80-100_PCM is capable of retaining a paraffin amount equal to 86.4 vol%, the sample NaCl 60-80_PCM a paraffin amount of 87.3 vol%, and the sample NaCl 50/50_PCM a paraffin amount of 79.4 vol%. In accordance with the information obtained from this test, it is clear that the preparation of samples with a lower paraffin amount with respect to the residual paraffin content reported in Figure 1 can avoid any paraffin leakage from the samples. In these conditions, it is possible to use free paraffin instead of microencapsulated systems, with substantial cost savings and higher TES performances.
Scanning electron microscope observations were performed in order to analyze the morphological features of the produced samples and to verify the role of the paraffin absorption. Looking at the micrographs for a magnification of 100x presented in Figures 2A,C,E, it is possible to observe the presence of OP, with lower concentration and smaller dimensions in comparison to the porosity observed in the corresponding EPDM foams without paraffin presented in a previous work (Zonta et al., 2021). In this magnification, the presence of paraffin cannot be detected, however, it can be hypothesized that the lower pore concentration is due to the presence of paraffin partially filling the pores.
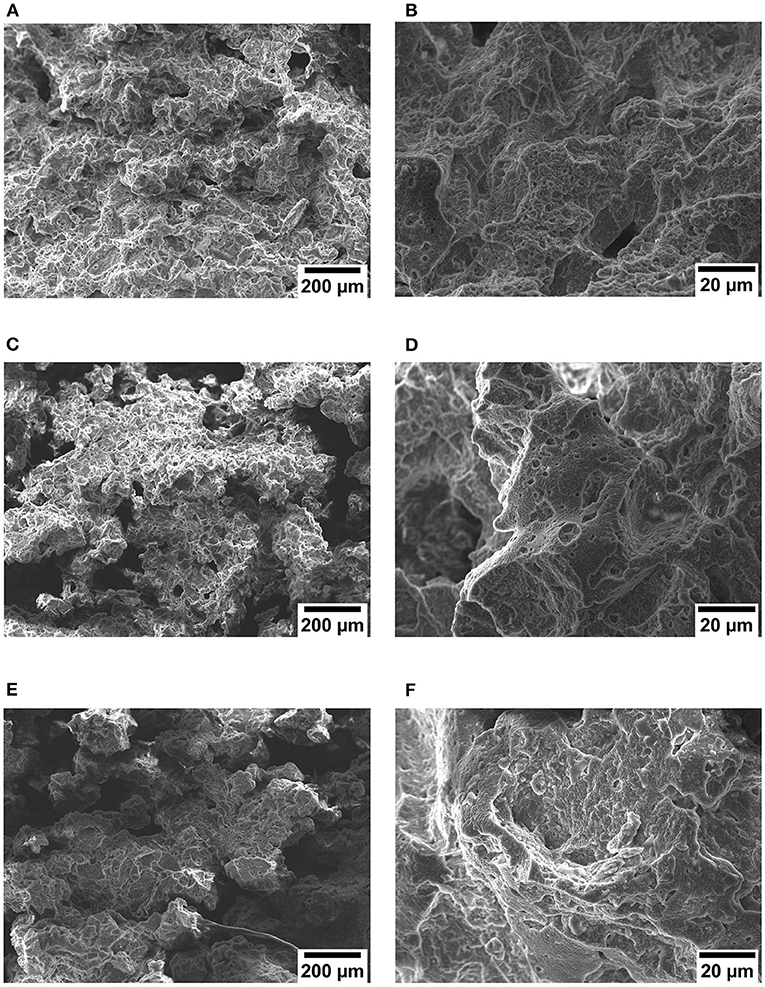
Figure 2. Scanning electron microscope (SEM) micrographs of the prepared TES-EPDM foams at a defined magnification: (A) NaCl 80-100_PCM (100x), (B) NaCl 80-100_PCM (1000x), (C) NaCl 60-80_PCM (100x), (D) NaCl 60-80_PCM (1000x), (E) NaCl 50/50_PCM (100x), and (F) NaCl 50/50_PCM (1000x).
It is possible to observe in micrographs at higher magnification (1000x) presented in Figures 2B,D,F that paraffin is uniformly distributed on the surface of the material forming a covering layer. This behavior was already observed in a previous work on EPDM foams prepared through conventional foaming agents in which paraffin was added during the production process (Valentini et al., 2021). Considering the fact that paraffin is partially filling the porosity and is present on the fracture surfaces, it can be hypothesized that after the immersion of samples in the molten PCM it followed the path created by the OP to diffuse within the materials, and it was then partly absorbed by the EPDM matrix, thus determining the observed volume increase.
In order to correlate the morphology of the prepared samples with their porosity values, density measurements were performed. From the results listed in Table 1, it is possible to observe that the samples containing paraffin are characterized by density values almost equal to those of the reference sample without paraffin (NaCl 60-80) because of the volume increase associated to the addition of paraffin. The porosity values are around 54% (i.e., lower than 64% that is detected for the unfilled foam) and they do not seem to be influenced by the salt size used for the production of the samples. Looking at the ρpicn values, it is possible to observe that they are higher in comparison to the corresponding ρgeom values but lower in comparison to the ρpicn value of the sample NaCl 60-80: the reason for this behavior can be the presence of paraffin inside the porosity of the foams that results in a lower porosity content of these samples. It should be noticed that the total porosity was assumed to be equal to the OP: the presence of unleached salt leads to a higher value of OP due to its higher density (2.16 g/cm3; Scaffaro et al., 2016a) in comparison to an EPDM matrix.
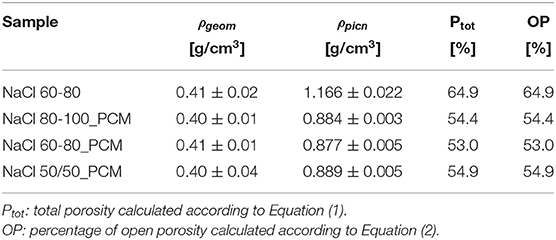
Table 1. Density and porosity values of the prepared ethylene-propylene diene monomer (EPDM) and thermal energy storage- (TES-) EPDM foams.
Thermogravimetric curves of the tested samples along with the corresponding derivative curves are presented in Figures 3A,B while the most significant results are presented in Table 2.
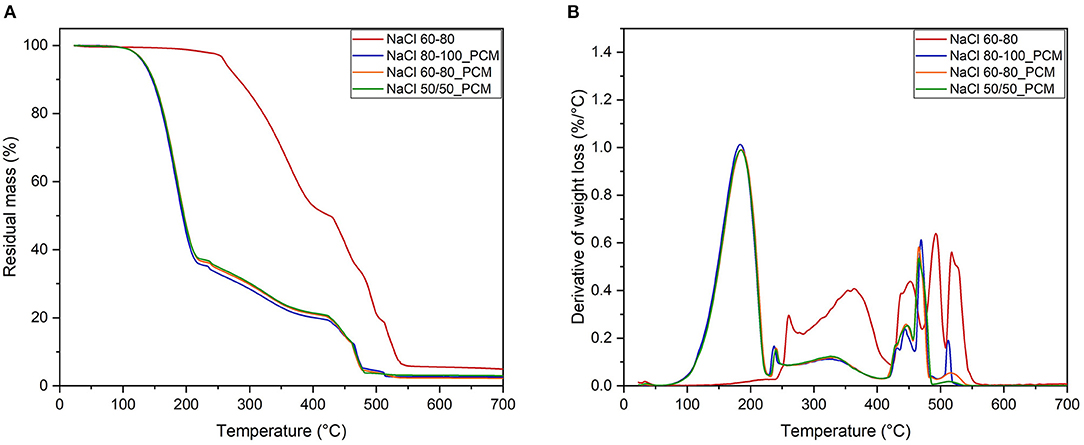
Figure 3. Thermogravimetric analysis (TGA) curves: residual mass (A) and derivative of mass loss (B).
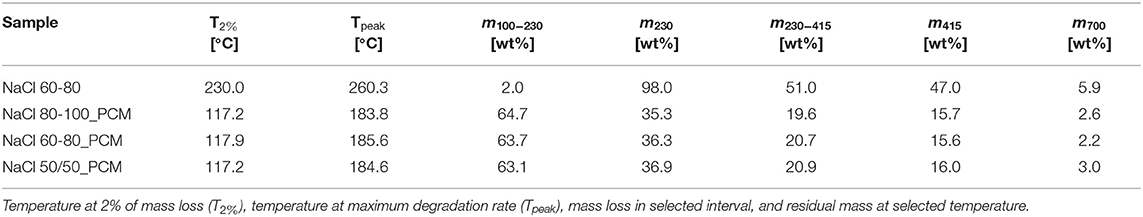
Table 2. Results of the thermogravimetric analysis (TGA) tests of the EPDM and TES-EPDM foams.
The foam NaCl 60-80 shows an initial weight loss of about 2% in the range of 180–230°C that could be attributed to the loss of the most volatile materials, such as low molecular weight plasticizers and oils. The degradation of a foamed rubber occurs in two steps: the main degradation stage is observed in the range of 230–415°C and attributed to the mass loss related to the OP (Zonta et al., 2021), followed by a second degradation step of a residual bulk material up to about 500°C. Moreover, from 520°C to about 540°C, the mass loss can be associated to the thermolysis of carbon black.
The samples containing paraffin show a main degradation step in the interval of 150–230°C with a maximum rate of around 185°C (Tpeak), which is related to the degradation of the PCM: the values of m100−230 confirm the paraffin content values of the three samples of around 63%, which are in good agreement with the gravimetric evaluation of PCM leakage (Figure 1). From the difference of residual mass at 230°C (m230) and 415°C (m415), it is possible to calculate an initial mass loss of rubber phase around 47% in the case of a simple foam NaCl 60-80 and about 43% for NaCl 60-80 PCM (after the normalization and exclusion of paraffin loss), and the similar results could be calculated for the other PCM foamed rubbers. Moreover, in above 415°C, an analogous trend of mass loss for the second step of the foamed rubber degradation could be observed by comparing the values of m415 and m700 for the samples with or without PCM. TGA thermograms and derivative curves show an evidence of a similar temperature interval although the intensity of mass loss is inversely proportional to the initial paraffin content.
The residue at 700°C (m700) of the sample NaCl 60-80, of around 6 wt%, corresponds to the presence of inorganic by-products derived from the degradation of common compounded additives and of the residual salt in the elastomeric matrix. The m700 values of the samples NaCl 80-100_PCM, NaCl 60-80_PCM, and NaCl 50/50_PCM are 50–60% lower in comparison to the NaCl 60-80 foams due to the complete degradation of paraffin occurring at a lower temperature. Normalizing data with the exclusion of paraffin, it is also possible to estimate the real residue (R) referred to the main rubber content, as shown in Equation (7).
The real residue results 6.0% for NaCl 60-80 and 6.1% for NaCl 60-80_PCM while resulting 7.4% for NaCl 80-100_PCM and 8.1% for NaCl 50-50_PCM, where probably some more salts remained trapped in the foamed rubber.
The thermograms of DSC tests performed at 10°C/min of the tested samples and of the neat paraffin are presented in Figures 4A–C while the most significant results are listed in Table 3.
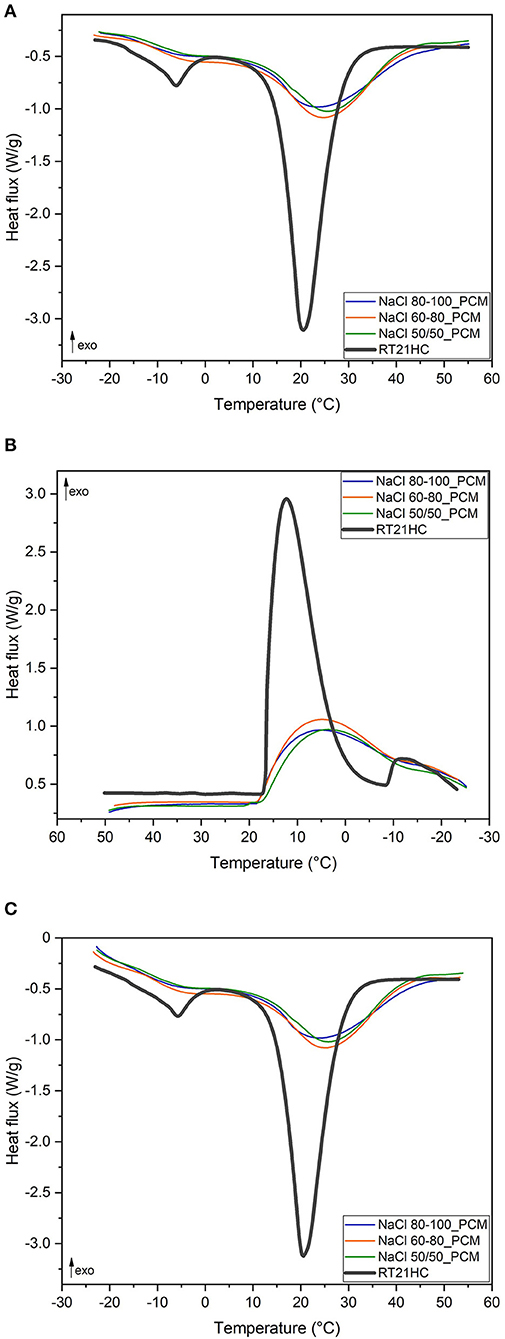
Figure 4. Differential scanning calorimetry (DSC) curves of the TES-EPDM foams and phase change material (PCM) at ±10°C/min: (A) first heating scan, (B) cooling scan, and (C) second heating scan.
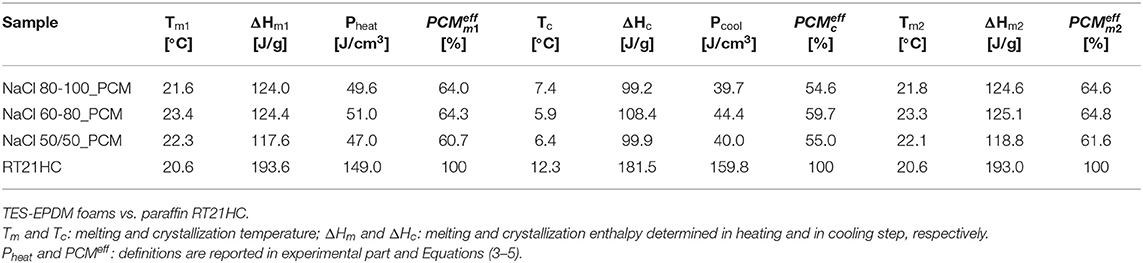
Table 3. Selected data of temperature/enthalpy in a heating-cooling-heating cycle performed in differential scanning calorimetry (DSC) at 10°C/min.
From the thermograms presented in Figures 4A–C, it is possible to observe the melting peak of the PCM at around 21°C whose intensity is proportional to the paraffin content in each sample. A secondary melting peak at a lower temperature is also visible only in the curve of RT21HC in the range of −15°C and 0°C, either in the first heating or in the second heating. This is probably due to the presence of a low molecular weight paraffin fraction within the PCM, with a lower melting temperature, and lower crystallization temperature, as shown in Figure 4B. On the other hand, thermograms of the PCM foams do not show a clear secondary peak, but only a wider shoulder at a lower temperature of the main melting (Figures 4A,C) and crystallization peaks (Figure 4B).
Concerning melting temperature in the first scan and the second scan, Tm1 and Tm2 values, of the TES-EPDM foams, it is possible to observe a shift toward higher temperatures from 20 to 23°C, which can be attributed to a low thermal conductivity of the foamed EPDM matrix. For same reasons, the Tc values of the TES-EPDM foams are also lower in comparison to the crystallization temperature of the PCM (around 6°C instead of 12°C). Analyzing ΔHm1 and ΔHm2, it is possible to observe that the samples NaCl 80-100_PCM, NaCl 60-80_PCM, and NaCl 50/50_PCM show an interesting total TES capability in the range of −20 to −60°C (around 120 J/g). In particular, it can be especially noticed that the melting enthalpies are proportional to the paraffin amount. Comparing the and the with the data reported in Figures 1B,C and with the m100−230 values reported in Table 2, it is possible to observe that all the results are comparable with each other and that the effective paraffin content is around 60–64% for all the samples. The volumetric thermal parameter of the produced foams (Pheat) is around 60–64 J/cm3. It is possible to observe that the thermal properties in cooling (ΔHc, Pcool, ) are lower in comparison to the properties in heating: this behavior is due to the shift of the curves toward lower temperatures that preclude the correct evaluation of the crystallization properties. The sample NaCl 60-80_PCM is characterized by the highest thermal performances both in terms of relative melting and crystallization enthalpies (, , ) and of the volumetric TES parameter (Pheat, Pcool). The better performances of sample NaCl 60-80_PCM could be attributed to any inhomogeneous distribution of paraffin within the volume of the prepared foams. In any case, it should be noticed that the thermal properties of the three samples are almost the same. Comparing the results of the second heating scan with the results of the first heating scan, it is possible to observe that they are the same for the three samples (118–124 J/g): there is no variation in thermal efficiency during the thermal cycle, confirming the ability of all the produced foams to retain paraffin in both the melting and cooling processes between −30 and 60°C.
Shore A values, reported in Table 4, show an evidence of the low hardness of the NaCl 60-80 foam and demonstrate a high porosity content of this material. In the case of NaCl 60-80, the influence of temperature on the hardness of the material is very limited while in the case of samples containing paraffin, the effect is clearly visible due to a phase transition of the PCM that occurs at around 21°C. In particular, the sample with the highest hardness is the NaCl 80-100_PCM that shows a value equal to 13.3 at 0°C and 5.3 at 40°C while the lowest values are those of the NaCl 50/50_PCM that shows a value equal to 6.8 at 0°C and 2.6 at 40°C.
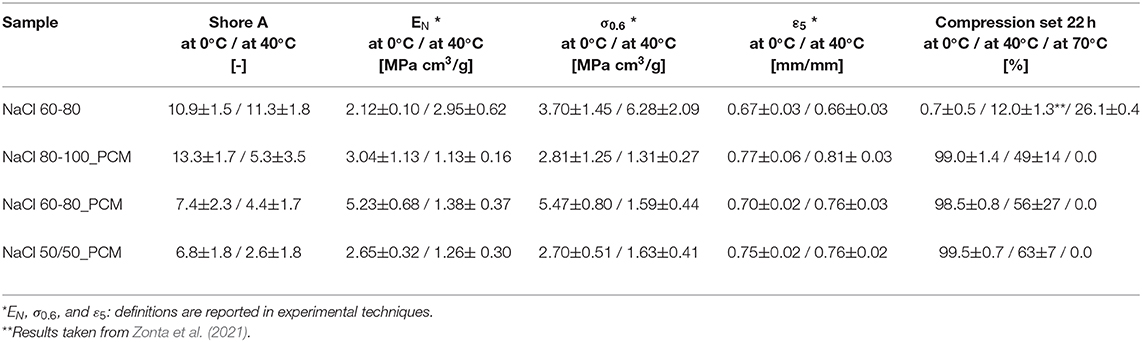
Table 4. Comparison of the results of the Shore A hardness, quasi-static compression tests (normalized modulus, selected stress, and deformation) and compression set (CS) of the EPDM and TES-EPDM foams at different temperatures.
Compressive curves of the EPDM and TES-EPDM foams below and above room temperature are compared in Figures 5A,B while the main results are summarized in Table 4. The role of paraffin on the mechanical properties at different temperatures is immediately evident. At 0°C, due to the presence of solid paraffin, the samples NaCl 80-100_PCM, NaCl 60-80_PCM, and NaCl 50/50_PCM are characterized by the elastic modulus values, which are slightly higher than the values of NaCl 60-80. The curves are characterized by a very large stress plateau that is associated to the progressive deformation of the porosity, followed by an evidence of an increase in the slope of the curves when densification occurs. The strain at which densification starts can be identified by looking at the ε5 values: it occurs at around 0.67 mm/mm in the case of NaCl 60-80 and at a slightly higher deformation in the case of samples containing paraffin (from 0.70 mm/mm in the case of NaCl 60-80_PCM to 0.77 mm/mm in the case of NaCl 80-100_PCM). Considering the stress at 0.6% (σ0.6), it is possible to show an evidence of the highest value (5.47 MPa cm3/g) for the sample NaCl 60-80_PCM, followed by the NaCl 80-100_PCM and NaCl 50/50_PCM with values lower than NaCl 60-80 (3.7 MPa cm3/g).
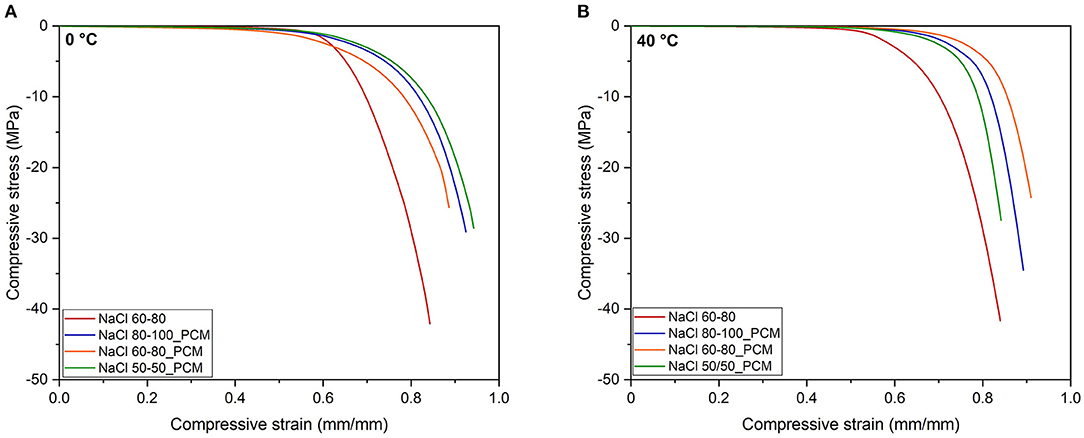
Figure 5. Representative compression stress–strain curves (A) at 0°C and (B) at 40°C from quasi-static tests on the EPDM and TES-EPDM foams.
At 40°C, the samples NaCl 80-100_PCM, NaCl 60-80_PCM, and NaCl 50/50_PCM are characterized by the compressive modulus values that are almost half in comparison to the values obtained at 0°C due to the presence of liquid paraffin that acts as a softener of the elastomeric matrix. This behavior can be easily detected by looking at the curves presented in Figure 5B: the stress plateau is characterized by extremely low stress values as it can be noticed by looking at the σ0.6: the stress values causing the deformation of the porosity are around 1 MPa cm3/g, and it is more evident in the difference in comparison to the NaCl 60-80. The plateau ends at deformation levels of around 0.76 mm/mm as demonstrated from the ε5 values, where a rapid densification occurs and causes a strong increase in the stress.
Looking at the permanent deformation values obtained from a CS reported in Table 4, it is possible to observe the influence of the temperature on the samples containing paraffin. At 70°C, the samples NaCl 80-100_PCM, NaCl 60-80_PCM, and NaCl 50/50_PCM are capable of recovering completely the deformation imposed during the test. On the contrary, at 0°C, the samples are almost unable to recover the deformation with the CS values higher than 95%. At 23°C, the CS values are the mean value between the values obtained at 0 and 70°C. In the case of samples containing paraffin, the CS values are characterized by an elevated SD, due to proximity to the melting point of paraffin. It can be therefore concluded that the operating temperature can completely change the behavior of these foams due to a strong role of paraffin acting as a softener and hardener at high temperature and low temperature. No substantial differences can be observed by changing the salt granulometry in the PCM-filled foams.
Compression set values of the samples containing paraffin stored at 0°C tend to decrease within the recovery time, up to about 4 h, as shown in Figure 6, due to the temperature increase that causes paraffin melting. It can be observed that a first rapid increase until 60 min followed by a second slow increase with a plateau-like trend from 60 to 120 min (probably due to the paraffin melting) and by a final rapid increase within 140 min results in a complete recovery of the deformation of the tested samples.
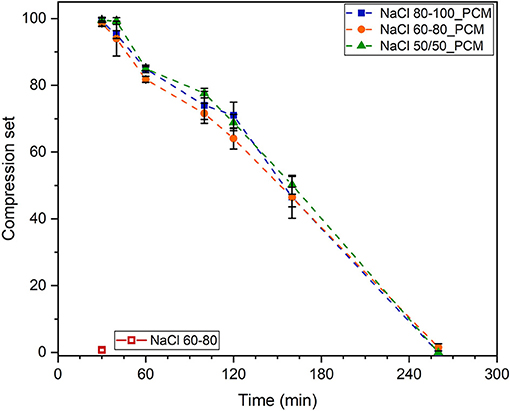
Figure 6. Compression set (CS) values of TES-EPDM foams stored at 0°C for 22 h and tested at room temperature as function of time after recovery between 30 and 260 min.
Figures 7A,B report the result of the thermal imaging test of the EPDM and TES-EPDM foams. In the heating stage (Figure 7A), for the samples NaCl 80-100_PCM, NaCl 60-80_PCM, and NaCl 50/50_PCM, the temperature increases with a plateau-like trend due to the melting of paraffin at around 25°C, while the sample NaCl 60-80 quickly reaches the final temperature due to the absence of PCM. For the foams with PCM, the heating rates are initially very high (up to 4°C/min), then they reach a temporary stabilization at about 1°C/min (corresponding to the initial stage of paraffin melting) that is followed by a second plateau at about 0.4°C/min that continues until the paraffin is completely molten (i.e., in the temperature range of 20–30°C).
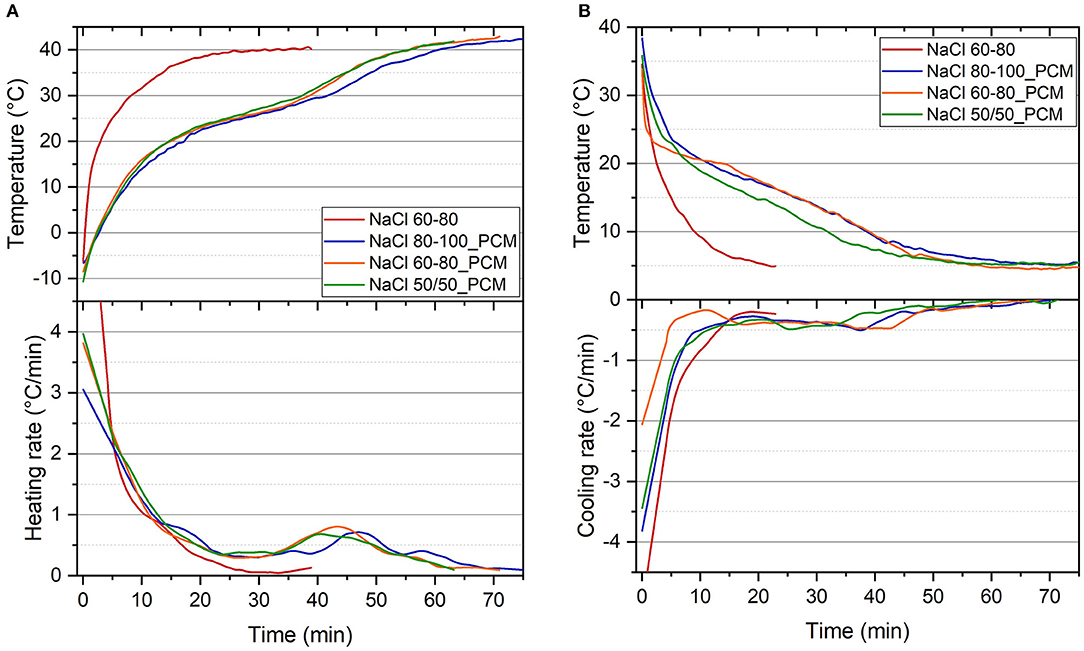
Figure 7. Surface temperature profiles of the EPDM and TES-EPDM foams, and correspondent rate of thermal variation after the thermal imaging tests in (A) heating stage from −20 to 40°C and (B) cooling stage from 40 to 5°C in 75 min.
A similar behavior is observed in cooling (Figure 7B): the temperature decreases with a plateau-like trend due to the crystallization of the PCM at around 22°C, while the sample NaCl 60-80 quickly reaches the final temperature. The cooling rates are initially very elevated (up to 4°C/min), then they slow down reaching a plateau at around 0.4°C/min that continues until paraffin is completely crystallized (i.e., in the temperature range of 10–20°C).
The results of the thermal imaging are summarized in Table 5, and they show an evidence in heating that the time required to reach 40°C (t40) is about 52–58 min for the samples NaCl 80-100_PCM, NaCl 60-80_PCM, and NaCl 50/50_PCM, whereas it is only 22 min for the NaCl 60-80. On the other hand, it is possible to observe in cooling that the time required to reach 5°C (t5) is about 47–55 min for the samples NaCl 80-100_PCM, NaCl 60-80_PCM, and NaCl 50/50_PCM, while it is only 17 min for the NaCl 60-80. The sample NaCl80-100_PCM shows the longest time to reach the set temperature because of its highest paraffin content as reported in Figures 1B,C. Moreover, it is worth noting that the time required to reach 30°C in heating (t30) and the time required to reach 10°C in cooling (t10) of NaCl 80-100_PCM and NaCl 60-80_PCM is four times longer than in the case of the NaCl 60-80 foam rubber.
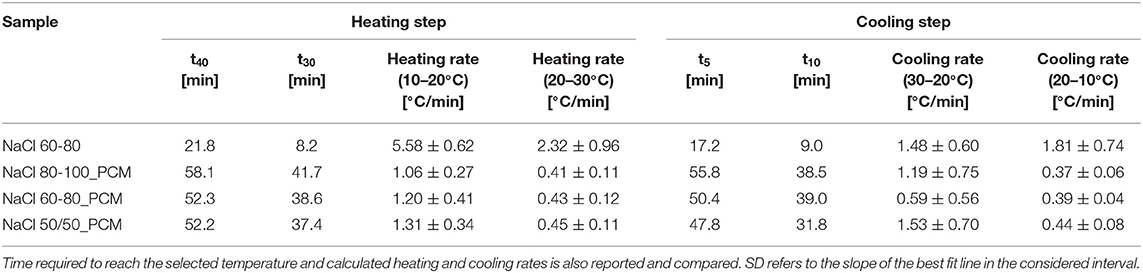
Table 5. Results of the thermal imaging tests on the EPDM and TES-EPDM foams in the heating and cooling step.
The heating rates of the samples NaCl 80-100_PCM, NaCl 60-80_PCM, and NaCl 50/50_PCM in the temperature interval 20–30°C are very similar (around 0.4°C/min) and much lower in comparison to the heating rate of the reference sample (2.3°C/min). The same behavior can be observed in cooling: in the temperature interval of 20–10°C the samples NaCl 80-100_PCM, NaCl 60-80_PCM, and NaCl 50/50_PCM show cooling rates of around 0.4°C/min, which are much lower in comparison to the cooling rate of the reference sample (1.8°C/min).
In the temperature interval of 10–20°C, the heating rates are higher (from 1.06°C/min to 1.31°C/min for NaCl 80-100_PCM, NaCl 60-80_PCM, and NaCl 50/50_PCM samples) but still lower in comparison to the reference sample (5.58°C/min). In the temperature interval of 30–20°C, the cooling rates are also higher (1.19°C/min and 1.53°C/min for NaCl 80-100_PCM and NaCl 50/50_PCM, 0.59°C/min for NaCl 60-80_PCM), which are lower in comparison to the reference sample (1.48°C/min).
In order to shed more light on the melting/crystallization behavior of the prepared TES-EPDM foams, specific DSC tests at a lower heating/cooling rate have been performed. In particular, a heating/cooling rate of ±1°C/min was selected as a good compromise between the results of the thermal imaging test and the sensitivity of DSC machine (i.e., its signal/noise ratio). DSC thermograms performed at this rate are reported in Figures 8A–C while the most important results are collected in Table 6. As a first, the paraffin RT21HC exhibits two well-distinct melting peaks in two intervals of about −15°C/−2°C and 0°C/21°C, respectively. The total enthalpy counts about 245 J/g in the first scan and 248 J/g in the second scan (see Table 6), with a relative energy percentage of 89% for the main peak. The crystallization in the cooling highlights the onset point at 17.3°C for the main peak and at −9.5°C for the secondary peak. It should be taken into account that the results of the last heating step are more representative and related to the real case of application because the material was previously crystallized at a low rate of cooling.
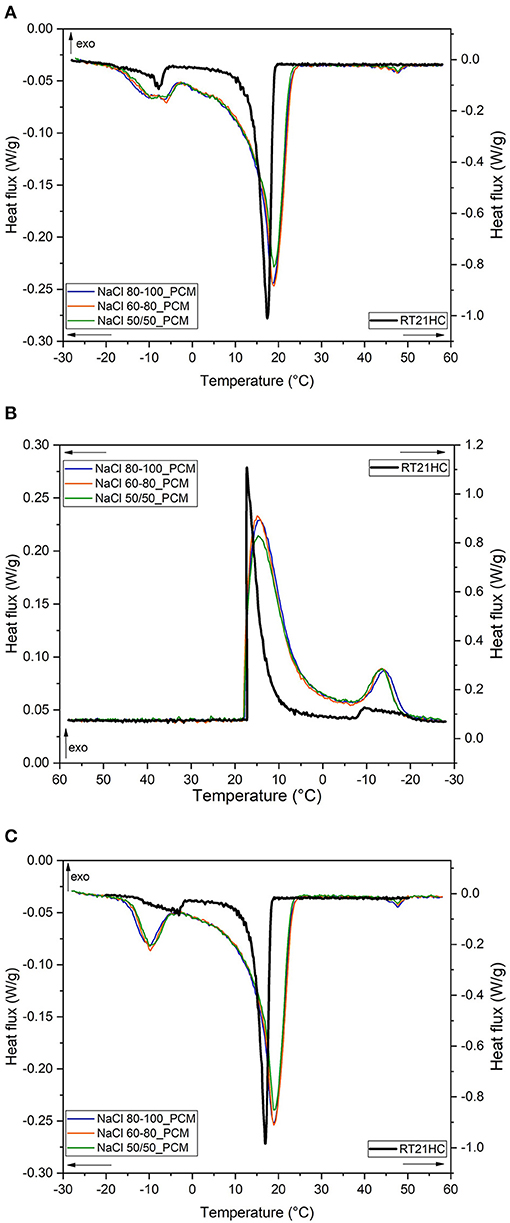
Figure 8. DSC curves of the TES-EPDM foams and PCM at ±1°C/min: (A) first heating scan, (B) cooling scan, and (C) second heating scan.
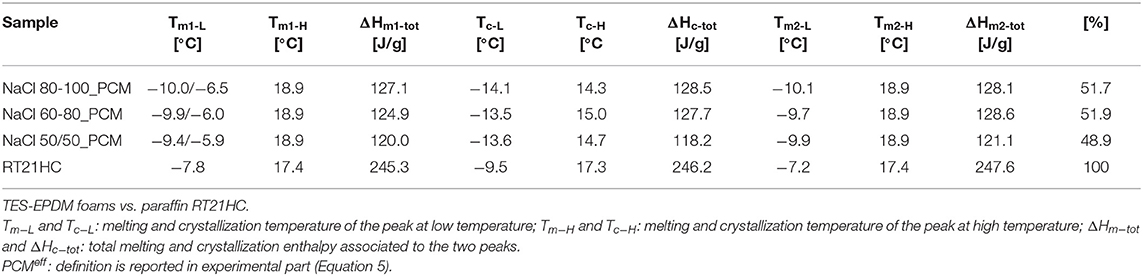
Table 6. Selected data of temperature/enthalpy in the heating-cooling-heating cycle performed in DSC at 1°C/min.
From the thermograms presented in Figures 8A–C, it is possible to observe that, at a low heating rate, i.e., 1°C/min, the main melting peak of paraffin is narrower and sharper in comparison to the previous test at 10°C/min and more confined around the melting point of paraffin that is equal to 19°C for all the samples. The same can be observed in the cooling stage.
It is also very interesting to underline that the low heating/cooling rates of the test allow to clearly distinguish the secondary peak at around −10°C in melting (onset temperature of −15°C) and at −13°C in crystallization (onset temperature of −7°C).
Moreover, in the thermograms of all the foams, a third very small peak at about 1 J/g can be detected at around 47–48°C that can be associated to the additives of rubber compound. On the other hand, in the cooling step, notwithstanding some questionable traces in the range of 35–25°C (Figure 8B), there is no easy way to detect any clear crystallization peak as usually observed for confined components in minority content.
Moreover, from the results reported in Table 6, it is also possible to observe that the value of melting temperature of a main peak in EPDM/paraffin samples are exactly the same (18.9°C) in the first heating scan (Tm1) and the second heating scan (Tm2), slightly higher than the neat paraffin (17.4°C). The crystallization temperatures in the TES-EPDM foams are equal to about 14–15°C, lower than the neat paraffin (17.3°C), due to the low thermal conductivity of a foamed rubber. Comparing these results with those reported in Table 3, it is possible to observe that the temperature shift between heating and cooling is lower due to the lower speed of the test, i.e., more similar to real conditions. In particular, in either the heating stage or the cooling stage, two distinct ranges could be considered, a higher temperature zone at about 15–20°C involving 89% of the total energy and a lower zone (from −5°C to −15°C) with the remaining 11% of energy, as well-depicted in Figure 8. The total melting and crystallization enthalpies are higher in comparison to those calculated in the previous test at 10°C/min. And the effective PCM content () in the EPDM/paraffin foams was around 52% for NaCl 60-80_PCM and NaCl 80-100_PCM, whereas it was slightly lower than 50% for NaCl 50-50_PCM.
Therefore, the DSC analysis at 1°C/min reveals to be very interesting and warmly recommended whenever possible for testing PCM, because this test not only reproduces conditions more similar to the real ones, but also allows getting the more complete information, for instance the better definition of the thermal properties of the paraffin, with the appearance of narrower melting peak, which could be advantageous in order to select a proper product for the desired application.
In order to evaluate the performance of the TES-EPDM foam, a double cycling test (Sequences 1 and 2) of heating-cooling between 40 and 0°C. From the results of the test Sequence 1, reported in Table 7, it is possible to observe that the paraffin loss is very limited in the case of aluminum foil substrate and higher in the case of absorbent paper and letter paper. The NaCl 60-80_PCM is the sample with the highest residual PCM content (60.5 wt% on aluminum foil, 58.8 wt% on absorbent paper, and 58.4 wt% on letter paper) and with the highest residual TES capacity (96.9% on aluminum foil, 94.1% on absorbent paper, and 93.4% on letter paper). The results of the test confirmed the capability of the samples to maintain their geometry and to retain paraffin on certain substrates (aluminum foil), while highlighting that a limited loss can occur in the case of particular substrates (paper).
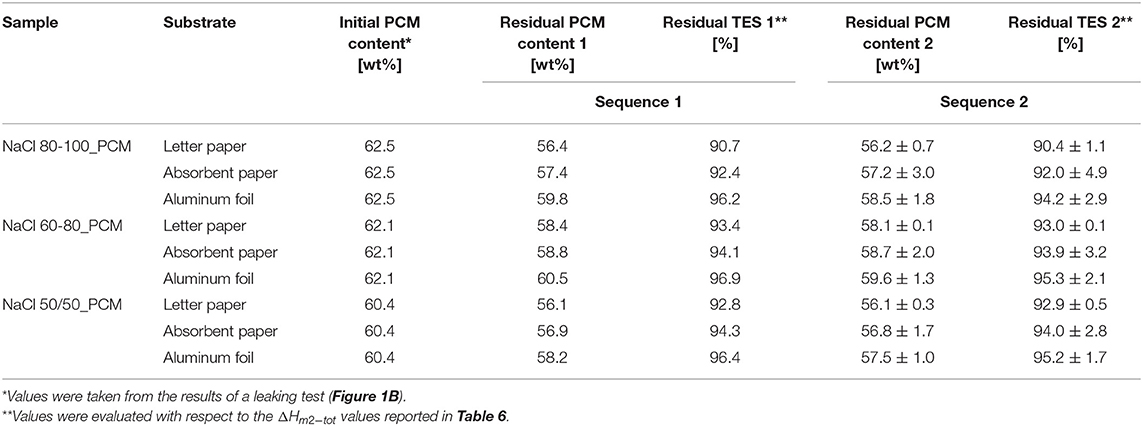
Table 7. Results of the thermal cycling test of TES-EPDM foams stored on different substrates, following Sequence 1 (240 cycles between 0 and 40°C in 10 days) and Sequence 2 (storage at room temperature for 3 months, 40°C for 7 h, and 0°C for 7 h).
The results of the test Sequence 2, after a long time of storage at room temperature (3 months) and a relatively long continuous permanence at 40 and 0°C (7 + 7 h), highlighted that all the TES-EDPM foams were capable of retaining the residual paraffin without further leaking, and a residual TES capacity of 90–96% was determined. The highest value was observed for NaCl 60-80_PCM stored on the aluminum substrate.
Conclusions
A new and an efficient method to produce the EPDM foams capable of absorbing a high amount of PCM has been presented, and useful data of the TES-EPDM foam for potential building applications have been obtained. Indeed, this work demonstrates that the EPDM foams produced through an environmentally friendly salt leaching technique could be an efficient material for the stabilization of the shape of paraffin-containing PCMs, and that they could be successfully applied for the thermal management of buildings. The produced EPDM foams were capable of retaining a considerable amount of paraffin (up to 62 wt% / 87 vol%). Density of the PCM-filled foams was almost equal to that of the corresponding foam without paraffin, due to a volume increase consequent to the paraffin absorption. The measurement of relative melting and crystallization enthalpies by DSC performed at ±1°C/min were 52%, which were slightly lower in comparison to the paraffin content measured at the end of the leaking test. TGA showed that the presence of paraffin decreased the thermal resistance of the foam that remains, in any case, at the values well above the operating temperature. Shore A values demonstrated a strong dependence of the produced materials on temperature due to the presence of paraffin that acted at 40°C as a softener of the elastomeric matrix, whereas as a hardener at 0°C. A similar effect was also observed with the CS test in which, below the melting point of paraffin, the samples were almost unable to recover deformation but, as soon as paraffin melted, they completely recovered deformation. Compression tests showed that the expanded samples due to the progressive deformation of the porosity presented a very large stress plateau at limited strain values. Measurements of the TES performances were carried out through the monitoring of their surface temperature revealed that the time required from the samples to reach the set temperature in the range between −20 and 40°C, due to the presence of paraffin, was 3–4 times longer in comparison to the reference sample. Moreover, it was observed that the heating/cooling rate in the temperature interval corresponding to paraffin melting/crystallization was around 0.4°C/min. A very significant note is that thermal analysis in DSC performed at a low heating-cooling rate, i.e., ± 1°C/min, was very notable to shed more light on the thermal properties of PCM-based materials, in view of a proper and successful application of PCM systems. Authors warmly suggest this low rate of PCM characterization in the DSC analysis, because the test conditions more similar to real conditions highlighted that the main melting peak of paraffin was narrower and sharper with respect to the test at 10°C/min and more confined around the melting point of paraffin that was equal to 19°C for all the samples. Finally, 240 heating/cooling cycles carried out on the produced foams on different substrates highlighted the absence of geometrical distortions and limited paraffin losses with a residual TES capacity higher than 90% for all the samples. Further cycles carried out after 3 months revealed no significant paraffin losses, confirming the ability of the foams to retain the PCM with a residual TES capacity of 118 ± 3 J/g.
In conclusion, TES-EPDM foams produced from 60 to 80 microns NaCl exhibited the most promising properties (residual TES capacity of 121 ± 1 J/g). Further research will be devoted to the application of these new materials and the simulation of their properties in a specific thermo-humidostatic chamber and in real cases of wall design.
Data Availability Statement
The original contributions presented in the study are included in the article/Supplementary Material, further inquiries can be directed to the corresponding author/s.
Author Contributions
FV: conceptualization, methodology, investigation, data curation, visualization, and writing—original draft. LF: methodology, data curation, funding acquisition, writing—review and editing. AD: funding acquisition, writing—review and editing. AP: funding acquisition, writing—review and editing, and supervision. All authors contributed to the article and approved the submitted version.
Funding
This work was partially funded by Provincia Autonoma di Trento (Italy) through Legge 6/99, project Compositi elastomerici a transizione di fase [E-PCM] prat. n. 23-16.
Conflict of Interest
The authors declare that the research was conducted in the absence of any commercial or financial relationships that could be construed as a potential conflict of interest.
Acknowledgments
Mrs. Claudia Gavazza is gratefully acknowledged for the acquisition of SEM micrographs.
Supplementary Material
The Supplementary Material for this article can be found online at: https://www.frontiersin.org/articles/10.3389/fmats.2021.660656/full#supplementary-material
References
Alexiadis, A. (2007). A review of climate change, mitigation and adaptation. Ecol. Modell. 203, 243–256. doi: 10.1016/j.ecolmodel.2006.11.020
Anisur, M. R., Mahfuz, M. H., Kibria, M. A., Saidur, R., Metselaar, I. H. S. C., and Mahlia, T. M. I. (2013). Curbing global warming with phase change materials for energy storage. Renew. Sustain. Energy Rev. 18, 23–30. doi: 10.1016/j.rser.2012.10.014
Bardy, E., Mollendorf, J., and Pendergast, D. (2005). Thermal conductivity and compressive strain of foam neoprene insulation under hydrostatic pressure. J. Appl. Phys. D 38:3832. doi: 10.1088/0022-3727/38/20/009
Bashir, M. A., Shahid, M., Alvi, R. A., and Yahya, A. G. (2012). Effect of carbon black on curing behavior, mechanical properties and viscoelastic behavior of natural sponge rubber-based nano-composites. Key Eng. Mater. 510–511, 532–539. doi: 10.4028/www.scientific.net/KEM.510-511.532
Bo, H., Gustafsson, E. M., and Setterwall, F. (1999). Phase transition temperature ranges and storage density of paraffin wax phase change materials. Energy 24, 1015–1028. doi: 10.1016/S0360-5442(99)00055-9
Bo, H., Martin, V., and Setterwall, F. (2004). Phase transition temperature ranges and storage density of paraffin wax phase change materials. Energy 29, 1785–1804. doi: 10.1016/j.energy.2004.03.002
Borreguero, A. M., Carmona, M., Sanchez, M. L., Valverde, J. L., and Rodriguez, J. F. (2010). Improvement of the thermal behaviour of gypsum blocks by the incorporation of microcapsules containing PCMS obtained by suspension polymerization with an optimal core/coating mass ratio. Appl. Thermal Eng. 30, 1164–1169. doi: 10.1016/j.applthermaleng.2010.01.032
Cao, Q., and Pengsheng, L. (2006). Hyperbranched polyurethane as novel solid–solid phase change material for thermal energy storage. Eur. Polym. J. 42, 2931–2939. doi: 10.1016/j.eurpolymj.2006.07.020
Castellon, C., Medrano, M., Roca, J., Cabeza, L. F., Navarro, M. E., Fernandez, A. I., et al. (2010). Effect of microencapsulated phase change material in sandwich panels. Renew. Energy 5, 2370–2374. doi: 10.1016/j.renene.2010.03.030
Chen, Q., Zhao, J., Ren, J., Rong, L., Cao, P. F., and Advincula, R. C. (2019). 3D printed multifunctional, hyperelastic silicone rubber foam. Adv. Funct. Mater. 29:1900469. doi: 10.1002/adfm.201900469
Choi, S.-S., Park, B.-H., and Song, H. (2004). Influence of filler type and content on properties of styrene-butadiene rubber (SBR) compound reinforced with carbon black or silica - Choi - 2004 - Polymers for Advanced Technologies - Wiley Online Library. Polym. Adv. Technol. 15, 122–127. doi: 10.1002/pat.421
Datta, S. (2001). “Synthetic elastomers,” in Rubber technologist's handbook, eds J. R. White and S. K. De. (Shawbury: Rapra Technology Ltd.), 61–64.
de Gracia, A., and Cabeza, L. F. (2015). Phase change materials and thermal energy storage for buildings. Energy Buildings 103, 414–419. doi: 10.1016/j.enbuild.2015.06.007
Dorigato, A., Canclini, P., Unterberger, S. H., and Pegoretti, A. (2017a). Phase changing nanocomposites for low temperature thermal energy storage and release. eXPRESS Polym. Lett. 11, 738–752. doi: 10.3144/expresspolymlett.2017.71
Dorigato, A., Ciampolillo, M. V., Cataldi, A., Bersani, M., and Pegoretti, A. (2017b). Polyethylene wax/EPDM blends as shape-stabilized phase change materials for thermal energy storage. Rubber Chem. Technol. 90, 575–584. doi: 10.5254/rct.82.83719
Dorigato, A., Fredi, G., and Pegoretti, A. (2019). Thermo-mechanical behavior of novel wood laminae-thermoplastic starch biodegradable composites with thermal energy storage/release capability. Front. Mater. 6:76. doi: 10.3389/fmats.2019.00076
Dutta, A., and Cakmak, M. (1992). Influence of composition and processing history on the cellular morphology of the foamed olefinic thermoplastic elastomers. Rubber Chem. Technol. 65, 932–955. doi: 10.5254/1.3538652
El Lawindy, A., El-Kade, K., Abd Mahmoud, W., and Hassa, H. (2002). Physical studies of foamed reinforced rubber composites Part I. Mechanical properties of foamed ethylene–propylene–diene terpolymer and nitrile–butadiene rubber composites. Polym. Int. 51, 602–606. doi: 10.1002/pi.916
European Chemical Agency (2020). European Chemicals Agency (ECHA). Available online at: https://echa.europa.eu/home (accessed December 22, 2020).
Fallahi, E., Barmad, M., and Haghighat Kish, M. (2010). Preparation of phase-change material microcapsules with paraffin or camel fat cores: application to fabrics. Iranian Polym. J. 19, 277–286. doi: 10.1177/0954008308101535
Fernandes, D., Pitié, F., Caceres, G., and Baeyens, J. (2012). Thermal energy storage: “how previous findings determine current research priorities.” Energy 39, 246–257. doi: 10.1016/j.energy.2012.01.024
Fredi, G., Dirè, S., Callone, E., Ceccato, R., Mondadori, F., and Pegoretti, A. (2019). Docosane-organosilica microcapsules for structural composites with thermal energy storage/release capability. Materials 12:1286. doi: 10.3390/ma12081286
Fredi, G., Dorigato, A., Fambri, L., and Pegoretti, A. (2017). Wax confinement with carbon nanotubes for phase changing epoxy blends. Polymers 9:405. doi: 10.3390/polym9090405
Fredi, G., Dorigato, A., and Pegoretti, A. (2018). Multifunctional glass fiber/polyamide composites with thermal energy storage/release capability. eXPRESS Polym. Lett. 12, 349–364. doi: 10.3144/expresspolymlett.2018.30
Galvagnini, F., Dorigato, A., Valentini, F., Fiore, V., La Gennusa, M., and Pegoretti, A. (2020). Multifunctional polyurethane foams with thermal energy storage/release capability. J. Thermal Anal. Calorimetry. doi: 10.1007/s10973-020-10367-w. [Epub ahead of print].
Hong, Y., and Xin-shi, G. (2000). Preparation of polyethylene–paraffin compound as a form-stable solid-liquid phase change material. Solar Energy Mater. Solar Cells 64, 37–44. doi: 10.1016/S0927-0248(00)00041-6
Hongois, S., Kuznik, F., Stevens, P., and Roux, J.-J. (2011). Development and characterisation of a new MgSO4–zeolite composite for long-term thermal energy storage. Solar Energy Mater. Solar Cells 95, 1831–1837. doi: 10.1016/j.solmat.2011.01.050
Hopmann, C., Lemke, F., and Nguyen Binh, Q. (2016). Foaming of EPDM with water as blowing agent in injection molding. J. Appl. Polym. Sci. 133, 1–11. doi: 10.1002/app.43613
Kaygusuz, K., Alkan, C., Sari, A., and Uzun, O. (2008). Encapsulated fatty acids in an acrylic resin as shape-stabilized phase change materials for latent heat thermal energy storage. Energy Sources A Recov. Util. Environ. Effects 30, 1050–1059. doi: 10.1080/15567030701258212
Kim, J.-H., Koh, J.-S., Choi, K.-C., Yoon, J.-M., and Kim, S.-Y. (2007). Effects of foaming temperature and carbon black content on the cure characteristics and mechanical properties of natural rubber foams. J. Ind. Eng. Chem. 13, 198–205.
Krupa, I., Mikova, G., and Luyt, A. S. (2007). Polypropylene as a potential matrix for the creation of shape stabilized phase change materials. Eur. Polym. J. 43, 895–907. doi: 10.1016/j.eurpolymj.2006.12.019
Mahmoud, W., El-Eraki, M., El-Lawindy, A., and Hassan, H. (2006). A novel application of ADC/K-foaming agent-loaded NBR rubber composites as pressure sensor. Appl. Phys. 39, 541–546. doi: 10.1088/0022-3727/39/3/018
Meshgin, P., Xi, Y., and Li, Y. (2012). Utilization of phase change materials and rubber particles to improve thermal and mechanical properties of mortar. Construct. Building Mater. 28, 713–721. doi: 10.1016/j.conbuildmat.2011.10.039
Michaeli, W., and Sitz, S. (2010). Analysis of the expansion behaviour of rubber compounds with chemical blowing agents. Cell. Polym. 29, 227–236. doi: 10.1177/026248931002900402
Mofijur, M., Mahlia, T. M. I., Silitonga, A. S., Ong, H. C., Silakhori, M., Hasan, M. H., et al. (2019). Phase change materials (PCM) for solar energy usages and storage: an overview. Energies 12, 1–20. doi: 10.3390/en12163167
Mosanenzadeh, S. G., Naguib, H. E., Park, C. B., and Atalla, N. (2013). Development, characterization, and modeling of environmentally friendly open-cell acoustic foams. Polym. Eng. Sci. 53, 1979–1989. doi: 10.1002/pen.23443
Nah, C., Kim, W. D., and Lee, W. (2001). Effects of carbon black content and vulcanization type on cure characteristics and dynamic mechanical property of styrene-butadiene rubber compound. Korea Polym. J. 9, 157–163. WOS:000169686100004.
Najib, N. N., Ariff, Z. M., Aznizam, A. B., Sipaut, C. S., and Nasri, M. (2011). Correlation between the acoustic and dynamic mechanical properties of natural rubber foam: effect of foaming temperature. Mater. Design 32, 505–511. doi: 10.1016/j.matdes.2010.08.030
Oh, S. H., Kang, S. G., Kim, E. S., Cho, S. H., and Lee, J. H. (2003). Fabrication and characterization of hydrophilic poly(lactic-coglycolic acid)/poly(vinyl alcohol) blend cell scaffolds by melt-molding particulate-leaching method. Biomaterials 24, 4011–4021. doi: 10.1016/S0142-9612(03)00284-9
Peng, S., Fuchs, A., and Wirtz, R. A. (2004). Polymeric phase change composites for thermal energy storage. J. Appl. Polym. Sci. 93, 1240–1251. doi: 10.1002/app.20578
Phadungphatthanakoon, S., Poompradub, S., and Wanichwecharungruang, S. P. (2011). Increasing the thermal storage capacity of a phase change material by encapsulation: preparation and application in natural rubber. Appl. Mater. Interfaces 3, 3691–3969. doi: 10.1021/am200870e
Pielichowska, K., and Pielichowski, K. (2014). Phase change materials for thermal energy storage. Progr. Mater. Sci. 65, 67–123. doi: 10.1016/j.pmatsci.2014.03.005
Rigotti, D., Dorigato, A., and Pegoretti, A. (2018). 3D printable thermoplastic polyurethane blends with thermal energy storage/release capabilities. Mater. Today Commun. 15, 228–235. doi: 10.1016/j.mtcomm.2018.03.009
Rubitherm (2020). Data sheet RT21HC. Available online at: https://www.rubitherm.eu/media/products/datasheets/Techdata_-RT21HC_EN_09102020.PDF (accessed December 23, 2020).
Salaün, F., Devaux, E., Bourbigot, S., and Rumeau, P. (2010). Preparation and characteristics of n-nonadecane/cement composites as thermal energy storage materials in buildings. Thermochim. Acta 506, 82–93. doi: 10.1016/j.tca.2010.04.020
Sari, A., Alkan, C., Karaipekli, A., and Uzun, O. (2009). Poly(ethylene glycol)/poly(methyl methacrylate) blends as novel form stable phase change materials for thermal energy storage. J. Appl. Polym. Sci. 116, 929–933. doi: 10.1002/app.31623
Scaffaro, R., Lopresti, F., Botta, L., and Maio, A. (2016a). Mechanical behavior of polylactic acid/polycaprolactone porous layered functional composites. Compos. B Eng. 98, 70–77. doi: 10.1016/j.compositesb.2016.05.023
Scaffaro, R., Lopresti, F., Botta, L., Rigogliuso, S., and Ghersi, G. (2016b). Integration of PCL and PLA in a monolithic porous scaffold for interface tissue engineering. Author links open overlay panel. J. Mech. Behav. Biomed. Mater. 63, 303–313. doi: 10.1016/j.jmbbm.2016.06.021
Scaffaro, R., Lopresti, F., Botta, L., Rigogliuso, S., and Ghersi, G. (2016c). Melt processed PCL/PEG scaffold with discrete pore size gradient for selective cellular infiltration. Macromol. Mater. Eng. 301, 182–190. doi: 10.1002/mame.201500289
Scaffaro, R., Lopresti, F., Botta, L., Rigogliuso, S., and Ghersi, G. (2016d). Preparation of three-layered porous PLA/PEG scaffold: relationship between morphology, mechanical behavior and cell permeability. J. Mech. Behav. Biomed. Mater. 54, 8–20. doi: 10.1016/j.jmbbm.2015.08.033
Stehr, J. (2015). Chemical blowing agents in the rubber industry. past–present–and future? Gummi Fasern Kunststoffe 68, 819–821. doi: 10.1177/0307174X1604300501
Trakanpruk, W., and Rodthong, Y. (2008). Production of sponge rubber for monolayer rubber stamp using salt leaching method. J. Metals Mater. Minerals 18, 33–40.
Valentini, F., Dorigato, A., and Pegoretti, A. (2021). Novel EPDM/paraffin foams for thermal energy storage applications. Rubber Chem. Technol.
Valentini, F., Morandini, F., Bergamo, M., and Dorigato, A. (2020). Development of eco-sustainable plasters with thermal energy storage capability. J. Appl. Phys. 128:12139. doi: 10.1063/5.0012139
Wang, B. Q., Peng, Z. L., Zhang, Y., and Zhang, Y. X. (2006). Study on foaming kinetics and preparation of EPDM foams. Plast. Rubber Composit. 35, 360–367. doi: 10.1179/174328906X149673
Wimolmala, E., Khongnual, K., and Sombatsompop, N. (2009). Mechanical and morphological properties of cellular NR/SBR vulcanizates under thermal and weathering ageing. J. Appl. Polymer Sci. 114, 2816–2827. doi: 10.1002/app.30763
Yamsaengsung, W., and Sombatsompop, N. (2008). Foam characteristics, peel strength, and thermal conductivity for wood/NR and expanded EPDM laminates for roofing applications. J. Macromol. Sci. B 47, 967–985. doi: 10.1080/00222340802219206
Yamsaengsung, W., and Sombatsompop, N. (2009). Effect of chemical blowing agent on cell structure and mechanical properties of EPDM foam, and peel strength and thermal conductivity of wood/NR composite–EPDM foam laminates. Compos. B Eng. 40, 594–600. doi: 10.1016/j.compositesb.2009.04.003
Zakaria, Z., Ariff, Z. M., Hwa, T. L., and Sipaut, C. S. (2007). Effect of foaming temperature on morphology and compressive properties of ethylene propylene diena monomer rubber (EPDM) foam. Malaysian Polym. J. 2, 22–30.
Zhang, B. S., Lv, X. F., Zhang, Z. X., Liu, Y., Kim, J. K., and Xin, Z. X. (2010). Effect of carbon black content on microcellular structure and physical properties of chlorinated polyethylene rubber foams. Mater. Design 31, 3106–3110. doi: 10.1016/j.matdes.2009.12.041
Keywords: thermal energy storage (TES), phase change materials (PCM), foam, salt leaching, EPDM rubber, thermal insulation
Citation: Valentini F, Fambri L, Dorigato A and Pegoretti A (2021) Production and Characterization of TES-EPDM Foams With Paraffin for Thermal Management Applications. Front. Mater. 8:660656. doi: 10.3389/fmats.2021.660656
Received: 29 January 2021; Accepted: 18 March 2021;
Published: 14 April 2021.
Edited by:
Dingshan Yu, Sun Yat-Sen University, ChinaReviewed by:
Zhonghua Xiang, Beijing University of Chemical Technology, ChinaLi Wei, The University of Sydney, Australia
Copyright © 2021 Valentini, Fambri, Dorigato and Pegoretti. This is an open-access article distributed under the terms of the Creative Commons Attribution License (CC BY). The use, distribution or reproduction in other forums is permitted, provided the original author(s) and the copyright owner(s) are credited and that the original publication in this journal is cited, in accordance with accepted academic practice. No use, distribution or reproduction is permitted which does not comply with these terms.
*Correspondence: Francesco Valentini, ZnJhbmNlc2NvLnZhbGVudGluaUB1bml0bi5pdA==; Luca Fambri, bHVjYS5mYW1icmlAdW5pdG4uaXQ=