 Anus Manzoor
 Gaurav Arora
 Nathan Linton
 Dilpuneet S. Aidhy
- Department of Mechanical Engineering, University of Wyoming, Laramie, WY, United States
Multi-principal element alloys (MPEAs) are a new class of alloys that consist of many principal elements randomly distributed on a crystal lattice. The random presence of many elements lends large variations in the point defect formation and migration energies even within a given alloy composition. Compounded by the fact that there could be exponentially large number of MPEA compositions, there is a major computational challenge to capture complete point-defect energy phase-space in MPEAs. In this work, we present a machine learning based framework in which the point defect energies in MPEAs are predicted from a database of their constituent binary alloys. We demonstrate predictions of vacancy migration and formation energies in face centered cubic ternary, quaternary and quinary alloys in Ni-Fe-Cr-Co-Cu system. A key benefit of building this framework based on the database of binary alloys is that it enables defect-energy predictions in alloy compositions that may be unearthed in future. Furthermore, the methodology enables identifying the impact of a given alloying element on the defect energies thereby enabling design of alloys with tailored defect properties.
Introduction
Multi-principal element alloys (MPEAs) are a new class of alloys that consist of many principal elements randomly distributed on a crystal lattice. These alloys have unique properties such as high fracture toughness, high strength, and high resistance against corrosion and irradiation (Yeh et al., 2004; Bernd et al., 2014; Tsai and Yeh, 2014; Youssef et al., 2014; Ding et al., 2018; Fu et al., 2018; El-Atwani et al., 2019; Zhang et al., 2019). In addition, MPEAs are one of the few alloys that have shown to overcome the strength-ductility trade-off, i.e., simultaneous increase in both strength and ductility (Li et al., 2016). Due to the random distribution of various elements, a complexity arises where each lattice site has unique nearest-neighbor chemical environment and bond lengths that lead to distinctly different point defect energies. As a result, there are large variations in defect energies even within a given alloy composition (Del Rio et al., 2011; Piochaud et al., 2014; Zhang et al., 2015, 2017; Zhao et al., 2016, 2018; Li et al., 2019; Guan et al., 2020; Arora et al., 2021). This is in contrast to essentially a single defect energy value in conventional and/or dilute alloys. For example, using density functional theory (DFT) calculations, Guan et al. (Guan et al., 2020) showed that the vacancy formation energy ranges between 1.62 eV and 2.03 eV in NiCrCo, 1.62 eV–2.04 eV in NiFeCrCo, and 1.51 eV–2.72 eV in NiFeCrCoMn, respectively. Similarly, Zhao et al. (2018) and Li et al. (2019) showed that there is large variation in the vacancy migration energies, i.e., 0.35 eV–1.24 eV in NiCrCo, 0.36 eV–1.34 eV in NiFeCrCo, and 0.55 eV–1.68 eV in NiFeCrMn, respectively.
Apart from the defect-energy variations, large variations among different studies have also been observed in MPEAs. This variation is due to the different number of calculations that have been performed by various authors. For example, in Fe70Ni10Cr20, Manzoor et al. (under review) performed 650 vs 60 calculations compared to Piochaud et al. (2014) as shown in Table 1. The ten times higher number of calculations lead to a larger variation in vacancy formation energy, i.e., 0.65 eV compared to 0.43 eV, as shown in Table 1. Similarly, in NiCrCo and NiFeCrCo, Zhao et al. (2018) performed twice the number of calculations compared to Guan et al. (2020) and observed almost twice the variation, i.e., 0.7 eV vs 0.4 eV. This implies that large number of calculations may be needed to fully capture the point defect energies in MPEAs.
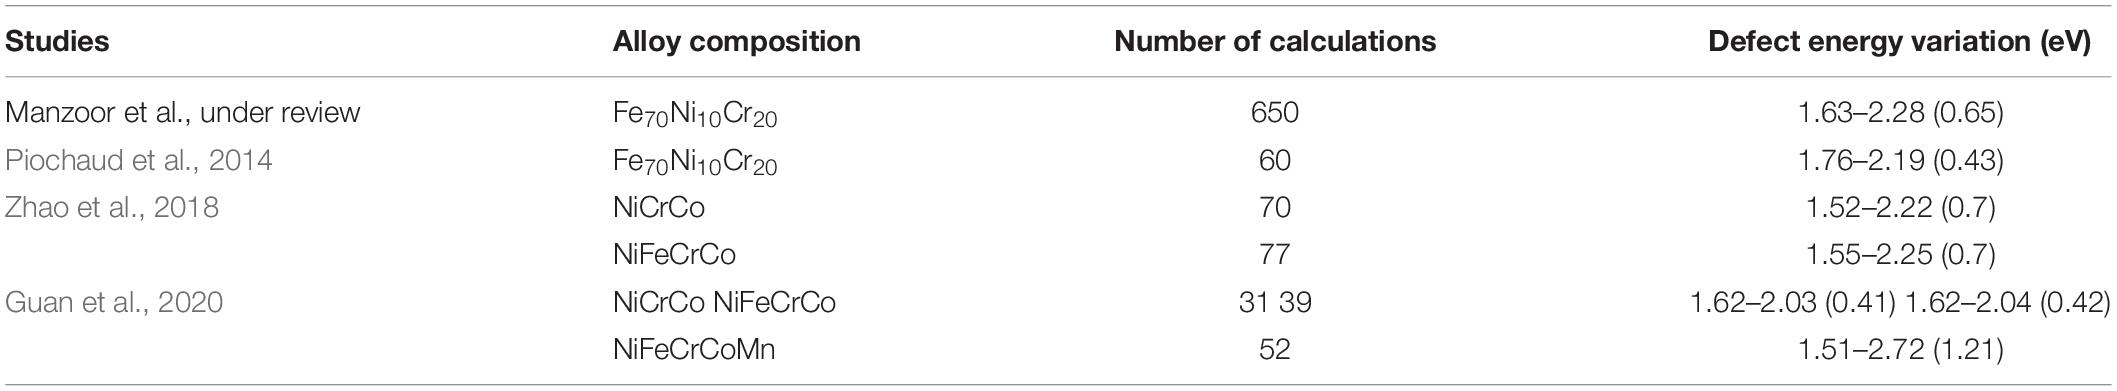
Table 1. Comparison of vacancy formation energies from different studies in terms of alloy composition, number of calculations, and defect-energy variation.
Atomistic calculations have been widely used to calculate point defect energies in various alloys (Neugebauer and Hickel, 2013; Zhao et al., 2016; Bonny et al., 2018; Choudhary et al., 2018; Nayak et al., 2018; Setyawan et al., 2018; Arora et al., 2021). Given that the defect energies can vary significantly by minor changes in the elemental concentration in a specific MPEA, or by changing the type of element(s) in a given MPEA system, there lies a major computational challenge to trace the whole point-defect energy phase-space. The challenge is further intensified by the exponentially large number of MPEA compositions that are yet to be unearthed. What is therefore needed is a new strategy that can bypass the computational expense to support the atomistic calculations in the growing field of MPEAs.
Machine learning (ML) has now been applied to various materials science problems (Osetsky et al., 2016; Liu et al., 2017; Schmidt et al., 2019; Shenoy et al., 2020; Wang et al., 2020). With regards to point defects, Medasani et al. (2016) predicted the point defect properties in binary intermetallic compounds using ML and high throughput DFT calculations. Similarly, Sharma et al. (2020) used ML based framework to predict substitutional defect formation energies in ABO3 perovskites. Other materials properties such as vibrational entropy (Manzoor and Aidhy, 2020) and stacking fault energies (Arora and Aidhy, 2020) have also been recently predicted using a combination of ML and atomistic calculations. Thus, application of ML models in materials science is rapidly becoming mainstream that is being used not only to bypass the computational expense but also to predict new properties.
In this work, we present a ML framework that is able to predict the vacancy migration and formation energies in ternary, quaternary and quinary MPEAs from the defect-energy database of constituent binary alloys. The database of migration and formation energies in binary compositions is built using atomistic calculations, which is then used to train ML model in a five-element face centered cubic (fcc) Ni-Fe-Cr-Co-Cu system. The model is based on various descriptors including type of elements in the 1st nearest neighbors, their directional orientation with respect to the vacancy/migrating atom, and the bond lengths (both between the vacancy/migrating atom and nearest neighbors, and among the nearest neighbors). The accuracy of the model is evaluated using standard ML tools. The role of each alloying element in affecting the defect energies is presented.
Methodology
Vacancy migration and formation energies are calculated using Large-scale Atomic/Molecular Massively Parallel Simulator (LAMMPS) code (Plimpton, 1995). As shown later, a large number of calculations were needed to develop the model and to demonstrate its practical functionality. The use of interatomic potential allowed this flexibility. A recently-developed Farkas-Caro embedded atom method (EAM) interatomic potential for Fe-Ni-Cr-Co-Cu is used to model the FCC binary, ternary, quaternary and quinary alloys (Farkas and Caro, 2018). All simulations are performed on the 6 × 6 × 6 supercell containing 864 atoms. We have observed that the supercell size containing 864 atoms is large enough to capture the distribution of point defect energies. A comparison of defect energies calculated in larger supercell is given in Supplementary Figure 1.
The migration energies are calculated using nudged elastic band (NEB) method (Henkelman et al., 2000) implementing “quick min” damped minimization algorithm in the LAMMPS code. The calculation is said to be converged when the energy and force on each atom are less than 1 × 10⁻⁸ eV and 1 × 10⁻⁴ eV Å−1, respectively. For calculating vacancy formation energy, system is relaxed using steepest-descent method. The energy and force convergence for the formation energy calculation is set to 1 × 10–20 eV and 1 × 10–20 eV Å–1, respectively. Due to the random distribution of atoms, instead of a single value, a distribution of energies is expected which is achieved by performing a large number of simulations. Approximately 2050 and 864 calculations are performed for vacancy migration and formation energies, respectively, in a given composition.
A vacancy is created in a supercell by removing an atom from its lattice site. Equation 1 is used to calculate the vacancy formation energy ().
where Eo is the energy of a supercell containing 864 atoms with no vacancy, ED is the energy of the supercell with one vacancy of element type X, and μX is the chemical potential of the atom type X.
It is to be noted that the approaches used to calculate the chemical potential of an element in MPEAs carry a level of uncertainty. A recent paper by Zhang et al. (2021) highlights some deficiencies in these approaches. In order to overcome them and to make the calculations more transparent, Zhang et al. (2021) provided a simpler approach that calculates the mean vacancy formation energy based on the total energies of the perfect and defected supercells. The chemical potentials of each component are back-derived in a self-consistent manner to give the distribution of vacancy formation energy. This is opposed to the other approaches in which the individual chemical potentials are calculated separately prior to calculating the vacancy formation energies. Equations (2) and (3) are used to calculate the chemical potential of type X.
where is the average vacancy formation energy in a given alloy composition, Eo is the energy of the perfect supercell, is the energy of defected supercell in which element X is removed from atomic sites with index j. NX is the total number of X elements present in the alloy. The average vacancy formation energy is calculated using Equation (3) in which is the energy of the defected supercell irrespective of the element type removed from atomic site with index k and N is the number of atoms present in the alloy. As shown by Zhang et al. (2021), this approach removes any uncertainty in calculating the chemical potential and its accuracy is of the level of previous approaches. In addition, since the chemical potential is calculated in a self-consistent manner where the energy of the reference system is not needed, this approach enables the chemical-potential calculation in interatomic potential as well.
Machine Learning Model for Predicting Vacancy Migration Energies
In the development of ML model, descriptors are identified based on the local chemical environment around a migrating atom and the vacancy, as shown in Figure 1. The first nearest neighbor (1NN) atoms around migrating atom and vacancy are classified into four different categories, i.e., (i) common nearest neighbor (CNN), (ii) middle nearest neighbor (MNN), (iii) common back nearest neighbor (CBNN), and (iv) back nearest neighbor (BNN) based on their orientation with respect to migrating atom and vacancy. There are four CNNs that are common 1NN atoms to both vacancy and migrating atom. There are two MNN, four CBNN and one BNN for both migrating atom and vacancy, as shown in Figure 1.
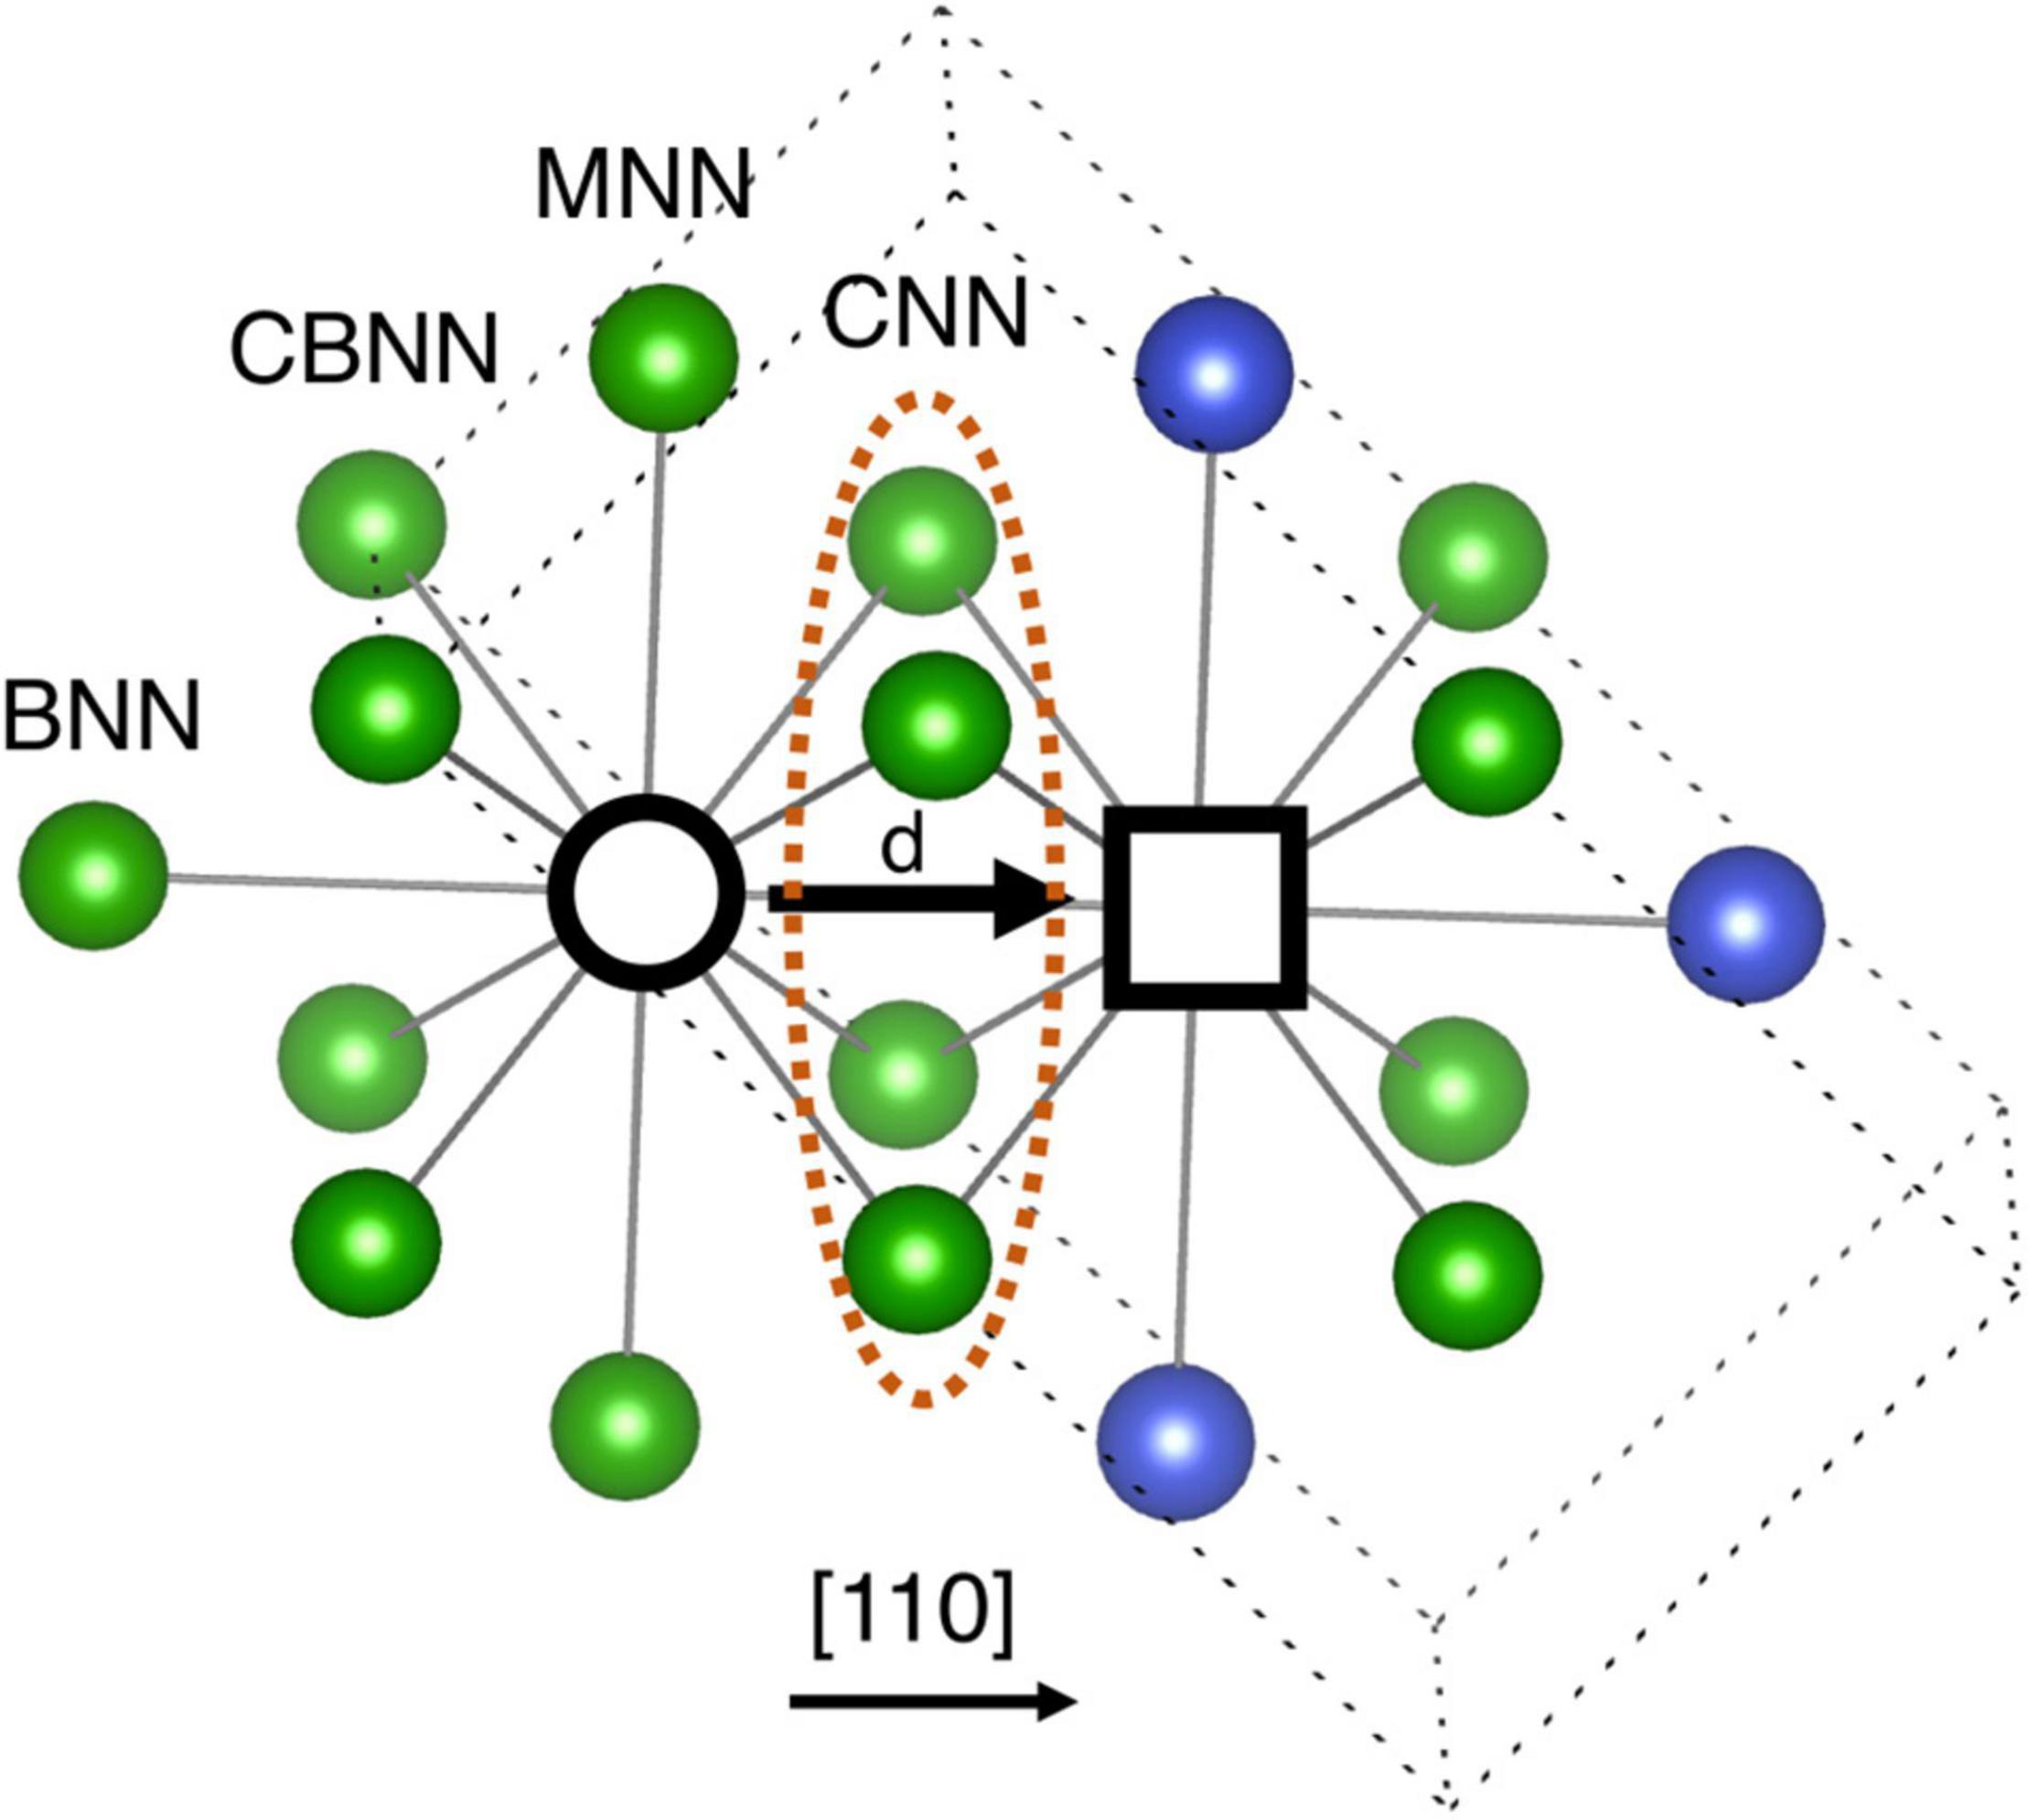
Figure 1. Schematic representation of local chemical environment around a migrating atom and vacancy. Black empty circle and square represent migrating atom and vacancy, respectively. Four CNN atoms are the common first nearest neighbors to both vacancy and migrating atom. There are two MNN, four CBNN and one BNN (1NN) atoms for migrating atom and vacancy separately. See text for details.
There are four types of descriptors used to build the ML model for migration energies. They are, (1) element type of migrating atom, i.e., Ni, Fe, Cr, Co, or Cu, (2) the distance (d), traveled by the migrating atom to the vacancy, (3) orientation vector of all NNs, and (4) distance between 1NN atoms and migrating atom/vacancy based on their orientation. The schematic representation of database is provided in Supplementary Figure 2. It is important to note that all descriptors are retrieved from the perfect supercell. This is done so that the migration energies are predicted simply from the relaxed perfect supercell and no extra calculations are needed.
Once the database is finalized, the next step is to train the ML model. The hold-out method is used for testing the ML model. In this model, we have divided data points into 80–20 ratio, i.e., 80% data is used for the training of the model and the rest 20% is used for testing. We have used support vector regression (SVR) algorithm for the training of model. To evaluate the performance of the model, two statistical tools, i.e., Pearson correlation coefficient (R) and root mean square error (RMSE) are used. The optimized hyper parameters of the model based on SVR are kernel = poly, degree = 3, gamma = auto, and epsilon = 0.01.
Machine Learning Model for Predicting Vacancy Formation Energies
The ML descriptors for predicting the vacancy formation energies are based on 1NN and 2NN of the vacancy, as shown in Figure 2. The 1NN and 2NN atoms are categorized into different vectors based on their orientation with respect to vacancy, as shown in Figure 2. There are twelve 1NN and six 2NN atoms and they are divided into 12 (O1–O12) and six (O1–O6) vectors as listed in Figures 2A,B.
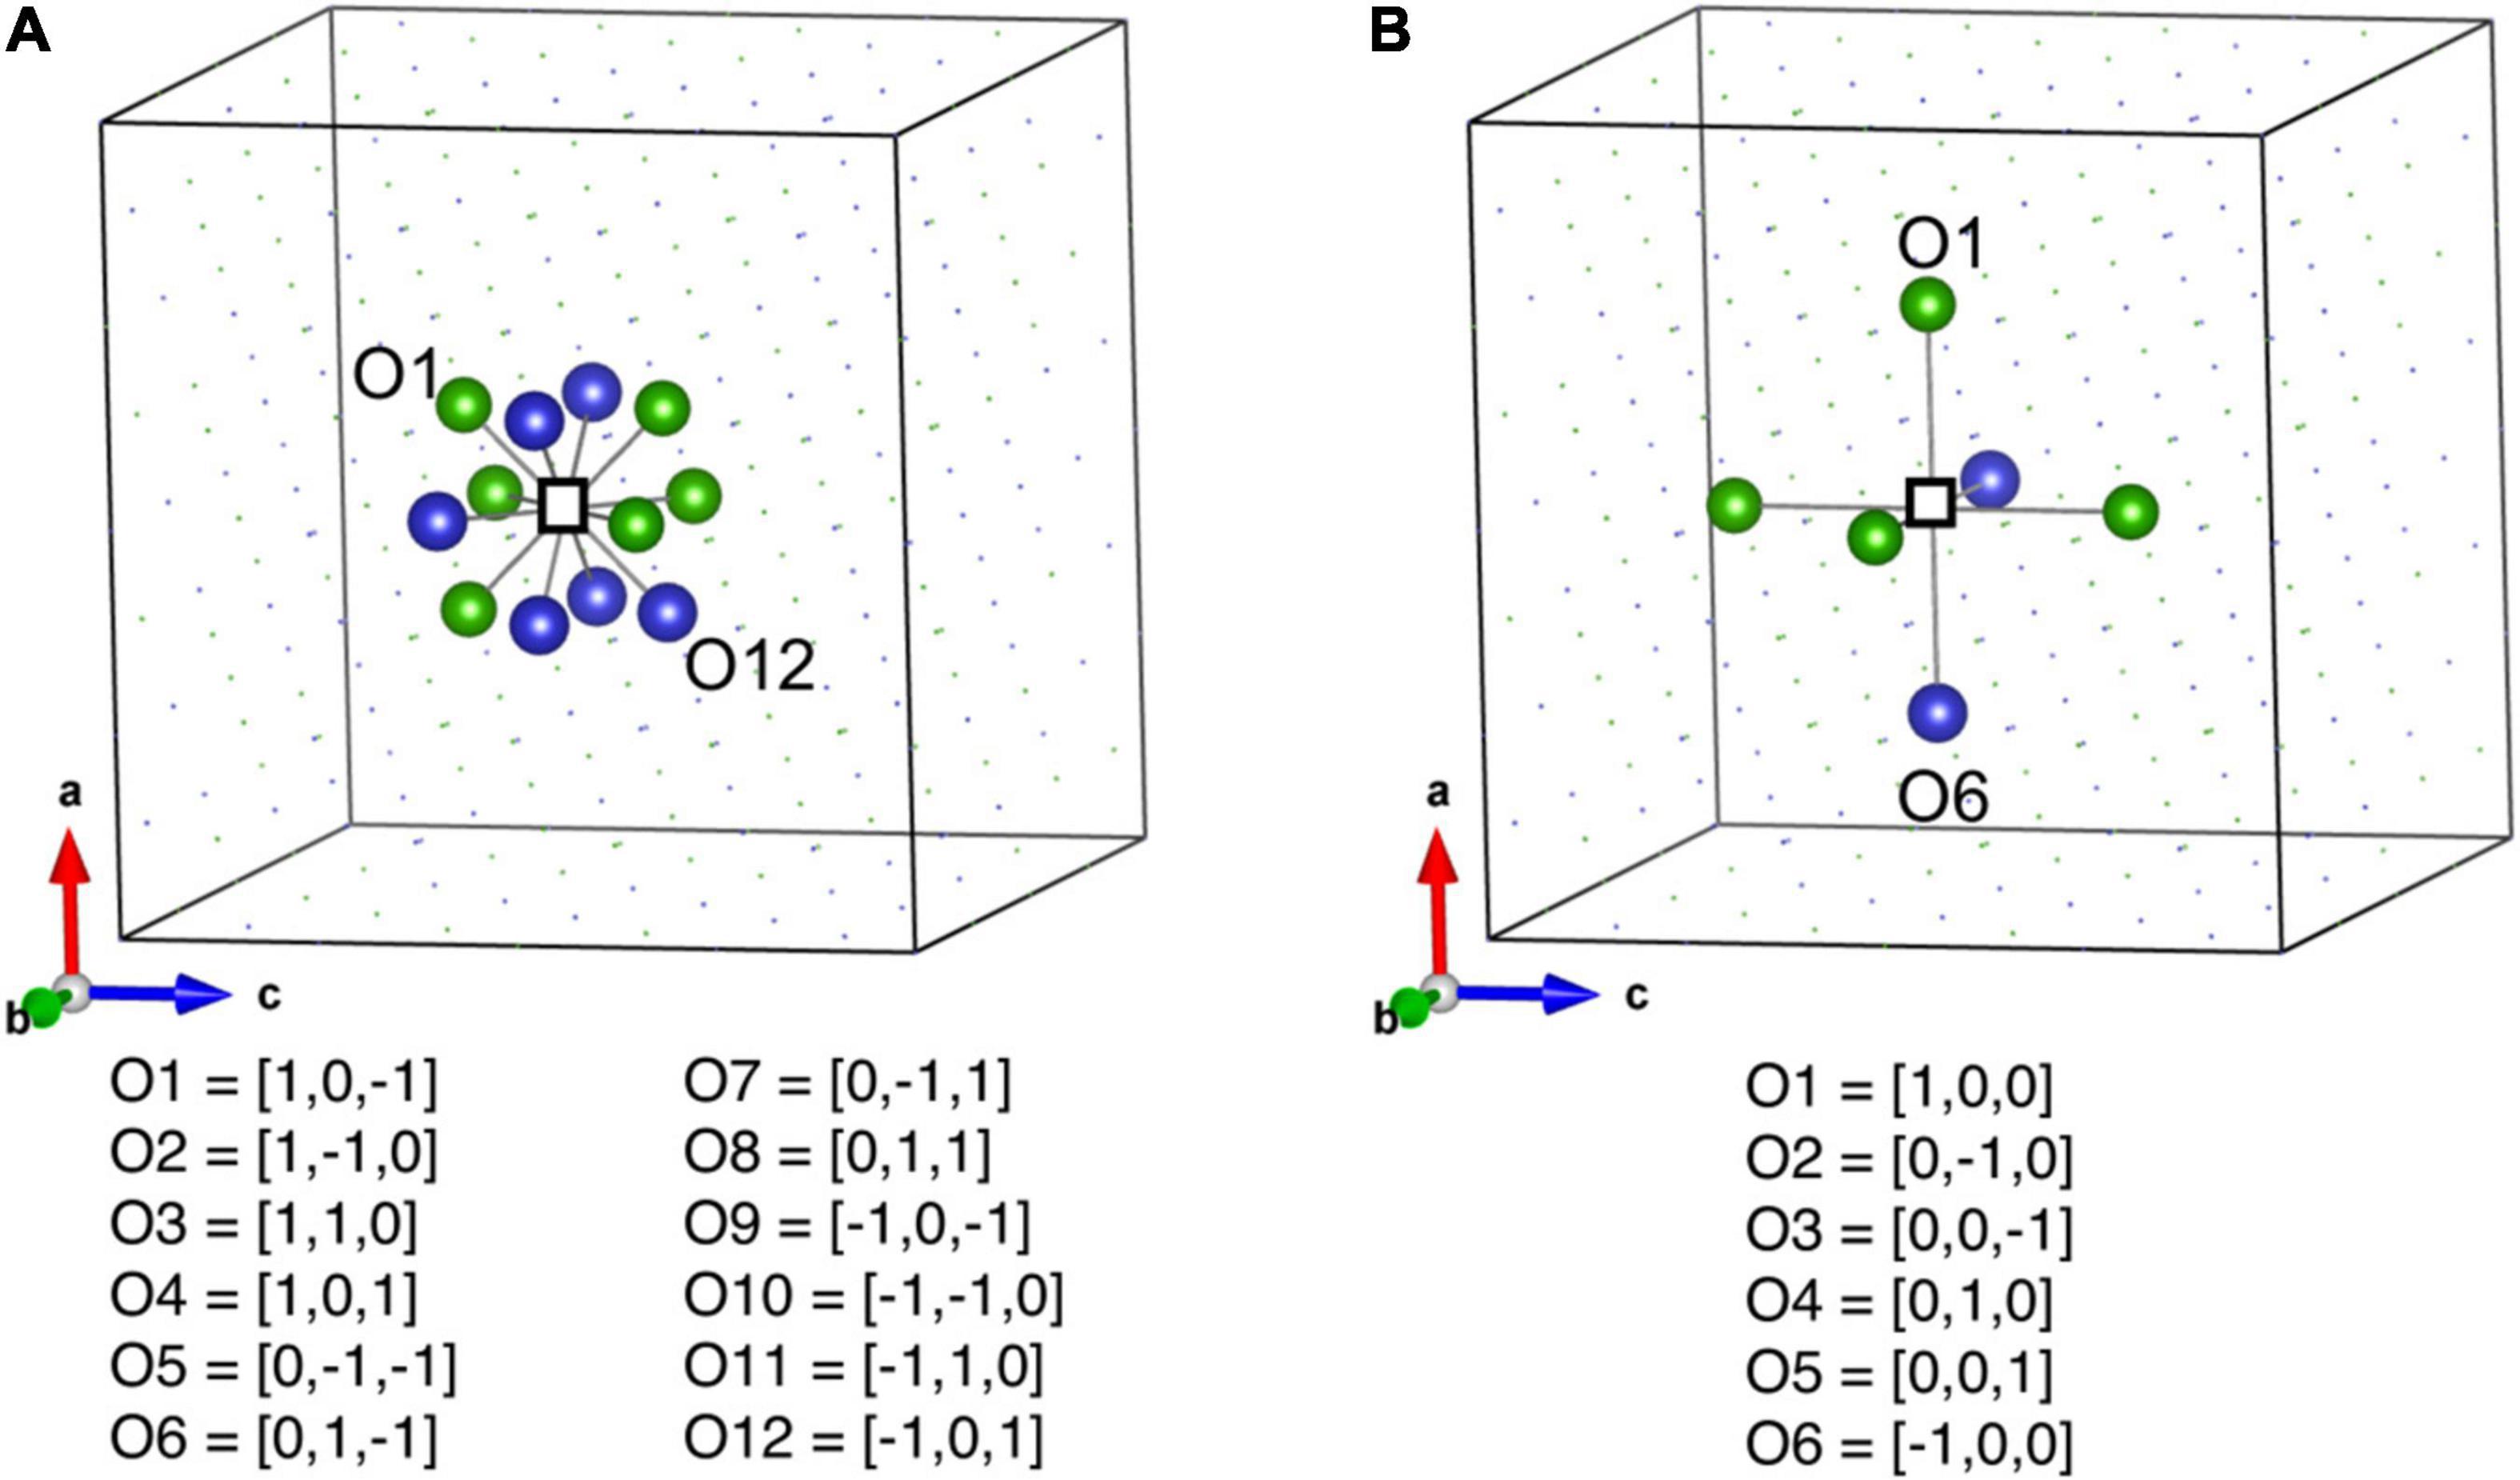
Figure 2. (A) Schematic representation of 1NN and (B) 2NN nearest neighbor atoms of a vacancy. Empty square is the vacancy. The 1NN and 2NN atoms are categorized into different vectors based on their orientation with respect to the vacancy.
There are four types of descriptors used to develop the ML model. They are (1) type of vacancy i.e., the atom which is removed to create a vacancy can be Ni, Fe, Cr, Co, or Cu, (2) the distance between 1NN and vacancy based on their orientation vector (for example, in Figure 2A the distance between atom O1 and vacancy), (3) type of element sitting on specific orientation, and (4) the distance between 2NN and vacancy based on their orientation. The schematic representation of database for formation energy model is provided in Supplementary Figure 3. The descriptors used for formation energy model are slightly different from the migration energy model. As in the migration energy model, the descriptors are based on local chemical environment around migrating atom and a vacancy whereas in the formation energy model, the descriptors are based only on the vacancy. The other main difference is that only 1NN shell around the migrating atom and the vacancy is used in the migration energy model, whereas, for the formation energy model, the descriptors are based on 1NNs as well as 2NNs around a vacancy.
Same strategy is used to train the ML model as described above. The SVR algorithm is used for training the model. The optimized hyper parameters of the model are kernel = poly, degree = 5, gamma = auto and epsilon = 0.01.
Results
The results are divided into two sections. In the first section, the defect energies calculated using LAMMPS code in various alloys are presented and the effects of the alloying elements on the defect energies are discussed. These defect energies in binary alloys serve as the database for the ML models whose results are presented in the second section.
Effect of Alloying Element Concentration on Vacancy Migration Energies
Figure 3 shows the effect of alloying element concentration on the vacancy migration energies in quinary, quaternary, ternary and binary alloys. The migration energies are plotted on the horizontal axis whereas the normalized count of the jumps in the given supercell are plotted on the vertical axis. In Figure 3A, five different compositions are analyzed in NiFeCrCoCu base alloy, where each alloy has one element that has higher concentration; the rest of the four elements are in equal proportions. For example, in Cu60 alloy composition, Cu is 60 at%, whereas Ni, Fe, Cr, and Co are in 10 at% each.
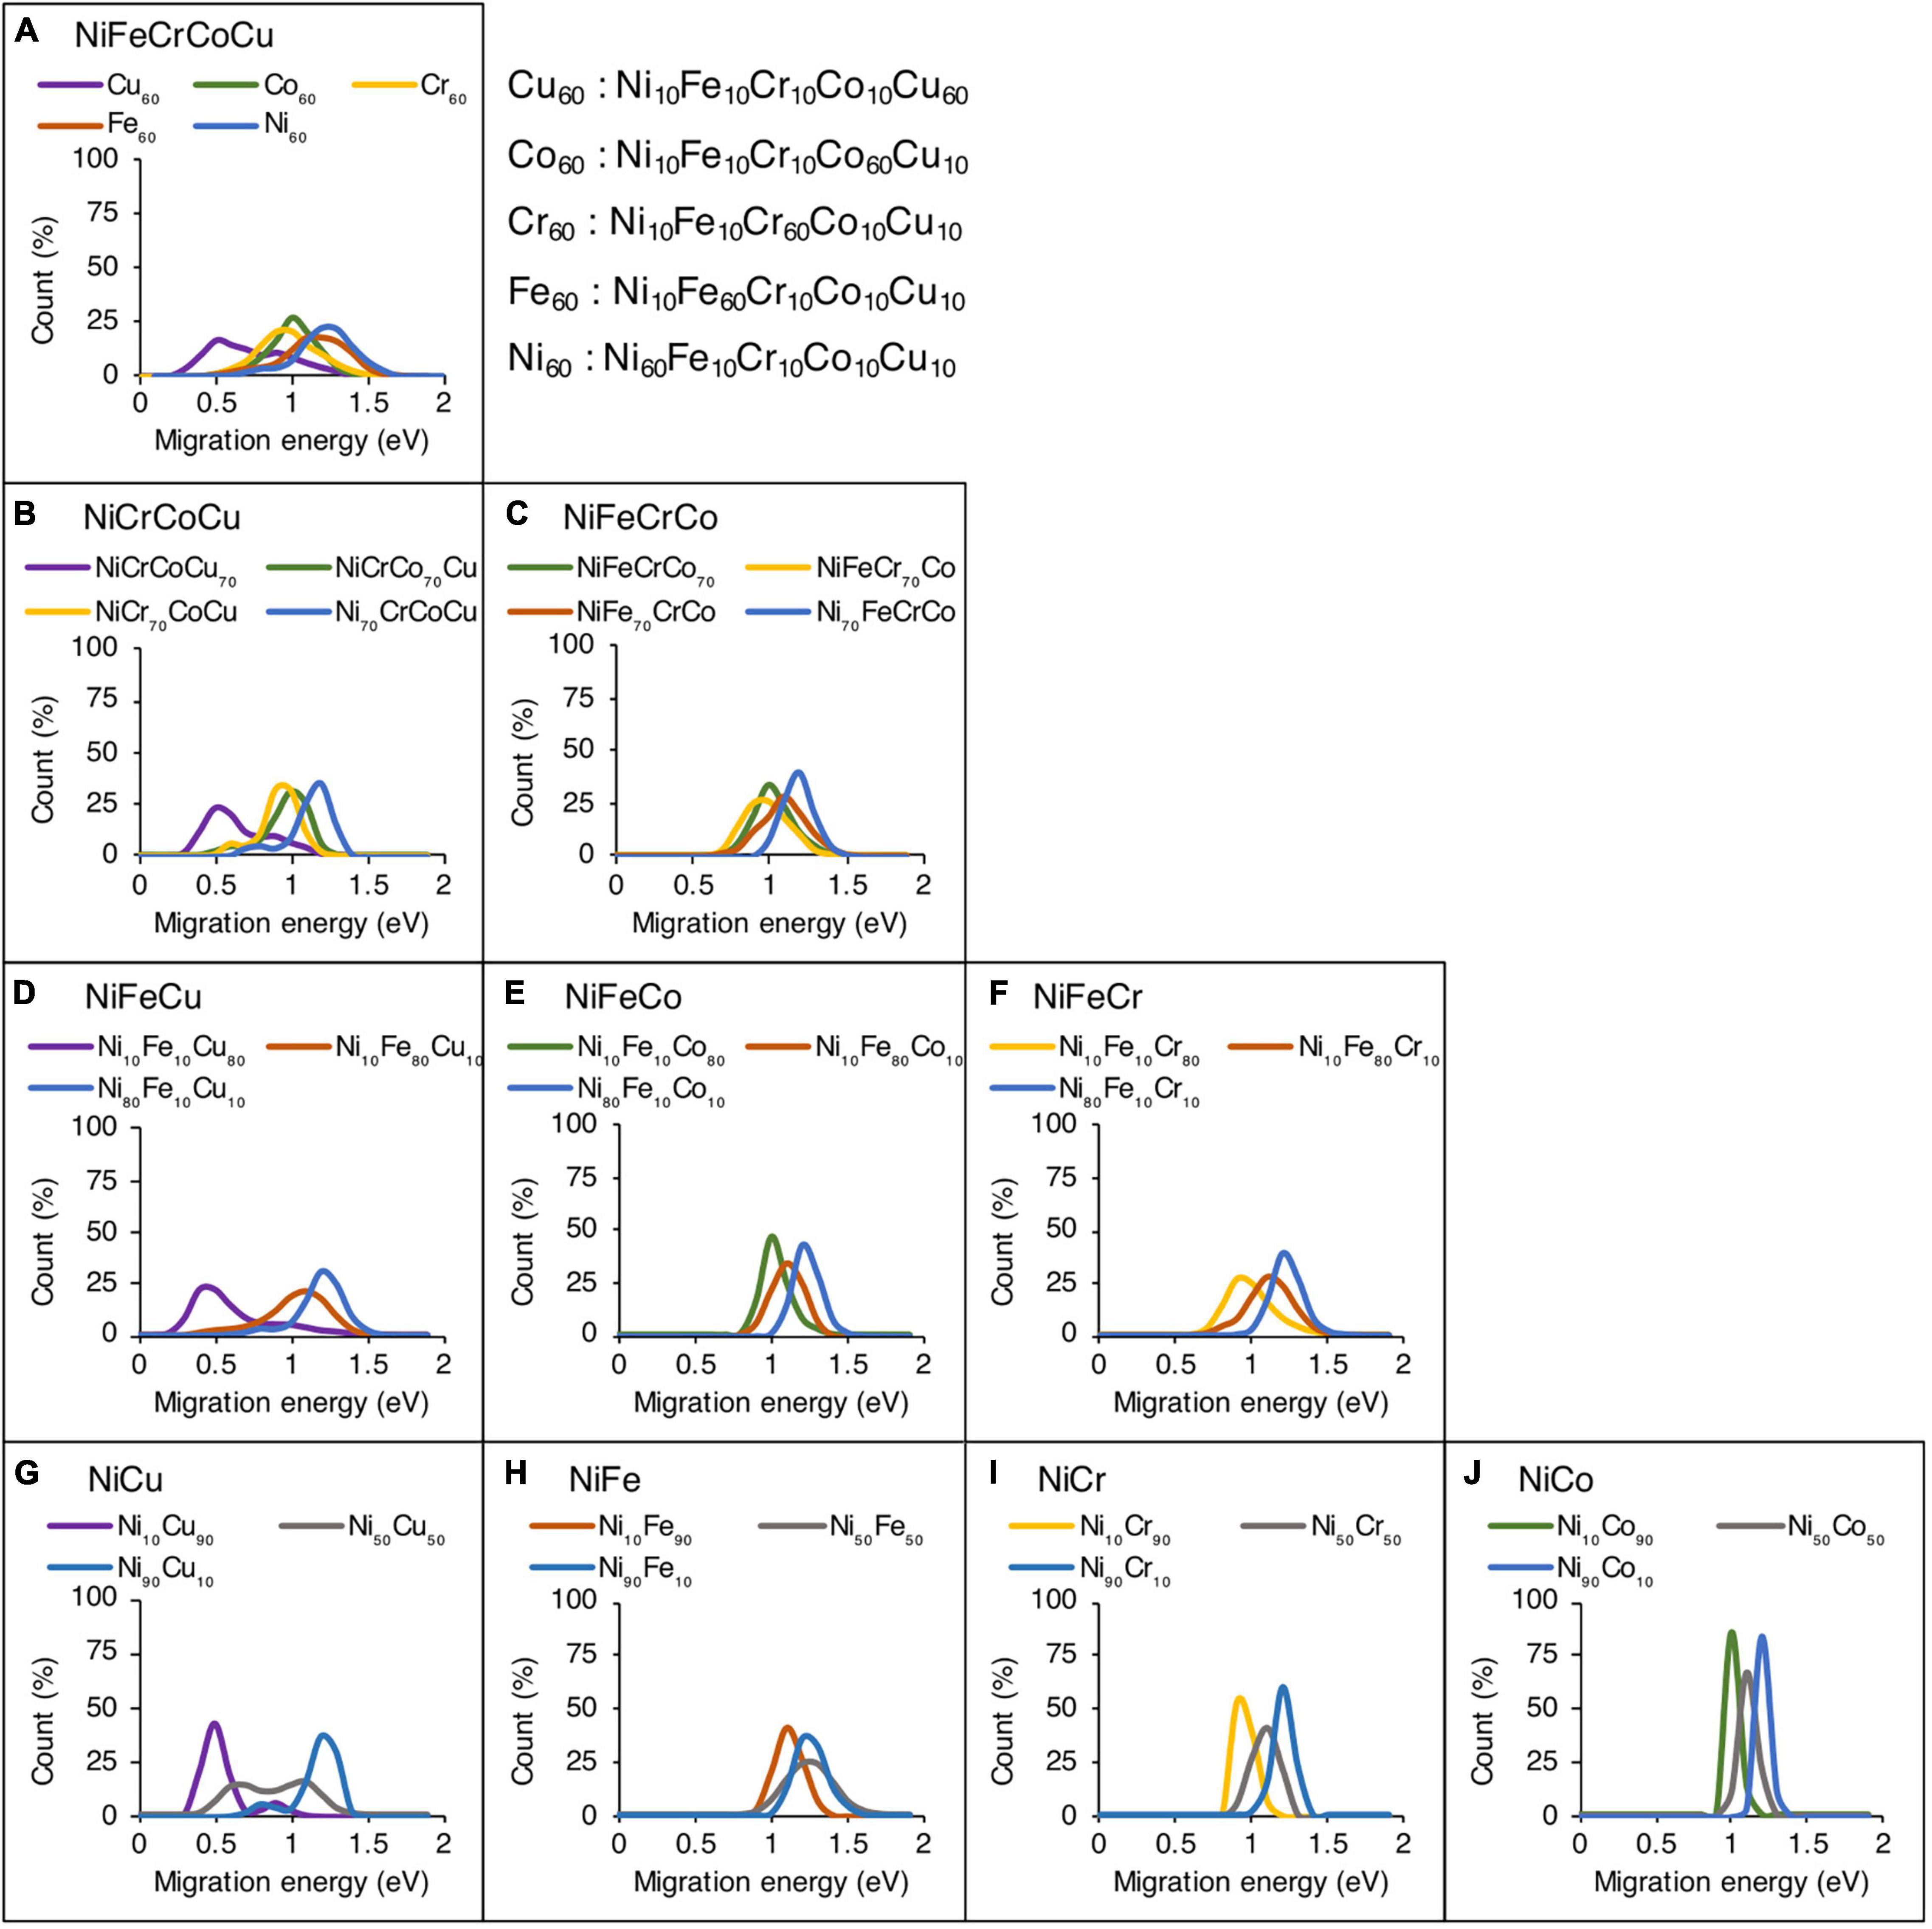
Figure 3. Effect of alloying elemental concentration on vacancy migration energies in (A) quinary, (B,C) quaternary, (D–F) ternary, and (G–J) binary alloys. Only the results of Ni-based alloys are shown.
In the quinary alloys in Figure 3A, it is observed that there are three main regions in which the migration energies can be divided. The data corresponding to Ni60 and Fe60 compositions show highest migration energies, whereas Cu60 composition corresponds to lowest migration energies. The Cr60 and Co60 compositions are sandwiched between the two extremes. This data shows that as the Ni or Fe concentration increases in NiFeCrCoCu base alloy, higher vacancy migration energies and lower diffusivities could be expected. In contrast, addition of Cu is expected to lower the migration energies thereby increasing the vacancy diffusivity. Both Cr and Co have similar impact on the migration energies, and their addition in an alloy could increase or decrease the barriers depending upon whether the base composition is Ni/Fe rich or Cu rich.
The influence of element concentration on migration energies in quaternary concentration alloy is shown in Figures 3B,C. Four different compositions are analyzed each in NiCrCoCu and NiFeCrCo base alloys. In each quaternary composition, one element has higher concentration, i.e., 70 at% and other elements are equi-atomic, i.e., 10 at% each. Similar trends are observed in the quaternary alloys as well, where higher Cu concentration reduces the vacancy migration energies as shown in Figure 3B. In NiFeCrCo alloys, where Cu is absent, a rather narrower migration energy distribution is observed.
Among ternary alloys, NiFe based compositions, i.e., NiFeCu, NiFeCo, and NiFeCr, are shown in Figures 3D–F respectively. Among each ternary composition, a dominant element with 80 at% and equi-atomic 10 at% of the other elements are added. Two distinct peaks and large migration energy distribution is evident in Figure 3D, where Cu is present. In contrast, almost identical data distribution is observed in Figures 3E,F, illustrating the similar effect of Cr and Co on the migration energies.
Finally, the migration energies in binary alloys for Ni-based systems are shown in Figures 3G,H. Three compositions in each alloy system are shown, i.e., Ni10X90, Ni50X50 and Ni10X90. The rest of the binary compositions results are provided in Supplementary Figure 4. Similar migration energy trends are observed in binary alloys as discussed above. It may be pointed out that the presence of two distinct peaks in Cu-based alloys indicates that percolation effect could be expected in these alloys, i.e., certain atomic environment may provide faster channels of diffusion compared to others.
Overall, from quinary to binary alloys, the migration energy increases with the increase in Ni and Fe concentration whereas Cu decreases the energies the most compared to other elements. Cr and Co behave similarly and when their concentration is high, the migration energies lie in between the two extremes, as can be seen particularly in Figures 3A,B.
Effect of Alloying Element Concentration on Vacancy Formation Energies
Figure 4 shows the effect of alloying element concentration on vacancy formation energies in quinary, quaternary, ternary and binary alloys. Same Ni based alloys are considered as analyzed in the case of migration energies. In Figure 4A, five different compositions are considered in NiFeCrCoCu alloy and each composition has one element with higher concentration.
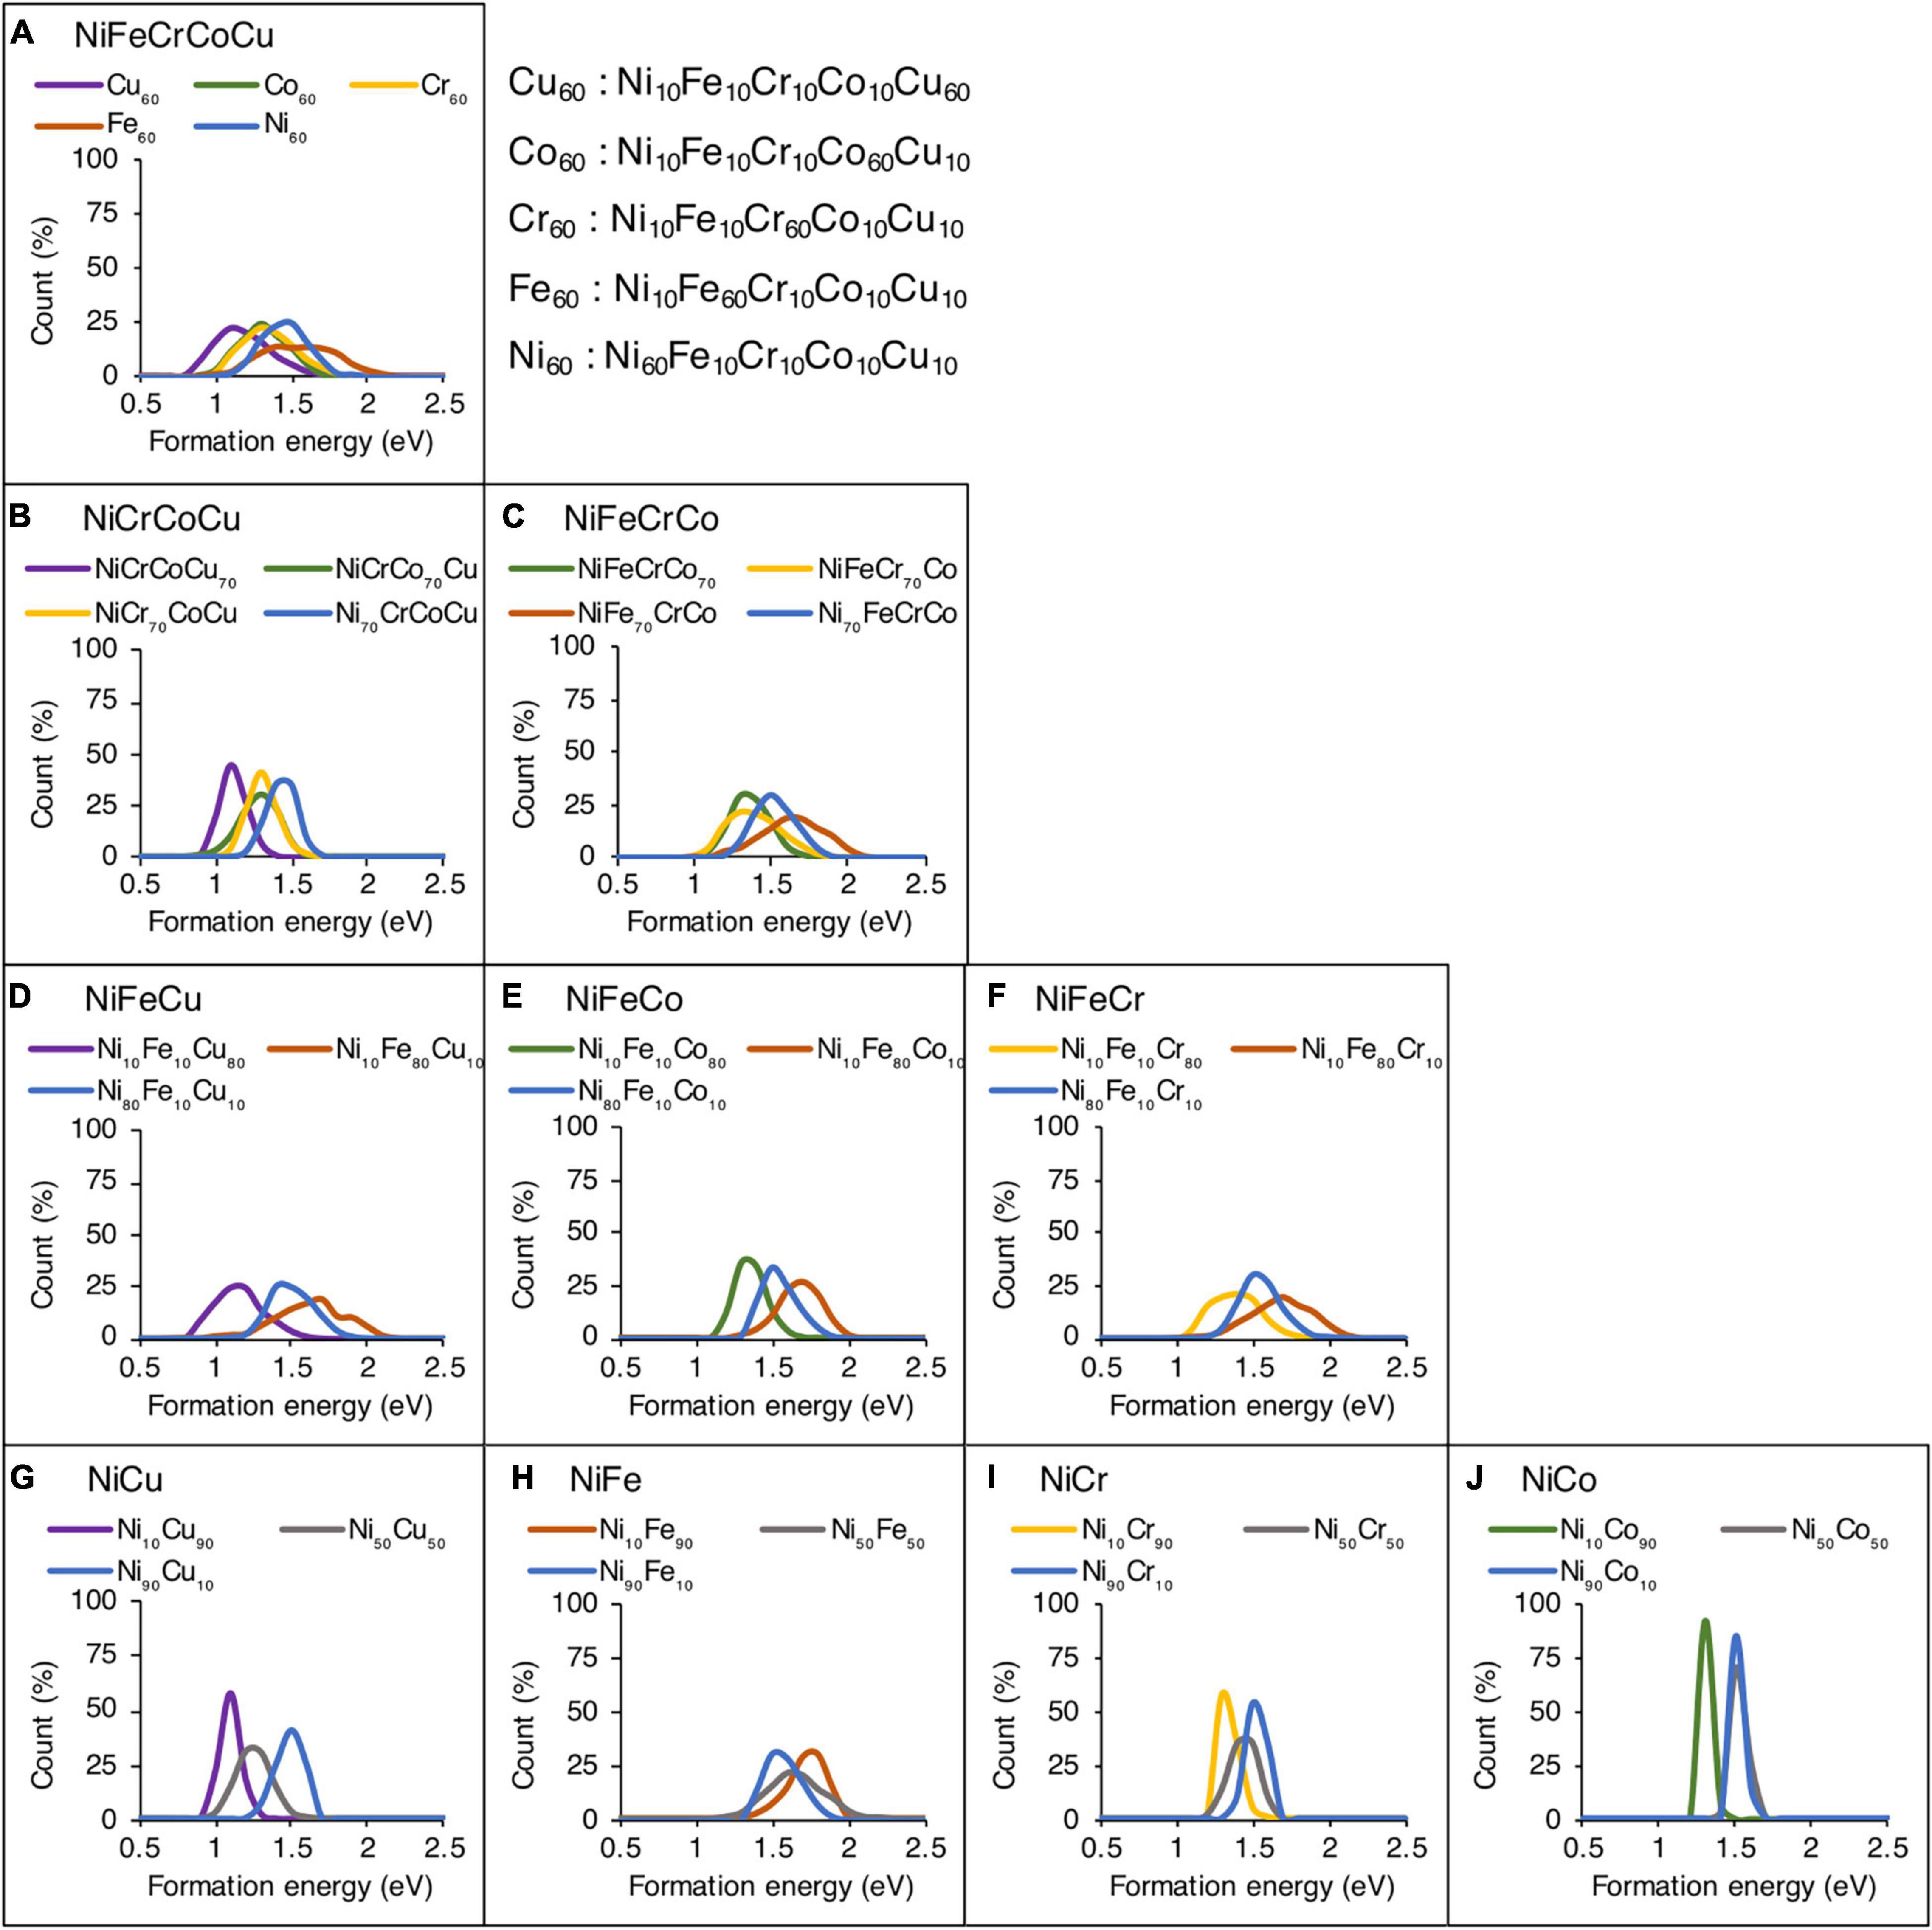
Figure 4. Effect of alloying elemental concentration on vacancy formation energies in (A) quinary, (B,C) quaternary, (D–F) ternary, and (G–J) binary alloys. Only the results of Ni-based alloys are shown.
In the compositions of Ni-Fe-Cr-Co-Cu system in Figure 4A, it is observed that the Fe60 and Ni60 compositions show highest formation energies whereas Cu60 composition corresponds to lowest formation energies. The Cr60 and Co60 compositions are sandwiched between Fe60 and Cu60 curves. This shows that the higher concentration of Fe and Ni would increase the vacancy formation energy, whereas addition of Cu is expected to lower the formation energies. Both Cr and Co have similar influence on the vacancy formation energies and their addition in an alloy could increase or decrease formation energies depending on the concentration of Fe/Ni or Cu.
In Figures 4B,C, influence of element concentration in two quaternary alloys, i.e., NiCrCoCu and NiFeCrCo is analyzed. Four different compositions are analyzed in each base alloy and each composition has one element with higher concentration, i.e., 70 at% and other elements have same concentration, i.e., 10 at%. Similar trends are observed in quaternary alloys where higher concentration of Fe and Ni increase whereas Cu decreases the formation energies. In the presence of Cu, narrower distribution is observed in NiCrCoCu base alloy (see Figure 4B), whereas in the absence of Cu, the distribution is wider as seen in Figure 4C.
In Figures 4D–F, the influence of element concentration in NiFe based ternary alloys is analyzed. Among each ternary composition, a dominant element with 80 at% and equi-atomic 10 at% of the other elements are added. The presence of higher concentration of Fe leading to higher formation energies compared to Ni is noticeable in these ternary alloys as shown in Figures 4D–F. Higher concentration of Ni leads to formation energies in the middle of Fe and third element curve, i.e., Cu, Co, or Cr curve. The higher concentration of third element in these NiFe based ternary alloys always decreases the energies compared to Fe and Ni. However, among Cr, Co, and Cu, Cu decreases the energies the most.
Finally, in binary alloys, we observe that higher concentration of Ni increases the formation energies except NiFe binary alloy as shown in Figures 4G–J. The element concentration influence on formation energies in all 10 binary alloys across the composition is provided in Supplementary Figure 5.
In general, we find similar trends of the effect of alloying element on vacancy formation energies, as we have observed for migration energies. Higher concentration of Fe and Ni corresponds to higher whereas Cu to lower formation energies. Both Cr and Co show similar influence and the distribution of energies is sandwiched between the two extremes. The main difference between migration and formation energy results is the dominance of Ni and Fe, respectively. Ni leads to highest migration energies whereas Fe leads to highest formation energies.
Predictions Based on Machine Learning Model
In this section, we discuss the ML model and predict defect energies in various alloys. Note that we only use the data of the binary alloys for ML model development. There are ten possible binary alloys among five elements, as shown in Figure 5. In what follows, the migration and formation energies of eight ternary, five quaternary and one quinary alloy systems of varying elemental compositions are predicted from ML framework, as shown in Figure 5.
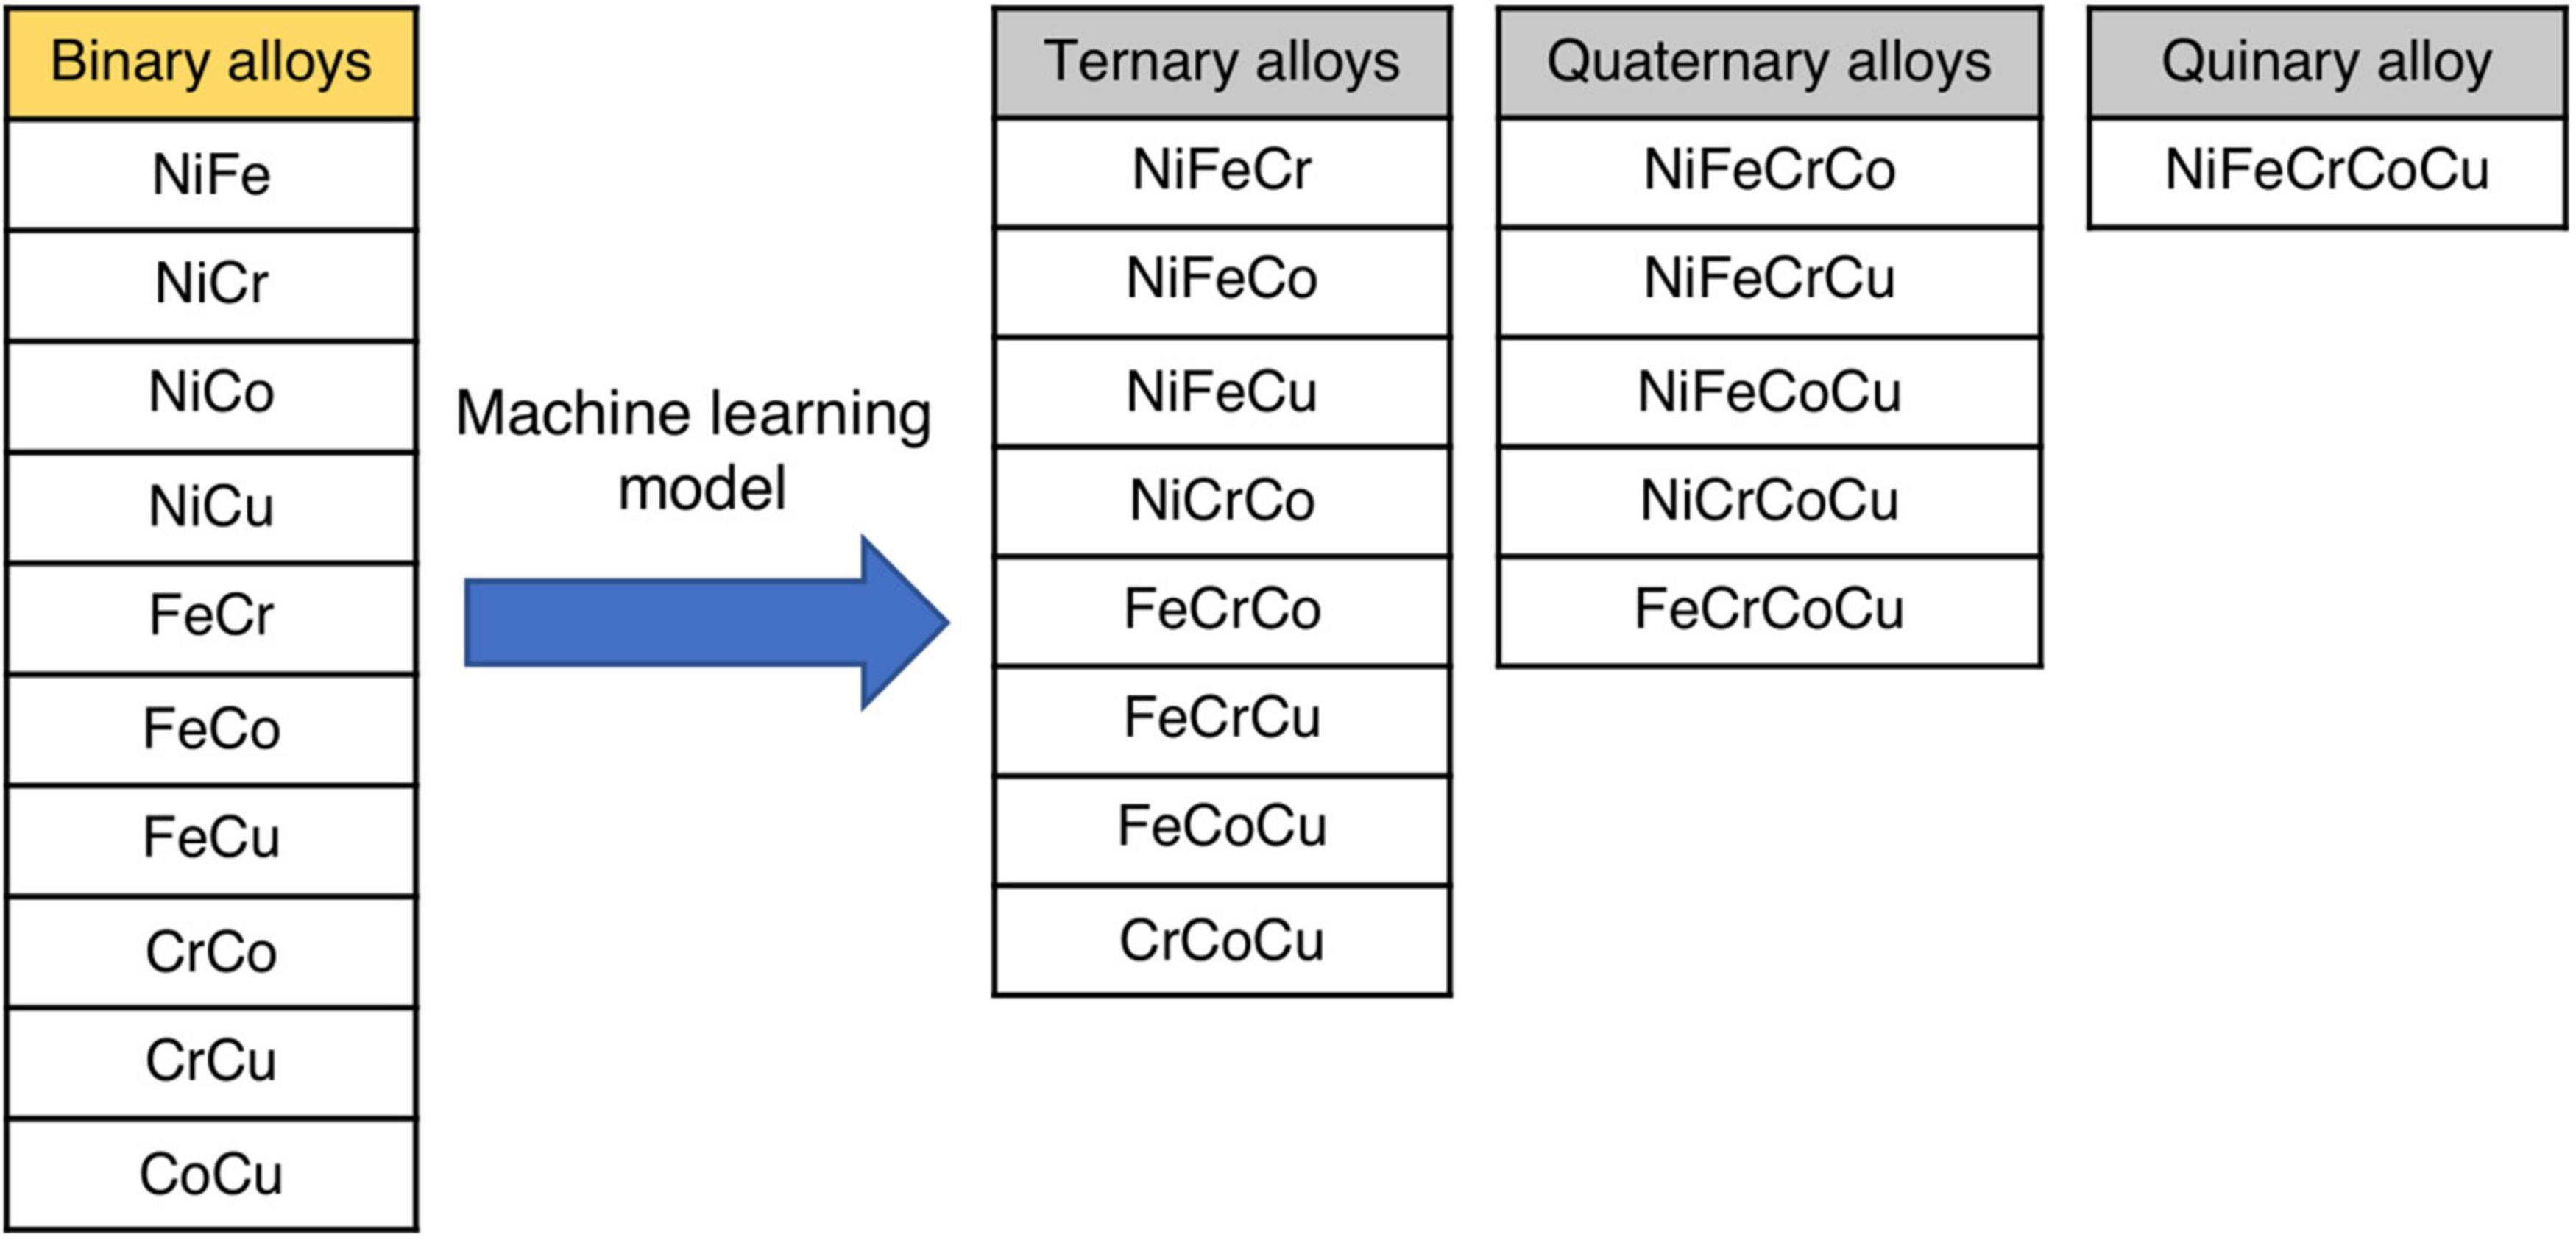
Figure 5. Schematic representation of ten binary alloys used to predict the vacancy migration and formation energies of eight ternary, five quaternary and one quinary alloy systems using ML framework.
Prediction of Vacancy Migration Energies
Using the binary database, we first test the ML model on binary alloys. In Figure 6, the true vs predicted migration energies in four binary compositions, i.e., Ni50Fe50, Ni50Cr50, Fe50Co50, and Fe50Cu50 are shown. The model is able to predict the migration energies for both training and testing data points with high R, i.e., > 0.9 and small RMSE < 0.1 eV, for all considered binary compositions. This level of high accuracy partly indicates that relevant descriptors are included in the ML model. It is reassuring to note that although the migration energies in Fe50Cu50 have extremely wide distribution yet the model is able to capture this distribution and predict the energies with good accuracy, as shown in Figure 6D.
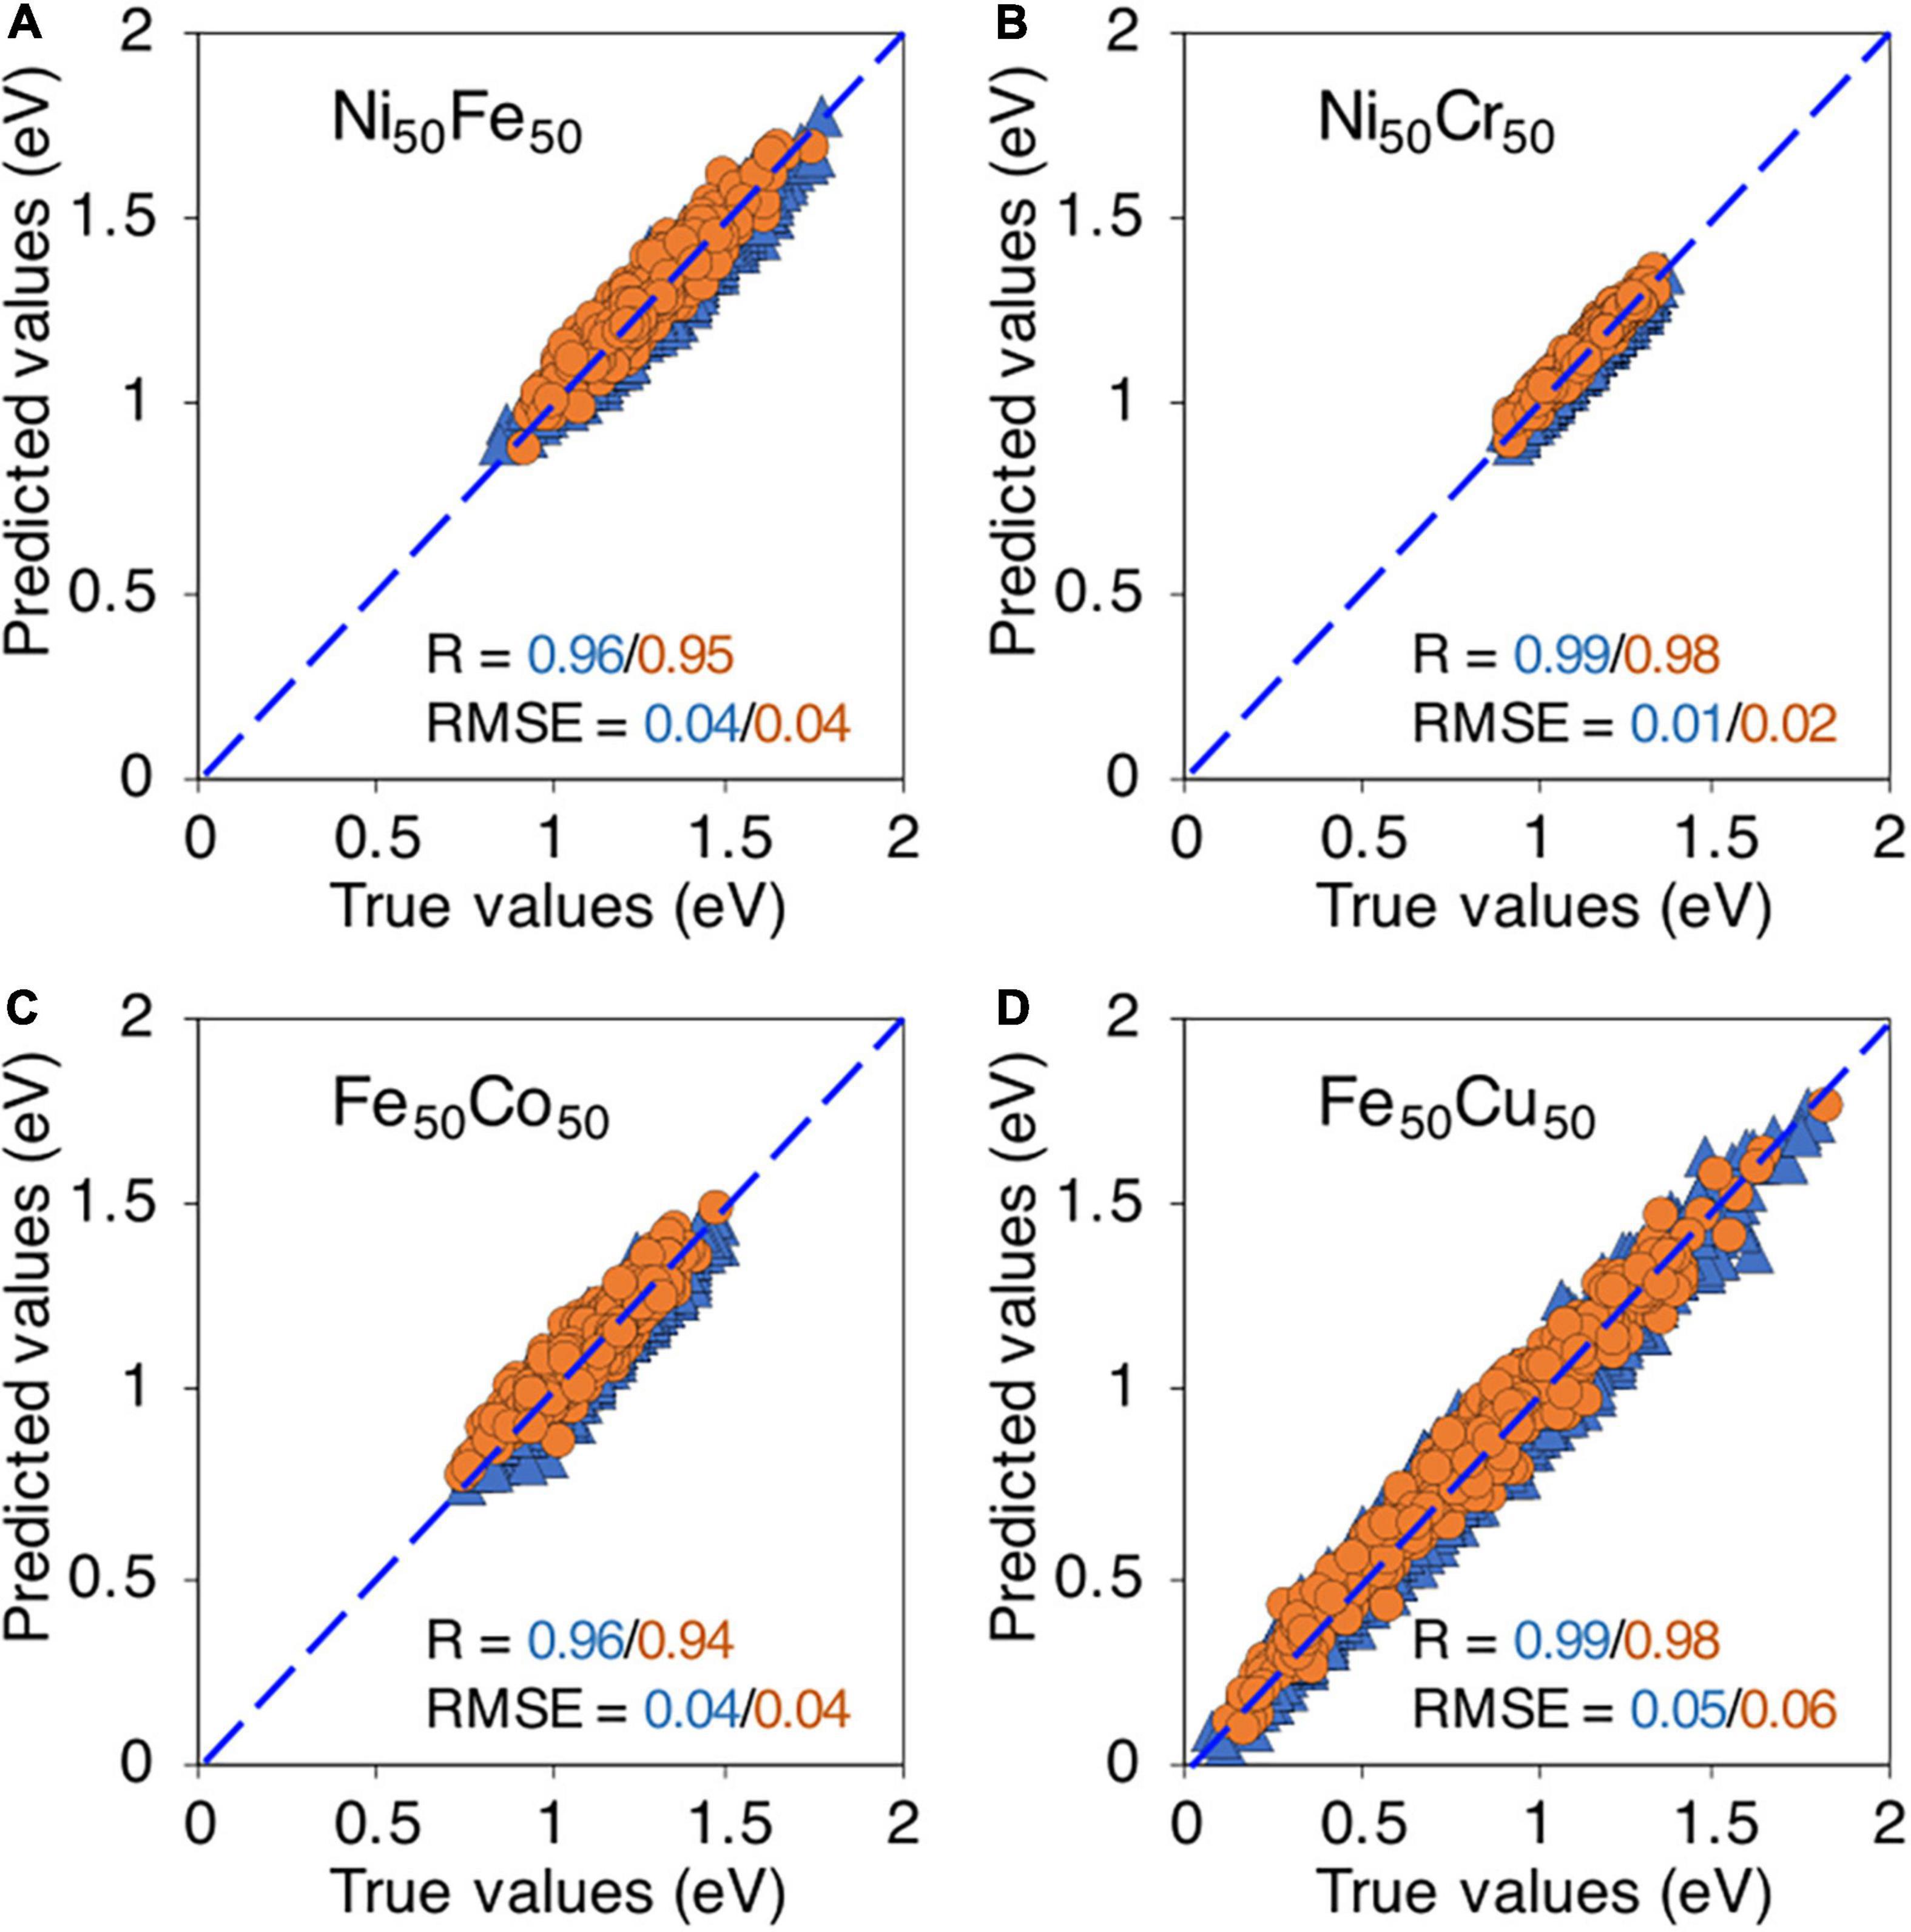
Figure 6. True vs machine learning predicted vacancy migration energies in, (A) Ni50Fe50, (B) Ni50Cr50, (C) Fe50Co50, and (D) Fe50Cu50. The blue triangles and orange circles are training and testing data points respectively.
However, since the training and testing data points are both based on binary alloys, this accuracy can be largely expected. The real test of the ML model is in the predictions of ternary, quaternary and quinary alloys. We begin with NiFeCr ternary alloy system. In Figure 7, the R and RMSE values of ML predicted migration energies of NiFeCr alloy system are shown in ternary phase diagram. Fifteen different compositions within NiFeCr are analyzed, as shown in Figure 7. Here, three different sizes of training data points are used. For example, in Figures 7A,D, 11,400 migration energy data points are used. These are obtained by considering binary compositions at 5 at% interval in each of the three binary alloys, i.e., NiFe, FeCr and NiCr. For each interval, 500 migration energies are randomly used in the database. Using this data, the quality of the predictions of the trained ML model are shown in Figures 7A,D. We find that for all fifteen ternary compositions, the R value is greater than 0.95, and RMSE is less than 0.05 eV, indicating very good predictions from the model.
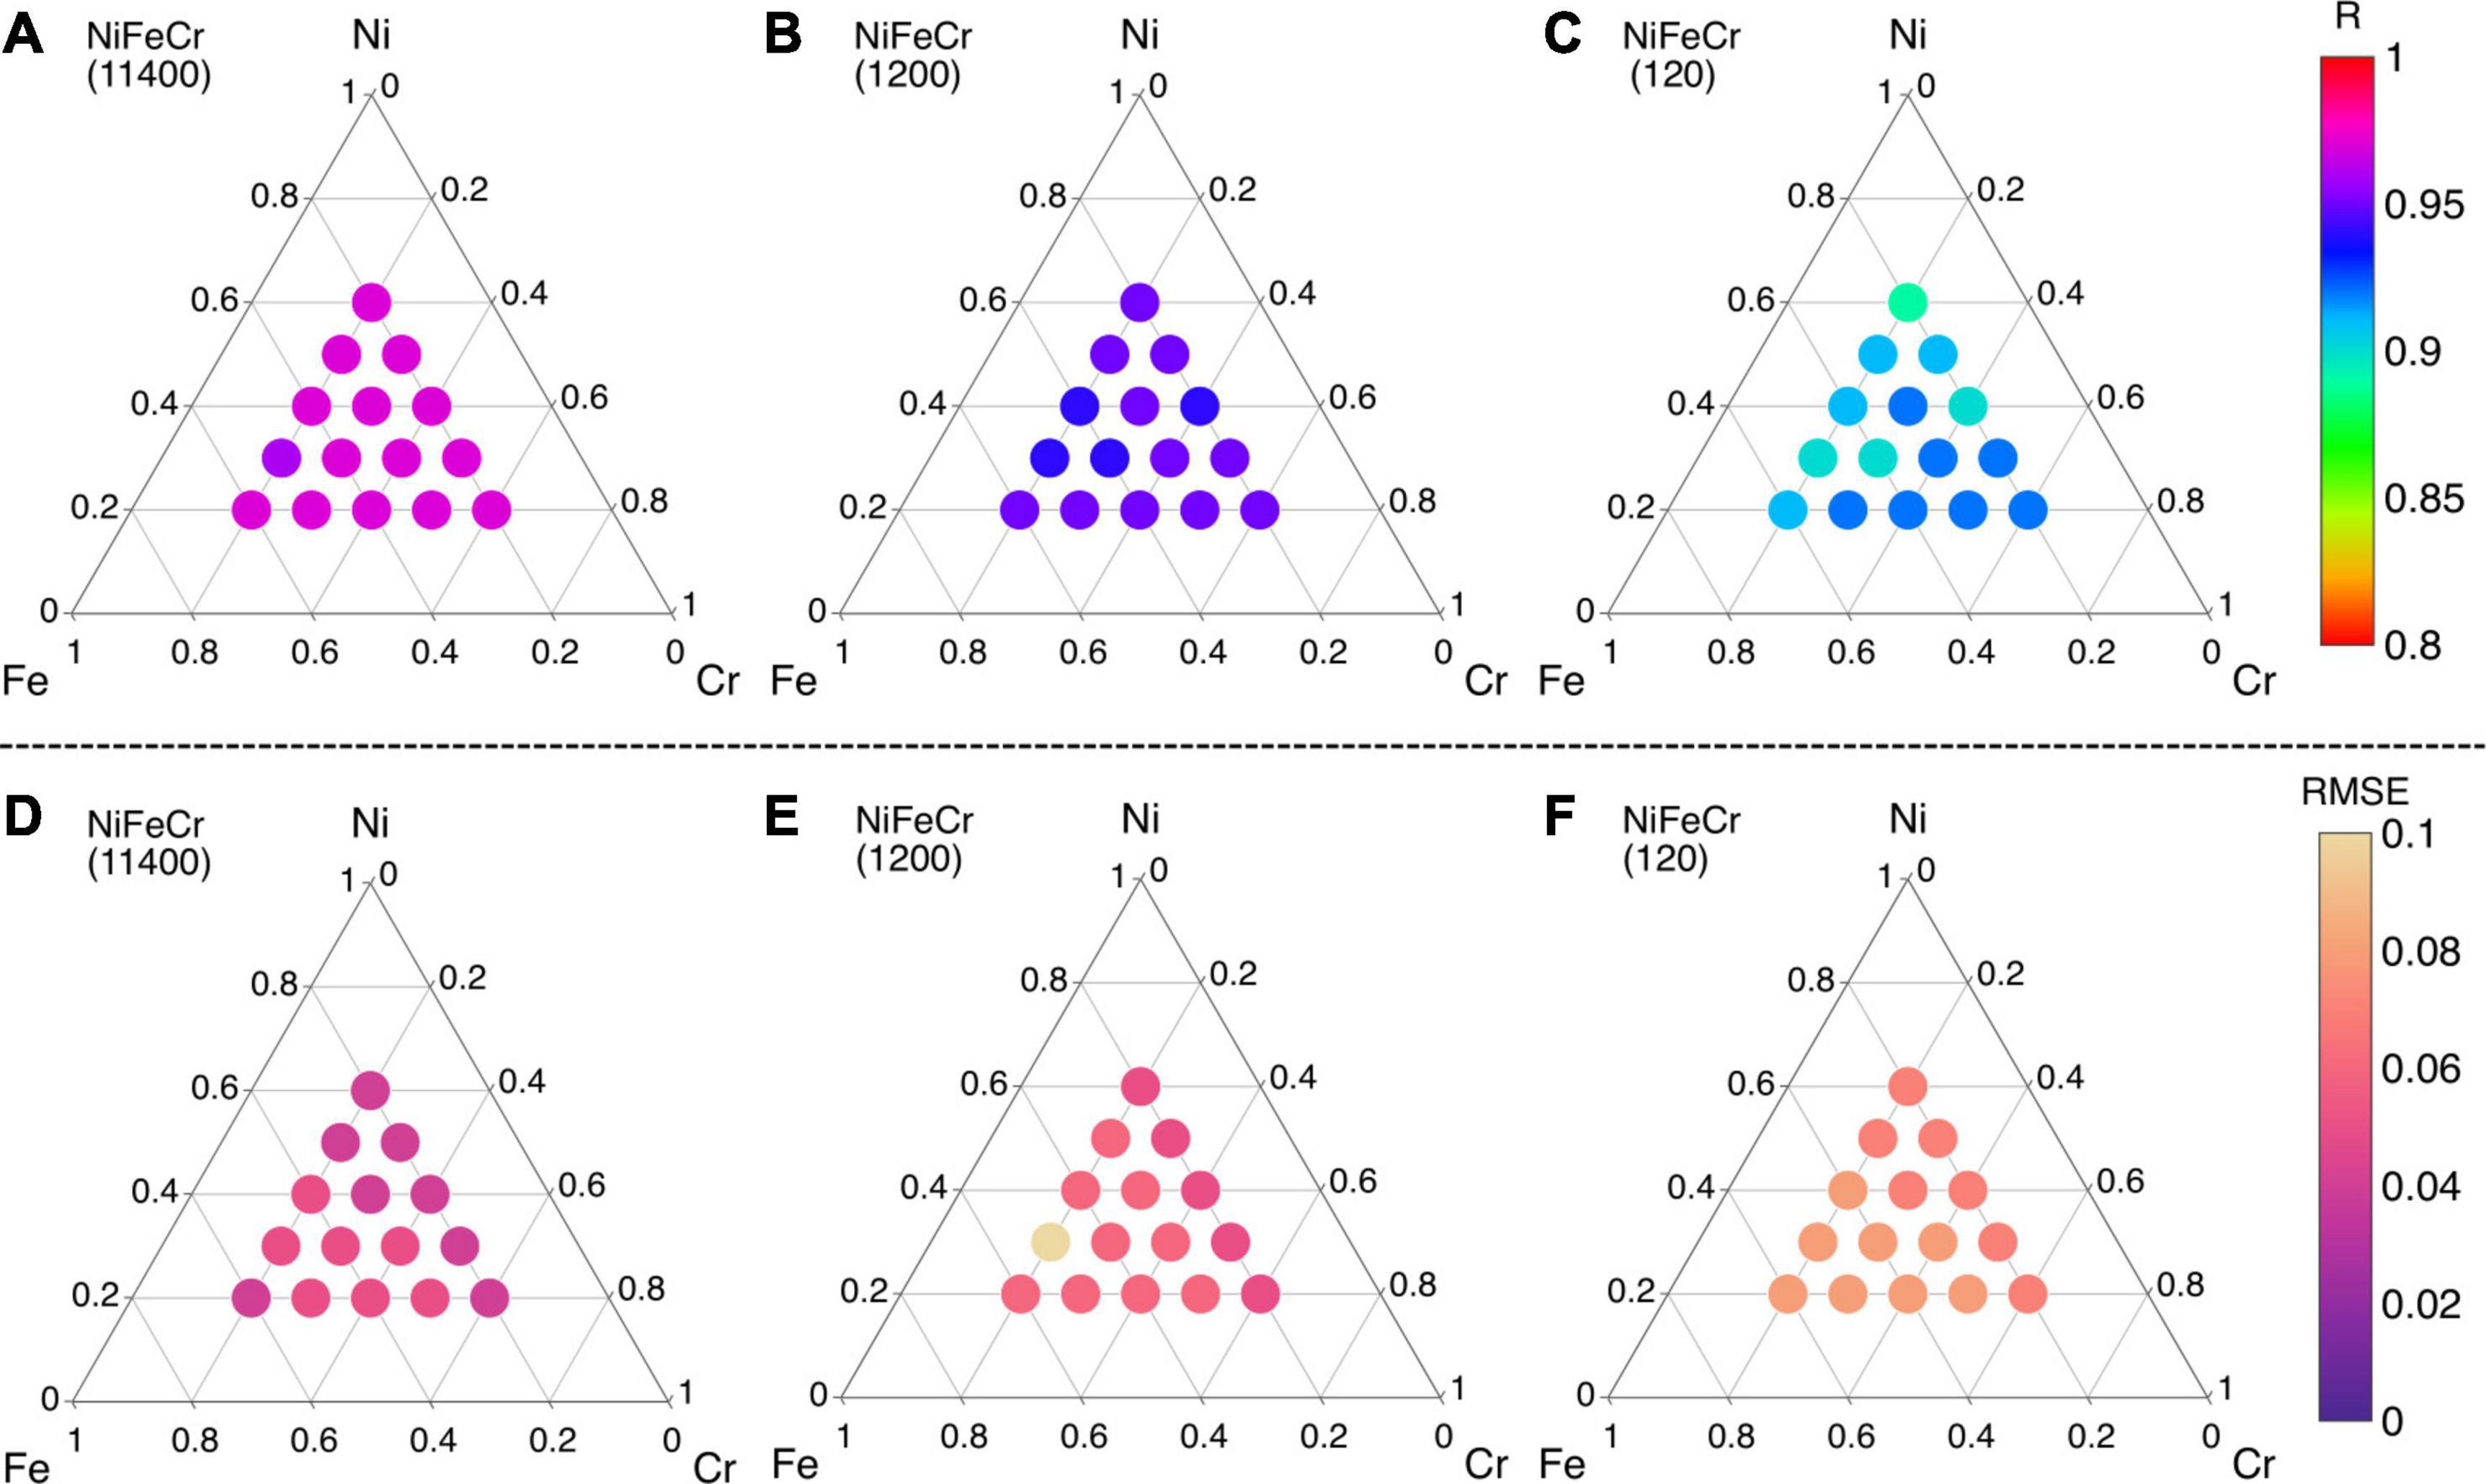
Figure 7. (A–C) Pearson correlation coefficient (R) and (D–F) root mean square error (RMSE) values of migration energies in ternary NiFeCr alloy using different sizes of training data points.
The size of the training data points is reduced to 1,200 and 120 in Figures 7B,C,E,F, respectively. Here, the migration energy binary data at every 20 at% is included from the three alloys. For 1,200 and 120 data points, 100 and 10 migration energy data points, respectively, are included. R > 0.93 and RMSE < 0.07 eV is obtained from 1,200 data points whereas R > 0.89 and RMSE < 0.1 eV is obtained for 120 data points. All these predictions indicate a very good level of accuracy. Furthermore, the results from the 120 data points indicate that a relatively small number of migration energies are needed to train a good ML model; such number of calculations can be practically performed in DFT. Furthermore, since the same 120 data points has been used to predict migration energies in fifteen different NiFeCr alloy compositions, the efficacy of the ML model is terms of computational expense is also equally highlighted. In other words, the framework potentially nullifies the need to perform defect energies calculations even if changes in the elemental composition NiFeCr are made. Consequently, these results indicate that once the binary database is built, it can be used to predict migration energies in any varying composition of the ternary alloy system.
The rest of the following migration energy predictions are made using 120 data points. The Pearson correlation coefficient (R) values of all eight ternary alloys (see Figure 5) are provided in Supplementary Figure 6. The R values of NiFeCu, FeCoCu, FeCoCu and CrCoCu are greater than 0.92, those of NiFeCr and FeCrCo are between 0.89 and 0.93, whereas those of NiFeCo and NiCrCo are between 0.83–0.9. Overall, we find that the migration energies of all eight ternary alloys are predicted with high R values, i.e., greater than 0.8. The corresponding RMSE values of all eight ternary alloys are shown in Figure 8. We find that the RMSE values for all compositions are smaller than 0.1 eV; there are even smaller than 0.05 eV for NiCrCo as shown in Figure 8.
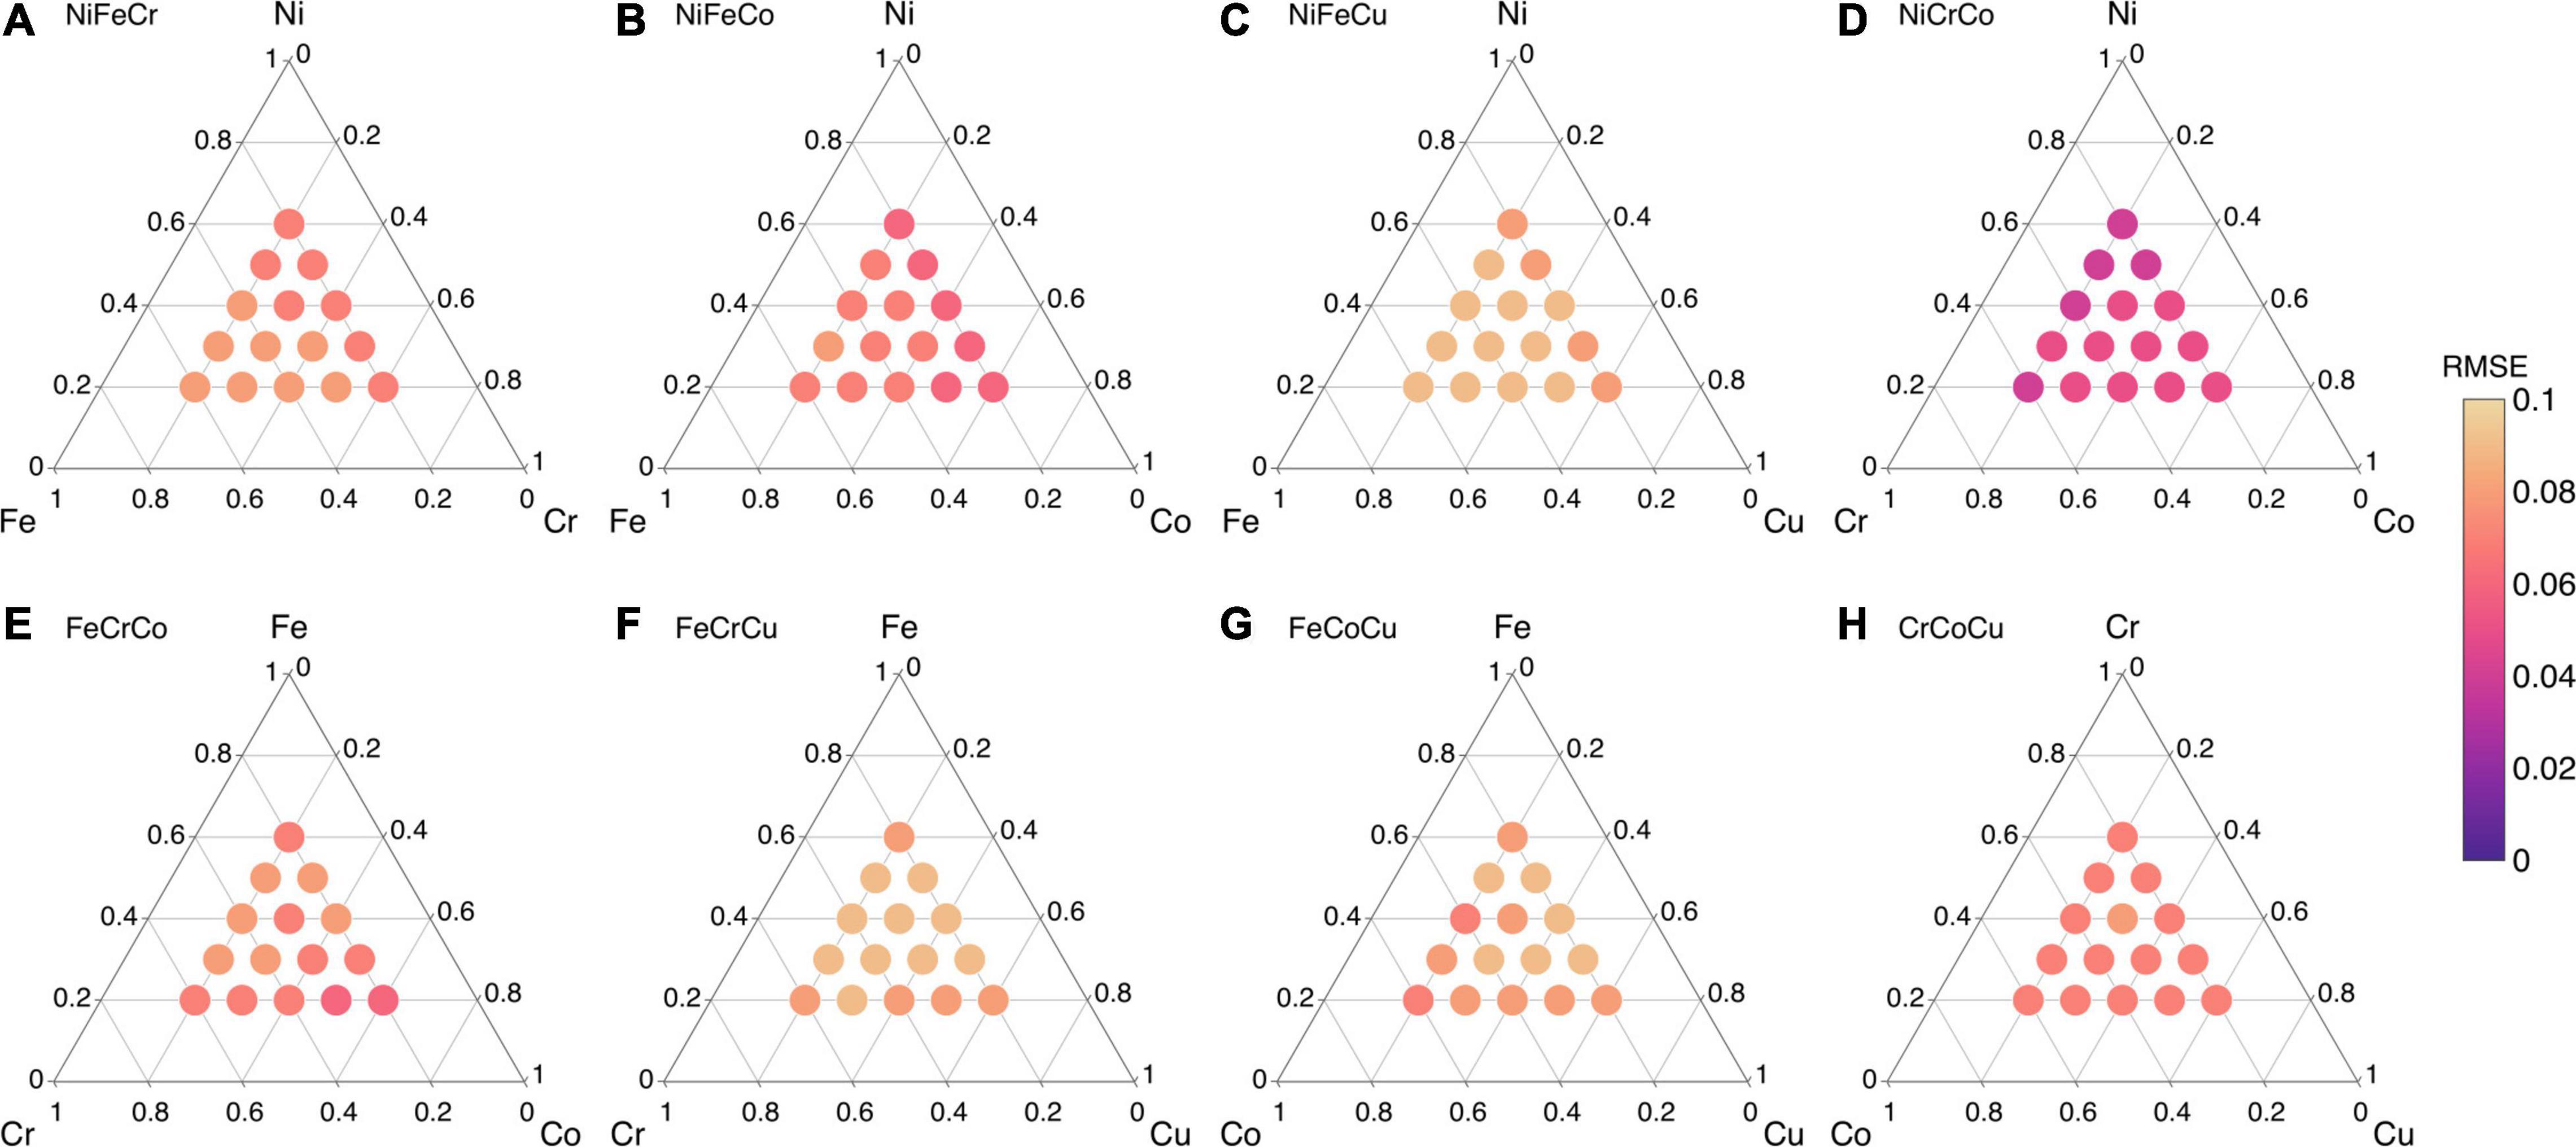
Figure 8. Root mean square error (RMSE) values of ML predicted migration energies of ternary alloys from their constituent binary alloys in (A) NiFeCr, (B) NiFeCo, (C) NiFeCu, (D) NiCrCo, (E) FeCrCo, (F) FeCrCu, (G) FeCoCu, and (H) CrCoCu.
Supplementary Figure 7 shows the true vs ML predicted migration energies in eight equi-atomic ternary alloys. The energies are predicted with high accuracy, i.e., R values equal or greater than 0.84 and RMSE values are smaller than 0.1 eV for all equi-atomic ternary alloys. It is interesting to note that the model captures both the large and small distribution of energies in NiFeCu and NiCrCo, as shown in Supplementary Figures 7C,D.
The migration energies in five quaternary alloys (see Figure 5) are predicted using the same strategy as described in ternary alloys. For example, to predict the migration energies in NiFeCrCo, the training data points consist of energies from six constituting binary alloys, i.e., NiFe, NiCr, NiCo, FeCr, FeCo, and CrCo. Alloy compositions at 20 at% interval with 10 data points from each composition are used to train the model.
Supplementary Figure 8 shows the true vs ML predicted migration energies of five equi-atomic quaternary alloys. All five alloy systems have R > 0.9, and RMSE < 0.1 eV. The predictions for the non equi-atomic quaternary alloys and their corresponding R and RMSE values are given in Supplementary Figures 9, 10. Overall, the predictions among quaternary alloy systems also show a good level of accuracy.
Lastly, the ultimate challenge is to predict the migration energies in quinary alloy, i.e., NiFeCrCoCu from its constituent binary alloys. All ten constituting binary alloys mentioned in Figure 5 are used for training of model. Again, only 10 data points are considered from each composition which makes it total of 400 data points in the training data points. Figure 9 shows the true vs ML predicted migration energies of NiFeCrCoCu equi-atomic alloy. The predictions are quite accurate with R > 0.95 and RMSE < 0.07. The migration energies of non equi-atomic compositions of NiFeCrCoCu base alloy and their R and RMSE values are provided in Supplementary Figures 11, 12.
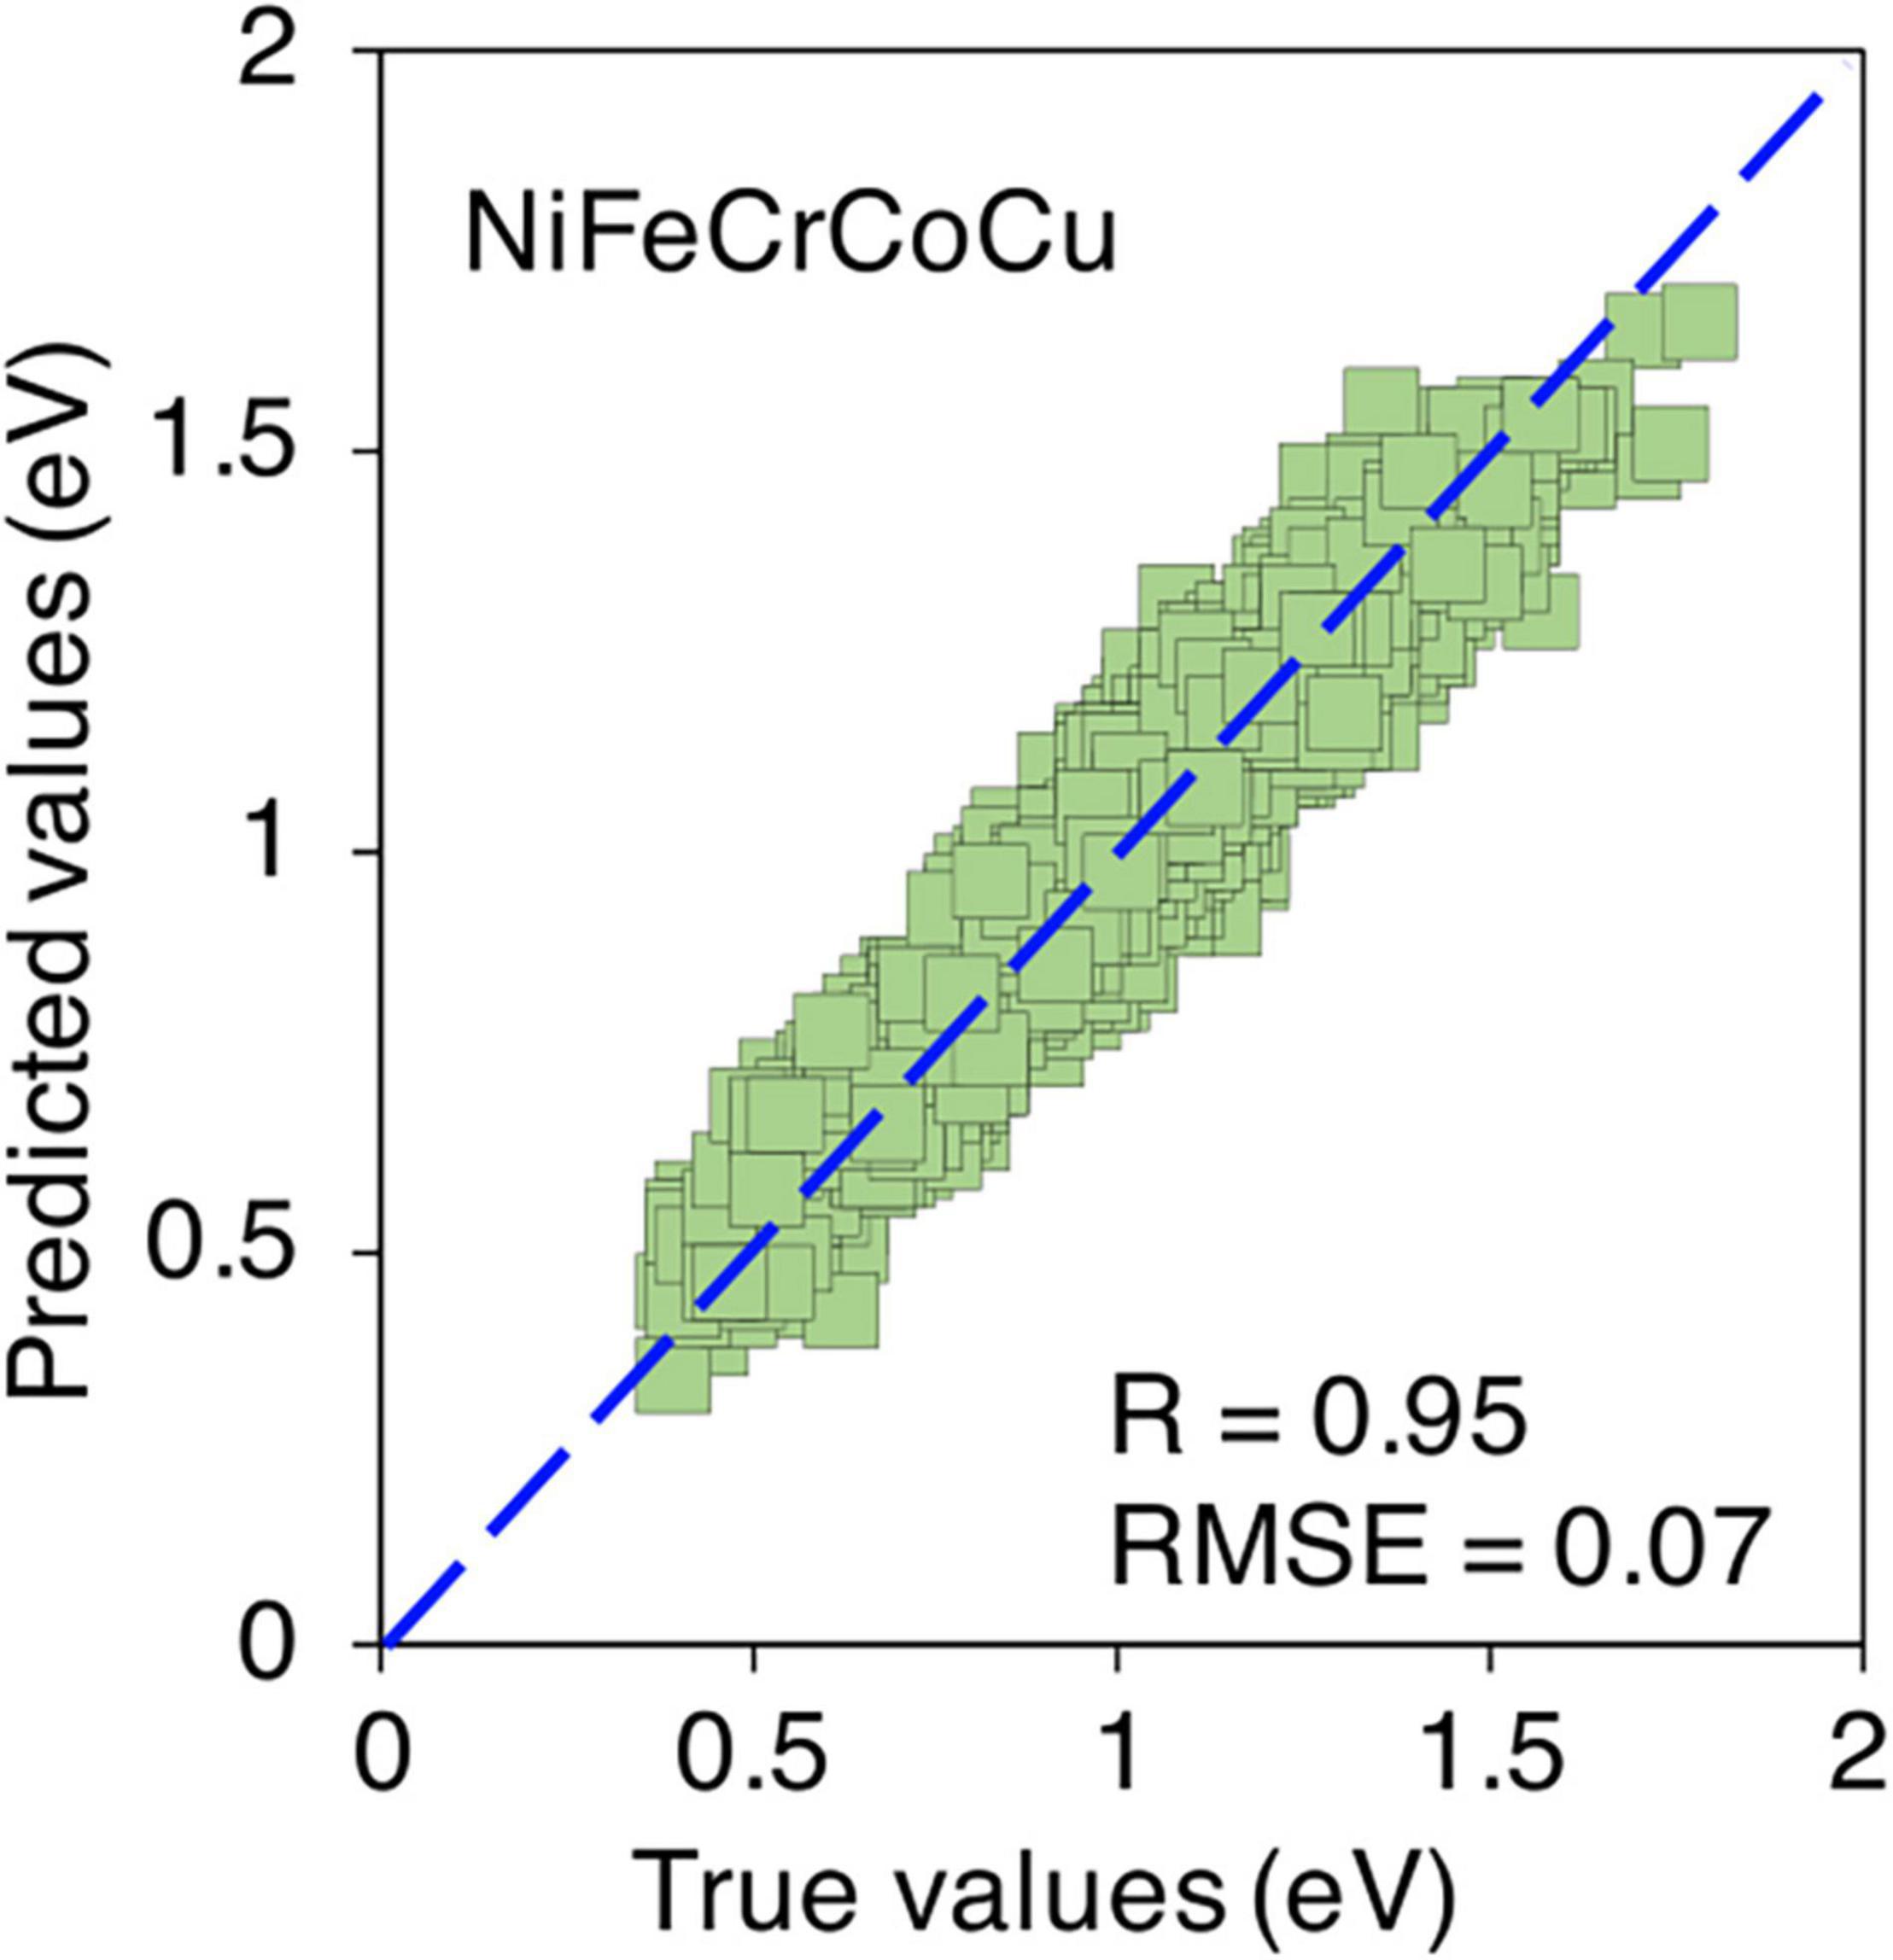
Figure 9. True vs ML predicted migration energies of equi-atomic NiFeCrCoCu alloy.
In summary, the migration energies of ternary, quaternary and quinary alloys are predicted with a very good level accuracy from their constituent binary compositions. The predictions are accurate even with such a reduced size of training data points, i.e., only ten data points from each binary composition. These results demonstrate that only a small number of calculations are required to make a database of migration energies in binary alloys for training a robust ML model.
Predictions of Vacancy Formation Energies From ML
The ML model is developed to predict the vacancy formation energies in ternary, quaternary and quinary alloys from their constituent binary alloys. Using the binary alloys database, we first test the ML model on binary alloys. Figure 10 shows the true vs ML predicted formation energies in four binary compositions, i.e., Ni50Fe50, Ni50Cr50, Fe50Co50, and Fe50Cu50. The model is able to predict the formation energies for both training and testing data points with high R > 0.9 and small RMSE < 0.1 eV, for all considered binary compositions. The accurate predictions of training and testing data points show that relevant descriptors are included into the model. The model is also able to capture the wide variation in formation energies particularly in Fe50Cu50 as seen in Figure 10D.
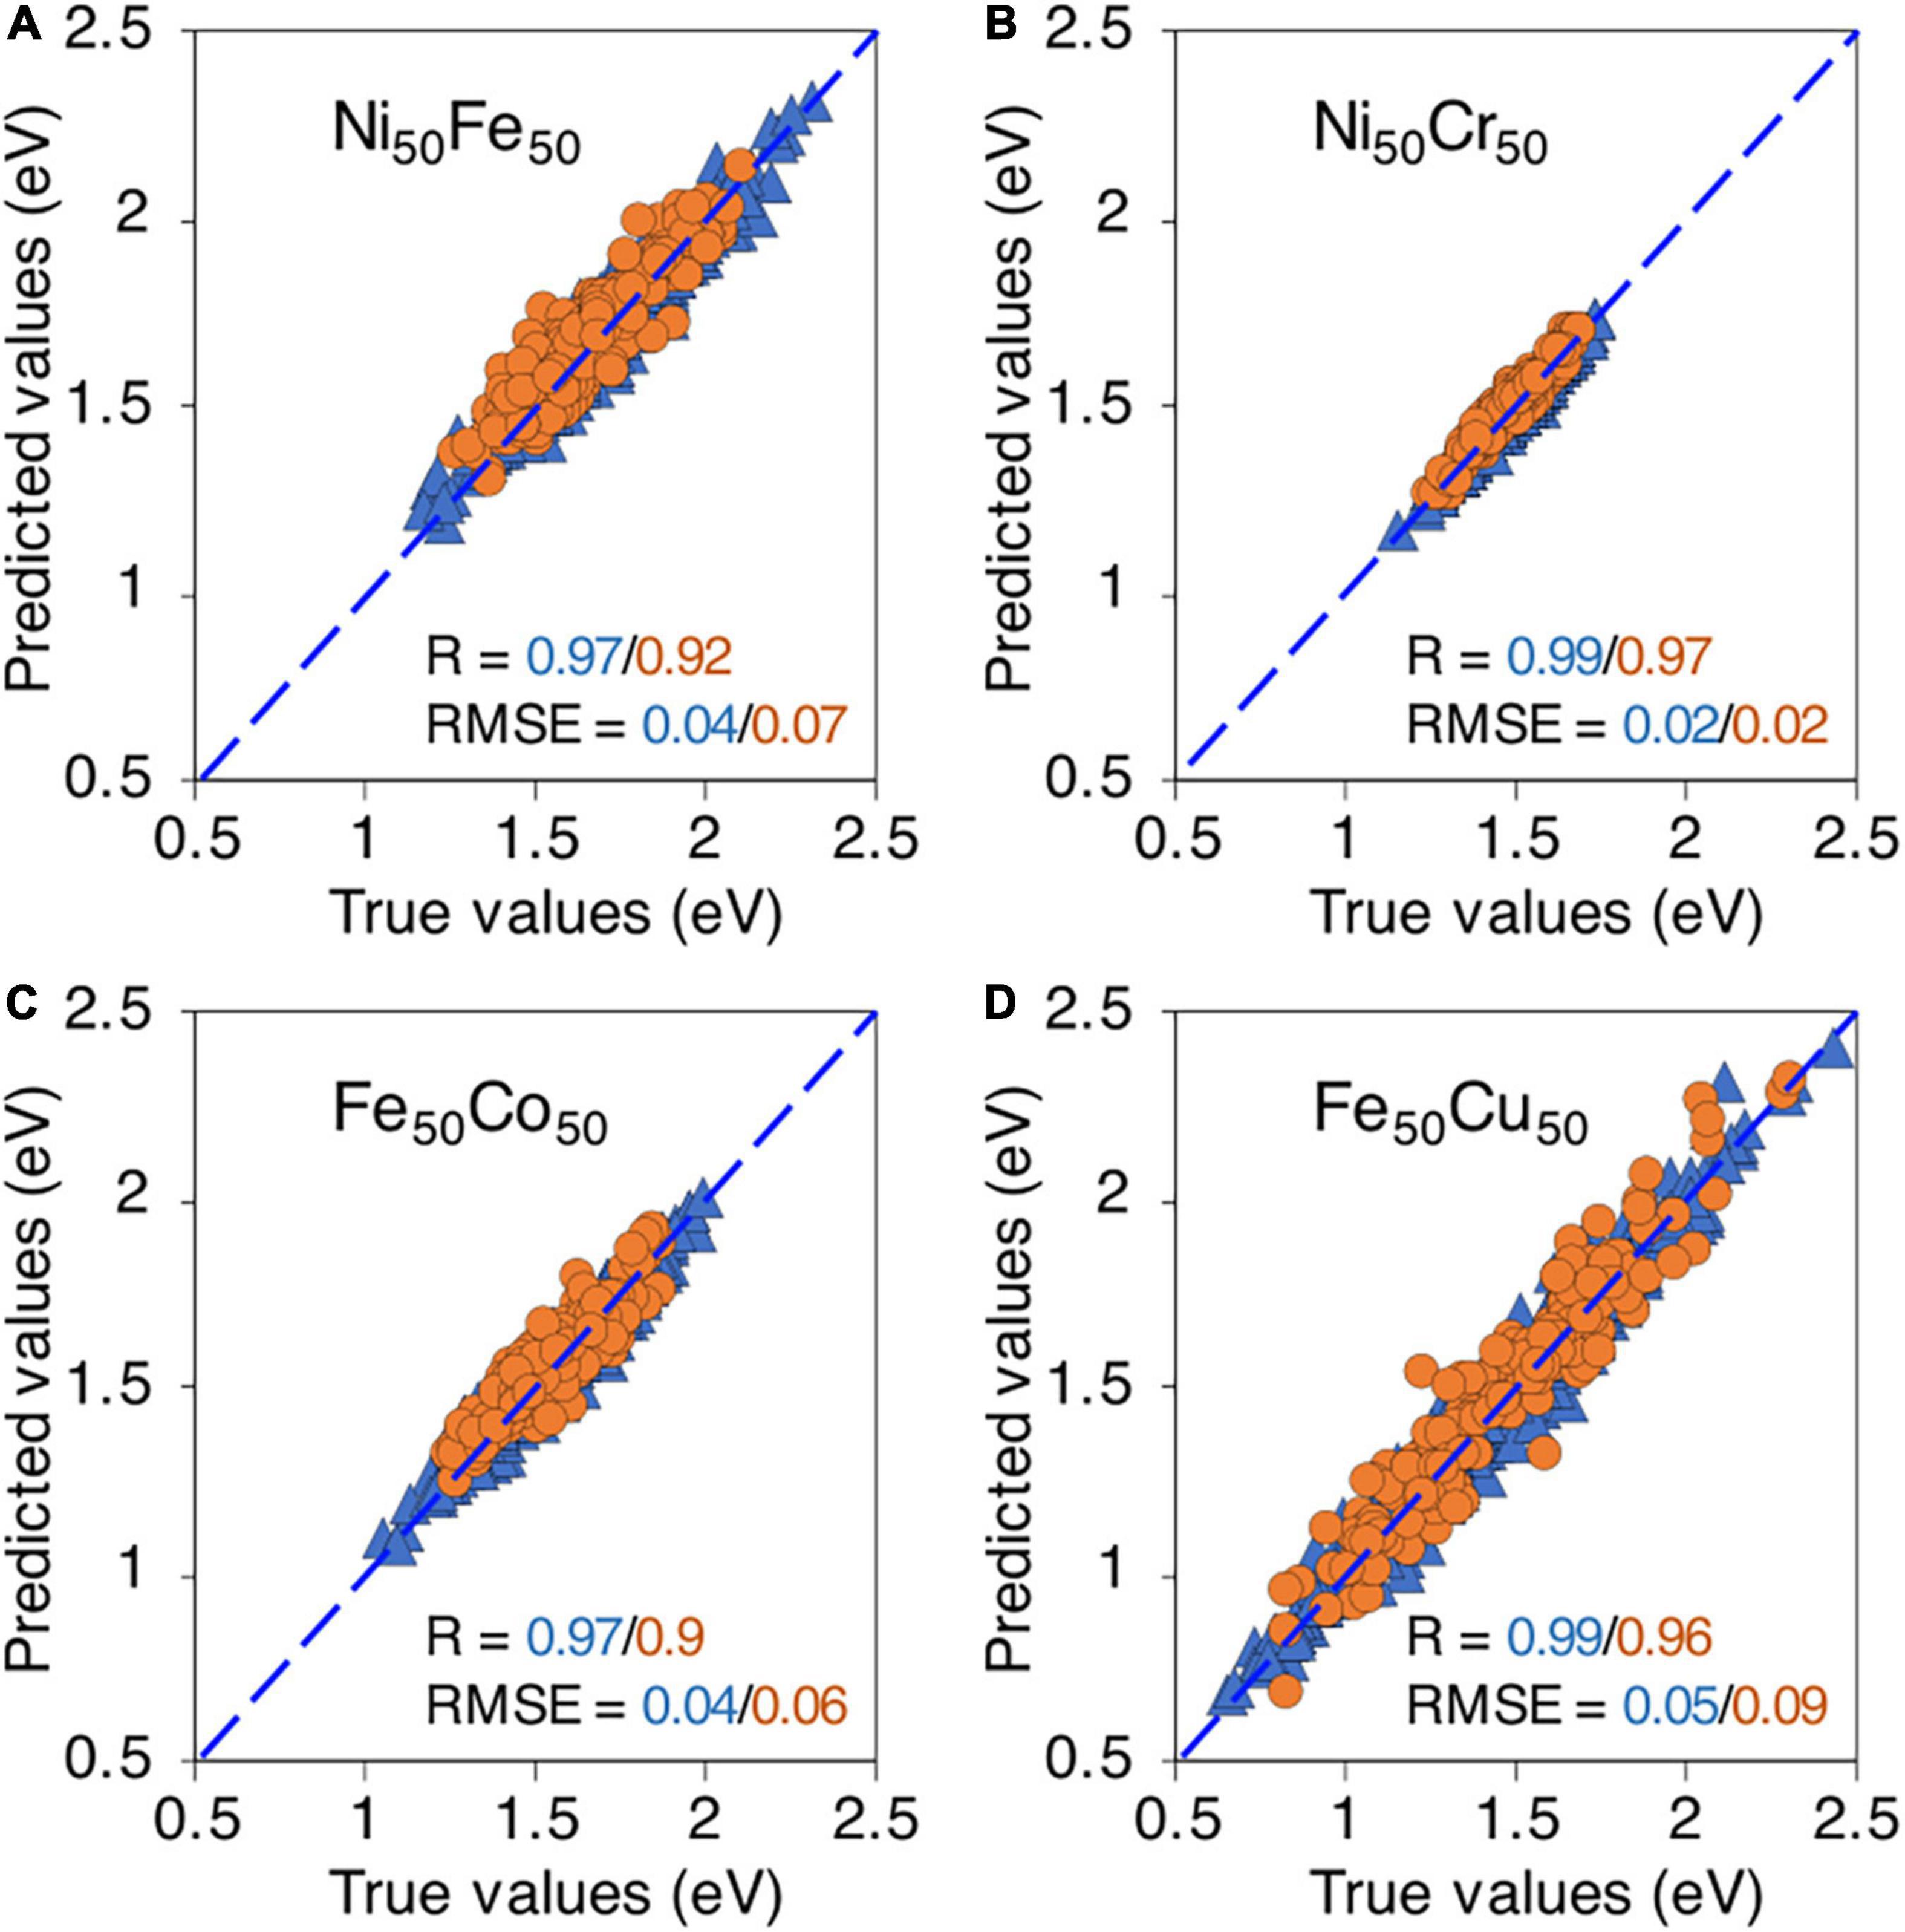
Figure 10. True vs machine learning predicted vacancy formation energies in, (A) Ni50Fe50, (B) Ni50Cr50, and (C) Fe50Co50, and (D) Fe50Cu50. The blue triangles and orange circles are training and testing data points respectively.
We first test our model on ternary NiFeCr alloy system. In Figure 11, the R and RMSE values of ML predicted formation energies in NiFeCr alloys are shown in ternary phase diagrams. Fifteen different compositions within NiFeCr are analyzed, as shown in Figure 11. The predictions are performed from three different data points containing 10,368, 4,800, and 2,400 training data points. The data is collected at an interval of 20 at% in each binary alloy. Note that 864, 400 and 200 data points are used from each composition to train the model for each set of data points. For example, to predict the formation energies in NiFeCr, the ML model is trained on data points from NiFe, NiCr and FeCr binary alloys and the compositions considered from each base alloy are at 20 at% interval, i.e., Ni20X, Ni40X, Ni60X, and Ni80X. In total, twelve binary compositions are considered.
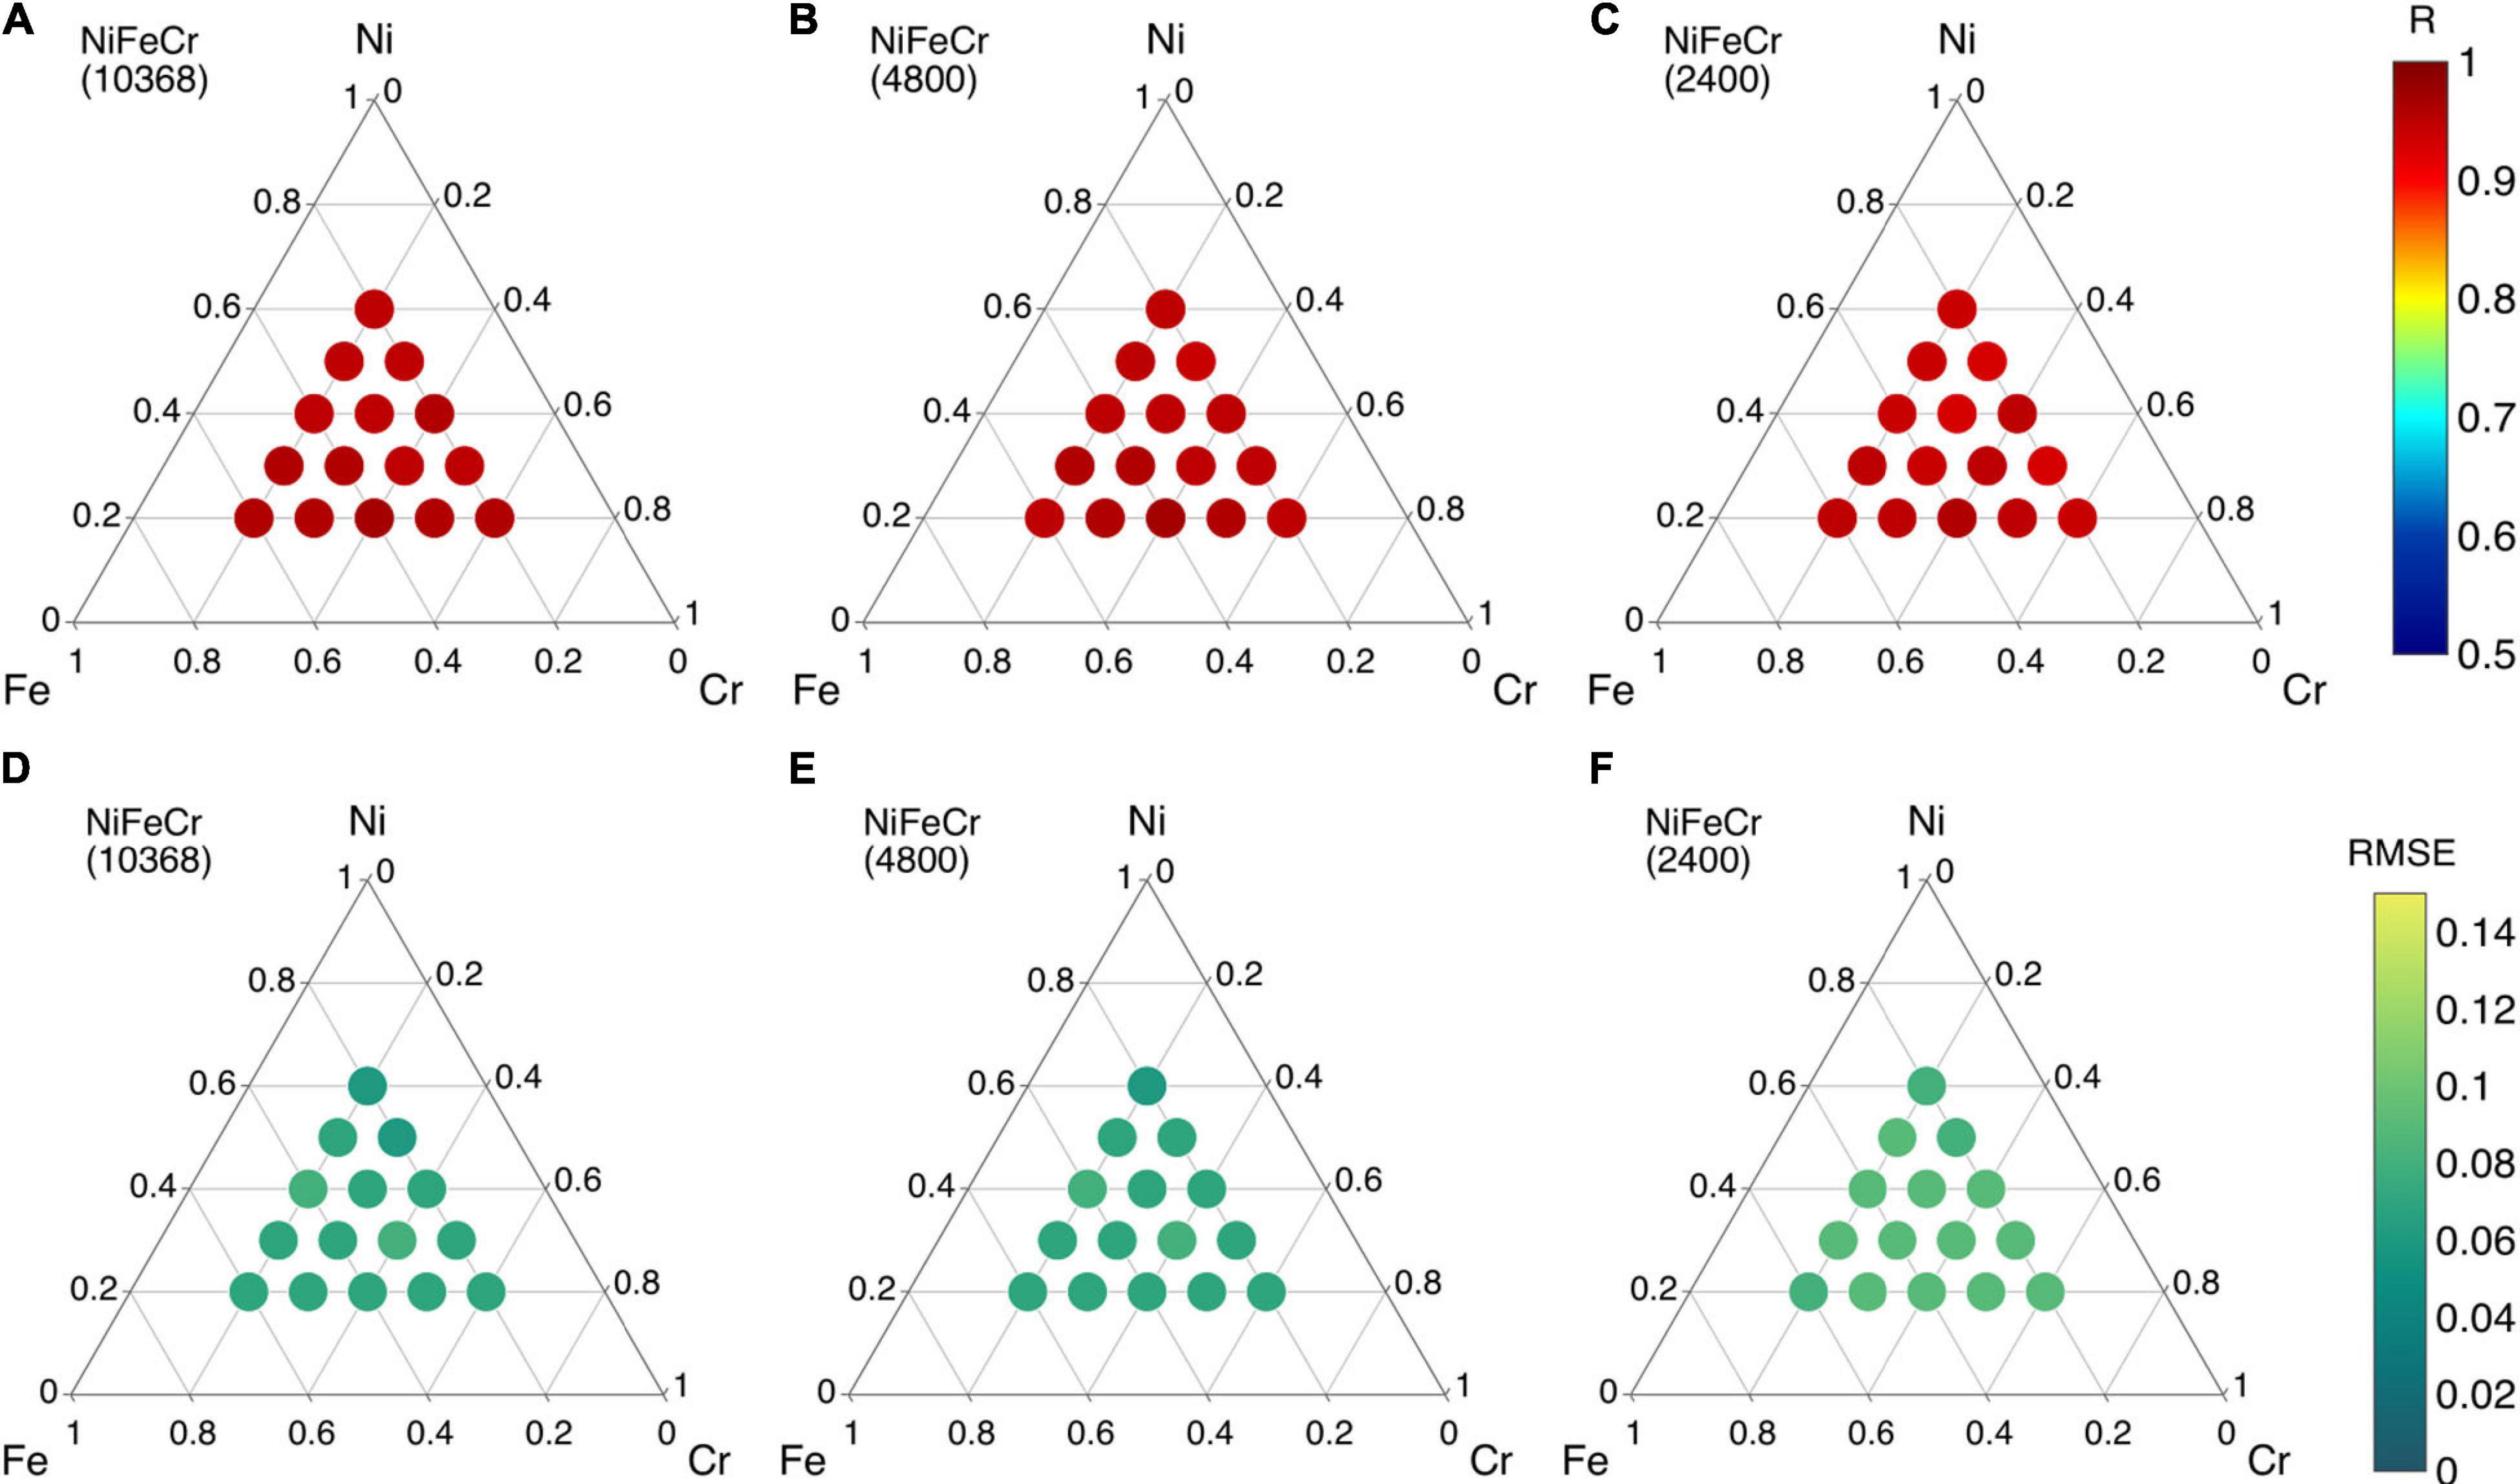
Figure 11. (A–C) Pearson correlation coefficient (R) and (D–F) root mean square error (RMSE) values of vacancy formation energies in ternary NiFeCr alloy using different sizes of training data points.
The R and RMSE values do not change significantly as we reduce the number of training data points, shown in Figure 11. The R values for 10,368, 4,800, and 2,400 training data points are in the range 0.95–0.97, 0.94–0.97, and 0.93–0.96, respectively. Similarly, the RMSE values for all sets are between 0.06 and 0.09. The results from the 2,400 data points indicate that a reasonable number of formation energies could be used to train a good ML model, although the number of the data points is still a bit high; such number of calculations can be performed in DFT to build a database that can be used repeatedly for various compositions. Furthermore, the same data points are used across fifteen different compositions in NiFeCr.
Using the same number of training data points, i.e., 2,400 data points, we predict the formation energies in seven other ternary alloys (see Figure 5) from their constituent binary alloys. The R values in all eight ternary alloys are provided in Supplementary Figure 13. The R values of NiFeCr, NiCrCo and FeCrCo compositions are better compared to other ternary alloy compositions. The R values of these three ternary alloy compositions are equal or greater than 0.88, can be seen in Supplementary Figures 13A,D,E. The R values of NiFeCo, NiFeCu, FeCrCu and FeCoCu are in between 0.78 and 0.91 (see Supplementary Figures 13B,C,F,G). Lastly, we find that one of the compositions, i.e., CrCoCu predictions are relatively worse compared to other alloys as shown in Supplementary Figure 13H; we don’t understand the underlying reason yet.
The RMSE values of all ternary alloy compositions are given in Figure 12. The RMSE value of NiCrCo composition is < 0.05 as shown in Figure 12D. The RMSE values of NiFeCr, NiFeCo, FeCrCo and CrCoCu are in the range 0.07–0.1. The R value of CrCoCu is not as good as expected but the RMSE value is still less than 0.1 eV. Lastly, the RMSE values of NiFeCu, FeCrCu and FeCoCu are lie between 0.1–0.15 eV as shown in Figure 12.
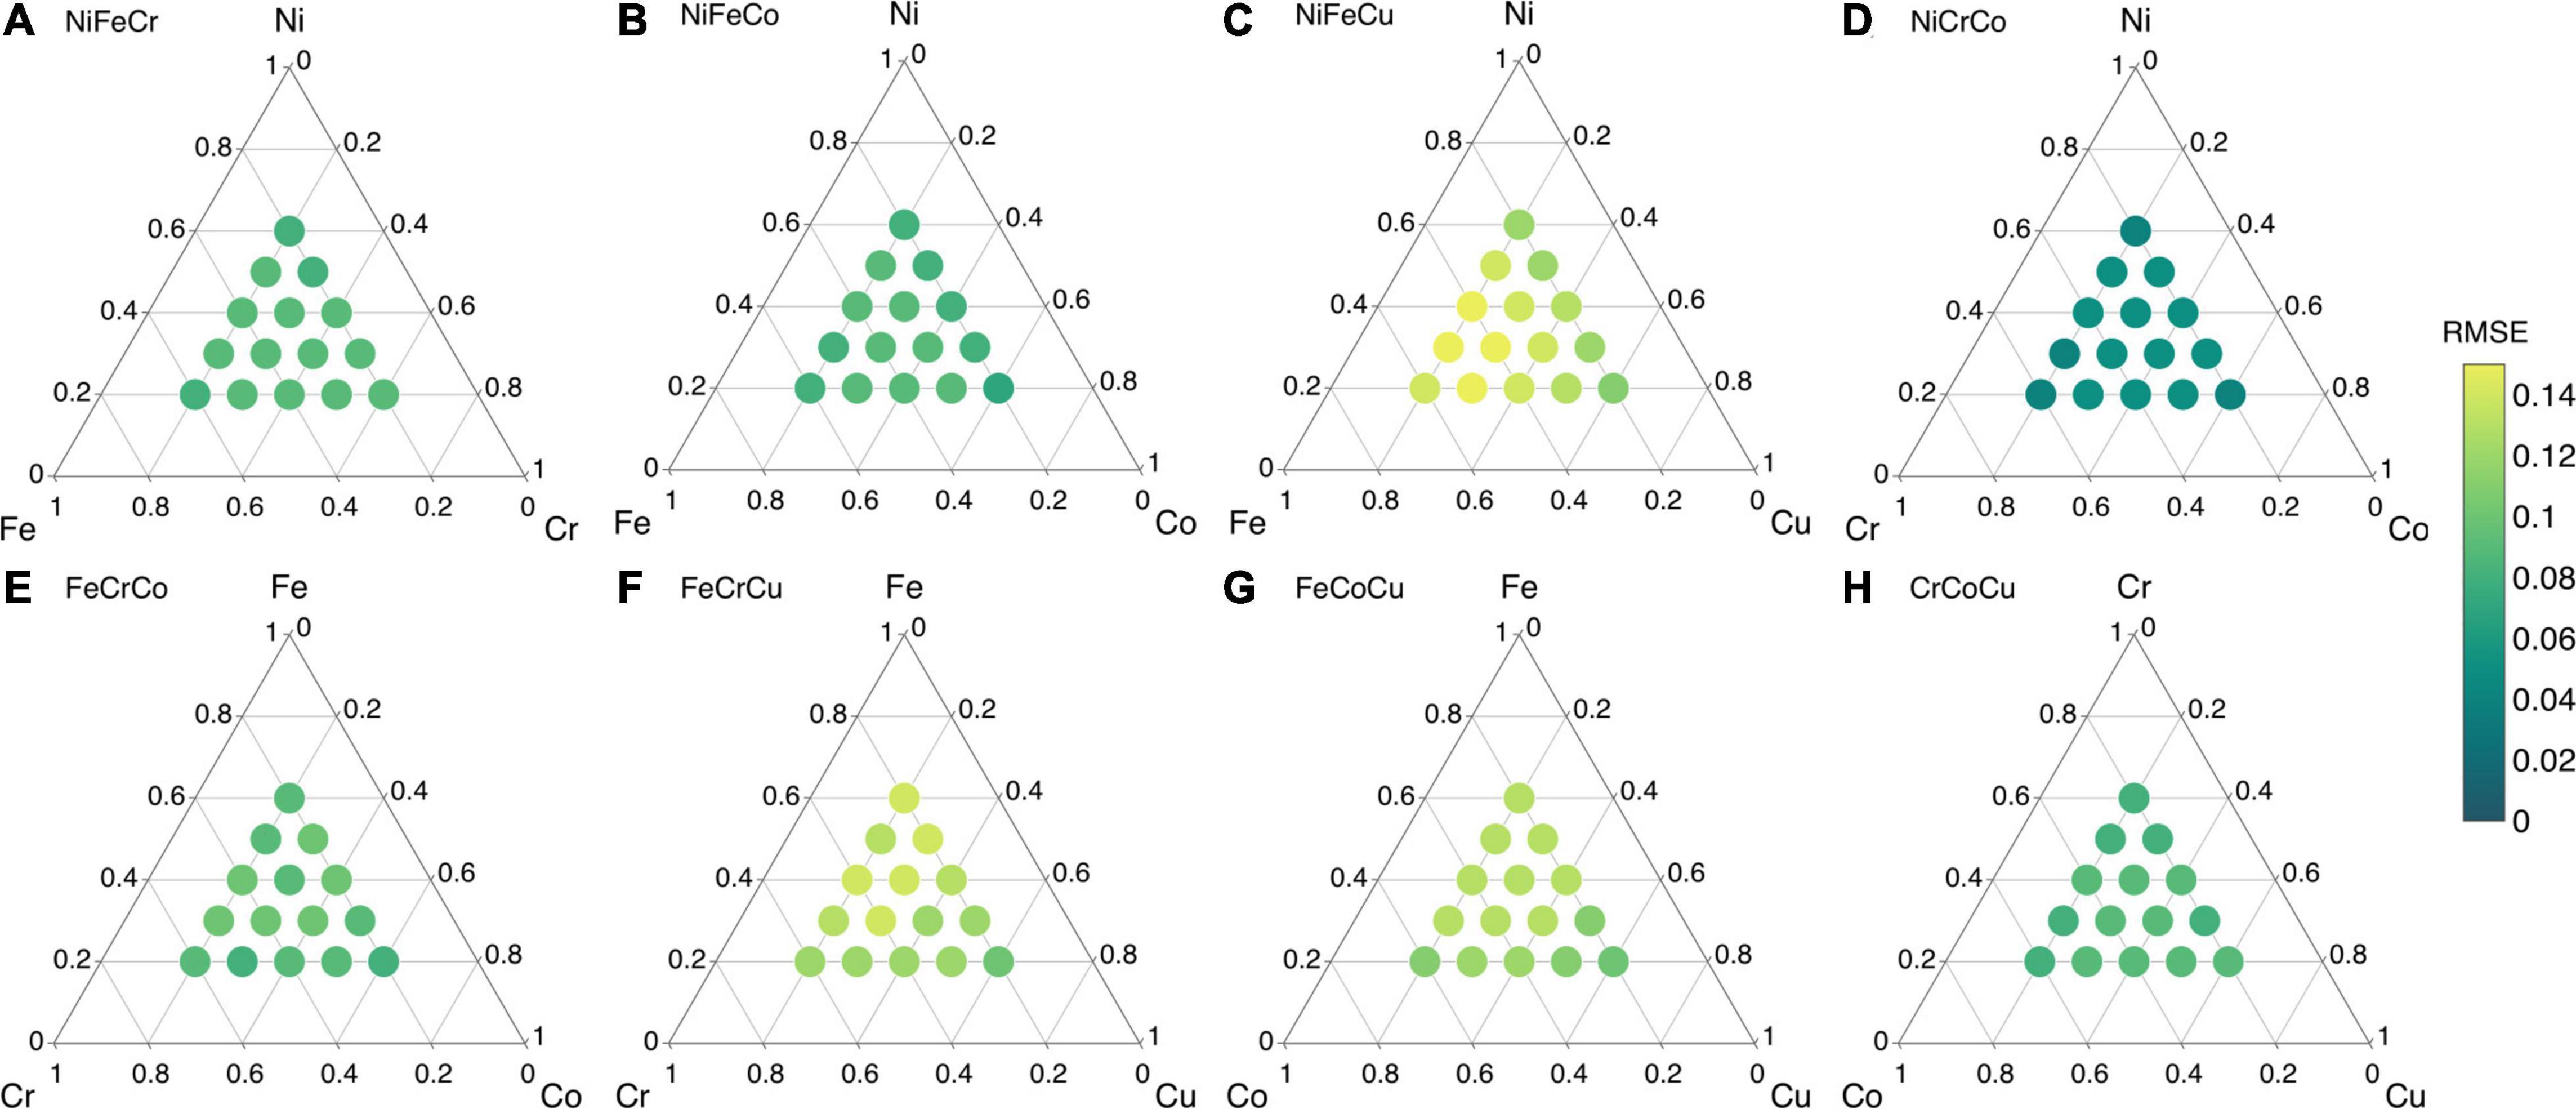
Figure 12. Root mean square error (RMSE) values of ML predicted vacancy formation energies of ternay alloys from their constituent binary alloys in (A) NiFeCr, (B) NiFeCo, (C) NiFeCu, (D) NiCrCo, (E) FeCrCo, (F) FeCrCu, (G) FeCoCu, and (H) CrCoCu.
From Figure 12, the data for equi-atomic compositions are extracted and shown in Supplementary Figure 14. The true vs ML predicted formation energies are shown. For both NiFeCr and NiCrCo, R > 0.9 and RMSE < 0.1 eV. However, the data is more scattered in the case of Cu based alloys particularly in NiFeCu, FeCrCu and FeCoCu. The data for CrCoCu is significantly worse, and the effect of Cu persists as discussed in context to Supplementary Figure 13H above.
The formation energies in five quaternary alloys are predicted using the same strategy as described in ternary alloys. For example, to predict the formation energies in NiFeCrCo, the training data points consist of energies from six constituting binary alloys, i.e., NiFe, NiCr, NiCo, FeCr, FeCo, and CrCo. Alloy compositions at 20 at% interval with 100 data points from each composition are used to train the model.
Supplementary Figure 15 shows the true vs ML predicted formation energies of five equi-atomic quaternary alloys. Except NiCrCoCu, all other quaternary systems have R > 0.8. All five alloy systems have RMSE ≦ 0.15 eV. The predictions for the non equi-atomic quaternary alloys and their corresponding R and RMSE values are given in Supplementary Figures 16, 17.
Finally, the predictions for quinary equi-atomic composition are shown in Figure 13. Again, only 100 data points are considered from each composition which makes it total of 4,000 data points in the training data points. The predictions are acceptable with R = 0.81 and RMSE = 0.13 eV. The formation energies of non equi-atomic compositions of NiFeCrCoCu base alloy and their R and RMSE values are provided in Supplementary Figures 18, 19.
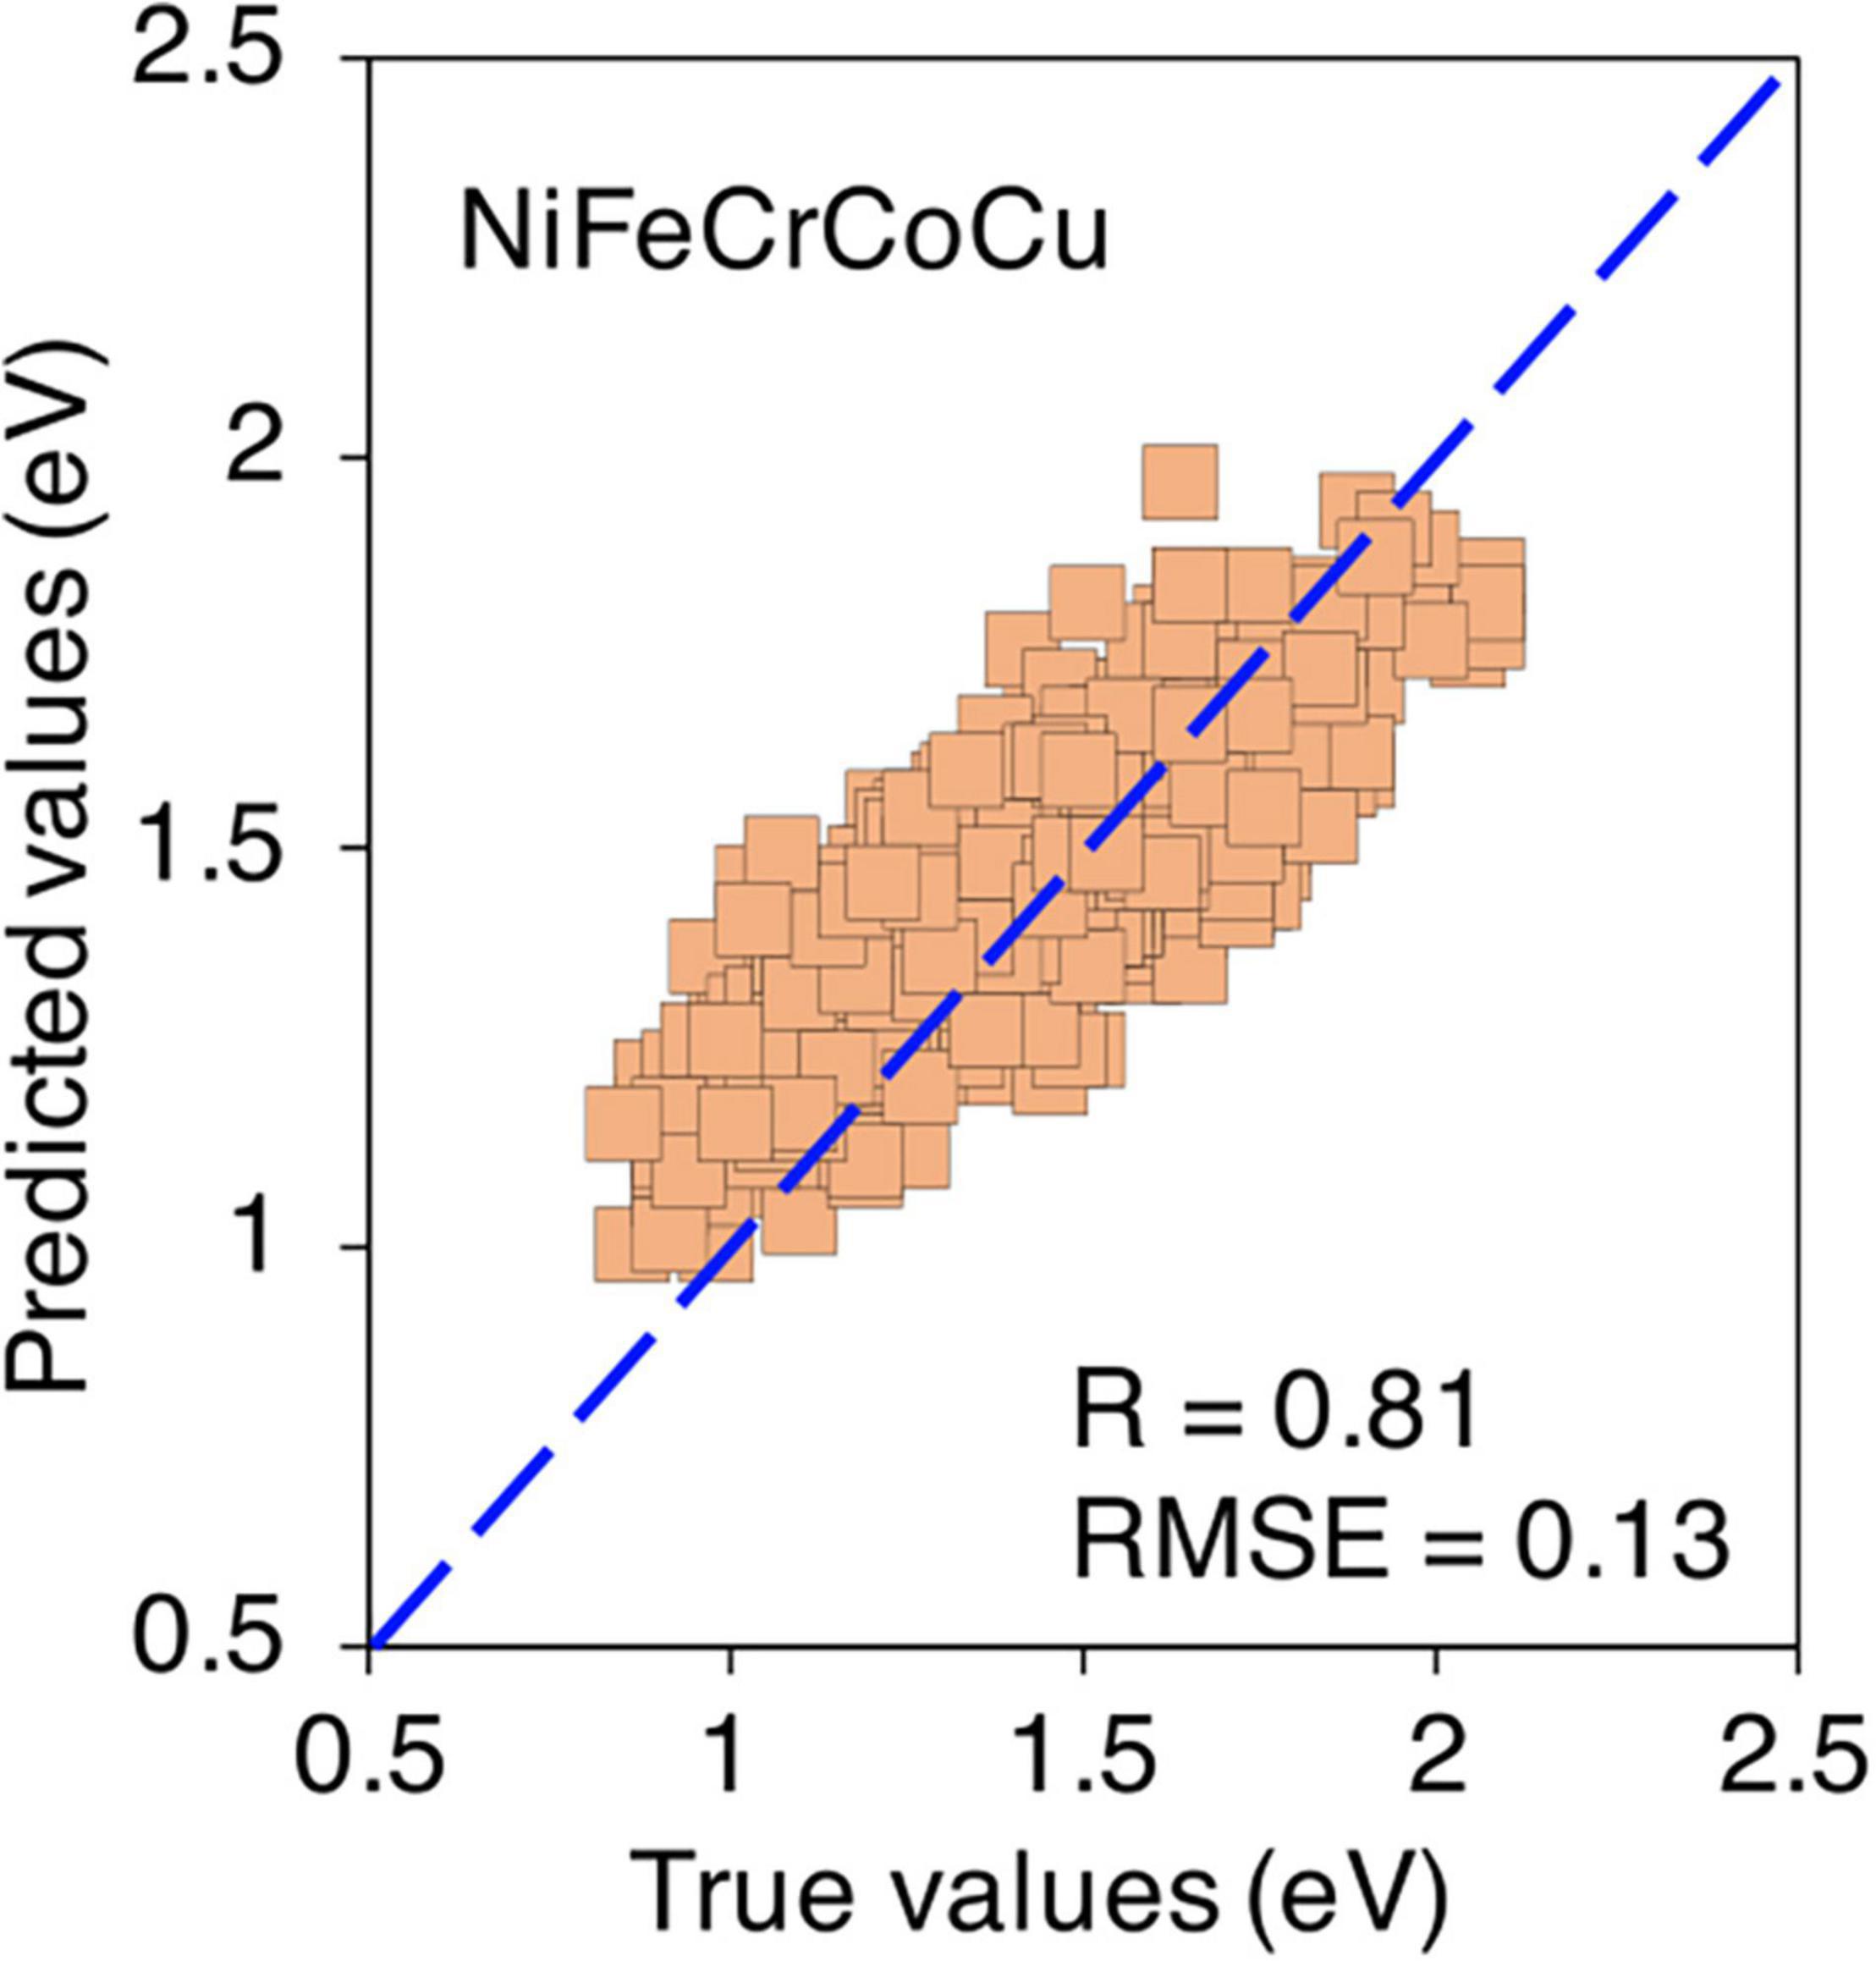
Figure 13. True vs ML predicted formation energies in equi-atomic NiFeCrCoCu alloy.
In summary, ML model is able to predict the formation energies in ternary, quaternary and quinary alloys from their constituent binary compositions. Except few specific Cu based composition, the predictions have good accuracy. Based on our predictions from different amount of data points, overall, these results demonstrate that a practically decent size of data points can be used to train a ML model to predict formation energies in multi-elemental alloys.
Discussion
Large number of calculations are required to fully capture the point defect energies in MPEAs as shown in Table 1. Performing these many calculations in hundreds of compositions is an enormous challenge due to their high computational cost. In this work, we have presented a ML methodology that has a potential to bypass large number of calculations. The ML based models are developed to predict the vacancy migration and formation energies in ternary, quaternary and quinary alloys from their constituent binary alloys. The ML models are able to predict the energies even with reduced size of training data points. The current version of the defect-energy database is built using an interatomic potential. This strategy has allowed us to optimize the size of the training data points and estimate the minimum number of data needed to achieve an acceptable level of accuracy. Now that the critical descriptors are identified, this model can be translated to DFT, where the DFT database can be used to predict properties in MPEAs.
While developing DFT database is our next future task, here we provide a brief comparison of the defect energies between the available DFT results and interatomic potential or ML prediction results in Figure 14. There is very good agreement between interatomic potential (LAMMPS) and ML predictions as our model is able to predict the energies very accurately. The migration energies in Ni50Co50 and Ni50Fe50 are in good agreement with DFT calculations as shown in Figure 14A. The large variation in Ni50Fe50 from potential is due to significantly larger number of calculations compared to fewer DFT calculations. In the case of Ni80Cr20, there is slight disagreement, i.e., the DFT calculated energies are lower compared to interatomic potential, although the variation in energies is almost same, i.e., 0.48 and 0.4 eV respectively. Similarly, for formation energies, there is an agreement between DFT and interatomic calculations for Fe70Ni10Co20 and NiFeCrCo. In both cases, the upper limit is identical between DFT and interatomic potential. However, there is a fair agreement for NiCrCo. The variation in Fe70Ni10Cr20 and NiFeCrCo interatomic-calculated formation energies are higher compared to DFT which is again possibly due to limited DFT statistics. Despite the fact that there are slight disagreements between DFT and interatomic calculated energies, developing an exact agreement is not the purpose of this paper. Rather, we show that the proposed methodology can be used to predict defect energies in complex alloys based on the data, howsoever it may be obtained from.
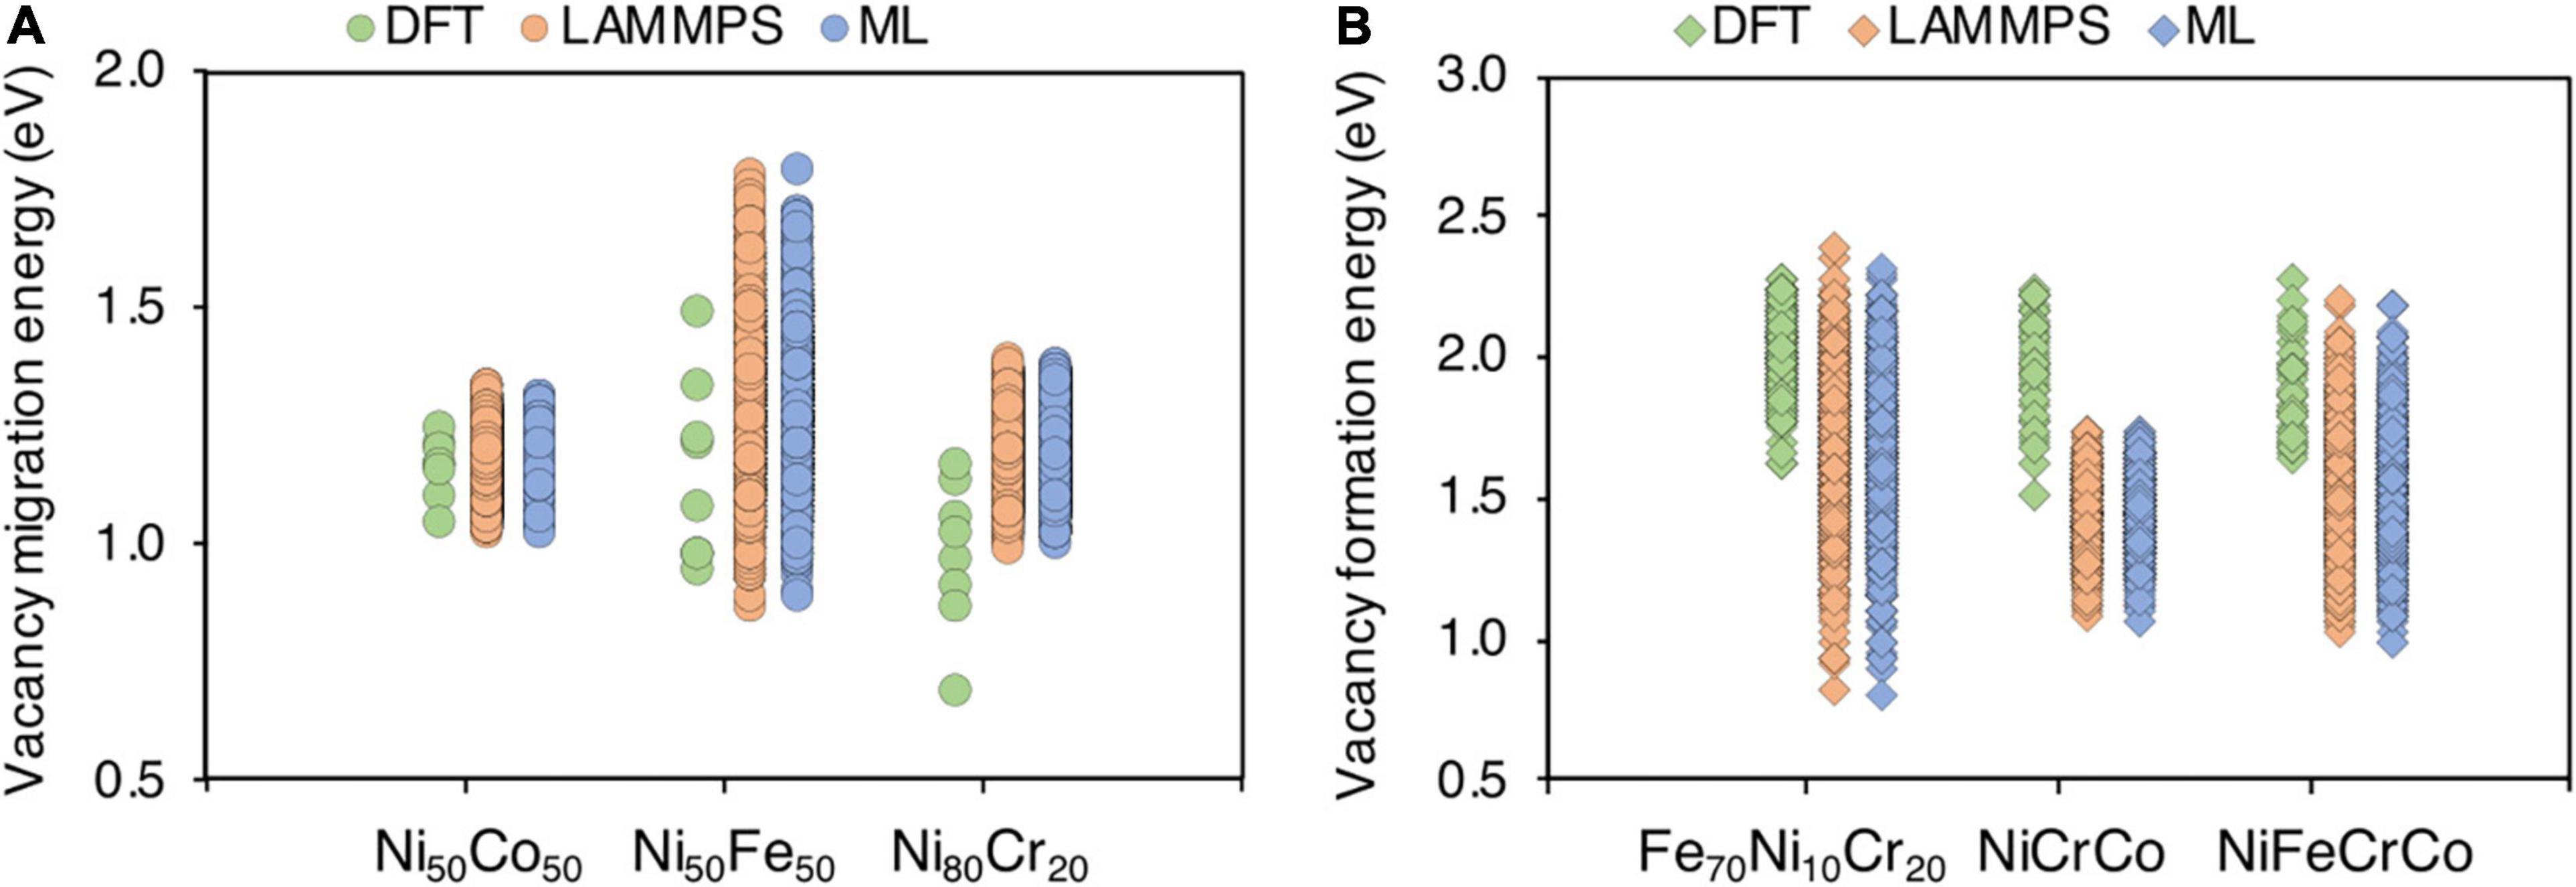
Figure 14. Comparison between DFT, classical interatomic (LAMMPS) and machine learning predicted (ML) point defect energies in various alloy systems (A) vacancy migration energies and (B) vacancy formation energies.
In addition, because the database is based on classical interatomic calculations, there are certain limitations associated with these calculations. For example, the magnetic state of atoms is not captured in these calculations which has been found to influence point defect energies (Guan et al., 2020). Similarly, lattice distortion around point defects can influence the energies (Manzoor et al., under review) which can be better captured in DFT. In near future, we will extend our database to DFT and train the model to further improve predictions.
Conclusion
We have developed a machine learning based framework to predict vacancy migration and formation energies in ternary, quaternary and quinary concentrated alloys from the database built from their constituent binary alloys. We demonstrate the predictions of defect energies in face centered cubic ternary, quaternary and quinary alloys in Ni-Fe-Cr-Co-Cu system. A key benefit of this methodology is that the database could be used to predict defect energies in a variety of compositions thereby circumventing the need to perform calculations from scratch every time a new composition is unearthed in the community. The current framework is built of the database derived from interatomic potential; in near future, we will develop a DFT based database to further improve the predictions.
Data Availability Statement
The original contributions presented in the study are included in the article/Supplementary Material, further inquiries can be directed to the corresponding author/s.
Author Contributions
AM, GA, and DA conceptualized the idea. AM and GA developed machine learning models. AM, GA, BJ, NL, and BN performed the simulations. AM and DA drafted the manuscript. All authors contributed to the article and approved the submitted version.
Funding
This work was supported as part of the Energy Dissipation to Defect Evolution (EDDE), an Energy Frontier Research Center funded by the United States Department of Energy, Office of Science, Basic Energy Sciences.
Conflict of Interest
The authors declare that the research was conducted in the absence of any commercial or financial relationships that could be construed as a potential conflict of interest.
Acknowledgments
We acknowledge the support of computational resources from Advanced Research Computing Center (ARCC) at the University of Wyoming.
Supplementary Material
The Supplementary Material for this article can be found online at: https://www.frontiersin.org/articles/10.3389/fmats.2021.673574/full#supplementary-material
References
Arora, G., and Aidhy, D. S. (2020). Machine learning enabled prediction of stacking fault energies in concentrated alloys. Metals 10, 1–17. doi: 10.3390/met10081072
Arora, G., Bonny, G., Castin, N., and Aidhy, D. S. (2021). Effect of different point-defect energetics in Ni80X20 (X=Fe, Pd) on contrasting vacancy cluster formation from atomistic simulations. Materialia 15:100974. doi: 10.1016/j.mtla.2020.100974
Bernd, G., Hohenwarter, A., Catoor, D., Chang, E. H., Geotge, E. P., and Ritchie, R. O. (2014). A fracture-resistant high-entropy alloy for cryogenic applications. Science 345, 1153–1158. doi: 10.1126/science.1254581
Bonny, G., Chakraborty, D., Pandey, S., Manzoor, A., Castin, N., Phillpot, S. R., et al. (2018). Classical interatomic potential for quaternary Ni-Fe-Cr-Pd solid solution alloys. Model. Simul. Mater. Sci. Eng. 26:065014. doi: 10.1088/1361-651X/aad2e7
Choudhary, K., Biacchi, A., Ghosh, S., Hale, L., Hight, A., and Tavazza, F. (2018). High-throughput assessment of vacancy formation and surface energies of materials using classical force-fields. J. Phys. Condens. Matter 30:395901. doi: 10.1088/1361-648X/aadaff
Del Rio, E., Sampedro, J. M., Dogo, H., Caturla, M. J., Caro, M., Caro, A., et al. (2011). Formation energy of vacancies in FeCr alloys: dependence on Cr concentration. J. Nucl. Mater. 408, 18–24. doi: 10.1016/j.jnucmat.2010.10.021
Ding, J., Yu, Q., Asta, M., and Ritchie, R. O. (2018). Tunable stacking fault energies by tailoring local chemical order in CrCoNi medium-entropy alloys. Proc. Natl. Acad. Sci. U.S.A. 115, 8919–8924. doi: 10.1073/pnas.1808660115
El-Atwani, O., Li, N., Li, M., Devaraj, A., Baldwin, J. K. S., Schneider, M. M., et al. (2019). Outstanding radiation resistance of tungsten-based high entropy alloys. Sci. Adv. 5, 1–10. doi: 10.1126/sciadv.aav2002
Farkas, D., and Caro, A. (2018). Model interatomic potentials and lattice strain in a high-entropy alloy. J. Mater. Res. 33, 3218–3225. doi: 10.1557/jmr.2018.245
Fu, Z., Jiang, L., Wardini, J. L., MacDonald, B. E., Wen, H., Xiong, W., et al. (2018). A high-entropy alloy with hierarchical nanoprecipitates and ultrahigh strength. Sci. Adv. 4, 1–9. doi: 10.1126/sciadv.aat8712
Guan, H., Huang, S., Ding, J., Tian, F., Xu, Q., and Zhao, J. (2020). Chemical environment and magnetic moment effects on point defect formations in CoCrNi-based concentrated solid-solution alloys. Acta Mater. 187, 122–134. doi: 10.1016/j.actamat.2020.01.044
Henkelman, G., Uberuaga, B. P., and Jónsson, H. (2000). Climbing image nudged elastic band method for finding saddle points and minimum energy paths. J. Chem. Phys. 113, 9901–9904. doi: 10.1063/1.1329672
Li, C., Yin, J., Odbadrakh, K., Sales, B. C., Zinkle, S. J., Stocks, G. M., et al. (2019). First principle study of magnetism and vacancy energetics in a near equimolarNiFeMnCr high entropy alloy. J. Appl. Phys. 125: 155103. doi: 10.1063/1.5086172
Li, Z., Pradeep, K. G., Deng, Y., Raabe, D., and Tasan, C. C. (2016). Metastable high-entropy dual-phase alloys overcome the strength-ductility trade-off. Nature 534, 227–230. doi: 10.1038/nature17981
Liu, Y., Zhao, T., Ju, W., and Shi, S. (2017). Materials discovery and design using machine learning. J. Mater. 3, 159–177. doi: 10.1016/j.jmat.2017.08.002
Manzoor, A., and Aidhy, D. S. (2020). Predicting vibrational entropy of fcc solids uniquely from bond chemistry using machine learning. Materialia 12:100804. doi: 10.1016/j.mtla.2020.100804
Medasani, B., Gamst, A. C., Ding, H., Chen, W., Persson, K. A., Asta, M., et al. (2016). Predicting defect behavior in B2intermetallics by merging ab initio modeling and machine learning. Comput. Mater. 2:1. doi: 10.1038/s41524-016-0001-z
Nayak, S. K., Hung, C. J., Sharma, V., Alpay, S. P., Dongare, A. M., Brindley, W. J., et al. (2018). Insight into point defects and impurities in titanium from first principles. Comput. Mater. 4:11. doi: 10.1038/s41524-018-0068-9
Neugebauer, J., and Hickel, T. (2013). Density functional theory in materials science. Wiley Interdiscip. Rev. Comput. Mol. Sci. 3, 438–448. doi: 10.1002/wcms.1125
Osetsky, Y. N., Béland, L. K., and Stoller, R. E. (2016). Specific features of defect and mass transport in concentrated fcc alloys. Acta Mater. 115, 364–371. doi: 10.1016/j.actamat.2016.06.018
Piochaud, J. B., Klaver, T. P. C., Adjanor, G., Olsson, P., Domain, C., and Becquart, C. S. (2014). First-principles study of point defects in an fcc Fe-10Ni-20Cr model alloy. Physcial Rev. B 89:024101. doi: 10.1103/PhysRevB.89.024101
Plimpton, S. (1995). Fast parallel algorithms for short-range molecular dynamics. J. Comput. Phys. 117, 1–19. doi: 10.1006/jcph.1995.1039
Schmidt, J., Marques, M. R. G., Botti, S., and Marques, M. (2019). Recent advances and applications of machine learning in solid-state materials science. npjComput. Mater. 5:83. doi: 10.1038/s41524-019-0221-0
Setyawan, W., Gao, N., and Kurtz, R. J. (2018). A tungsten-rhenium interatomic potential for point defect studies. J. Appl. Phys. 123:205102. doi: 10.1063/1.5030113
Sharma, V., Kumar, P., Dev, P., and Pilania, G. (2020). Machine learning substitutional defect formation energies in ABO3perovskites. J. Appl. Phys. 128:034902. doi: 10.1063/5.0015538
Shenoy, V. B., Frey, N. C., Akinwande, D., and Jariwala, D. (2020). Machine learning-enabled design of point defects in 2d materials for quantum and neuromorphic information processing. ACS Nano 14, 13406–13417. doi: 10.1021/acsnano.0c05267
Tsai, M. H., and Yeh, J. W. (2014). High-entropy alloys: a critical review. Mater. Res. Lett. 2, 107–123. doi: 10.1080/21663831.2014.912690
Wang, A. Y. T., Murdock, R. J., Kauwe, S. K., Oliynyk, A. O., Gurlo, A., Brgoch, J., et al. (2020). Machine learning for materials scientists: an introductory guide toward best practices. Chem. Mater. 32, 4954–4965. doi: 10.1021/acs.chemmater.0c01907
Yeh, J. W., Chen, S.-K., Lin, S.-J., Gan, J.-Y., Chin, T.-S., Shun, T.-T., et al. (2004). Nanostructured high-entropy alloys with multiple principal elements: novel alloy design concepts and outcomes. 6, 299–303. doi: 10.1002/adem.200300567
Youssef, K. M., Zaddach, A. J., Niu, C., Irving, D. L., and Koch, C. C. (2014). A novel low-density, high-hardness, high-entropy alloy with close-packed single-phase nanocrystalline structures. Mater. Res. Lett. 3, 95–99. doi: 10.1080/21663831.2014.985855
Zhang, Y., Egami, T., and Weber, W. J. (2019). Dissipation of radiation energy in concentrated solid-solution alloys: unique defect properties and microstructural evolution. MRS Bull. 44, 798–811. doi: 10.1557/mrs.2019.233
Zhang, Y., George, M. S., Ke, J., Chenyang, L., Hongbin, B., Brian, S. C., et al. (2015). Influence of chemical disorder on energy dissipation and defect evolution in concentrated solid solution alloys. Nat. Commun. 6:8736. doi: 10.1038/ncomms9736
Zhang, Y., Manzoor, A., Jiang, C., Aidhy, D., and Schwen, D. (2021). A statistical approach for atomistic calculations of vacancy formation energy and chemical potentials in concentrated solid-solution alloys. Comput. Mater. Sci. 190:110308. doi: 10.1016/j.commatsci.2021.110308
Zhang, Y., Shijun, Z., Weber, W. J., Kai, N., Fredric, G., and Flyura, D. (2017). Atomic-level heterogeneity and defect dynamics in concentrated solid-solution alloys. Curr. Opin. Solid State Mater. Sci. 21, 221–237. doi: 10.1016/j.cossms.2017.02.002
Zhao, S., Egami, T., Stocks, G. M., and Zhang, Y. (2018). Effect of d electrons on defect properties in equiatomicNiCoCr and NiCoFeCr concentrated solid solution alloys. Phys. Rev. Mater. 2, 1–8. doi: 10.1103/PhysRevMaterials.2.013602
Keywords: multi-principal element alloys, machine learning, vacancy migration energies, vacancy formation energies, point defects
Citation: Manzoor A, Arora G, Jerome B, Linton N, Norman B and Aidhy DS (2021) Machine Learning Based Methodology to Predict Point Defect Energies in Multi-Principal Element Alloys. Front. Mater. 8:673574. doi: 10.3389/fmats.2021.673574
Received: 27 February 2021; Accepted: 06 April 2021;
Published: 01 June 2021.
Edited by:
Shijun Zhao, City University of Hong Kong, Hong KongReviewed by:
Jianqi Xi, University of Wisconsin-Madison, United StatesReid Pei, AECOM, United States
Copyright © 2021 Manzoor, Arora, Jerome, Linton, Norman and Aidhy. This is an open-access article distributed under the terms of the Creative Commons Attribution License (CC BY). The use, distribution or reproduction in other forums is permitted, provided the original author(s) and the copyright owner(s) are credited and that the original publication in this journal is cited, in accordance with accepted academic practice. No use, distribution or reproduction is permitted which does not comply with these terms.
*Correspondence: Dilpuneet S. Aidhy, ZGFpZGh5QHV3eW8uZWR1