 Min Gan1,2
 Yu Yu
Yu Yu- 1School of Civil Engineering, Chongqing University, Chongqing, China
- 2Key Laboratory of New Technology for Construction of Cities in Mountain Area (Chongqing University), Ministry of Education, Chongqing, China
In order to study the seismic performance of high-strength concrete composite shear walls with embedded steel strips, four tests for high-strength concrete composite shear walls with embedded steel strips (SPRCW-1 to SPRCW-4) were constructed and tested. Based on the test results, a discussion is provided in the present study on the hysteresis curve, backbone curves, and strain of steel plate and distributed reinforcement of high-strength concrete mid-rise and high-rise composite shear walls with embedded steel strips under different steel ratios and different steel strip positions. The test results reveal that in high-strength composite shear walls with embedded steel strips, the ductility of the test specimen can be effectively improved when the ratio of the steel strip reaches a certain level. In parallel, when the embedded steel strip is placed on both sides of the walls, the steel strip can function better. The ultimate displacement is better than when the steel strip is placed in the middle of the walls, and can effectively improve the seismic performance of the walls. The scheme with embedded steel strips is more convenient and economical for construction, which is suitable for popularization and application in middle-high buildings in highly seismic regions.
Introduction
Despite having large dimension, high rigidity, and high bearing capacity, the ductility and energy dissipation capacity of shear walls of middle-high building structures in highly seismic regions are poor and can be severely damaged when strong earthquakes occur. The bearing capacity will diminish quickly and become ineffective in the occurrence of an earthquake and the seismic performance of the walls will not be fully exerted. In the present paper, an attempt was made to combine superior performances of concrete composite shear walls with slotted steel plates, such as adjustable rigidity and guided failure mode, through which the construction of two long steel plates (shear studs welded on both sides of the steel plate) in the walls of mid-rise and high-rise concrete shear walls was proposed. According to the different positions and dimensions of the long steel plates, different parameters of slotted steel plates were replaced, thereby reducing the steel ratio and the difficulty in manufacturing shear walls with slotted steel plates and saving the engineering cost. Additionally, cold-formed steel was also built into the edge members, to ensure that the plasticity of the walls could be fully utilized while not excessively increasing the rigidity of the shear walls. In the present paper, the seismic performance of high-strength concrete composite shear walls under different positions of steel strips and different steel ratios in the walls was explored, which provides a theoretical basis for improving the seismic performance of high-strength concrete shear walls.
Many studies and tests have been conducted on concrete shear walls with steel plates. Jiang et al. (2019a) investigated the performance of steel-concrete bolt connections in precast reinforced concrete shear walls. Bahrami and Yavari (2019) discussed the performance of reinforced concrete shear walls on both sides of steel plate under cyclic loading. To determine the ultimate shear strength of steel-concrete shear walls (composite shear walls with double steel plates), Labibzadeh and Hamidi (2019) conducted research to find a new analytical formula. Through numerical studies, Ayazi and Shafaei (2019) performed tests on the seismic performance of shear walls with high performance fiber reinforced concrete slabs and steel plates. Blandon et al. (2018) introduced and discussed the quasi-static cyclic tests of four slender, thin and light reinforced concrete walls with different geometric structures, steel properties, and reinforcement arrangement. To reduce the post-earthquake damage of reinforced concrete shear walls, including permanent lateral deformation and concrete damage, TolouKian and Cruz-Noguez (2018) explored three new methods. Lim and Kim (2017) and Lim et al. (2018) conducted an experimental study on the seismic performance of precast concrete beams. In different places in a nuclear power plant, Lee et al. (2018) studied the shear behavior of seismic connections between cast-in-situ reinforced concrete slabs and steel plate-concrete composite shear walls. Farzampour et al. (2015) predicted and analyzed the performance of shear walls with perforated corrugated steel plates. Rafiee and Sharifi (2019) investigated random vibrations and failure analysis of composite pipe. Kassem and Elsheikh (2010), Moretti et al. (2020), and Zhou et al. (2020) proposed analytical methods for predicting the shear strength and performance of structural shear walls. Edin et al. (2019) and Ebadi and Farajloomanesh (2020) studied seismic performance parameters of shear walls, and proposed a design method based on the actual sharing of story shear wall and peripheral frame. Jiang et al. (2019b) proposed a new type of replaceable coupling beam damper to improve the seismic performance of reinforced concrete coupling beam shear wall.
In the present paper, an attempt was made to combine the advantageous qualities of concrete composite shear walls with slotted steel plates, such as adjustable rigidity and guided failure mode, through which the construction of two long steel plates (shear studs welded on both sides of the steel plate) in medium-high concrete shear walls was proposed. According to the different positions and dimensions of the long steel plates, different parameters of slotted steel plates were replaced, which can reduce the steel ratio and the difficulty in manufacturing shear walls with slotted steel plates and save engineering costs. Research on structural rigidity, mechanical performance, and crack development law of high-strength concrete composite shear walls with steel strips in the walls in different positions and different steel ratios is of considerable practical significance.
Test Overview
Test Design
Test Specimen Design
The dimensions of the high-strength concrete mid-rise and high-rise shear walls test specimens with embedded steel strips (SPRCW-1 to SPRCW-4) in the present test are shown in Figure 1. The horizontal load applied by the horizontally arranged actuator acted directly on the upper loading beam, and the lower support was arranged to provide embedded restraint to the walls.
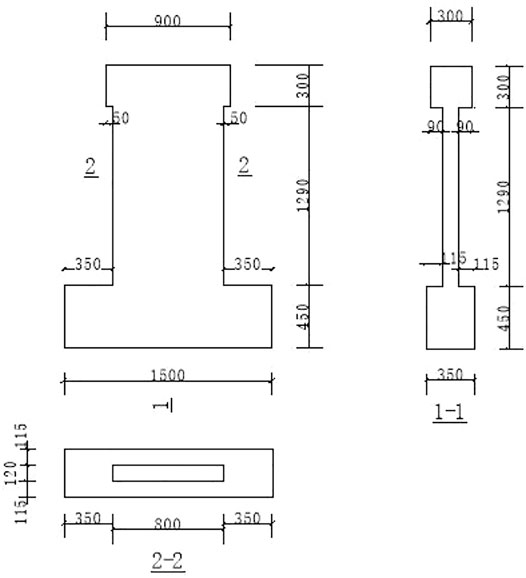
FIGURE 1. Dimensions of test specimen.
The serial numbers of the test specimens were: SPRCW-1 (the steel plate with a high steel ratio arranged in the middle), SPRCW-2 (the steel plate with a low steel ratio arranged in the middle), SPRCW-3 (the steel plate with a low steel ratio arranged on the middle both sides), and SPRCW-4 (the steel plate with a high steel ratio arranged on the middle both sides). Among said specimens, the two test parameters of the steel plate ratio and the position of embedded steel strips were different for the four high-strength concrete medium-high shear walls test specimens (SPRCW-1 to SPRCW4) with embedded steel strips, while the other parameters were consistent. Details of the parameters of the four test specimens are shown in Table 1.
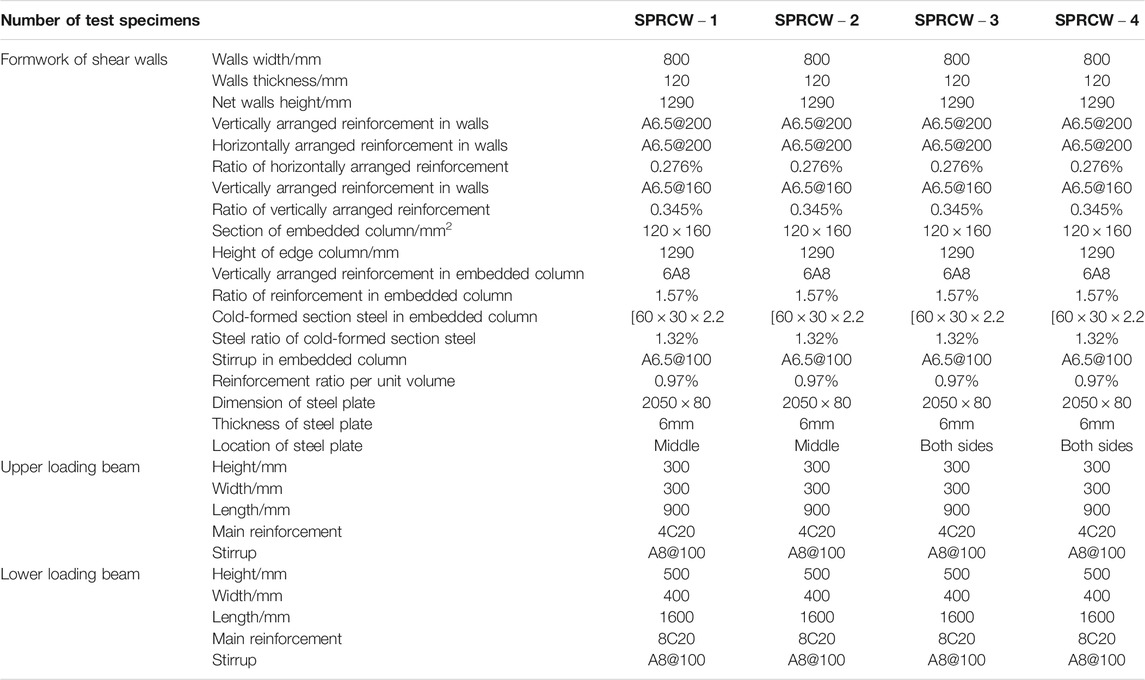
TABLE 1. Table of parameters of test specimens.
See Figure 2 for the SPRCW-1 construction drawing. The differences between the four test specimens are explained as follows.
1) The steel ratio of SPRCW-1 was 1.6%, the distance between the outer edge of the steel plate was 247 mm, the distance between the inner edge of the steel plate and the axis of symmetry was 25 mm, and the edge members on both sides were provided with cold-formed thin-walled steel, respectively, with a steel ratio of 1.43%.
2) The steel ratio of SPRCW-2 was 1.0%, the distance between the outer edge of the steel plate was 270 mm, the distance between the inner edge of the steel plate and the symmetry axis was 50 mm, and the edge members on both sides were provided with cold-formed thin-walled steel, respectively, with a steel ratio of 1.43%.
3) The steel ratio of SPRCW-3 was 1.0%, the distance between the outer edge of the steel plate was 195 mm, the distance between the inner edge of the steel plate and the symmetry axis was 125 mm, and the edge members on both sides were provided with cold-formed thin-walled steel, respectively, with a steel ratio of 1.43%.
4) The steel ratio of SPRCW-4 was 1.6%, the distance between the outer edge of the steel plate was 170 mm, the distance between the inner edge of the steel plate and the axis of symmetry was 104 mm, and the edge members on both sides were provided with cold-formed thin-walled steel, respectively, with a steel ratio of 1.43%.
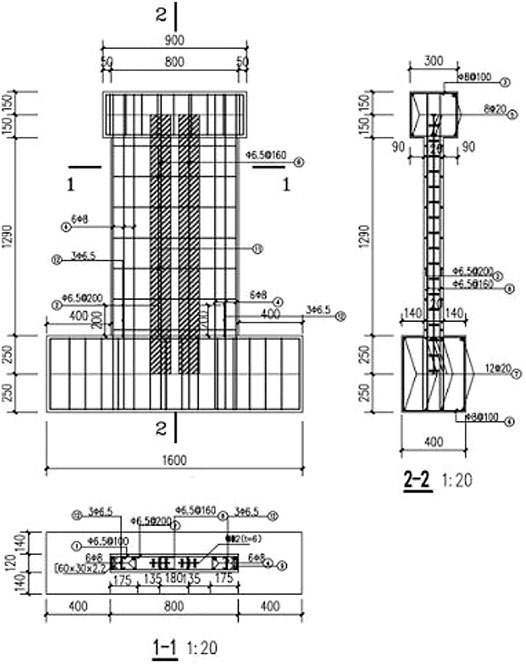
FIGURE 2. Construction drawing of SPRCW-1.
Mechanical Properties of Steel
The present material property test was conducted in the Material Mechanics Laboratory of Chongqing University. As for the sampling and dimension of the test specimens, 12 test specimens were made according to the national standard, Metallic Materials-Tensile Test Method at Room Temperature (GB/GB/T 228–2010) (GB/T 228, 2010). The material property test was designed to determine the mechanical property parameters of cold-formed thin-walled steel, Q235A hot-rolled steel plate and HPB300 reinforcement used under uniaxial tension: elastic modulus
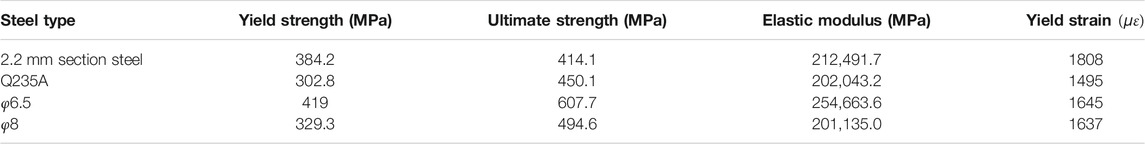
TABLE 2. Material properties of steel.
Measured Strength of Concrete and Axial Load of Test Specimen
The five test specimens in the present test were made of C60 concrete. The test specimens were made, poured, and cured at the same time. The dimensions of the test specimens were 150 × 150 × 150 mm. During the 28-day curing period and on the test day, cube compressive strength tests were, respectively conducted on test specimens, and the average values were taken. See Table 3 for details.
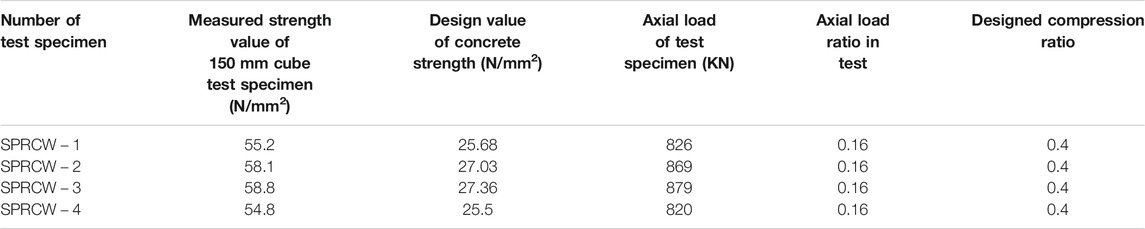
TABLE 3. Concrete strength and axial load ratio.
Test Equipment and Loading Protocol
Test Equipment
Following the Specifications of Testing Methods for Earthquake Resistant Buildings (JGJ101-2015) (JGJ 101, 2015), quasi-static tests in repeated low-cycle loadings with fixed axial load were conducted. A repeated low-cycle loading test device was used, which consisted of a vertical and a horizontal loading device. The vertical load was controlled by hydraulic jacks through ball bearings, and the maximum bearing capacity of the single vertical ball bearing was 120 KN. During the test, an oil pump was manually controlled to ensure the stability of the vertical load. The horizontal loading device was mainly comprised of reaction walls, a horizontal actuator, and a horizontal connecting device, wherein the end part of the horizontal actuator was connected to the horizontal connecting device through hinges. A horizontal load was mainly applied by the horizontal actuator, one end of the actuator was connected to a loading beam of the test specimen, and one end of the actuator acted on the reaction walls. The schematic diagram of the test equipment is shown in Figure 3.
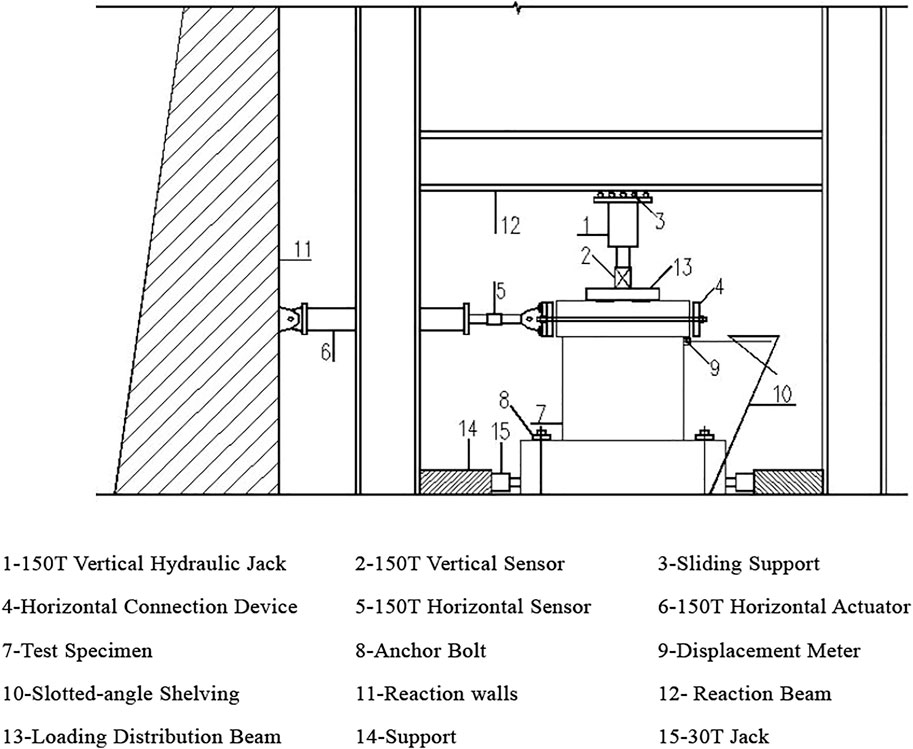
FIGURE 3. Loading setup.
Loading Protocol for Test
In the present test, the quasi-static test method was adopted for loading. During the test, the vertical load was controlled to remain unchanged while the horizontal load changed continuously according to the axial load ratio. The loading process was as follows:
1) In the preloaded stage, first, a 150 KN axial load was preloaded on the top of the test specimen, and then unloaded to 0 KN, to eliminate the nonuniformity of the internal load of the test specimen. After the axial load was loaded to a predetermined value, the test equipment was tested in the normal working state thereof by one cycle of loading in both the forward and backward directions with a 20 KN horizontal load.
2) After the first stage of work was completed, a positive horizontal load was applied, which was progressively increasing by 20, 40, 60, and 80 KN until the first crack appeared, and the crack load
3) After the second stage of work was completed, the displacement loading stage began. With the initial position after the axial force was applied as the initial starting point, two cycles of loading were conducted according to the displacement control for each load. The first cyclic displacement was equally divided into three steps of loading, and the second cyclic displacement was completed by one cycle of loading. Loading ended when the test specimen completely lost bearing capacity or when out-of-plane instability caused loading difficulty. See Figure 4 for the test loading protocol.
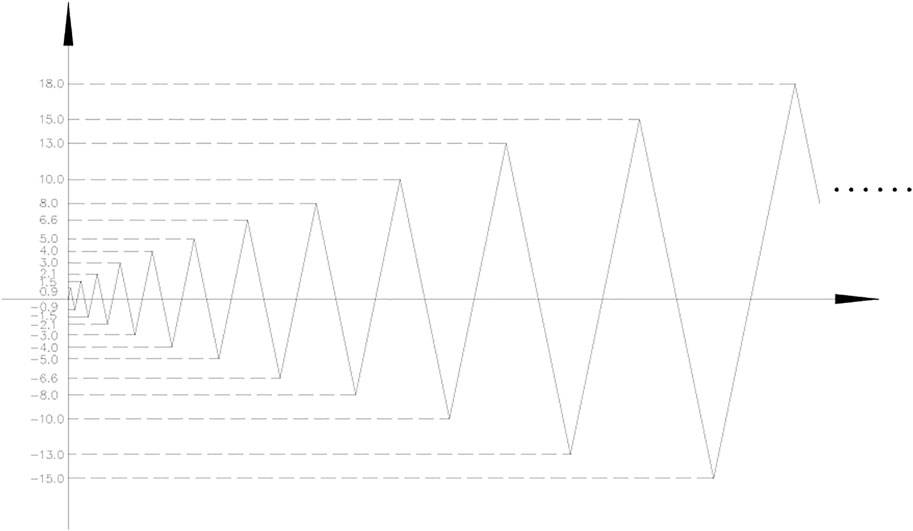
FIGURE 4. Loading protocol during displacement control.
Analysis of Test Results of Seismic Performance
Comparative Analysis of Hysteresis Curves and Characteristics
The load-displacement curves of test specimens obtained in quasi-static loading tests are referred to as hysteresis curves, and the closed graph formed by hysteresis curve is referred to as the hysteresis loop. The internal area of the hysteresis loop has an energy dimension, which can reflect the energy consumption caused by plastic deformation of the member under loading cycles. Under the maximum displacement of the same cycle, the fuller the hysteresis loop, the stronger the plastic deformation capacity of the member. The hysteresis curve of a test specimen can comprehensively reflect the seismic performance indexes, such as energy dissipation capacity, deformation capacity, and bearing capacity of the structure in linear and nonlinear stages. The hysteresis curves of SPRCW-1 to SPRCW-4 are shown in Figure 5.
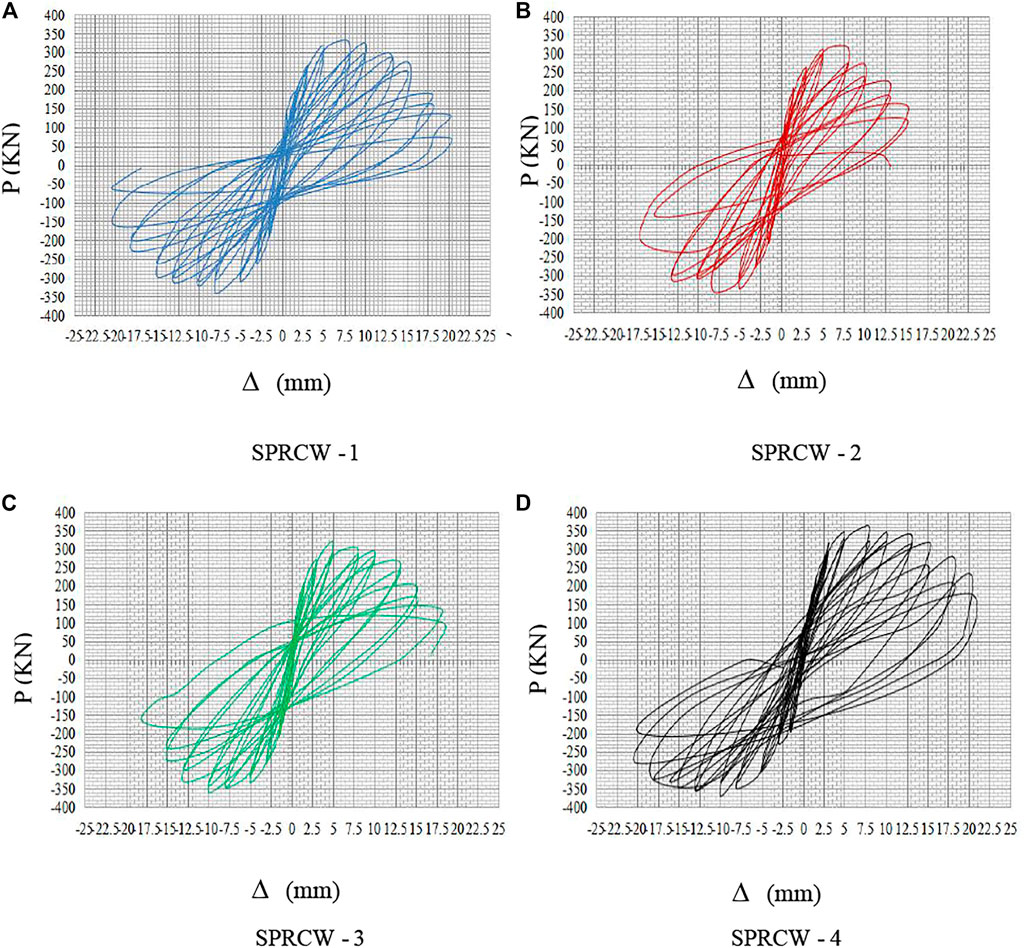
FIGURE 5. Hysteresis curves diagram of test specimens.
According to Figure 5, based on the comparison results, an observation can be made that SPRCW-1 to SPRCW-4 followed the same rule, described as follows:
1) From the beginning of loading to the cracking stage, the test specimens were in an elastic state. After loading and unloading, the specimens could basically return to the original state through displacement, and the hysteresis curve changed linearly.
2) From the beginning of the displacement loading cycle to the occurrence of wall yielding, the horizontal load of the four test specimens obviously increased with the increase of the horizontal displacement, and small residual deformation occurred during unloading. The envelope area of the hysteresis curve was small, indicating that plastic deformation existed but only accounted for a small proportion. The five test specimens were basically in the elastic stage.
3) At the initial stage of the hysteresis curve after yielding, the walls of the four test specimens all exhibited obvious oblique cracks, especially at the bottom of the walls. The four test specimens all produced large residual deformation, thereby causing the envelope area of the curves of the four test specimens to gradually increase after yielding. After yielding, no relative displacement occurred between the steel plates and the concrete of the four test specimens, indicating the test specimens had good energy dissipation capacity and plastic deformation capacity.
4) At the later stage of the yield stage, the bearing capacity of the test specimen increased slowly with the increase of horizontal displacement. At the same displacement loading stage, the bearing capacity of the second cycle was slightly smaller than that of the first cycle, and the phenomenon became increasingly obvious after the specimen yielded, indicating that the residual strain caused by structural damage after the specimen yielded became increasingly larger.
According to Figure 5, based on the comparison, an observation can be made that the hysteresis curves of SPRCW-1 to SPRCW-4 exhibited the following differences:
1) SPRCW-2 had a large shear failure, and shear-type inclined cracks developed too early. As such, the test specimen reached the strength yield point earlier than the desired state, and after reaching the maximum bearing capacity point, the strength and rigidity of the test specimen decreased obviously. Before and after the failure, the bearing capacity of the test specimen dropped sharply, exhibiting a brittle failure characteristic to a certain degree. By comparing the hysteresis curves of SPRCW-2 and SPRCW-3, an observation can be made that under the same steel ratio, the ultimate bearing capacity of SPRCW-3 increased by 6%, and the slope of the hysteresis curve decreased slowly. After reaching the ultimate bearing capacity, the stiffness of the test specimen degraded slowly, and the ductility and energy dissipation capacity were better than those of SPRCW-2, indicating that when the steel strip was placed on both sides of the walls, the bearing capacity and ductility of the walls would be improved.
2) At the beginning, the hysteresis loops of the four test specimens all opened in a curve shape. With the increase of displacement, the walls gradually inclined to the displacement axis after yielding, and the stiffness gradually deteriorated. According to the hysteresis curves of the four specimens, although the hysteresis curves of the four specimens were full, the degrees of stiffness degradation were different. By comparing SPRCW-1 to SPRCW-4, when the steel plate was placed on both sides of the walls, the hysteresis loop was fuller, the curve dropped slowly, the energy consumption was relatively good, and the stiffness degradation was slow. After yielding, the section steel shear walls gradually began to pinch, indicating that the reinforcement and section steel inside the walls began to slip.
3) By comparing the descending process of the hysteresis curve of four specimens, SPRCW-1 to SPRCW-4, an observation can be made that the higher the steel ratio, the slower the descending and the better the ductility, indicating that the ductility of the shear walls could be effectively improved by appropriately increasing the steel ratio.
Comparative Analysis of Backbone Curves
The backbone curves of the test specimens were formed by connecting the extreme points of the load in the various steps of forward and backward displacement loading in the test process to the envelope. Backbone curves refer to the track of the maximum peak of horizontal force during the test and are an important data model to study the non-linear performance of structural specimens, which reflects the characteristics of stress and deformation of specimens in different stages, including ductility, stiffness, strength, and other performance indicators. The backbone curves of SPRCW-1 to SPRCW-4 are shown in Figure 6.
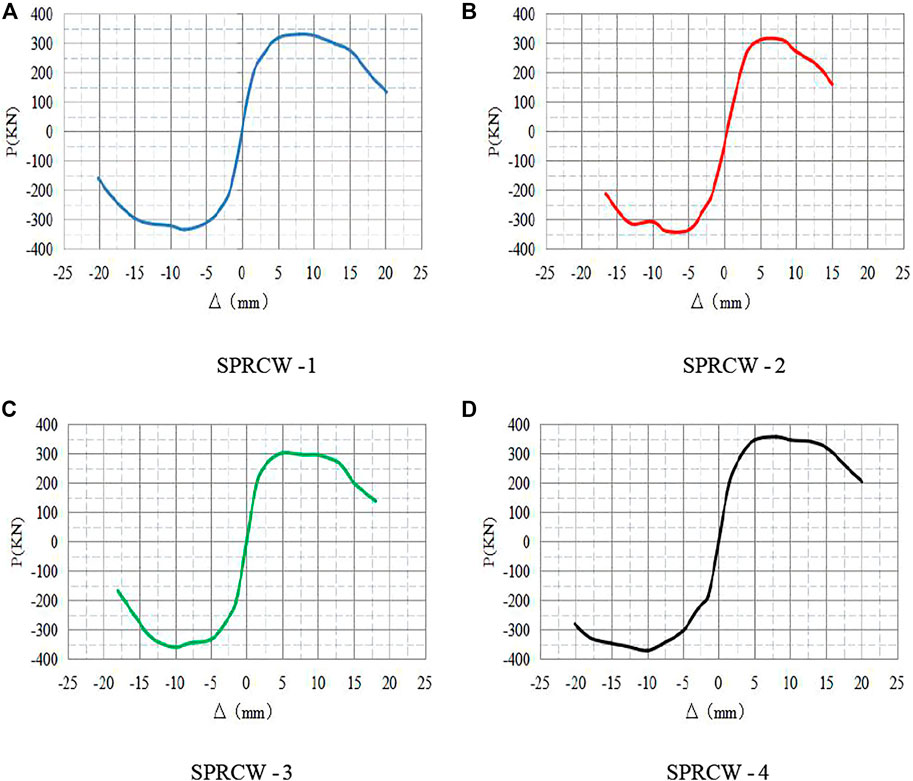
FIGURE 6. Backbone curves of the test specimens.
From the characteristic points of the backbone curves of the four test specimens, the descending section of the backbone curves of test specimen SPRCW-2 was steeper, and thus, the deformation capacity was weaker. For SPRCW-1, the inside steel plate of test specimen SPRCW-1 was placed on the same position, but the relative steel ratio was increased by 1.6%, and the descending section of backbone curves was relatively smooth, with good deformation capacity and ductility. Compared with SPRCW-3 and SPRCW-4, an observation can be made that after reaching the peak load point, the descending section of SPRCW-4 with higher relative steel ratio was almost horizontal for a long distance. During backward loading, the slope of the curve from failure to complete loss of bearing capacity was still slightly smaller than that of SPRCW-3, indicating that the test specimen with higher steel ratio not only had better deformation capacity and ductility, but also had better energy dissipation capacity after failure occurred. Compared with SPRCW-3 and SPRCW-4 with the same steel ratio but different steel plate positions, an observation can be made that although the performances of the two test specimens were better than those of the first two test specimens, the downward slope of the backbone curves of SPRCW-3 were larger and the downward trend was faster compared with SPRCW-4, indicating that the different positions of steel plates could effectively inhibit the premature failure of the test specimen, and could help to ensure the rigidity of the specimens, thereby improving the deformation ability and energy consumption ability thereof to a certain degree. When comparing and analyzing tests of SPRCW-2 and SPRCW-3, the aforementioned characteristics were also present, confirming the aforementioned experimental conclusion to some extent. The results of comparative analysis of the five specimens reveal that when the load peak point was reached, the displacement of the five specimens was basically the same, but the bearing capacity was obviously different. The peak loads were as follows: SPRCW-4 > SPRCW-1 > SPRCW-3 > SPRCW-2. Comparing SPRCW-1 with SPRCW-2, and SPRCW-3 with SPRCW-4, respectively, an observation can be directly made from the backbone curves that the higher the steel ratio, the higher the bearing capacity of the test specimens. Comparing SPRCW-1 to SPRCW-4, an observation can be directly made from the backbone curves that the steel plates were located at different positions. When the steel plates were closer to both sides of the walls, the greater the rigidity of the test specimen and the higher the bearing capacity. To summarize, an observation can be directly made from the backbone curves that the seismic performance of the composite shear walls could be effectively improved when the steel ratio was larger.
Strain Analysis of Steel Plates
Stress Distribution Law of Steel Plates in the Walls
In order to compare and analyze the different strain laws of steel strip in composite shear walls during loading, the reduced stress of measurement points under various displacement cycles of steel plate was obtained by arranging triaxial 45°strain rosette (shown in Figure 7) at the lower part of steel strip in the walls, to allow for the functions of steel strips at different positions and steel strips with different steel ratios in mid-rise and high-rise shear walls to be further elucidated.
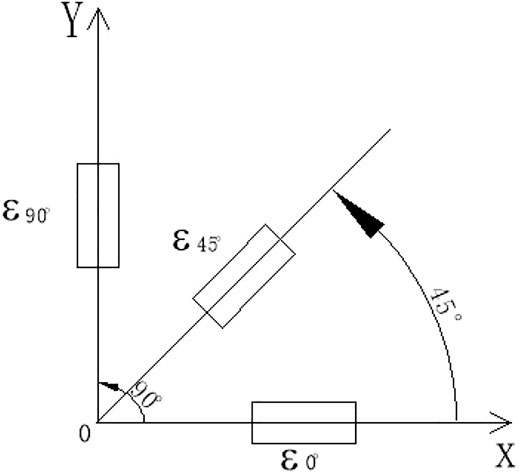
FIGURE 7. Triaxial 45° strain rosette.
The principal stress of the steel strip could be calculated by Equation 1:
In the calculation, the assumption is that there is no displacement parallel to the neutral surface at each point in the plane of the plate, and the stress of each point in the steel plate along the thickness direction is zero, that is,
where
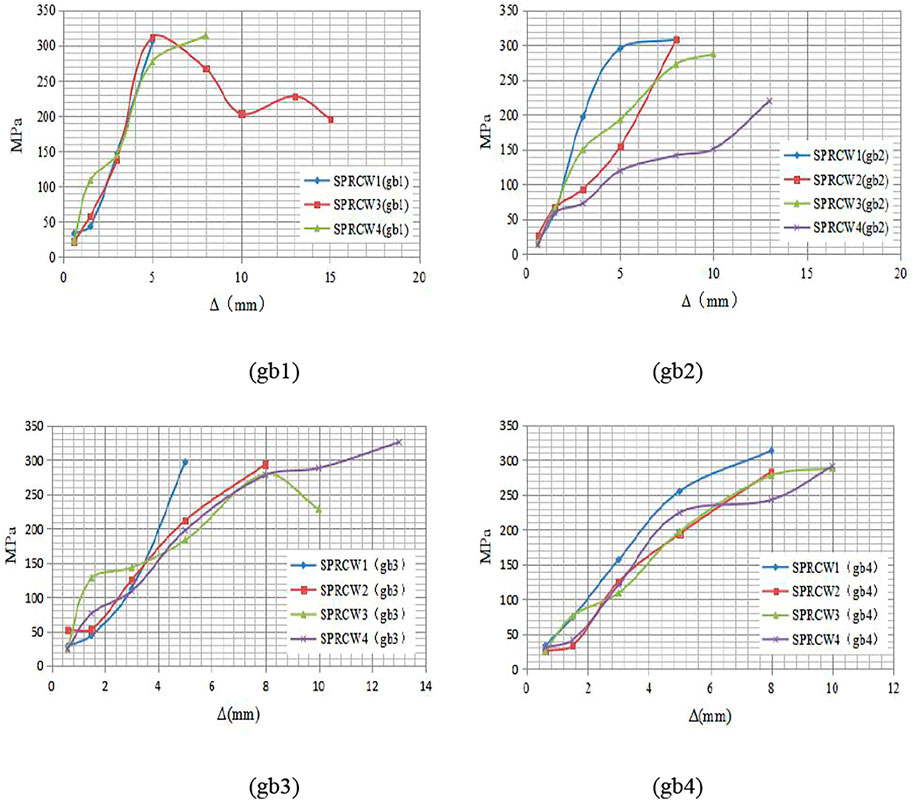
FIGURE 8. Comparative analysis diagram of reduced stress of steel plates of SPRCW-1 to SPRCW-4.
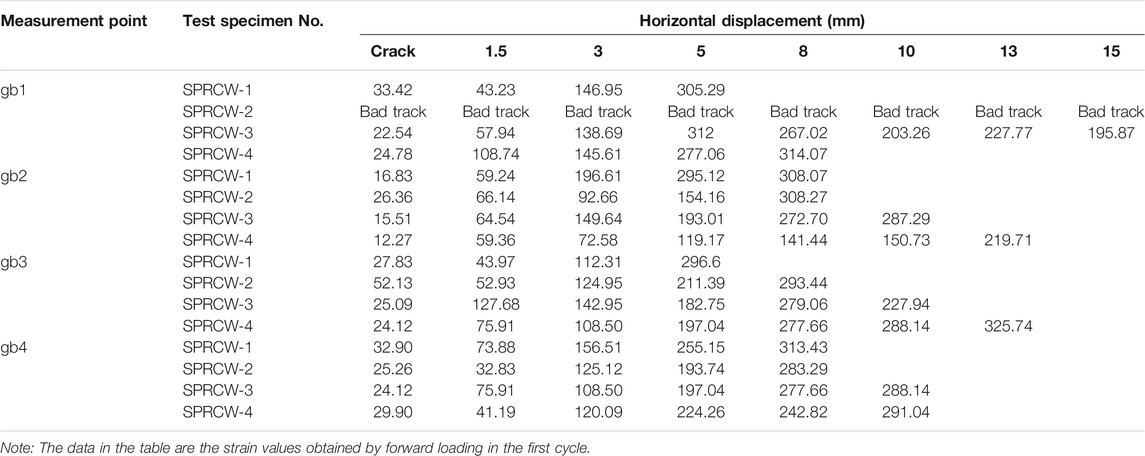
TABLE 4. Reduced stress on tensile side of steel plate.
The shear modulus of steel strips could be calculated by Equation 3:
In the calculation, if each point in the plane of the plate had no displacement parallel to the neutral surface, that is, assuming that each point in the steel plate had zero deformation along the thickness direction, then:
The in-plane shear deformation could be calculated as follows:
Therefore, the shear stress could be denoted as follows:
where Poisson’s ratio
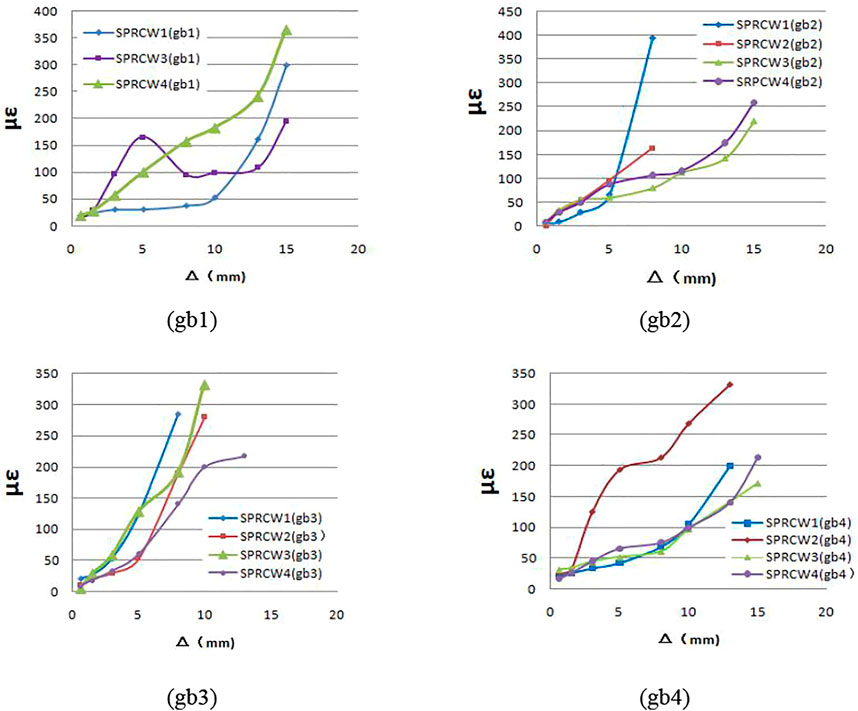
FIGURE 9. Comparative analysis diagram of shear stress of steel plates of SPRCW-1 to SPRCW-4.
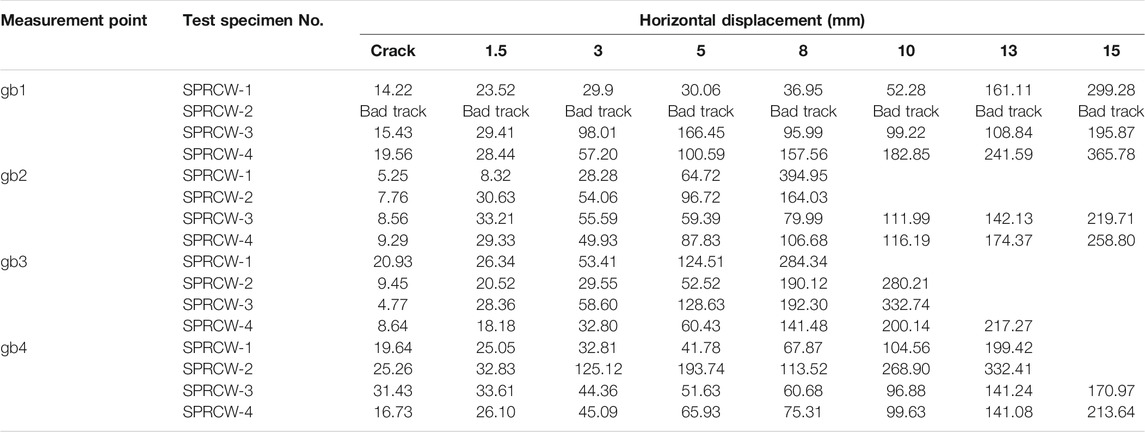
TABLE 5. Shear stress on tensile side of steel plate.
From Figures 8 and 9 and Tables 4 and 5, the following observations can be made:
1) With the increase of horizontal load, the strain in the three directions of the strain rosette in the steel strip would increase correspondingly, resulting in a corresponding increase in the reduced stress and shear stress. Before the walls cracked, the steel plate and the concrete would jointly bear the tensile and compressive stress and shear stress. When the strain rosette was located at the position where the main tensile stress reached the tensile strength of the concrete, the concrete would crack rapidly, the tensile concrete at the crack would fail, and the stress would drop to zero. At this time, the tensile and compressive stress and shear stress on the walls would suddenly increase, which would lead to the sudden increase of the reduced stress and shear stress that can be seen in Tables 4 and 5. However, because of bonding stress, cracks would close during unloading, leading to a drop in strain gauge data after reloading, thereby causing a short-term drop in reduced stress and shear stress of some steel observation points after the sudden increase.
2) With the continuous increase of horizontal displacement, by comparing two groups of test specimens, SPRCW-1 and SPRCW-4, SPRCW-2 and SPRCW-3, an observation can be made from the four identical measurement points that the displacement of steel plate with the sudden increase of reduced stress and shear stress of specimens SPRCW-3 and SPRCW-4 on both sides of the walls body occurred later, indicating that the arrangement of steel plate on both sides of the walls could effectively limit the development of cracks.
3) Comparing the four identical measurement points of two groups of test specimens, SPRCW-1 and SPRCW-2, and SPRCW-3 and SPRCW-4, respectively, an observation can be made that the shear stress of the two test specimens SPRCW-2 and SPRCW-3 with lower steel ratio was smaller in the early stage, and the yield increased rapidly in the later stage. At the same time, the shear stress of the test specimens SPRCW-1 and SPRCW-4 with higher steel ratio exhibited a gradual increased trend with the increase of displacement. Thus, when the steel ratio was small, the shear strength of the steel plate in the composite shear walls could not be fully exerted, the rigidity of the walls degraded rapidly, and the energy dissipation capacity was relatively poor.
4) Comparing the four same measurement points of SPRCW-1 and SPRCW-4, and SPRCW-2 and SPRCW-3, respectively, an observation can be made that when the positions of steel plates in the walls were different, based on the reduced stress and shear stress curves converted from the strain rosettes at the same measurement point, the stress growth rates were different when the steel plates were placed in different positions of the walls. When placed on both sides of the walls, the curve was relatively smooth, and thus, different steel plate positions could be found to have a certain influence on the energy dissipation capacity and stiffness degradation of the walls.
Comparative Analysis of Cold-Formed Steel Strain in SPRCW-1 to SPRCW-4 Concealed Column
Under the conditions of different steel ratios and different steel strip arrangement positions, SPRCW-1 to SPRCW-4 were equipped with cold-formed thin-walled steel with the same form and steel ratio. To compare the hysteresis curves of section steel strain before the strain gauge was damaged, four representative measurement points, xg2, xg3, xg7,s and xg8, which were located at the same position of four composite shear walls test specimens from SPRCW-1 to SPRCW-4, were taken. The detailed strain values of each measurement point in each stage are shown in Figures 10–13.
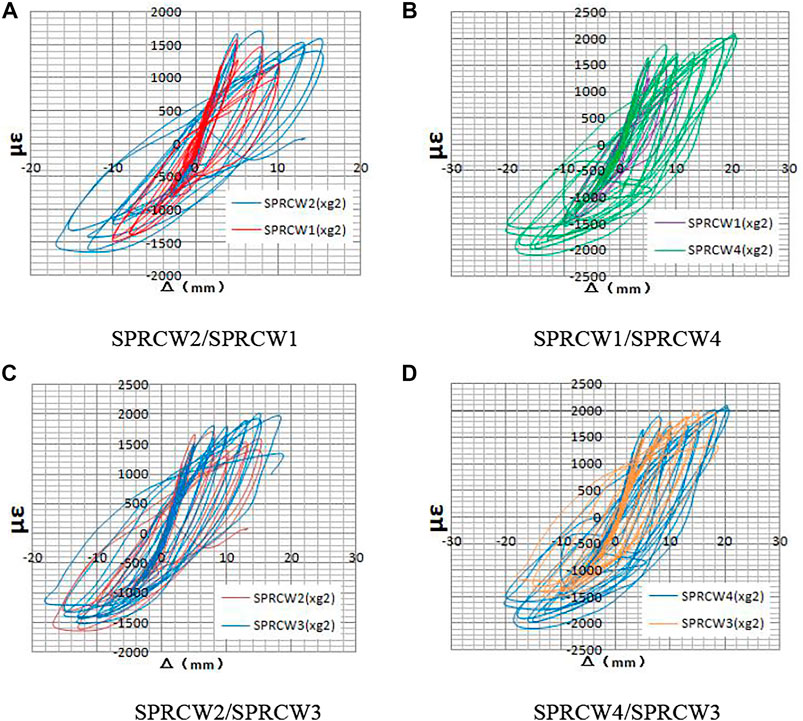
FIGURE 10. Strain comparison diagram of cold-formed steel on xg2.
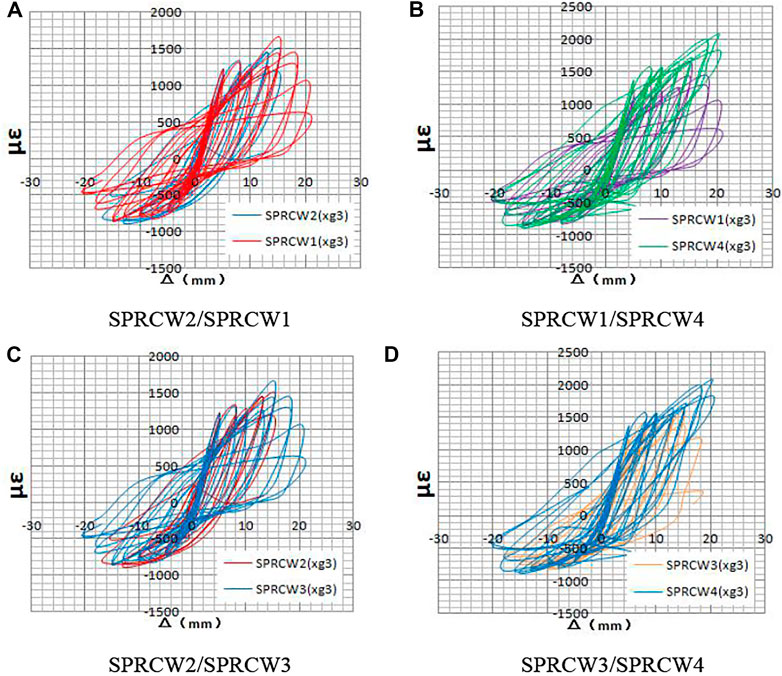
FIGURE 11. Strain comparison diagram of cold-formed steel on xg3.
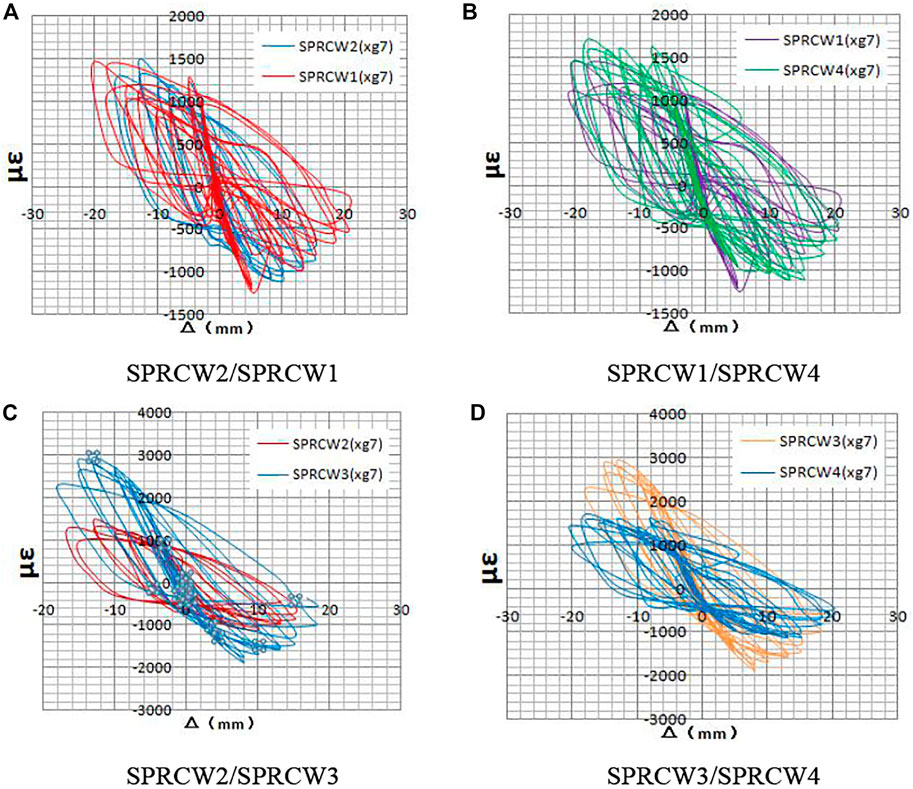
FIGURE 12. Strain comparison diagram of cold-formed steel on xg7.
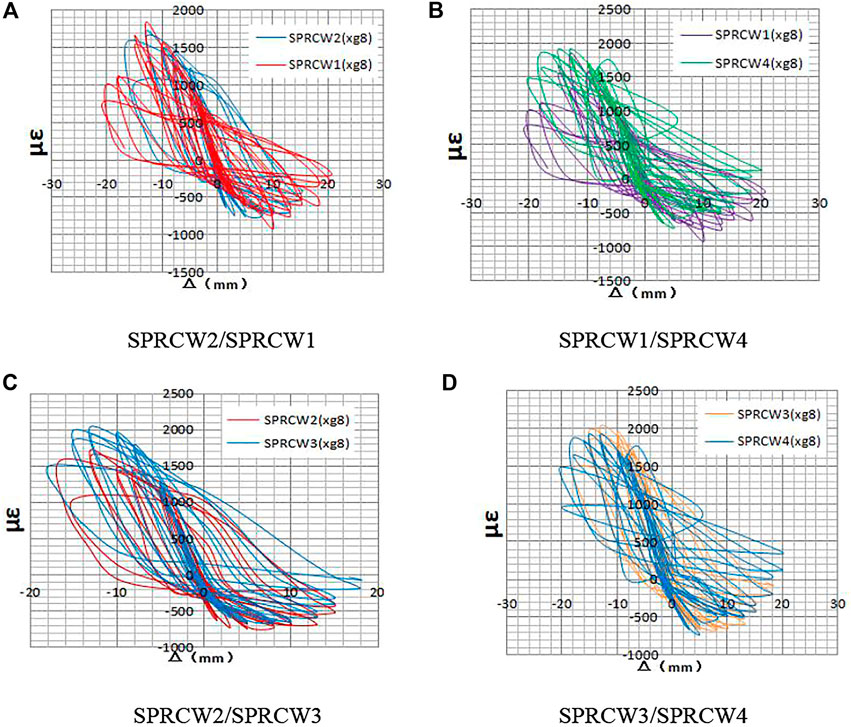
FIGURE 13. Strain comparison diagram of cold-formed steel on xg8.
The strain hysteresis curves in Figures 10–13 are the strain-displacement curves of four measurement points of section steel in the embedded column before the strain gauge was damaged due to cracks in the walls. An observation can be made from said figures that the overall trend of the section steel strain was basically the same, and the strain value at the measurement point increased continuously to the peak value and then gradually fell back with the increase of displacement. Before the strain gauge was damaged, the extreme strain values of the section steel in SPRCW-1 and SPRCW-4 embedded columns were greater than those of SPRCW-2 and SPRCW-3, indicating that the bending bearing capacities of the section steel in SPRCW-1 and SPRCW-4 embedded columns were fully utilized, and the bending and shearing resistances of the walls could be simultaneously improved when the steel ratio in the walls was high, thereby ensuring the balanced development of the bending deformation and shearing deformation of the walls during the whole loading process. The full utilization of the strength of the section steel material in the embedded column also reveals that the walls had higher bearing capacity and strong bending resistance, and the test specimen had better ductility.
Compared with SPRCW-1 and SPRCW-2, the time taken to reach the strain extreme values for SPRCW-4 and SPRCW-3 was longer. The four different measurement points all reflect such phenomenon to varying degrees, revealing that when the steel strip in the walls was placed on both sides with the same steel ratio, the flexural rigidity of the composite shear walls slowly diminished, and the shear deformation composition was smaller. Moreover, when the steel strip in the walls was located on both sides, the ductility of the composite shear walls would be effectively improved.
Strain Analysis of Reinforcement
Strain Analysis of Horizontally Arranged Reinforcement
The layout of horizontally arranged reinforcement in SPRCW-1 to SPRCW-4 walls was the same. Representative measurement points with the same positions were, respectively, selected for comparative analysis. See Figure 14 and Table 6 for detailed strain values of each measurement point in each stage.
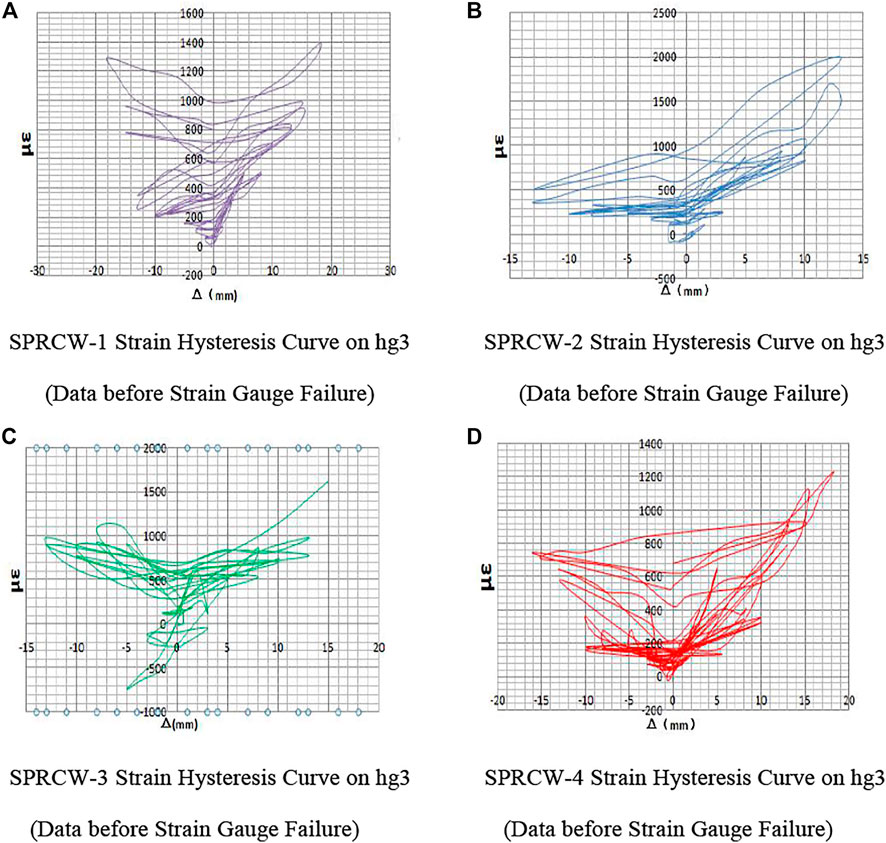
FIGURE 14. Strain comparison diagram on hg3.
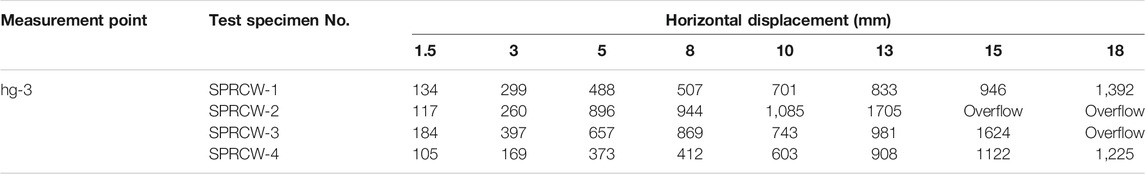
TABLE 6. Strain statistics on measurement points of horizontally arranged reinforcement.
From Figure 14 and Table 6, the following observations can be made.
By comparing and analyzing the hysteresis curves of horizontally arranged reinforcement in the middle and lower part of the walls, when △ = 3 mm, the strain of horizontally arranged reinforcement of SPRCW-2 was found to increase sharply after the walls yielded, and the horizontally arranged reinforcement yielded before △ = 15 mm. However, the other three test specimens were close to yielding only after △ = 15 and 18 mm, respectively. As such, an assumption could be made that with the increase of the steel ratio of the walls, the stress of the horizontally arranged reinforcement in the walls could be effectively increased, and the yield of the horizontally arranged reinforcement could be delayed. The effect of changing the position of the steel plate in the walls was not as obvious as that of increasing the steel ratio.
Strain Analysis of Vertically Arranged Reinforcement in Embedded Columns in the Walls
The bending resistance of shear walls was affected by the vertically arranged steel reinforcement in the embedded columns on both sides of the walls. Representative measurement points of vertically arranged steel reinforcement in the embedded columns were selected. See Figures 15–17 and Table 7 for the strain values of each measurement point in each stage.
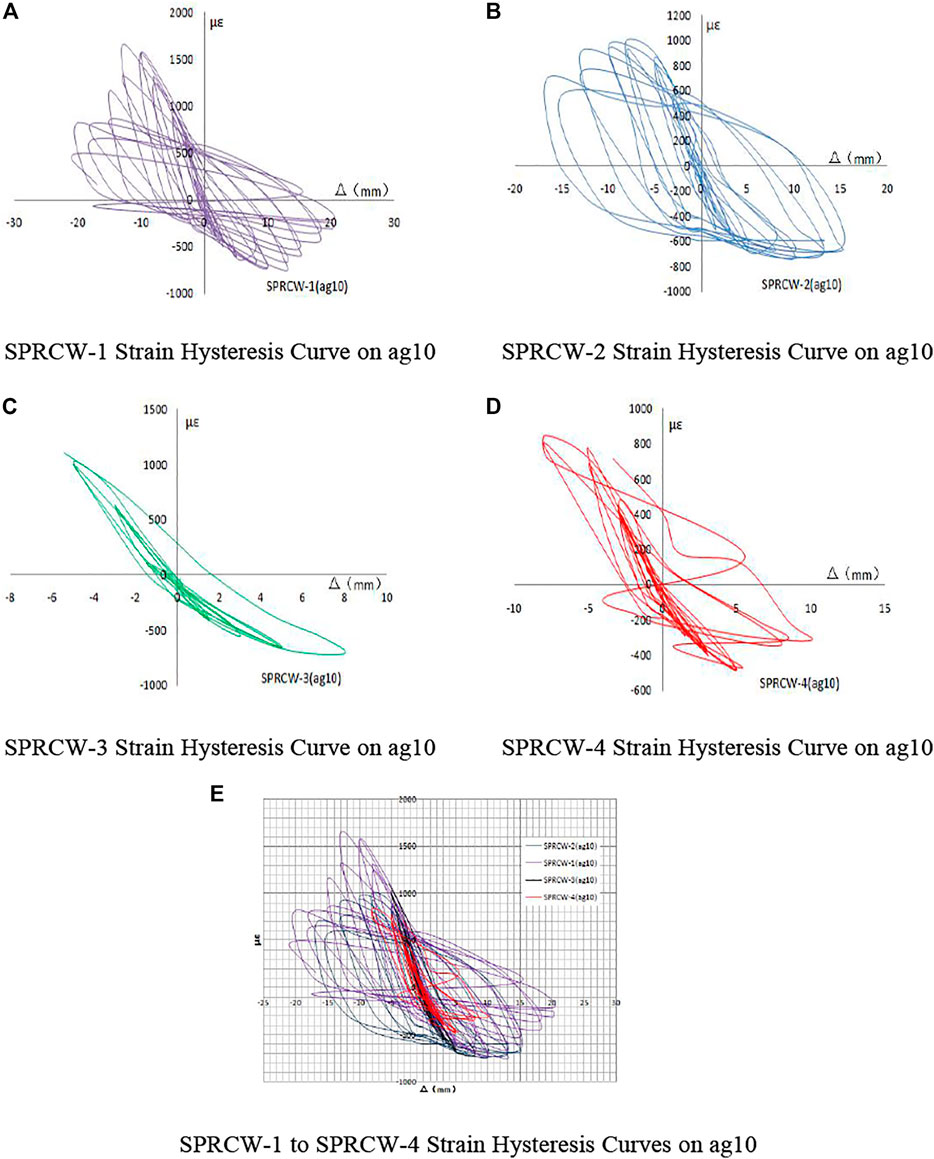
FIGURE 15. Strain comparison diagram on ag10.
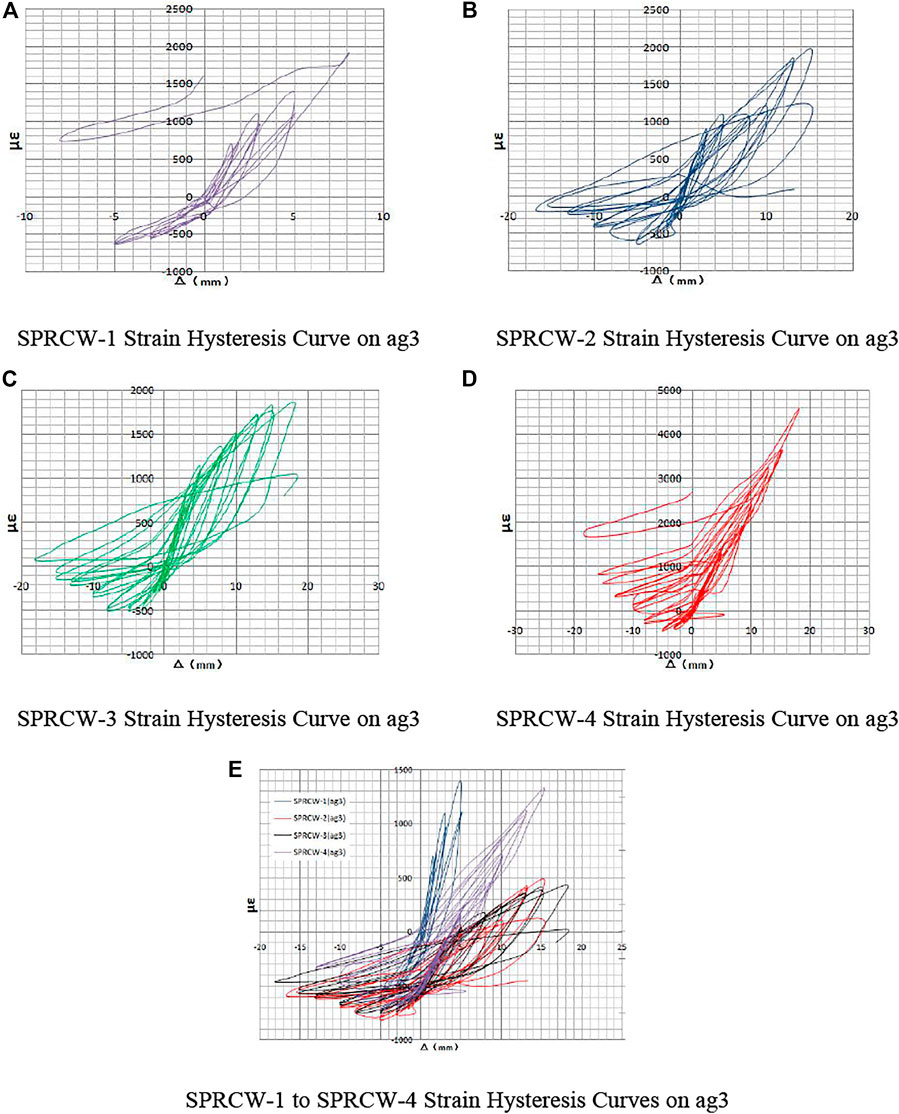
FIGURE 16. Strain comparison diagram on ag3.
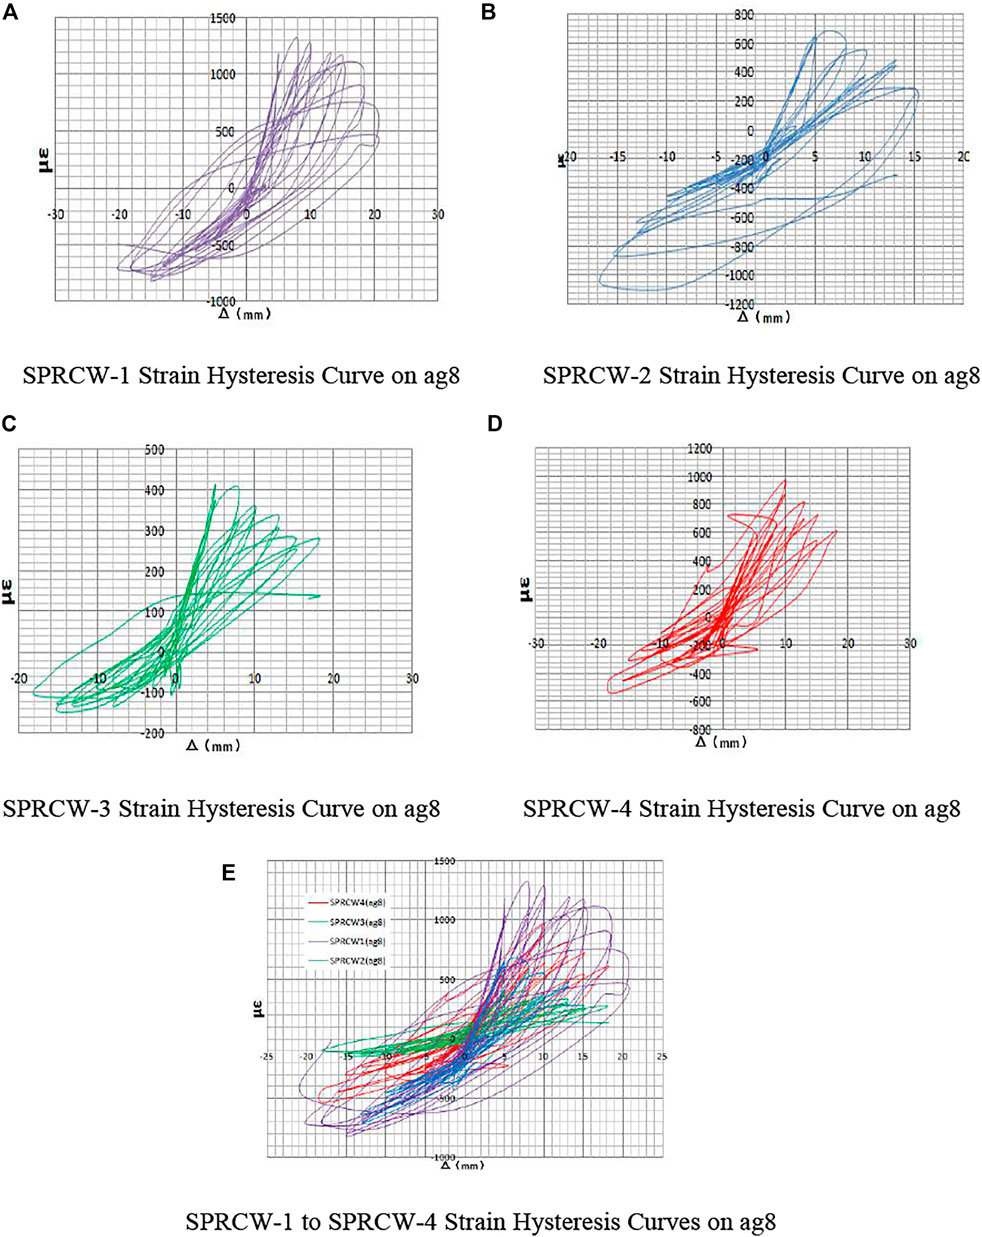
FIGURE 17. Strain comparison diagram on ag8.
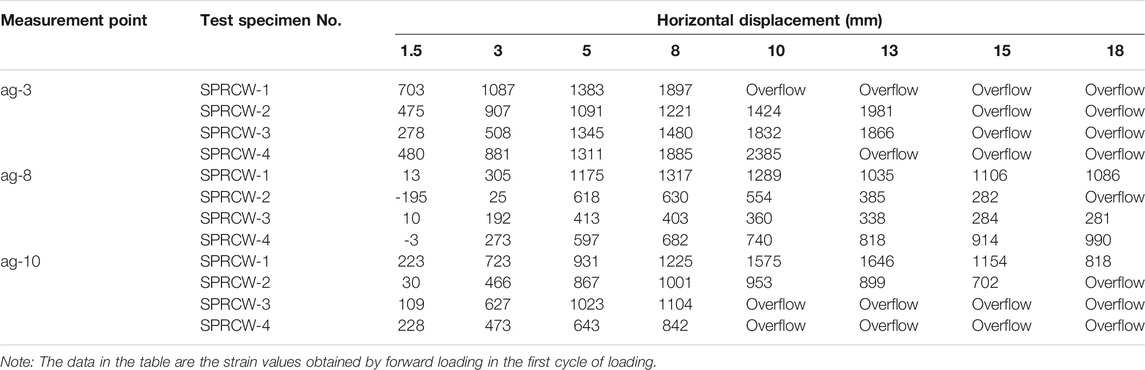
TABLE 7. Strain statistics on measurement points of vertically arranged reinforcement in embedded columns in the walls at different stages.
The strain hysteresis curves in Figures 15–17 are the strain-displacement relation curves of the three measurement points of the longitudinally arranged reinforcement in the embedded column before the strain gauge was damaged due to cracks in the walls. From Figures 15–17 and Table 7, an observation can be made that the strain values of the five test specimens of composite shear walls were different at all steps of the displacement loading stage, but the overall strain trend of longitudinally arranged reinforcement in the embedded column was basically the same. With the increase of displacement, the strain value at the measurement point continuously increased to the peak value and then gradually decreased. Before the strain gauge was damaged, the extreme strain values of vertically arranged reinforcement of SPRCW-1 and SPRCW-4 were greater than those of SPRCW-2 and SPRCW-3, indicating that the bending bearing capacities of vertically arranged reinforcement of SPRCW-1 and SPRCW-4 had been fully utilized. When the steel ratio in the walls was high, the bending and shearing resistance of the walls could be simultaneously improved, thereby ensuring the balanced development of the bending deformation and shearing deformation of the walls in the whole loading process. The full utilization of the vertically arranged reinforcement strength also indicates that the walls had higher bearing capacity, strong bending resistance, and the test specimen had better ductility.
When the vertically arranged reinforcement reached the same strain extreme value, compared with SPRCW-1 and SPRCW-2, SPRCW-4 and SPRCW-3 took a longer time. Such findings were more obvious at the ag3 measurement point, indicating that when the steel strip in the walls was placed on both sides with the same steel ratio, the flexural rigidity of the composite shear walls slowly diminished, and the shear deformation composition became smaller. Moreover, when the steel strip in the walls was located on both sides, the ductility of the composite shear walls would be effectively improved.
Comparative Analysis of Specimen Deformation Capacity
Deformation capacity is an important index for measuring the superiority of seismic performance of members. The ductility coefficient was used to quantitatively evaluate the deformation capacity of the members in the occurrence of an earthquake. When the structure or member had large ductility, the structure or member would consume sufficient energy due to plastic deformation, such that the structural bearing capacity would not be reduced rapidly under the condition of certain deformation of the member. As such, the design goal of being repairable after a medium earthquake and not collapsing after a large earthquake was achieved.
A visual comparison of the yield displacement of the four specimens is shown in Table 8. A conclusion can be drawn that the yield displacement relationship of the four specimens was as follows: SPRCW-4 > SPRCW-1, SPRCW-2 > SPRCW-3. The comparison of SPRCW-1 with SPRCW-2 and SPRCW-3 with SPRCW-4 reveals that the yield displacement of specimens with high steel ratio increased slightly but had little effect. Compared with SPRCW-4 and SPRCW-1, for SPRCW-4 and SPRCW-2, the yield displacement increased by 11.05 and 28.26%, respectively, indicating that different positions of steel plates could have a relatively obvious impact on the yield displacement, which is the same as the comparison law of yield load of the four specimens. Comparing the test results of SPRCW-3 and SPRCW-2, the yield displacement of SPRCW-3 was 9.43% higher than that of SPRCW-2, thereby verifying the aforementioned conclusion. However, when the steel ratio was relatively large, the effect of adjusting the position of wall steel plate was more obvious in improving the yield displacement.
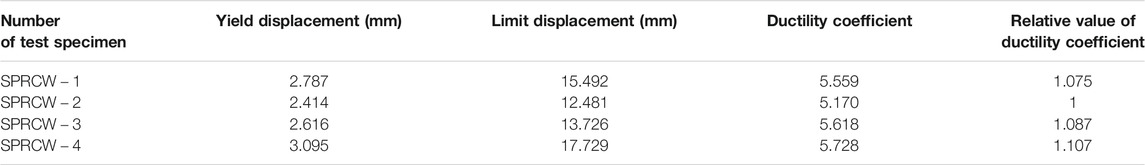
TABLE 8. Ductility coefficient of the specimens.
The limit displacements of the four specimens are shown in Table 8. An observation can be made that the magnitude relationship was as follows: SPRCW-4 >SPRCW-1 >SPRCW-3 > SPRCW-2. Compared with SPRCW-1 and SPRCW-2, for SPRCW-3 and SPRCW-4, the limit displacements of the two groups of specimens increased by 24.12 and 29.16%, respectively, indicating that the extreme yield displacement of the specimens with higher steel ratio was significantly improved. Compared with SPRCW-4 and SPRCW-1, for SPRCW-4 and SPRCW-2, the limit displacement increased by 14.44 and 6.37%, respectively, indicating that different positions of steel plates could have a relatively obvious impact on the limit displacement, which is the same as the comparison law of the limit load of the four specimens.
The comparison of ductility coefficient between four specimens and ordinary high-strength concrete shear wall is shown in Table 8 and the following observations can be made: 1) compared with ordinary high-strength concrete shear wall, the ductility coefficients of SPRCW-1 ∼ 4 were increased by 78.17, 65.71, 77.22, and 83.59%, respectively, indicating that the ductility of specimens could be significantly improved by adding cold-formed steel diagonal bracing or setting steel plate strip in the wall body; 2) the ductility coefficient of SPRCW-1 relative to SPRCW-4 was reduced by 3.04%, and that of SPRCW-2 relative to SPRCW-3 was reduced by 8.67%, indicating that changing the position of the steel plate strip in the wall body could improve the ductility effect of the shear wall; and 3) the ductility coefficient of SPRCW-2 relative to SPRCW-1 was reduced by 7.52%, and that of SPRCW-3 relative to SPRCW-4 was reduced by 1.96%, indicating that changing the position of the steel plate strip in the wall could improve the ductility of the shear wall.
Comparative Analysis of Energy Consumption Capacity
The following observations can be made from the comparison between Tables 9 and 10:
1) The overall trend of the equivalent viscous damping coefficients of SPRCW-1-4 increased with the increase of displacement, which could be attributed to the increase of displacement increasing the energy consumption, such that the equivalent viscous damping coefficient would increase accordingly. The equivalent viscous damping coefficient increases with the increase of specimen cracking, crack development, yield of built-in section steel and steel plate, reinforcement, later plastic deformation of wall body, and aggregate bite dislocation between concrete cracks.
2) In the two groups of comparison specimens, SPRCW-1 and SPRCW-4, and SPRCW-2 and SPRCW-3, the relative value of equivalent viscosity coefficient of SPRCW-2 in each displacement cycle stage from yield displacement to ultimate displacement was greater than SPRCW-3. The relative value of equivalent viscosity coefficient of SPRCW-1 was found also to be larger than that of SPRCW-4 under the same displacement controlled loading from yield displacement to ultimate displacement. Such findings reveal that under the same displacement control loading, when the steel plate in the wall was placed in the middle of the wall, the pinch of the specimen could be more effectively prevented, and the energy dissipation capacity of the structural wall could be improved.
3) In the comparison specimens of SPRCW-1, SPRCW-2, SPRCW-3, and SPRCW-4, the relative value of the equivalent viscosity coefficient of SPRCW-2 in each displacement cycle stage was close to SPRCW-1 at the initial stage of the yield displacement to the ultimate displacement stage. SPRCW-3 was found to also be close to the relative value of equivalent viscosity coefficient of SPRCW-4 at the initial stage from yield displacement to ultimate displacement. In the later stage from yield displacement to ultimate displacement, the specimens with higher steel ratio in both groups had slightly lower equivalent viscous damping coefficients of SPRCW-1 and SPRCW-4, indicating that in the later stage from yield displacement to ultimate displacement, a slight pinch phenomenon would occur in the composite shear wall when the steel ratio of steel plate in the wall body was high, which is consistent with the hysteretic curves of SPRCW-1 and SPRCW-4.

TABLE 9. Relative energy dissipation coefficient.
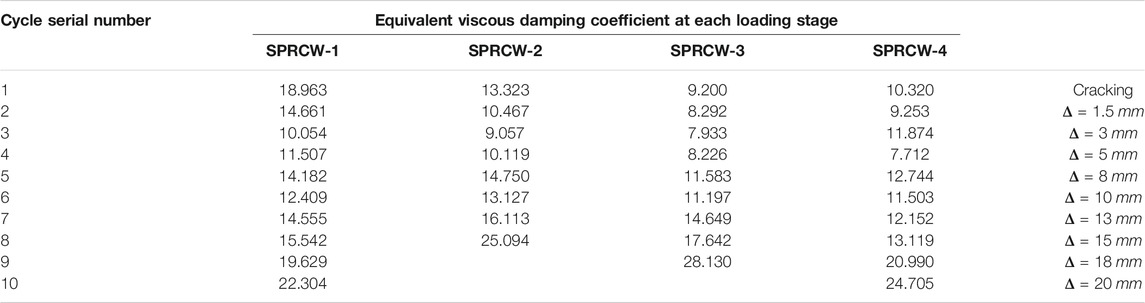
TABLE 10. Equivalent viscous damping coefficient.
Comparative Analysis of Strength Attenuation Law
During the loading process, the bearing capacity of members would be reduced due to deformation and damage. In the study of structural earthquake resistance, the structural strength is generally measured by the strength attenuation coefficient. The strength attenuation coefficient of the present test was calculated using the following formula:
where P1 is the extreme value of horizontal bearing capacity in the first cycle during each displacement cycle, and P2 is the extreme value of horizontal bearing capacity in the second cycle during each displacement cycle.
Figure 18 shows the strength attenuation curves of five specimens of composite shear wall and section steel shear wall under different parameters, which can be seen as follows:
1) Before the SPRCW-1-4 strength attenuation coefficient reached the limit displacement β, a crack developed, and the steel plate in the wall body began to directly participate in resisting part of the external force, such that the bearing capacity of the specimen was slightly improved before reaching the ultimate bearing capacity. An observation can be made from the SPRCW-1-4 test phenomenon that the steel plate had a certain inhibitory effect on the development of wall cracks and through inclined cracks, which could effectively reduce the damage of the test piece, to improve the ability of the test piece to resist external effects to varying degrees. The built-in steel strip could effectively maintain the bearing capacity of the wall. When the bearing capacity of the specimen decreased to about 85% of the ultimate bearing capacity thereof, the value would drop rapidly, and the specimen would become damaged.
2) The strength attenuation coefficient curve of SPRCW-2 decreased the earliest and the fastest. Although the strength attenuation coefficient curve of SPRCW-3 decreased earlier, the decrease was slower compared with SPRCW-2. The attenuation rates of SPRCW-3 and SPRCW-4 were the same. After exceeding the limit displacement, SPRCW-4 decreased more slowly, indicating that when the steel ratio of the built-in steel plate belt in the wall was high, the built-in steel plate belt could delay the degradation of structural strength.
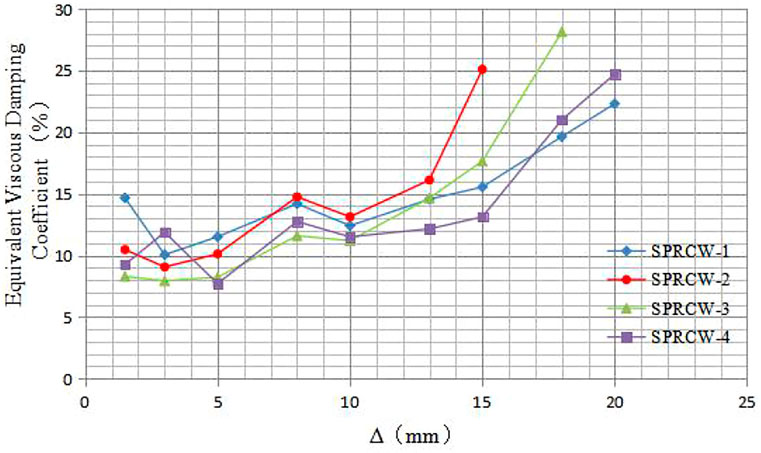
FIGURE 18. Strength attenuation curves.
Conclusion
According to the performance of the four test specimens of composite shear walls under quasi-static loading, the seismic performance indexes of the four test specimens were calculated, analyzed, and compared in the present paper. The following conclusions were drawn:
1) By comparing the hysteresis curves and backbone curves of the four specimens, placing steel strips and angle steel embedded supports in the walls was found to be able to improve the bearing capacity of the shear walls to a certain extent. By comparing the hysteresis curves of SPRCW-2 and SPRCW-3, under the same steel ratio, the ultimate bearing capacity of SPRCW-3 was found to increase by 6%, and the slope of hysteresis curve was found to decrease slowly. The effect was more obvious when the steel ratio of the internal steel plate in the walls was higher, and angle steel embedded support could improve the bearing capacity of the walls most obviously.
2) Before the strain gauge was damaged, the extreme strain values of the section steel in SPRCW-1 and SPRCW-4 embedded columns were greater than those of SPRCW-2 and SPRCW-3, indicating that the bending bearing capacity of the section steel in SPRCW-1 and SPRCW-4 embedded columns was fully utilized, and the bending and shearing resistance of the walls could be simultaneously improved when the steel ratio in the walls was high, thereby ensuring the balanced development of the bending deformation and shearing deformation of the walls during the whole loading process.
3) Comparing the strain analysis results of the steel plate, the section steel, and the reinforcement of the four test specimens of composite shear walls, a conclusion could be drawn that the reasonable position of steel plate with a certain steel ratio and steel plate in the walls could effectively inhibit the shear deformation of the results, make the walls have strong shear rigidity, and ensure that the bending bearing capacity of vertically arranged reinforcement in the walls was fully utilized, thereby ensuring the structure had better ductility and energy dissipation capacity. Compared with SPRCW-1 and SPRCW-2, SPRCW-4 and SPRCW-3 took a longer time, indicating that when the steel strip in the walls was placed on both sides with the same steel ratio, the flexural rigidity of the composite shear walls slowly diminished, and the shear deformation composition became smaller.
4) Comparing the strength attenuation law of four specimens, the built-in steel plate and angle steel concealed support was found to be able to delay the attenuation speed of the structural bearing capacity, to improve the seismic performance of the structure. The location of the adjusting steel plate had little effect on slowing the decay rate of the structural bearing capacity, while increasing the rate of steel distribution could effectively slow down the decay rate of the structural bearing capacity to a certain extent. However, the effect was not as obvious as that of the steel shear wall with a concealed bracing angle.
Data Availability Statement
The original contributions presented in the study are included in the article/Supplementary Material. Further inquiries can be directed to the corresponding author.
Author Contributions
YY analyzed the experiments and wrote the manuscript. MG, YY, and HZ revised the manuscript.
Funding
This study was supported by the National Natural Science Foundation of China (Grant No. 41372356), we gratefully acknowledge this support.
Conflict of Interest
The authors declare that the research was conducted in the absence of any commercial or financial relationships that could be construed as a potential conflict of interest.
Publisher’s Note
All claims expressed in this article are solely those of the authors and do not necessarily represent those of their affiliated organizations, or those of the publisher, the editors, and the reviewers. Any product that may be evaluated in this article, or claim that may be made by its manufacturer, is not guaranteed or endorsed by the publisher.
References
Ayazi, A., and Shafaei, S. (2019). Steel-concrete Composite Shear walls Using Precast High Performance Fiber Reinforced concrete Panels. Struct. Des. Tall Spec. Build 28, 10e1617. doi:10.1002/tal.1617
Bahrami, A., and Yavari, M. (2019). Performance of Steel-concrete Shear walls with Two Sided Reinforced concrete. Int. J. Eng. Technol. innovation 9, 228–239.
Blandon, C. A., Arteta, C. A., Bonett, R. L., Carrillo, J., Beyer, K., and Almeida, J. P. (2018). Response of Thin Lightly-Reinforced concrete walls under Cyclic Loading. Eng. structures 176, 175–187. doi:10.1016/j.engstruct.2018.08.089
Ebadi, P., and Farajloomanesh, S. (2020). Seismic Design Philosophy of Special Steel Plate Shear walls. Mag. civil Eng. 95, 3–18. doi:10.18720/MCE.95.1
Edin, H. M. S., Ashour, A., and Galal, K. (2019). Seismic Performance Parameters of Fully Grouted Reinforced Masonry Squat Shear walls. Eng. structures 187, 518–527. doi:10.1016/j.engstruct.2019.02.06
Farzampour, A., Laman, J. A., and Mofid, M. (2015). Behavior Prediction of Corrugated Steel Plate Shear walls with Openings. J. constructional steel Res. 114, 258–268. doi:10.1016/j.jcsr.2015.07.018
GB/T 228 (2010). Technical Specification for Tensile Test of Metal Materials at Room Temperature. Beijing: China standard press.
JGJ 101 (2015). Technical Specification for Seismic Tests of Buildings. Beijing: China standard press.
Jiang, H., Li, S., and He, L. (2019). Experimental Study on a New Damper Using Combinations of Viscoelastic Material and Low-Yield-Point Steel Plates. Front. Mater. 6, 100. doi:10.3389/fmats.2019.00100
Jiang, H., Qiu, H., Sun, J., and Yang, Y. (2019). Behavior of Steel-concrete Composite Bolted Connector in Precast Reinforced concrete Shear wall. Adv. Struct. Eng. 22, 2572–2582. doi:10.1177/1369433219846957
Kassem, W., and Elsheikh, A. (2010). Estimation of Shear Strength of Structural Shear walls. J. Struct. Eng. 136, 1215–1224. doi:10.1061/(ASCE)ST.1943-541X.0000218
Labibzadeh, M., and Hamidi, R. (2019). A Design Formula for Lateral Load Resistance of concrete Filled Double-Steel-Plate walls with Small Height-To-Length Ratio. KSCE J. Civ Eng. 23, 3493–3508. doi:10.1007/s12205-019-1588-7
Lee, K.-J., Hwang, K.-M., Hahm, K.-W., and Yi, S.-T. (2018). Shear Strength of Joints between Reinforced concrete Slabs and Steel-Plate-concrete walls. Proc. Inst. civil Eng. - structures buildings 171, 739–754. doi:10.1680/jstbu.16.00138
Lim, W.-Y., Kang, T. H.-K., and Hong, S.-G. (2018). Effect of Reinforcement Details on Seismic Behavior of Precast Concrete Wall-Steel Coupling Beam Systems. ACI Struct. J. 115, 1751–1763. doi:10.14359/51702414
Lim, W.-Y., and Kim, S. (2017). Experimental Assessment of Seismic Vulnerability of Precast concrete Beam-To-Beam Connections with Steel Slit Damper. Int. J. Steel Struct. 17, 1249–1260. doi:10.1007/s13296-017-9030-9
Moretti, M. L., Kono, S., and Obara, T. (2020). On the Shear Strength of Reinforced Concrete Walls. Sj 117, 293–304. doi:10.14359/51724668
Rafiee, R., and Sharifi, P. (2019). Stochastic Failure Analysis of Composite Pipes Subjected to Random Excitation. Construction building Mater. 224, 950–961. doi:10.1016/j.conbuildmat.2019.07.107
Sun, X. F., Fang, X. S., and Guan, L. T. (2021). Mechanics of Materials. Beijing: Higher education press. (in Chinese).
Tolou Kian, M. J., and Cruz-Noguez, C. (2018). Reinforced concrete Shear walls Detailed with Innovative Materials: Seismic Performance. J. Compos. Constr. 22, 04018052. doi:10.1061/(ASCE)CC.1943-5614.0000893
Keywords: high-strength composite shear walls, seismic performance, hysteresis curve, backbone curves, strain analysis
Citation: Gan M, Yu Y and Zhang H (2021) An Experimental Study on the Seismic Performance of High-Strength Composite Shear Walls. Front. Mater. 8:722343. doi: 10.3389/fmats.2021.722343
Received: 08 June 2021; Accepted: 11 November 2021;
Published: 20 December 2021.
Edited by:
Yunchao Tang, Zhongkai University of Agriculture and Engineering, ChinaReviewed by:
Sun Qing, Xi’an Jiaotong University, ChinaRoham Rafiee, University of Tehran, Iran
Haytham F. Isleem, Tsinghua University, China
Copyright © 2021 Gan, Yu and Zhang. This is an open-access article distributed under the terms of the Creative Commons Attribution License (CC BY). The use, distribution or reproduction in other forums is permitted, provided the original author(s) and the copyright owner(s) are credited and that the original publication in this journal is cited, in accordance with accepted academic practice. No use, distribution or reproduction is permitted which does not comply with these terms.
*Correspondence: Yu Yu, Y3F1eXV5QDE2My5jb20=