 M. Mahmood Ali
 Foram Dave
 Richard Sherlock
 Alistair Mcilhagger4
 David Tormey
- 1Department of Mechanical and Manufacturing Engineering, Institute of Technology Sligo, Sligo, Ireland
- 2Centre for Precision Engineering, Materials and Manufacturing Research, Institute of Technology Sligo, Sligo, Ireland
- 3Department of Life Sciences, School of Science, Institute of Technology Sligo, Sligo, Ireland
- 4School of Engineering, Ulster University, Newtownabbey, United Kingdom
Laser welding is an important manufacturing tool for a wide variety of polymer products including consumer goods, automotive components and medical devices. The laser process parameters and polymer properties have a significant impact on weld quality. Due to higher heat density generated by the laser transmission welding (LTW) technique, defining a set of suitable parameters for LTW of thermoplastics and composites can be challenging. In this work the effect of carbon black along other control parameters has been investigated for high speed welding using a laser source of 980 nm wavelength with low line energy. In this work, the finite element method (FEM)-based software COMSOL Multiphysics is used to create a 3D transient thermal model for LTW of isotactic polypropylene (iPP) and its composites with carbon black (CB) of concentrations ranging from 0.5 wt% to 1.5 wt%. The design of experiments based on Box-Behnken design (BBD) is used to organize the simulation experiments and mathematical models are developed based on multiple curvilinear regression analysis on the simulation findings. Independent control variables include the laser power, welding speed, beam diameter, and carbon black content in the absorbent polymer. The maximum weld temperature, weld width, and weld depth within the transmissive and absorptive layers are considered as dependent response variables. Furthermore, sensitivity analysis is carried out to investigate the impact of carbon black along with other independent variables on the responses. The welding feasibility check was performed on the basis of melt and degradation temperature of the materials, and weld depths of transmissive and absorptive layers. It has been observed that the composites containing 0.5 wt% and 1 wt% of CB can be welded successfully with neat iPP. However, due to a degradation temperature problem, composites having a larger proportion of CB (>1 wt%) appear to be more difficult to weld.
Introduction
Laser processing technology has become well established, playing a crucial role in solving several challenging manufacturing issues for about 4 decades (Purtonen et al., 2014). Laser welding, for example, is one of the processes that has emerging as a result of its unique characteristics, such as thermal and power stability, immunity to external interference, and suitability for joining two surfaces of specific materials (De Pelsmaeker et al., 2018; Dave et al., 2021). There are several types of laser welding categorized on the basis of laser source (solid-state, gas, diode, fibre), temporal characteristics (continuous, pulsed); material geometry, (butt, corner, edge, lap, T-joint), laser-material interaction (direct, surface heating, through transmission), and mode of laser beam delivery (contour, simultaneous, quasi-simultaneous, masked) (Grewell et al., 2003; Grewell and Benatar, 2007; Troughton, 2008; Tres, 2017; Dave et al., 2021). Laser transmission welding (LTW) is an innovative technique due to its advantages as non-contamination, rapidity, a high spatial resolution, with no vibration from tool (Dave et al., 2021), (Borges, 2016), (Jones, 2013). LTW is the most common technique used for polymers in lap geometry using continuous laser diode by contour welding as shown in Figure 1.
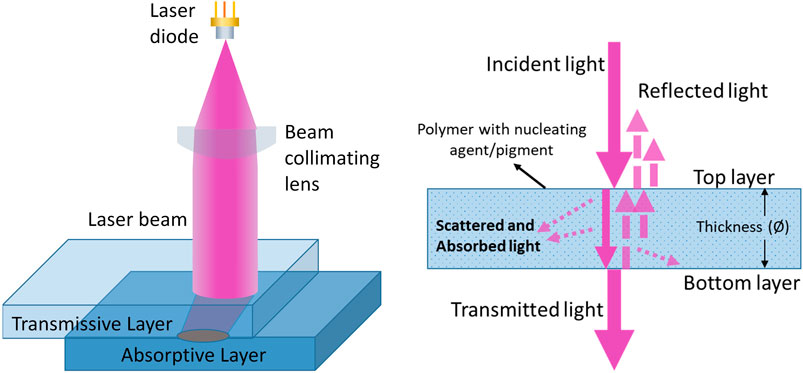
FIGURE 1. Schematic of transmission laser welding of lap geometry of materials (left) and light transmission through transmissive layer with reflected, scattered and absorbed light phenomena (right).
The LTW in lap geometry involves two dissimilar materials: the top layer (transmissive layer) is transparent or semi-transparent which allows the laser beam propagation to the bottom layer (absorptive layer) which is absorptive in nature and the energy coming from the laser beam is absorbed and converted into heat. The process has a key advantage that the majority of the laser energy is delivered only at the interface where the weld is to be formed, although some energy can be lost due to absorption and/or light scattering in the transmissive layer. Due to close contact, the heat is propagated by conduction into both layers, leading to melting and bonding of the materials when the local temperature exceeds the melting temperature (T > Tm). However, local temperatures in excess of the degradation temperature of one or other of the constituent materials can result in contamination of the weld zone and poor joint characteristics.
The necessary optical properties of the absorptive polymer material typically arise from the inclusion of fillers such as carbon nanotubes, graphene nanoparticles, fibres and, most commonly, carbon black (CB) nanoparticles. These additives enhance the absorption coefficient (Chen et al., 2011; Rodríguez-Vidal et al., 2014; Wippo et al., 2014). CB is also used as a compounding component to increase the end product’s strength. It is a type of spherical elemental carbon particle that has consolidated into colloidal size aggregates and can be considered as an intermediate matter that has a two-dimensional repeating pattern within each layer. Carbon black particles with primary particle sizes of 20 and 60 nm and concentrations by weight are blended into the base material during an extrusion process (Haberstroh and Lützeler, 2001).
For modelling or analysing the performance of manufacturing technology, numerical methods are widely used. Moreover, analytical and numerical techniques are widely used to simulate the laser transmission welding process. Many researchers have reported the work for achieving the best quality welds with the aid of simulations and furthermore optimization of the process (Potente et al., 1999) (Kumar et al., 2019) (Labeas et al., 2010; Acherjee et al., 2011; Wang et al., 2012; Nakhaei et al., 2013). Potente et al. (Potente et al., 1999) analysed the heating phase in laser transmission welding of polyamide (PA). In that work, the material properties are assumed to be constant and the effect of heat convection during the welding process was ignored. Also, a correction factor is added in order to allow for the different temperature profile in case of an absorbing part having a low absorption coefficient. For achieving the best quality weld, the modelling of optical laser transmission welding and analysis has been considered as shown in Figure 2.
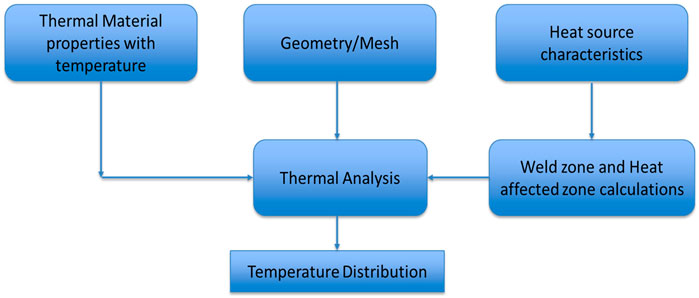
FIGURE 2. Block diagram for modelling of optical laser transmission welding and analysis for achieving quality weld.
The modelling of thermal profile for LTW of two thermoplastic parts of polypropylene (PP) has been carried out in this research. The transmissive layer of an isotactic polypropylene (iPP) is responsible for scattering and reflection losses whereas most of the transmissive power is absorbed at the absorptive layer which contains wt% fraction of carbon black (CB) filler, responsible for absorption which is converted ultimately into heat source for welding. In this work, wt% of CB in PP is the key parameter for changing the absorption coefficient. Light scattering, reflection, and absorption occur in materials, and these events alter the energy and spatial distribution of the laser beam. The amount of energy transferred between the components to be connected determines the amount of melted volume. Furthermore, the clamping mechanism or breakdown of the cohesiveness between the filler and the matrix can induce deformations due to high thermal energy. To avoid poor joint quality, a process parameter optimization based on optical and thermal properties of materials is required (Labeas et al., 2010). Good temperature estimations can allow for a more accurate representation of how individual materials behave during laser welding, as well as identifying suitable process conditions. Acherjee et al. (Acherjee et al., 2012a), (Acherjee et al., 2012b) conducted a computational study of the influence of carbon black on the temperature field and weld profile during laser transmission welding of polymers using polycarbonate as the work material. That work was conducted for high line energy however, for low line energy with high speed laser, the effect of carbon black on the performance of laser transmission welding needs to be investigated. Therefore, the present work has investigated the influence of carbon black in detail.
Line energy in laser transmission welding is defined as the ratio of laser power to the scan speed (Kumar et al., 2019; Gupta et al., 2018). The line energy used in this study is in the range of 0.05–0.12 J/mm. This range has been found to be effective for high-speed welding in experimental trials carried out by the authors that will be reported separately. The line energies used here are substantially lower than in the reported research work of Acherjee et al., which are in the range of 0.4–1.2 J/mm (Acherjee et al., 2012a). In real-time laser welding process of polymer composites with given laser line energy, the microstructure changes are expected in the material as presented by Ghorbel et al. (Ghorbel et al., 2009). However this work involves the analysis of thermal profile of the lap joint area carried out with the aid of simulations utilising the heat transfer module of COMSOL Multiphysics software and it doesn’t include the microstructure changing during welding process. The current work is based on industrial project where polypropylene (PP) is used as the base material and also polypropylene is widely used worldwide polymer for most of the applications in industries. PP is also preferred for various properties due to its semi-crystalline nature, such as mechanical thermal and chemical resistance etc. The modelling approach has been developed in such a way that in future, the suitability of laser welding of different polymer materials can also be tested using their thermal properties.
In this paper, the details of properties used for numerical modelling and investigations have been provided in section 2. In section 3, the optical modelling of the laser beam has been discussed. The light scattering decay and beam broadening effect due to scattering has been considered in the model of the laser beam. Moreover, it has been explained that how this beam is absorbed by the absorptive layer with the aid of the Beer-Lambert law. It is apparent that the volume term source and heat flux generated during laser welding are the effects of absorption. In section 4, the model of laser beam has been used to compute the temperature field evolution during LTW. In order to understand the importance of the optical properties of the material in the LTW, a parameter study is realized on the absorption coefficient of the absorptive part by taking into account the CB (wt%) in polymer matrix.
In section 5, the design of experiment has been presented in detail. Box-Behnken design has been used as it has fewer design points than central composite design (CCD) with the same number of factors, and so can be less expensive to perform. The process parameters are laser power (P), speed (S), diameter (D), CB in wt% whereas the responses are considered as weld width (WW), weld depth of absorptive layer (DA), weld depth of transmissive layer (DT) and maximum weld temperature (Tmax).
Finally, in section 6, the results have been discussed and the values of process parameters have been investigated for defining feasible laser transmission welding parameters. Finally, conclusions and future work have been presented in section 7.
Material Selection and Geometry Properties
All materials in the FE model, namely PP and its composite PP/CB, are used in simulations as thermal-brick components with only one temperature degree of freedom at constant pressure. Table 1 shows the material parameters such as density (ρ), thermal conductivity (k), and specific heat (c), these values have been taken after consulting the literature (Petrović et al., 1993; Wang et al., 2014; Geiger et al., 2009). For the sake of simplicity, the changes in material characteristics, with the exception of specific heat, are assumed to be temperature independent during the LTW process. The lap joint geometry is used where only the overlapped area is considered for simulations to reduce the computation time. The thickness of each layer is
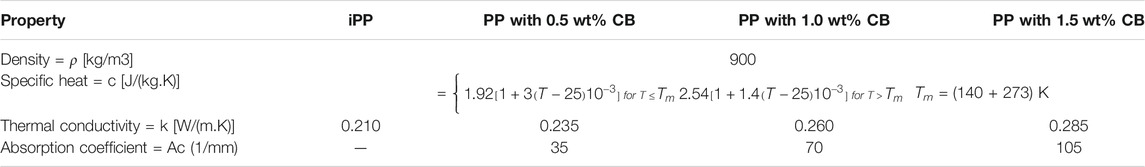
TABLE 1. Thermophysical and optical properties of the PP used in simulations.
Modelling of Laser Beam
For most polymers in their natural state there is typically little or no absorption at the wavelengths emitted by the diode lasers commonly employed in welding machinery (wavelengths in the range 800–980 nm approx.). Hence the polymers are considered as transparent or sometimes semi-transparent due to the presence of low level absorption and/or light scattering.
As light passes through a medium, it is absorbed according to Lambert-Beer’s law,
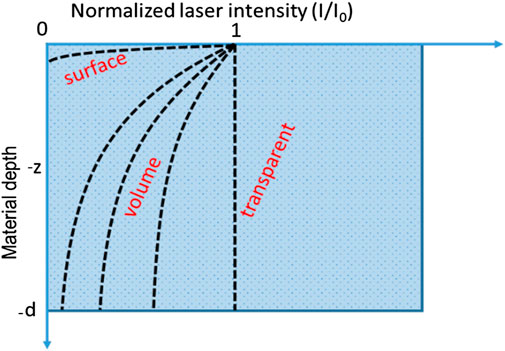
FIGURE 3. Illustration of surface or volume absorption of laser beam by material.
The laser beam power propagated through the transmissive layer can be modelled in terms of Gaussian beam as (AkuéAsséko et al., 2015)
where
After considering the thickness of transmissive layer
For moving laser source in LTW, scan speed is also included in the model, therefore in (2),
where
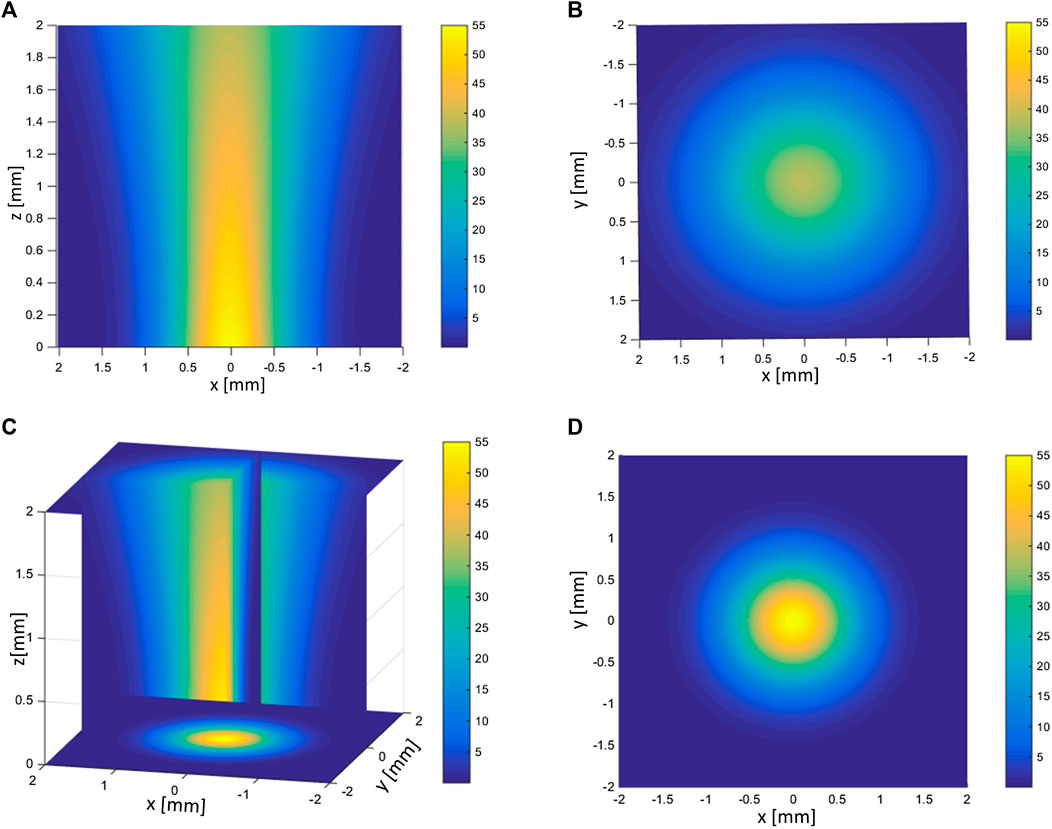
FIGURE 4. Illustration of beam intensity decay and broadening due to scattering from semi-transparent polypropylene layer (A) cross-sectional view of input beam profile (B) cross-sectional view of transmitted beam including scattering effect, (C) 3D view and (D) 2D view on xz-plane.
In present study, the following values are used:
Heat Transfer Modelling of High Speed LTW of PP and PP/CB With Low Line Energy
In real-time laser welding process of polymer composites, the microstructure changes are expected in the material as presented by Ghorbel et al. (Ghorbel et al., 2009). However in this work, the analysis of thermal profile of the lap joint area was carried out with the aid of simulations utilising the heat transfer module of COMSOL Multiphysics software. In order to calculate the temperature field, the following assumptions have been made (Acherjee et al., 2010):
1 The contacting welding materials of the PP and its composite with CB were deemed to be in close proximity. During the LTW process, isotropic thermophysical behavior has been considered.
2 The heat conduction of the PP and its composite with CB, as well as free convection between the surfaces of the PP and its composite with CB, were considered. The heating effects of phase transitions were neglected.
3 The portion of the geometry where the temperature gets higher than the melting temperature (
The thermophysical and optical properties used in the simulation are provided in Table 1. The differential equation for the three-dimensional model was considered to model the heat transfer in the LTW process through COMSOL that defined the temperature distribution within the body, and it follows the energy conservation law.
The rate of internally generated heat within the body can be represented by heat equation to model heat transfer in solids as (Comsol, 2020)
where the following material properties, fields, and sources: ρ (SI unit: kg/m3) is the polymer density, c (SI unit: J/(kgK)) is the specific heat capacity at constant pressure, k (SI unit: W/(mK)) is the thermal conductivity of the polymer and u (SI unit: m/s) is the velocity field defined by the translational motion subnode when parts of the model are moving in the material frame and Q (SI unit: W/m3) is the heat source. Moreover, the thermal conductivity k describes the relationship between the heat flux vector q and the temperature gradient ∇T in
To consider the heat transfer from boundaries to the ambient, the net inward heat flux from surface-to-ambient radiation and due to convective heat transfer, can be written as (Comsol (2020); Heat Trans, 2020)
where ε is the surface emissivity, σ is the Stefan-Boltzmann constant, and Tamb is the ambient temperature. The value of surface emissivity is set as 0.97 for polypropylene whereas the heat transfer coefficient (h) for the convective heat transfer part has been considered as 10 W/(m2.K) (Wang et al., 2014). The degradation temperature was used as 500°C (Esmizadeh et al., 2020).
Only the lap joint area has been used for the simulation as shown in Figure 5A. To reduce, computational time, a non-uniform meshing was considered by keeping the mesh size to a minimum near to the weld contour and using a relatively larger mesh size approaching the external boundaries of the geometry, as shown in Figure 5B. By varying the power (P), speed (S) of laser beam with diameter of 2 mm, maximum weld temperature was calculated. In addition, criteria was also set so that values of P and S that generate temperatures less than the melting point (140°C) and greater than the degradation temperature (500 C) are not suitable as welding input parameters. The thermal profile simulated for the absorptive layer of 0.5 wt% CB/PP for p = 100 W, speed = 1,200 mm/s at (0, y, z) plane during LTW at t = 0.025 s is shown in Figure 5C. A thermal profile (temperature) of (x, y, 0) plane during LTW at t = 0.0127 s is shown in Figure 5D.
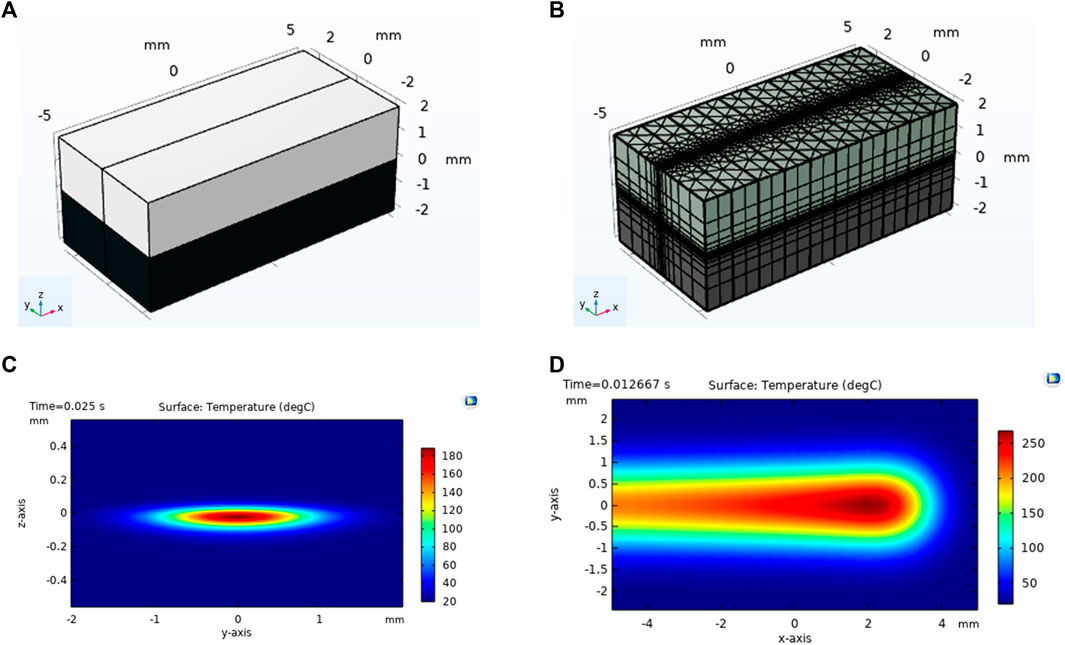
FIGURE 5. (A) Schematics of the transmissive PP and absorptive PP with wt% CB with the lapped portion, (B) illustration of non-uniform mesh pattern used for the geometrical model, (C) thermal profile (temperature) of (0, y, z) plane during LTW at t = 0.025 s, (d) thermal profile (temperature) of (x, y, 0) plane during LTW at t = 0.0127 s simulated for the absorptive layer of 0.5 wt% CB/PP for p = 100 W, speed = 1,200 mm/s.
Figures 6A, B shows the changing temperature along the welding contour xz-plane at 0.0087 and 0.05 s, respectively. It can be seen that the temperature gets increased initially and the then slowly decreases and disperses. On the basis of the maximum width covered by the thermal plot above melting point of PP (140 C) the bond started to form at the weld interface when the temperature reached at 140 C and eventually the weld width and depth are calculated which is illustrated by Figures 6C, D. The temperature increased rapidly along the x direction at the time of laser interaction with material and dropped gradually after the laser passes away from that point which is shown in Figure 6E. The maximum temperature of the weld occurs in the absorptive layer instead of instead of interface, which shows that this is volume absorption and therefore the asymmetric thermal profile can be seen along y-axis transverse to the welding direction Figure 6C.
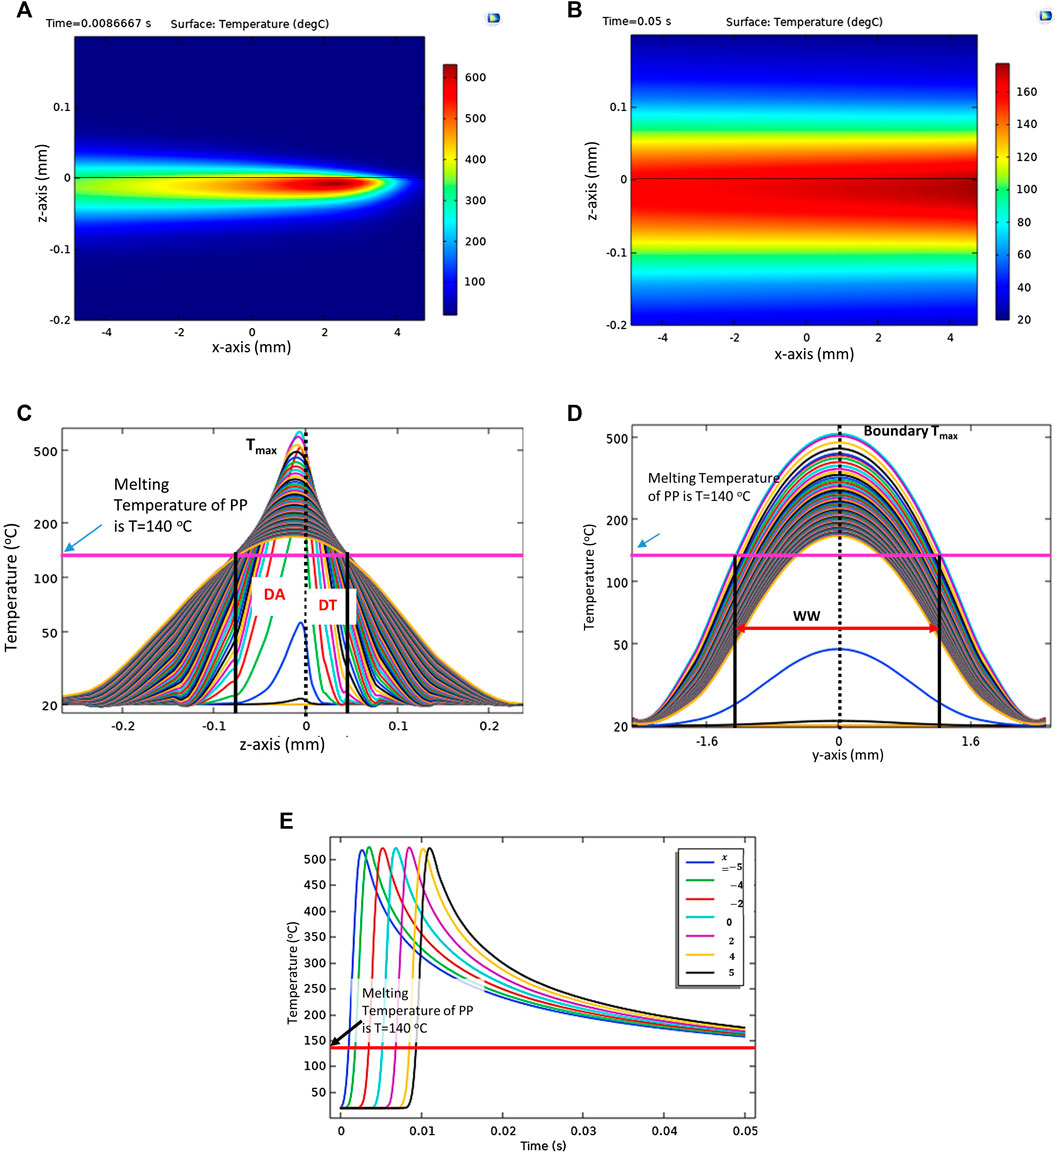
FIGURE 6. Thermal profile (temperature) at (x, 0, z) plane during LTW at (A)t = 0.0087 s and (B)t = 0.05 s simulated for the absorptive layer of 1.0 wt% CB/PP for p = 120 W, speed = 1,200 mm/s with beam diameter 1.9 mm, (C) temperature curves evolution with time during LTW along z-axis at x = y = 0 used for the measurement of weld depth for transmissive layer (DT) and absorptive layer (DA), (D) temperature curves evolution with time during LTW along y-axis at x = z = 0 used for the measurement of weld width (WW) and (E) temperature versus time at x = −5, −4, −2, 0, 2, 4, and 5.
Design of Experiments and Empirical Modeling
Low energy levels can cause a weak, and low-strength joint, whereas excessive energy levels potentially lead to degradation and vaporization, which also can result in poor joint quality. in. As a result, the energy provided to the surfaces for each process application must be optimized. This can be achieved either by performing an essential number of experiments, which increases the cost and the required development time of the desired product, or by a parametric investigation through numerical simulation. Therefore, a validated numerical simulation tool for the analysis and optimization of the LTW process parameters needs to be developed. The heat transfer module of COMSOL Multiphysics 5.6 software is utilized for numerical model simulations developed for this optimisation study.
A three-level-four-factor Box-Behnken design (BBD) was applied to determine the best combination of control variables for good quality weld. Table 2 shows the ranges and levels of the selected process control parameters, as well as the units, levels, and notations studied in this study.
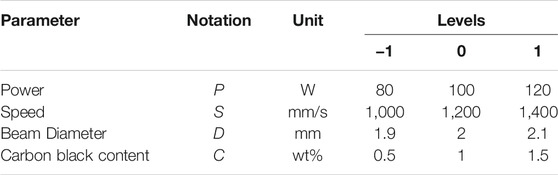
TABLE 2. Process Control parameters and their levels.
Empirical models are developed for simulation results in Table 3 using multiple curvilinear regression analysis as presented by Kim et al. (Kim et al., 2003). A functional relationship between input and output variables is assumed as the following:
where
where
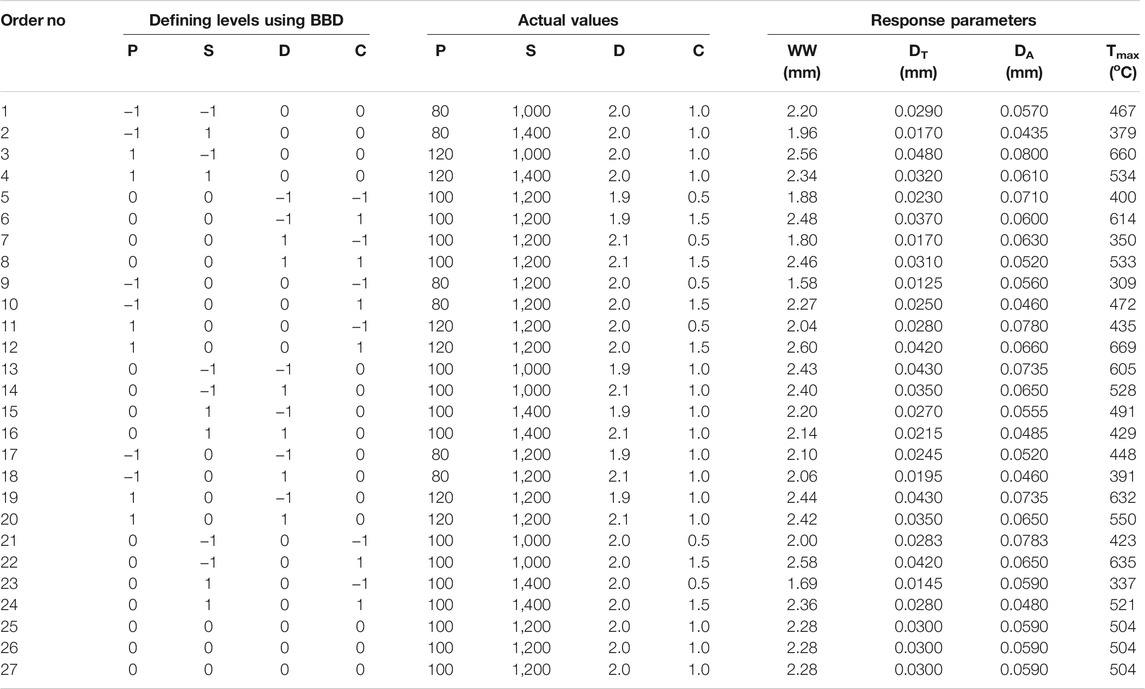
TABLE 3. Box-Behnken experimental design and response values for weld width (WW), weld depths in transmissive layer (DT) and absorptive layer (DA), and maximum weld temperature (Tmax).
(6)can be treated as a first-order regression model as illustrated in (7). After running the regression analysis on (7) in Microsoft Excel, the model equation for each response are obtained as in (5).
The developed empirical models for maximum temperature (Tmax) during LTW, weld width (WW), weld depth in transparent part (DT), and weld depth in absorbing part (DA), which can be used for prediction within same design space, is given as follows:
ANOVA results for
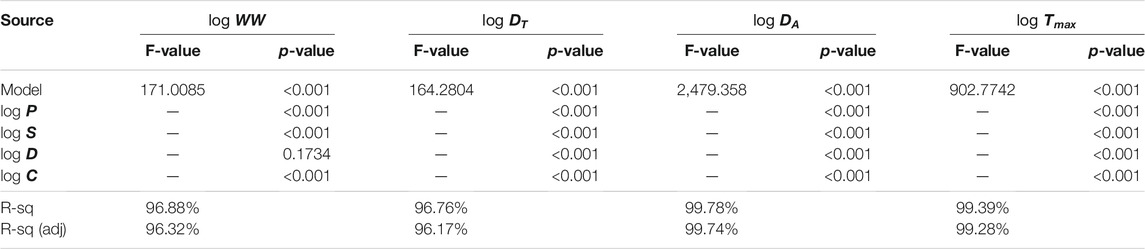
TABLE 4. ANOVA results for
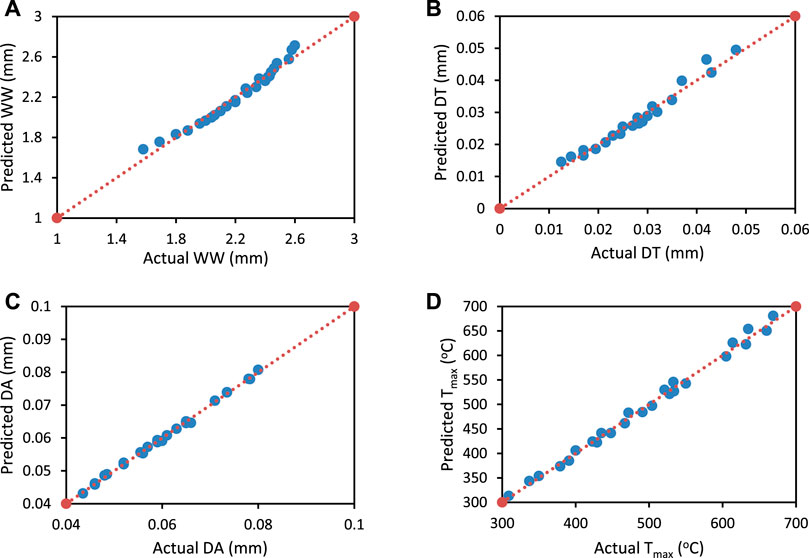
FIGURE 7. Plot of actual vs predicted response of (A) WW (mm), (B) DT (mm), and (C) DA (mm) (D) Tmax (oC), results.
Under a given set of assumptions, the sensitivity analysis approach is used to discover how changing values of an independent variable would influence a certain dependent variable. Sensitivity analysis provides information regarding the parameter that has to be measured the most precisely, as well as the impact of minor changes in that parameter on the overall design goals (KaraoğluSeçgin, 2008).
The partial derivative of a design objective function with respect to its variables is the sensitivity of that function with regard to control parameter in mathematics. Eq. 8–11 are differentiated with respect to power for calculating the sensitivity of WW, DT, DA, and Tmax with respect to power as
Equations 8–11 are differentiated with respect to speed for calculating the sensitivity of WW, DT, DA, and Tmax, with respect to speed.
Equations 8–11 are differentiated with respect to beam diameter for calculating the sensitivity of WW, DT, DA, and Tmax with respect to diameter.
Results and Discussion
Sensitivity analysis is used to investigate the impact of process control variables on the outputs in the design space studied in this research. Positive sensitivities indicate that the output variable rises as the input variable rises, whereas negative sensitivities indicate that the output variable rises as the input variable falls (KaraoğluSeçgin, 2008). The sensitivity plots of all output responses with regard to each input control variable are shown in Figure 8. In addition, an inset picture is used for all subfigures of Figure 8 to provide a clear visualisation of the sensitivity variation of DT and DA. Figure 8 (a) shows that all of the weld dimensions such as WW, DT, and DA exhibit a positive sensitivity with respect to power. This effect occurs because an increase in power causes an increase in heat input, resulting in more molten material and, as a result, larger weld dimensions. The sensitivity of WW with reference to power is also demonstrated to be greater than that of DT and DA. As can be seen, the WW and DA are more sensitive in the lower power range, but the DT is more sensitive in the higher power range. This means that increases in power cause minute changes in DT and DA but significant changes in WW. Also on the secondary vertical axis of Figure 8A, the sensitivity of Tmax with respect to power is plotted which is positive. This implies a rise in the value of Tmax as the laser power rises. This is because when the laser power increases, the heat input to the irradiation zone rises, leading in a greater Tmax. Furthermore, Tmax is likewise more sensitive in the lower power zone than in the higher power zone, as shown in the preceding figure. This implies that a small variation of power in lower region causes higher deviation in Tmax than that in higher power region.
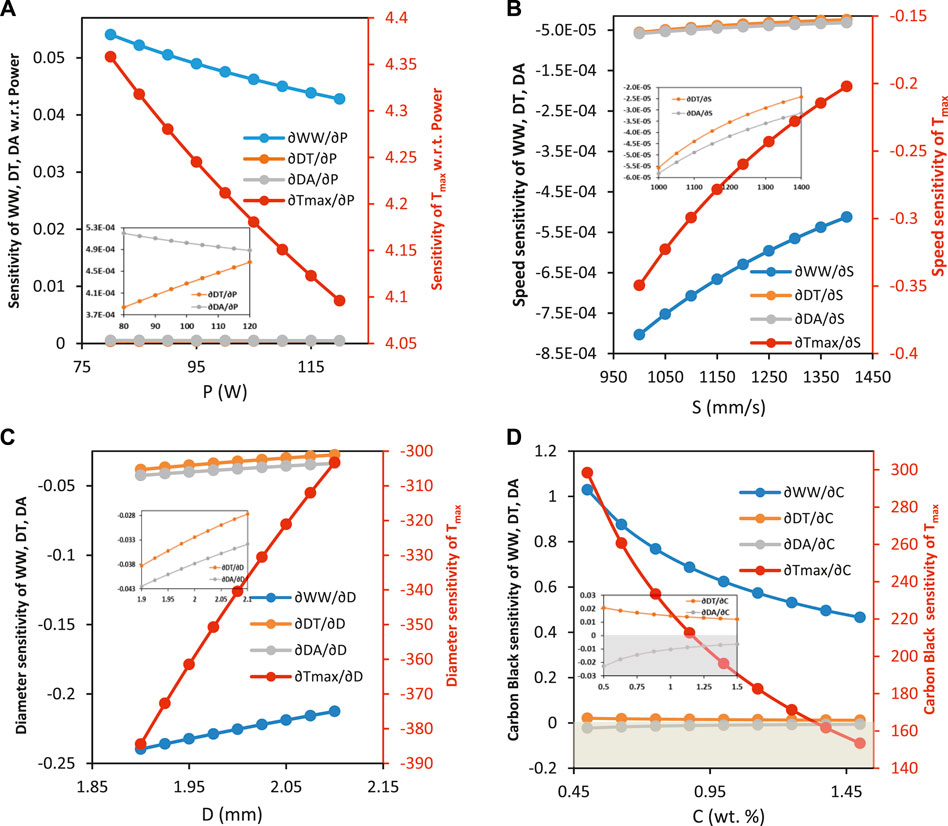
FIGURE 8. Sensitivity analysis results for (A) power (constant parameters: welding speed = 1,200 mm/s, beam diameter = 2 mm, and carbon black content 1 wt% (B) speed (constant parameters: power = 100 W, beam diameter = 2 mm, and carbon black content 1 wt% (C) beam diameter (constant parameters: power = 100 W, welding speed = 1,200 mm/s, and carbon black content 1 wt% (D) carbon black (constant parameters: power = 100 W, welding speed = 1,200 mm/s, and beam diameter = 2 mm.
The sensitivity findings for outputs with reference to the laser scan speed are shown in Figure 8B. The figure shows that the sensitivity of all weld diameters with regard to welding speed are negative. This is owing to the fact that when welding speed increases, the irradiation period decreases, resulting in a decrease in line energy. As a consequence of reduced provided heat, the volume of the molten material reduces, resulting in a narrow weld. The welding speed sensitivity of DT and DA is found to be greater than that of WW. This means that welding speed has a greater impact on the DT and DA than on the WW. Also, from secondary axis of Figure 8B Tmax’s sensitivity towards laser scan speed is negative, indicating that as welding speed increases, Tmax decreases. The desired temperature can be defined as a function of the laser power density and irradiation period, if other parameters are fixed. It is evident that by decreasing the welding speed lengthens the irradiation duration, resulting in a greater Tmax. Also, from Figure 8B, it can be concluded that the Tmax and all weld dimensions are likewise more sensitive at higher laser scan speed values than lower values of speed.
It can be seen from Figure 8C that the weld dimensions WW, DT and DA have negative sensitivities with respect to beam diameter, this trend is similar to their sensitivities with respect to speed. It is interesting to note that the sensitivity of WW for beam diameter is negative in this work whereas it is reported positive by Acherjee et al. (Acherjee et al., 2012a). The reasons that can be considered are power density, which gets decreased with the increase of beam diameter, coupled with low line energy resulting in the reduction of WW in the current study. On the other hand a smaller beam diameter results in more targeted power input, which increases power density and improves weld penetration (DT and DA). The sensitivity of beam diameter on Tmax is also negative, as seen on the secondary axis of the plot. It demonstrates that the value of the Tmax decreases as the beam diameter increases. This is because, expanding the beam diameter causes the laser energy to be distributed across a larger region. Tmax and all weld dimensions are likewise more sensitive at higher laser scan speed values than lower values of speed.
The findings of the sensitivity analysis for carbon black concentration are shown in Figure 8D. The figure shows that the WW and DT sensitivity to carbon black concentration are positive, whereas the sensitivity of DA is negative. Increased carbon black concentration increases the absorption coefficient as discussed in section reduces optical penetration depth, resulting in the laser beam being absorbed at a lower depth in the absorbing material, increases the temperature at the interface which further results in a wider WW and deeper DT but a lower DA. The change of carbon black content affects the WW more strongly than DT and DA.
Tmax increases with carbon black concentration in the absorbing polymer, as evidenced by positive sensitivity values in the secondary axis of the plot. Increased carbon black concentration raises the absorbent polymer’s absorption coefficient, which improves laser absorption and results in a higher Tmax. All of the output variables are likewise more sensitive at lower carbon black concentration levels than at higher ones. It can also be observed that the weld depth in absorptive and transmissive layer in this work is less than 0.1 mm whereas in the literature it’s greater than 0.1 as reported in (Acherjee et al., 2012a). This is due to the high speed of laser and also due to larger absorption coefficient, the absorption is closer to surface absorption and it results in the reduction of weld depth. This shows that the laser transmission welding is strongly affected by optical properties of the absorptive layer and hence the carbon black is the control factor.
Figures 9A–D shows the simultaneous effect of laser power and carbon black content on output variables by keeping the other parameters constant.
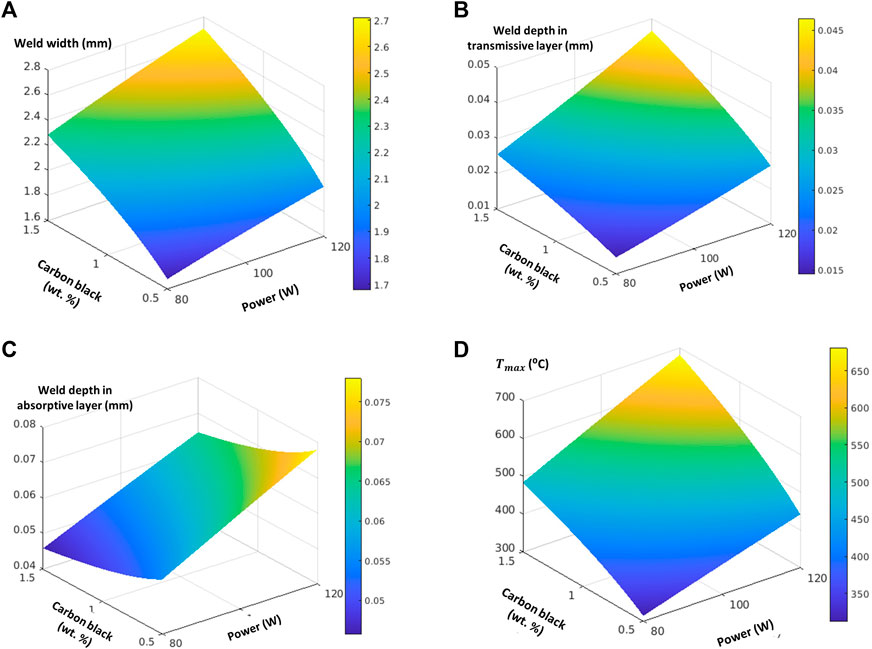
FIGURE 9. (A) Simultaneous effect of laser power and carbon black content on the weld width (constant parameters: welding speed = 1,200 mm/s, and diameter = 2 mm), (B) Simultaneous effect of laser power and carbon black content on the weld depth of transmissive layer (constant parameters: welding speed = 1,200 mm/s, and diameter = 2 mm), (C) Simultaneous effect of laser power and carbon black content on the weld depth of absorptive layer (constant parameters: welding speed = 1,200 mm/s, and diameter = 2 mm) and (D) Simultaneous effect of laser power and carbon black content on maximum weld temperature of transmissive layer (constant parameters: welding speed = 1,200 mm/s, and diameter = 2 mm).
The Figure 10A–C shows that increase in the carbon black concentration, raises the maximum weld temperature by keeping the other set of welding conditions constant. As a result, increasing the carbon black concentration of the absorbing polymer can partially compensate for a drop in laser power, an increase in welding speed, or an increase in beam diameter. It means that the amount of laser power required is highly dependent on the amount of carbon black in the absorbing portion. It’s also evident that under given set control parameters, it’s harder to weld polypropylene with higher CB wt% due to the rise in the maximum weld temperature from degradation temperature (500°C).
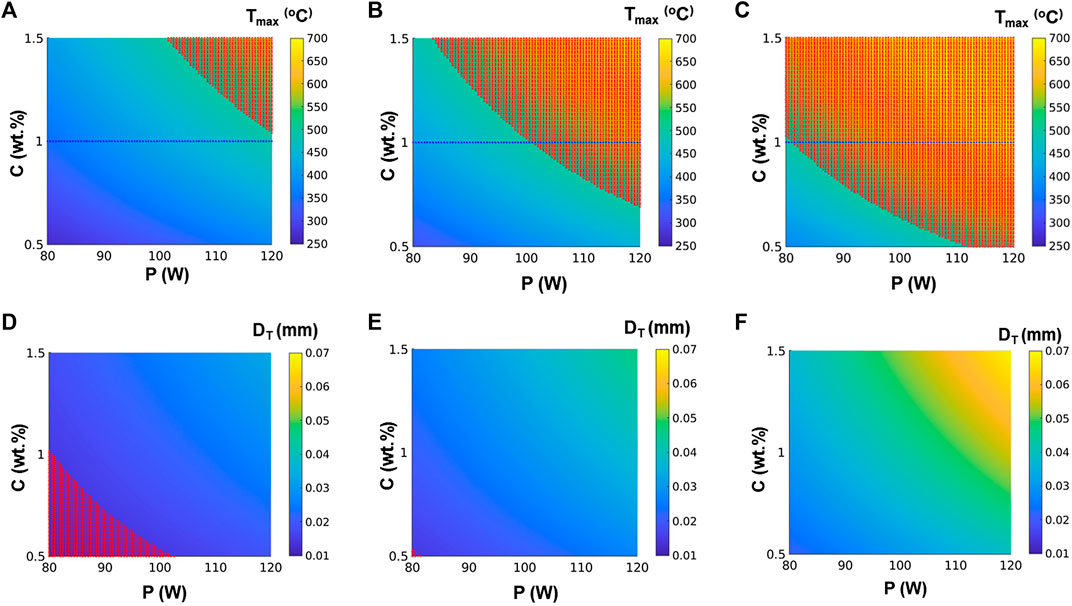
FIGURE 10. Simultaneous effect of laser power and carbon black content on maximum weld temperature with constant parameters: (A) welding speed = 1,400 mm/s, and diameter = 2.1 mm, (B) welding speed = 1,200 mm/s, and diameter = 2 mm, (C) welding speed = 1,000 mm/s, and diameter = 1.9 mm, and their effect on the weld depth of transmissive layer with constant parameters: (D) welding speed = 1,400 mm/s, and diameter = 2.1 mm, (E) welding speed = 1,200 mm/s, and diameter = 2 mm, (F) welding speed = 1,000 mm/s, and diameter = 1.9 mm.
Also, a reduction in the carbon black concentration decreases the weld depth of the transmissive layer which eventually results in the decrease of weld strength as shown in Figure 10D–F. If DT is less than 0.02 mm the region is shaded and regarded as not suitable for welding. It is clear from the figure that the suitable values of control parameters are i.e., p = 100 W, S = 1,200 mm/s, and D = 2 mm. It is mentioned that the threshold value of DT has been chosen arbitrarily and in the future work, this value will be revisited on the basis of experimental investigations.
Conclusion
The effect of carbon black and other control parameters such as power, speed, and beam diameter on the responses such as maxim weld temperature, weld width and weld depths has been investigated. Finite element analysis and design of experiments approaches have been used for the simulation of the laser transmission contour welding process. To simulate the process and provide results, a three-dimensional COMSOL model for laser transmission welding of polypropylene with a moving laser beam was developed. To design the experimental matrix, the Box-Behnken design (BBD) method is used. Multiple curvilinear regression analysis is used to construct empirical models based on simulation findings. In sensitivity analysis, the constructed empirical models are used to identify the relative effects of different inputs on the process outcomes. The findings of the sensitivity analysis revealed the important parameters that needed to be considered with the greatest precision. The sensitivity analysis leads to some unique findings.
1 Welding speed had a negative sensitivity effect on all of the responses studied, whereas laser power has a positive sensitivity effect.
2 The impact of power on WW in terms of sensitivity is positive and higher than that of DT and DA, whereas for welding speed all outputs the sensitivity is negative.
3 Tmax, WW, DT, and DA all have negative sensitivity to beam diameter.
4 The WW is more affected by changes in carbon black concentration than DT and DA.
5 Sensitivities of Tmax, WW and DT carbon black content are positive, whereas, DA has negative sensitivity. It shows that Tmax can increase higher than the degradation temperatures of polypropylene with the increased of carbon black concentration, which can result in decomposition rather than welding.
6 It is concluded that carbon black concentration in the polypropylene has strong influence on the achievement of quality weld. By increasing carbon black concentration, maximum weld temperature increases which may exceed from degradation temperature. Maximum achievable weld temperature can be reduced by increasing the speed which eventually results in decreasing the weld depth of transmissive layer resulting in limited weld strength. Therefore, it has been observed that the polypropylene containing higher than 1wt% carbon black is difficult to weld by high speed and low line energy lasers.
7 High speed of laser and larger absorption coefficient result in the absorption closer to surface which has consequences in the reduction of weld depth. This shows that the laser transmission welding is strongly affected by optical properties of the absorptive layer and hence the carbon black can be considered as an influencing factor.
This work will be used as a basis in future for further experimental investigations on LTW of polypropylene and its composites with carbon black.
Data Availability Statement
The raw data supporting the conclusions of this article are available from the corresponding author, DT, upon reasonable request.
Author Contributions
MA, DT, and RS: Conceptualisation MA: Simulations on LTW and Paper Writing, FD; materials’data and discussions on design of experiments and analysis, MA, FD, RS, AM and DT: writing–review and editing DT, and RS: research funding and supervision. All authors have read and agreed to the published version of the manuscript.
Funding
This research was funded by The North West Centre for Advanced Manufacturing (NWCAM) project is supported by the European Union’s INTERREG VA Programme, managed by the Spe-cial EU Programmes Body (SEUPB).
Conflict of Interest
The authors declare that the research was conducted in the absence of any commercial or financial relationships that could be construed as a potential conflict of interest.
Publisher’s Note
All claims expressed in this article are solely those of the authors and do not necessarily represent those of their affiliated organizations, or those of the publisher, the editors and the reviewers. Any product that may be evaluated in this article, or claim that may be made by its manufacturer, is not guaranteed or endorsed by the publisher.
Acknowledgments
The views and opinions in this document do not necessarily reflect those of the European Commission or the Special EU Programmes Body (SEUPB). For further information about NWCAM please contact the lead partner, Catalyst Inc, for details.
References
Acherjee, B., Kuar, A., Mitra, S., and Mitra, D. (2010). Finite Element Simulation of Laser Transmission Welding of Dissimilar Materials between Polyvinylidene Fluoride and Titanium. Int. J. Eng. Sci. Tech. 2 (4), 176–186. doi:10.4314/ijest.v2i4.59285
Acherjee, B., Kuar, A. S., Mitra, S., and Misra, D. (2012). Effect of Carbon Black on Temperature Field and weld Profile during Laser Transmission Welding of Polymers: A FEM Study. Opt. Laser Tech. 44 (3), 514–521. doi:10.1016/j.optlastec.2011.08.008
Acherjee, B., Kuar, A. S., Mitra, S., and Misra, D. (2012). Modeling of Laser Transmission Contour Welding Process Using FEA and DoE. Opt. Laser Tech. 44 (5), 1281–1289. doi:10.1016/j.optlastec.2011.12.049
Acherjee, B., Mondal, S., Tudu, B., and Misra, D. (2011). Application of Artificial Neural Network for Predicting weld Quality in Laser Transmission Welding of Thermoplastics. Appl. Soft Comput. 11 (2), 2548–2555. doi:10.1016/j.asoc.2010.10.005
Akué Asséko, A. C., Cosson, B., Deleglise, M., Schmidt, F., Le Maoult, Y., and Lafranche, E. (2015). Analytical and Numerical Modeling of Light Scattering in Composite Transmission Laser Welding Process. Int. J. Mater. Form. 8 (1), 127–135. doi:10.1007/s12289-013-1154-7
Bachmann, F. G., and Russek, U. A. (2003). Laser Welding of Polymers Using High-Power Diode Lasers. Adv. Mater. Laser Microtechnologies 5121, 385. doi:10.1117/12.515630
Bonten, C., and Tüchert, C. (2002). Welding of Plastics-Introduction into Heating by Radiation. J. Reinforced Plastics Composites 21 (8), 699–709. doi:10.1177/073168402128988436
Borges, M. (2016). Transmission Laser Welding of Large Plastic Components. Ltj 13 (5), 26–29. doi:10.1002/latj.201600035
Chen, M., Zak, G., and Bates, P. J. (2011). Effect of Carbon Black on Light Transmission in Laser Welding of Thermoplastics. J. Mater. Process. Tech. 211 (1), 43–47. doi:10.1016/j.jmatprotec.2010.08.017
Dave, F., Ali, M. M., Sherlock, R., Kandasami, A., and Tormey, D. (2021). Laser Transmission Welding of Semi-crystalline Polymers and Their Composites: A Critical Review. Polymers 13 (5), 675–752. doi:10.3390/polym13050675
De Pelsmaeker, J., Graulus, G.-J., Van Vlierberghe, S., Thienpont, H., Van Hemelrijck, D., Dubruel, P., et al. (2018). Clear to clear Laser Welding for Joining Thermoplastic Polymers: A Comparative Study Based on Physicochemical Characterization. J. Mater. Process. Tech. 255, 808–815. doi:10.1016/j.jmatprotec.2017.12.011
Esmizadeh, E., Tzoganakis, C., and Mekonnen, T. H. (2020). Degradation Behavior of Polypropylene during Reprocessing and its Biocomposites: Thermal and Oxidative Degradation Kinetics. Polymers 12 (8), 1627. doi:10.3390/POLYM12081627
Geiger, M., Frick, T., and Schmidt, M. (2009). Optical Properties of Plastics and Their Role for the Modelling of the Laser Transmission Welding Process. Prod. Eng. Res. Devel. 3 (1), 49–55. doi:10.1007/s11740-008-0141-1
Ghorbel, E., Casalino, G., and Abed, S. (2009). Laser Diode Transmission Welding of Polypropylene: Geometrical and Microstructure Characterisation of weld. Mater. Des. 30 (7), 2745–2751. doi:10.1016/j.matdes.2008.10.027
Grewell, D. A., Benatar, A., and Park, J. B. (2003). Plastics and Composites Welding Handbook, 25. Munich, Germany: Carl Hanser Verlag GmbH & Co, 407.
Grewell, D., and Benatar, A. (2007). Welding of Plastics: Fundamentals and New Developments. Int. Polym. Process. 22 (1), 43–60. doi:10.3139/217.0051
Gupta, S. K., Jaypuria, S., Pratihar, D. K., and Saha, P. (2018). Numerical Simulations and Experimental Verification of Laser Welding of Nylon 6. no. 2.
Haberstroh, E., and Lützeler, R. (2001). Influence of Carbon Black Pigmentation on the Laser Beam Welding of Plastics Micro Parts. J. Polym. Eng. 21 (2–3), 119–130. doi:10.1515/POLYENG.2001.21.2-3.119
Jones, I. (2013). “Laser Welding of Plastics,” in Handbook of Laser Welding Technologies (Oxford: Woodhead Publishing Series in Electronic and Optical Materials), 280–301e. doi:10.1533/9780857098771.2.280
Kim, I. S., Son, K. J., Yang, Y. S., and Yaragada, P. K. D. V. (2003). Sensitivity Analysis for Process Parameters in GMA Welding Processes Using a Factorial Design Method. Int. J. Machine Tools Manufacture 43 (8), 763–769. doi:10.1016/S0890-6955(03)00054-3
Kumar, N., Sherlock, R., and Tormey, D. (2019). Prediction of weld Interface Depth and Width at Optimum Laser Welding Temperature for Polypropylene. Proced. CIRP 81, 1272–1277. doi:10.1016/j.procir.2019.03.306
Labeas, G. N., Moraitis, G. A., and Katsiropoulos, C. V. (2010). Optimization of Laser Transmission Welding Process for Thermoplastic Composite Parts Using Thermo-Mechanical Simulation. J. Compos. Mater. 44 (1), 113–130. doi:10.1177/0021998309345325
Nakhaei, M. R., Mostafa Arab, N. B., Naderi, G., and Hoseinpour Gollo, M. (2013). Experimental Study on Optimization of CO2 Laser Welding Parameters for Polypropylene-clay Nanocomposite Welds. J. Mech. Sci. Technol. 27 (3), 843–848. doi:10.1007/s12206-013-0109-8
Petrović, Z. S., Martinović, B., Divjaković, V., and Budinski–Simendić, J. (1993). Polypropylene-Carbon Black Interaction in Conductive Composites. J. Appl. Polym. Sci. 49 (9), 1659–1669. doi:10.1002/app.1993.070490919
Potente, H., Korte, J., and Becker, F. (1999). Laser Transmission Welding of Thermoplastics: Analysis of the Heating Phase, Vol. 18. Plastics Design Library.
Purtonen, T., Kalliosaari, A., and Salminen, A. (2014). Monitoring and Adaptive Control of Laser Processes. Phys. Proced. 56, 1218–1231. doi:10.1016/j.phpro.2014.08.038
Rodríguez-Vidal, E., Quintana, I., and Gadea, C. (2014). Laser Transmission Welding of ABS: Effect of CNTs Concentration and Process Parameters on Material Integrity and weld Formation. Opt. Laser Tech. 57, 194–201. doi:10.1016/j.optlastec.2013.10.020
Karaoğlu, S., and Seçgin, A. (2008). Sensitivity Analysis of Submerged Arc Welding Process Parameters. J. Mater. Process. Tech. 202 (1–3), 500–507. doi:10.1016/j.jmatprotec.2007.10.035
Tres, P. A. (2017). Designing Plastic Parts for Assembly. 8th ed. Munich, Germany: Carl Hanser Verlag GmbH & Co.
Troughton, M. (2008). Handbook of Plastics Joining: A Practical Guide. 2nd ed. New York, NY: William Andrew Inc.
Wang, X., Chen, H., and Liu, H. (2014). Investigation of the Relationships of Process Parameters, Molten Pool Geometry and Shear Strength in Laser Transmission Welding of Polyethylene Terephthalate and Polypropylene. Mater. Des. 55, 343–352. doi:10.1016/j.matdes.2013.09.052
Wang, X., Zhang, C., Li, P., Wang, K., Hu, Y., Zhang, P., et al. (2012). Modeling and Optimization of Joint Quality for Laser Transmission Joint of Thermoplastic Using an Artificial Neural Network and a Genetic Algorithm. Opt. Lasers Eng. 50 (11), 1522–1532. doi:10.1016/j.optlaseng.2012.06.008
Keywords: carbon black, laser transmission welding, simulation, high speed laser processing, polypropylene composite, low line energy
Citation: Ali MM, Dave F, Sherlock R, Mcilhagger A and Tormey D (2021) Simulated Effect of Carbon Black on High Speed Laser Transmission Welding of Polypropylene With Low Line Energy. Front. Mater. 8:737689. doi: 10.3389/fmats.2021.737689
Received: 07 July 2021; Accepted: 13 September 2021;
Published: 28 September 2021.
Edited by:
Dong Xiang, Southwest Petroleum University, ChinaReviewed by:
Tang Zhenhua, Chongqing University, ChinaJingyao Sun, Beijing University of Chemical Technology, China
Copyright © 2021 Ali, Dave, Sherlock, Mcilhagger and Tormey. This is an open-access article distributed under the terms of the Creative Commons Attribution License (CC BY). The use, distribution or reproduction in other forums is permitted, provided the original author(s) and the copyright owner(s) are credited and that the original publication in this journal is cited, in accordance with accepted academic practice. No use, distribution or reproduction is permitted which does not comply with these terms.
*Correspondence: David Tormey, VG9ybWV5LkRhdmlkQGl0c2xpZ28uaWU=