 Reza Tangestani
 Trevor Sabiston1
 Nicholas Krutz
- 1Department of Mechatronic and Mechanical Engineering, University of Waterloo, Waterloo, ON, Canada
- 2Department of Mechanical Engineering, University of South Carolina, Columbia, SC, United States
- 3GE Additive, 8556 Trade Center Dr, West Chester, OH, United States
- 4Department of Mechanical Engineering, Polytechnique, Montréal, QC, Canada
This is the second of two manuscripts that presents a computationally efficient full-field deterministic model for laser powder bed fusion (LPBF). The Hybrid Line (HL) thermal model developed in part I is extended to predict the in-process residual stresses due to laser processing of a nickel-based superalloy, RENÉ 65. The computational efficiency and accuracy of the HL thermo-mechanical model is first compared to the exponential decaying heat input model on a single-track simulation. LPBF thin-wall builds with three different laser powers and four printing patterns are evaluated in this study and compared with part-scale simulations. The simulations show good agreements with the experimental X-Ray diffraction measured residual stresses. Compared to the laser power, the scanning pattern is demonstrated to have significant effects on residual stresses. Laser scan patterns utilizing short laser paths generate lower tensile stress along the longitudinal direction of the part and higher compressive stress along the build direction.
1 Introduction
Nickel-based (Ni-based) superalloys possess a combination of outstanding mechanical and physical properties at high temperatures, making them attractive for application in gas-turbine and jet-engine components (Reed 2006; Thatte et al., 2017; Stinville et al., 2018; Eftekhari et al., 2020). In aero-engine and gas turbine power industries, there are numerous geometrically complex components made with intricate serpentine cooling paths and thin wall sections, including the combustor, diffuser, and nozzle. Laser powder bed fusion (LPBF) is a promising route for the construction of near net shape, high-tolerance components capable of withstanding extreme environment and loading conditions (Carter et al., 2012). However, thin-wall Ni-based superalloys are susceptible to the formation of cracks and distortion during LPBF processing (Chakraborty et al., 2021).
The defects in superalloy LPBF parts are due to the rapid cooling rates reported to be on the order of 106 K/s during LPBF (Wang et al., 2019). These high cooling rates result in the formation of metastable microstructures with significant residual stresses (Lu et al., 2015; Li et al., 2018). Controlling and predicting the residual stresses during LPBF is not trivial. Both the magnitudes and distribution of residual stresses in AM components are governed by several factors, including: material properties, volumetric change due to phase transformation or precipitation, geometry of components, the position of specimens, processing parameters, baseplate temperature, and laser scanning pattern (Bandyopadhyay and Traxel 2018; Withers and Bhadeshia 2001a; Withers and Bhadeshia, 2001b).
Researchers often only consider the effect of residual stresses at the part scale. Different approaches have been developed to simulate the residual stress at the part-scale level (Gouge et al., 2019; Setien et al., 2019; Tremsin et al., 2021). The inherent strain method induces strain in a small region of a part and applies it to the entire part to exclude the thermal simulation (Huang et al., 2016; Bugatti and Semeraro 2018; Chen et al., 2019). The “lumped” approach combines multiple layers of a build and applies a uniform heat source over the entire layer (Hodge et al., 2016; Yang et al., 2019). These methods allow prediction of part distortion with reasonable computation time, but lack resolution at the microscopic scale, which is required to study the effect of laser parameters and printing patterns on the LPBF process.
Residual stresses during LPBF are attributed to the large spatiotemporal thermal gradients from localized rapid heating and cooling (Attallah et al., 2016). To fully capture the effect of residual stresses, knowledge of the thermo-mechanical behavior of the material at different length scales: macro-stresses observed at the part scale level to micro-stresses at the grain dimension must be acquired (Attallah et al., 2016). However, beam-scale modeling is not feasible at the part scale due to the high computational costs, motivating the development of track-scale models (Irwin and Michaleris 2016; Luo and Zhao 2019; Huang et al., 2021; Tangestani et al., 2021). The first part of this series introduces a new track-scale model to account for the thermal behavior at the microscopic scale. The new Hybrid Line (HL) heat input model is derived from the 3D exponentially decaying (ED) heat input model from (Liu et al., 2018). The HL model accounts for the material state transition from powder to consolidated solid material and is calibrated for high gamma prime Ni-based superalloys by incorporating thermo-mechanical properties of the powder and fully dense material. The HL model increased the computational efficiency significantly (up to 1,500 times faster) compared to the ED beam-scale model. This track-scale simulation allows thermal behavior at the microscale to be applied on the part scale, enabling high accuracy and fast simulation times.
This second part of this series is devoted to the thermo-mechanical simulation of the LPBF process. Coupling the HL thermal model, developed in part I of this series, as input to a mechanical model, enables prediction of the residual stresses at the track and part scales. Firstly, a single-track simulation is applied to compare the residual stresses in the HL track-scale and ED beam-scale models. Secondly, part-scale simulations of thin-wall builds are completed using the HL track-scale models for comparison with experimentally measured residual stresses in LPBF parts. Specimens with different laser powers and printing patterns are used to evaluate the simulations. The computational efficiency of the thermomechanical model is further enhanced using a mesh coarsening technique in Abaqus.
2 Material and Experimental Methods
2.1 Material Composition
The material considered for LPBF is a gas-atomized high-γ’ Ni-based superalloy RENÉ 65 (R65) powder produced by ATI Powder Metals, which predominantly consists of spherical particles ranging in size from 12 to 42 μm with a D50 size of 19 μm. The R65 chemical composition is 15%, Cr, 13% Co, 4% W, 4% Mo, 3.5% Ti, 2.1% Al, 0.9% Fe, 0.7% Nb, 0.05% Zr, 0.04% Ta, 0.01% B, and the balance is Ni.
2.2 LPBF Procedure
Twelve part-scale specimens are printed using an Aconity MIDI LPBF machine in an Argon environment to validate the thermo-mechanical HL model. The printed size of each specimen is 5 × 1.2 × 0.5 mm (length × height × width) based on simulation time and X-Ray Diffraction (XRD) residual stress measurement considerations. Specimens are oriented at a 25° angle with respect to the recoater direction. Each component is spaced at least 10 mm apart to avoid negative impacts of adjacent laser processing. For this reason, the two nearest specimens were not printed subsequently. This eliminates concerns with the thermal effects of neighboring parts (Robinson et al., 2018; Scime and Beuth 2019).
The specimens are printed with a laser speed of 1,000 mm/s, layer thickness of 40 μm, laser radius of 60 µm and hatch spacing of 90 µm. A series of three different laser powers and four different laser scan path patterns are studied. The three different laser powers are, 180, 200, and 220 W, respectively. The four laser scanning patterns, referred to as longitudinal, perpendicular, 90° and 45° rotations are shown in Figure 1A. Figure 1B shows how the rotations are completed between the layers. Longitudinal and perpendicular scanning patterns have 0° rotations between the layers. This allows comparison of the vector length effect (longitudinal = 5 mm and perpendicular = 0.5 mm) on residual stresses. The effect of the rotation angle between layers on the residual stress is evaluated using the 90° and 45° rotation patterns.
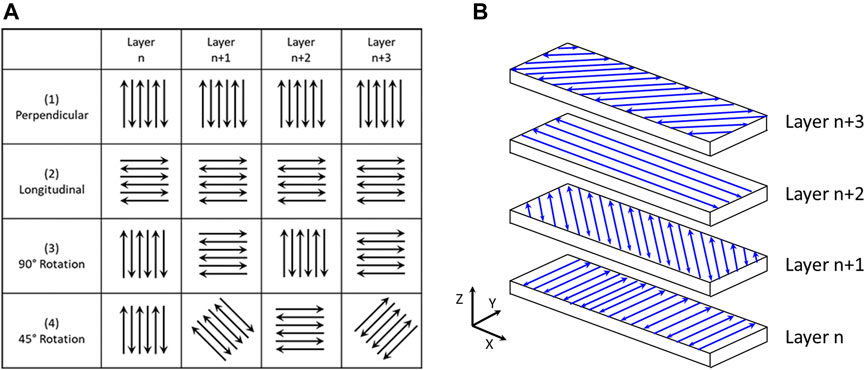
FIGURE 1. (A) The four different printing patterns used to compare the HL models with experimental results. The perpendicular and longitudinal patterns have short (0.5 mm) and long (5 mm) vector lengths with zero rotation angle between the layers. The 90° and 45° rotations patterns have counterclockwise rotation of the laser direction after each layer. (B) An example of the 45° rotation pattern is given for four layers.
2.3 Residual Stress Measurement
The residual stresses in the part-scale specimens are measured using a μ-X360s residual stress analyzer, manufactured by PULSTEC. The machine is equipped with a Cr Kα source and a 0.3 mm collimator. The Young’s Modulus and Poisson’s Ratio are defined in the machine settings to calculate the residual stress from the measured strain. The cos α method (Taira et al., 1978; Delbergue et al., 2016) is used to measure the residual stress, where X-rays are 360°-omnidirectionally diffracted from the samples around the path of incident X-rays and are detected by two-dimensional detectors. The residual stresses were evaluated 3 times at the center of the specimen. The XRD scan time is about 10 min to allow approximately 500 measurements over the 360° debye ring.
Past studies have shown that surface roughness significantly affects the residual stress measurements (Serrano-Munoz et al., 2021). Moreover, the residual stress of the final LPBF build layers is not essential as the free surface allows stress relaxation. It has also been found that the residual stresses are higher inside the LPBF parts (Robinson et al., 2018). For these reasons, the center section of the specimen is selected for residual stress measurement. Samples are mounted, ground, and polished using standard metallographic procedures. Approximately 0.6 mm (half of the sample height) is removed during sample preparation. To preserve the residual stresses, the samples are mounted while still attached to the base plate. The final polishing step is performed in a Beuhler Vibromet (TM) 2 Vibratory Polisher with 0.05-micron alumina solution (MasterPrep) for 72 h to ensured that the mechanical stresses induced by the mechanical polishing are minimized. While it is acknowledged that the removal of half the specimen affects the residual stress magnitudes, the differences in residual stresses between the different scanning patterns and laser powers are preserved.
3 Modeling
Two sequentially coupled thermo-mechanical models are implemented in Abaqus (a Dassault Systems finite element software) to evaluate the accuracy and computational time of the models. Firstly, a single-track model is implemented for comparison between HL and ED models introduced in Part I of this series (Tangestani et al., 2021). The beam-scale (ED) model is a baseline for comparison due to its greater accuracy in replication of the heat input profile of the energy source (Irwin and Michaleris 2016; Luo and Zhao 2019). Secondly, a HL-based part-scale model is developed for comparison with the experimental residual stress measurement described in Residual Stress Measurement.
The equations governing the thermal behavior of the ED and HL models has been previously described in Part I (Tangestani et al., 2021). Standard equations governing the mechanical behavior have been used for both HL and ED models. Thermal gradients predicted by the thermal models are input into the mechanical models to predict the resulting stresses. The total strain increment
where
Where α is the thermal expansion coefficient,
Where
The temperature-dependent material properties of R65, including density, specific heat, latent heat, thermal conductivity, incorporated in the simulations are given in Part I (Tangestani et al., 2021). The HL model calibration coefficient (
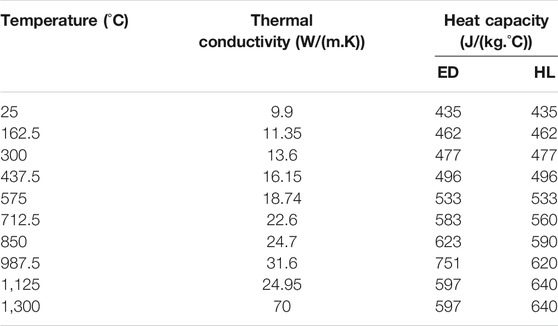
TABLE 1. Temperature-dependent thermal material properties for R65.
3.1 Single-Track Models
The model geometry for the single-track simulations (HL and ED) is shown in Figure 2. The substrate is 2 mm long, 0.96 mm high, and 0.5 mm wide. A 0.04 mm thick powder layer corresponding to the experimental setup is added on top of the substrate. The powder and substrate are divided with the dashed blue line in Figure 2. The substrate is fixed to its surroundings to constrain movement in all directions. The laser path direction is aligned with the X-direction in Figure 2. The single-track simulations are completed with a laser power of 200 W and laser speed of 1,000 mm/s. The residual stresses are evaluated along the longitudinal and transverse directions, named lines 1 and 2 in Figure 2. Based on previous work (Tangestani et al., 2021), a value of 20
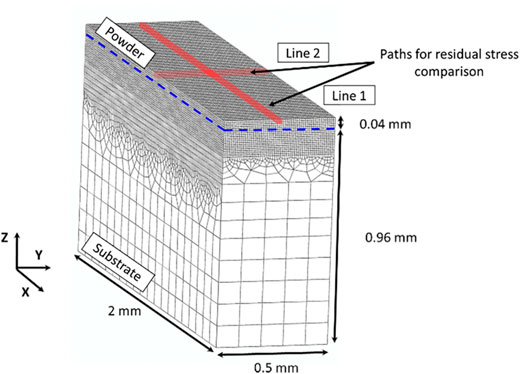
FIGURE 2. Track-scale model mesh showing the dimensions of the substrate and powder bed. The laser movement is parallel to the X-direction. The residual stresses are evaluated along the two lines highlighted in red.
To determine the minimum mesh size required for the thermal and mechanical models a mesh sensitivity study is conducted. The minimum required mesh size from the sensitivity study is maintained for both the thermal and mechanical models. The region over which the laser passes is meshed with elements whose dimensions are 10 μm for both Y- and Z-directions, and 20 μm for the X-direction in the ED model. For the HL model, the laser-affected region is meshed with elements having dimensions of 20 μm in Y and Z, and 30 μm in the X-direction. In addition, coarser elements are employed for regions further from the laser heat source to decrease the computational time, as shown in Figure 2. The material state transition (solid, powder, and liquid) is incorporated within the model using the USDFLD subroutine described in Part I of this series (Tangestani et al., 2021).
3.2 HL Part Scale Model
A sequentially coupled part-scale thermo-mechanical model with 30 build layers is developed for comparison with experimental results. The part is 5 mm long, 1.2 mm tall, and 0.5 mm wide and is built on a 4 mm thick substrate, as shown in Figure 3. A 0.04 mm thick powder layer corresponding to the experimental setup is applied during the simulation to mimic the printing process. The dashed blue line divides the printed part and the substrate in Figure 3. The substrate is constrained from moving in all directions while the part is printed.
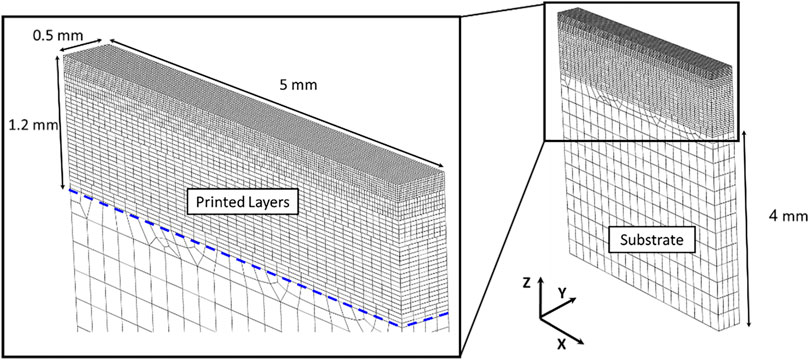
FIGURE 3. Part-scale meshed 30-layer model used to simulate the 12 different LPBF builds (3 powers and 4 scanning patterns shown in Figure 1). The dashed blue line shows the border between the printed layers and the substrate. The residual stresses are taken along the line shown in red.
Convective and radiative heat losses are defined for the free surfaces with the same coefficient values as the single-track model. The time between each layer addition is set to 10 s to reproduce the experimental settings for the recoater action. The simulation runs for 480 s after printing the last layer to allow the part to cool to room temperature. Following the build simulation, the boundary conditions are relaxed in the substrate to account for the stress relaxation when the part is removed from the printer.
The laser scan path is first generated within the Netfabb software and translated to a laser time-location database file using a custom Python script. The time-location file is then read by the UEXTERNALDB subroutine at the beginning of each increment in ABAQUS for the finite element simulation. The DFLUX subroutine uses this information to account for the position of the heat input during each time increment of the simulation.
A single
An adaptive mesh-coarsening technique is implemented to reduce the model size as each new layer is added and allows the thermal and mechanical models to run nearly simultaneously. A custom framework developed by Achuthan and Jayanath (Jayanath and Achuthan 2018) is implemented to coarsen the element size during simulation. The framework is incorporated with the element birth technique to simulate the layer deposition, and the phase transition is simulated with a user-defined subroutine. To facilitate the transfer of data from prior meshes, the stress-strain data is transferred using the “mesh-to-mesh solution mapping” feature within Abaqus. A Python script is developed to map the displacement from prior meshes to the new mesh using interpolation with the “griddata” tool (Jayanath and Achuthan 2018). Linear interpolation is adequate to calculate the updated position of the nodes, as demonstrated in (Jayanath and Achuthan 2018; Hajializadeh and Ince 2019). A flowchart illustrating the computational framework is given in Figure 4.
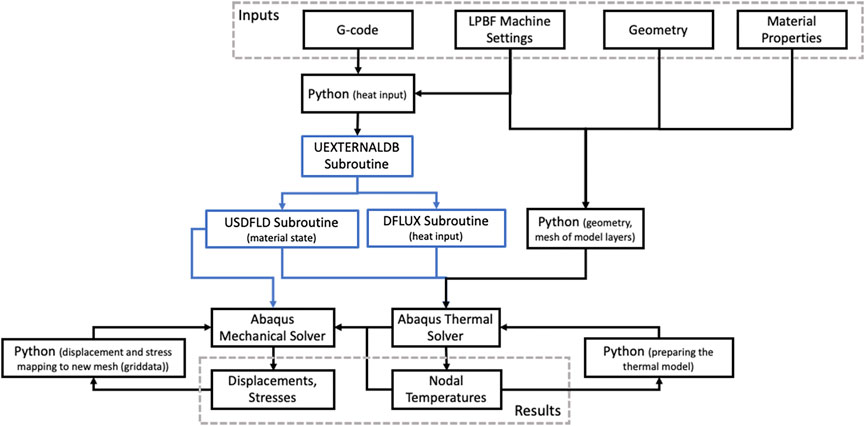
FIGURE 4. Flowchart of the computational framework including subroutines (blue) and interactions with customized Python programs.
Figure 5 shows the implementation of the framework to dynamically increase the element size during simulation. The build simulation begins with a single layer where the mesh is used to calculate the thermal results incorporated within the mechanical model. The nodal temperatures are used by the mechanical model to calculate the stresses and strains for each layer. Subsequent layers are meshed on top of the stack for further calculations using the results from the previous layers as initial conditions.
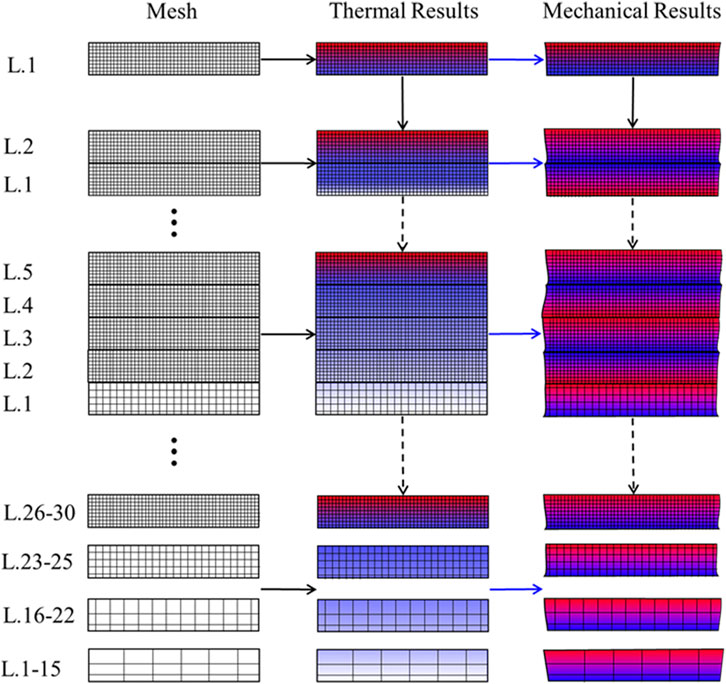
FIGURE 5. Mesh-coarsening algorithm showing mesh evolution with the number of layers. For each layer, a new model is created and the results from the previous model are mapped as initial conditions for the new model. A python code is used to transfer nodal displacements between models.
Table 2 indicates the mesh size changes as the number of layers is varied. This ensures high resolution close to the heat source and faster computation near the base plate. Figure 5 shows how mesh coarsening is implemented after 5 and 30 build layers. The mesh size of the first layer (L1 in Figure 5) is coarsened once the fifth layer (L5 in Figure 5) is deposited. As the build progresses, four different mesh sizes are incorporated, as detailed in Table 2. When the last layer is deposited, the layers L30 to L26 have the finest mesh size, while layers L1–L15 have the coarsest mesh size. The first 15 layers have 304 elements per layer and the last 5 layers have 4,175 elements per layer based on Table 2.
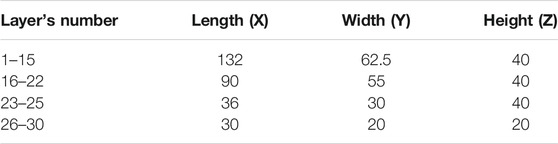
TABLE 2. Element size, in microns, for each meshed layer of the part-scale simulation.
4 Results and Discussion
4.1 Comparison Between HL and ED Single Track Models
The predicted residual stresses for the single-track model are examined to compare the HL and ED models. The results are evaluated 10 s (layer-wise cooling time) after the track is printed with the boundary conditions relaxed.
4.1.1 Effect of Thermal Model on Stress Distribution
It was previously explained in Part I that the thermal distribution is crucial to accurately capture the stresses and strains generated during LPBF. This requires accurate prediction of nodal temperatures, cooling rates, and the heat transfer between the different material states (i.e., liquid, solid and powder states). The von Mises stress distributions are shown for the ED and HL models simulated with three different
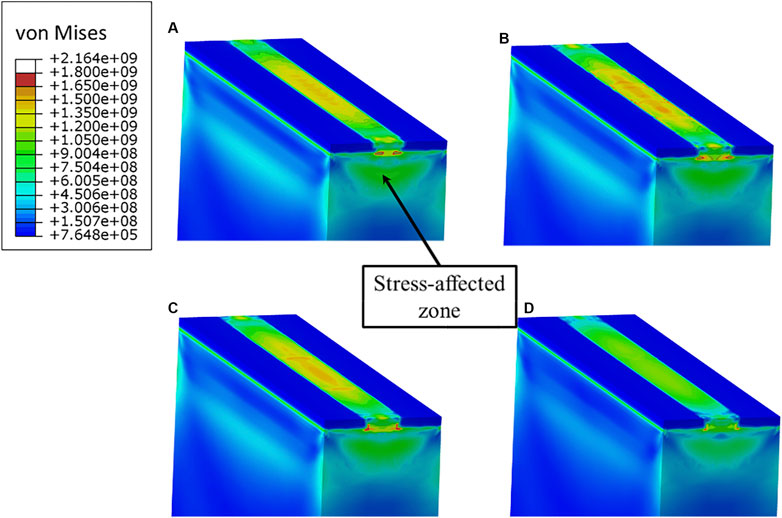
FIGURE 6. Von Mises stress (Pa) distributions for the (A) ED and (B) HL (
The stress distributions are similar between HL
4.1.2 Effect of
The distribution of the residual stress components, along with the von Mises stress for ED and three different
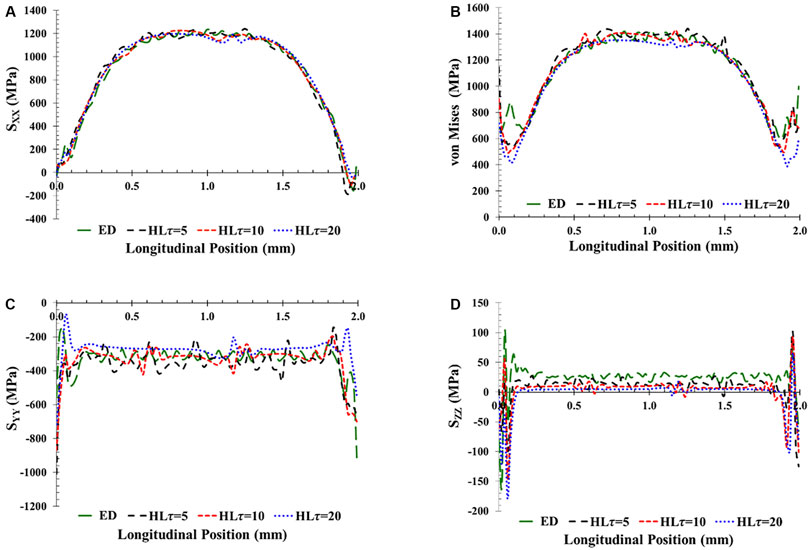
FIGURE 7. Single-track residual stress distributions along line 1 in Figure 2 for ED and HL models. (A) von Mises (B) SXX (C) SYY (D) SZZ stresses.
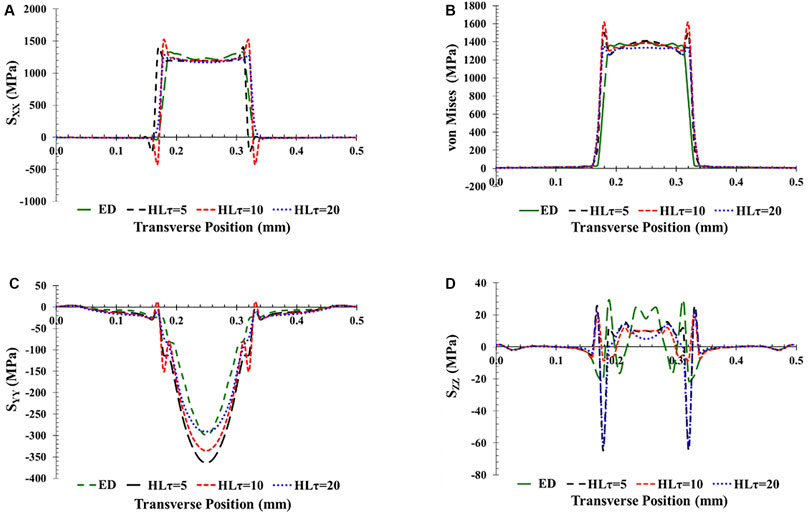
FIGURE 8. Single-track residual stress distributions along line 2 in Figure 2 for ED and HL models. (A) von Mises (B) SXX (C) SYY (D) SZZ stresses.
The HL model accurately reproduces the results of the ED model along the laser direction in Figure 7. The average variations between the ED and HL models are below 3% for all
4.2 Model Computational Efficiency
The computational efficiency of the HL model in comparison to the ED beam scale models is attributed to two factors. Firstly, the time step increment size (
4.2.1 Effect of
Figure 9 shows the impact of
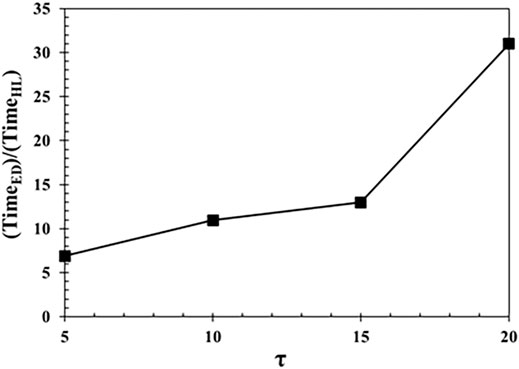
FIGURE 9. Comparison of
4.2.2 Effect of Mesh Size on the Computational Efficiency
Element size is another important factor when considering the computational efficiency of the model. It is desirable to have a small mesh size in regions where the laser interacts with the powder bed to increase the resolution of the model. However, decreasing the element size decreases the time step. Therefore, it is desirable to use the maximum possible element size for part-scale simulations and motivates the use of dynamic re-meshing.
Dynamic re-meshing is applied to the part-scale simulations as the printed layers are added. The ED model cannot be compared due to infeasible simulation time at the part scale. However, the estimated computational times for the ED model in addition to the HL model, with and without dynamic re-meshing, are compared in Table 3. The estimated times are calculated by comparing the processing times of the ED and HL single track models for the thermal and mechanical simulations. The ratio of computation time is multiplied by the HL part-scale simulation time to estimate the time required for the ED model applied at the part scale. Dynamic re-meshing decreases the thermal and mechanical models computational time by 3.3 times, allowing the thermal and mechanical models to be run in parallel. Since the mechanical model is 3.6 times slower than the thermal model, it controls the total run time.
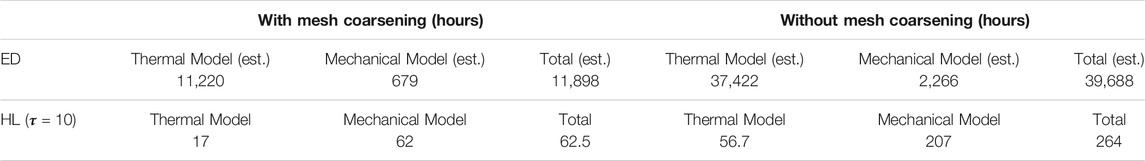
TABLE 3. Computional time (hours) comparison between the ED beam-scale and HL (
4.3 Part Scale Simulation of Residual Stresses
Twelve LPBF specimens with different laser processing conditions (3 different powers and 4 different scanning patterns shown in Figure 1A) are produced to evaluate the accuracy of the HL model at the part scale. The residual stresses along the longitudinal direction (SXX) are measured at the center of the specimens as explained in Residual Stress Measurement. The simulated stresses (SXX) are also evaluated at the centers of the specimens and are compared with the experimental values in Figure 10. Specimen IDs are given along the abscissa where the first number refers to the laser power (180–220 W) and the second number represents the scanning pattern, following the naming convention in Figure 1. The experimental error bars for each specimen corresponds with the standard deviation in residual stress measurement.
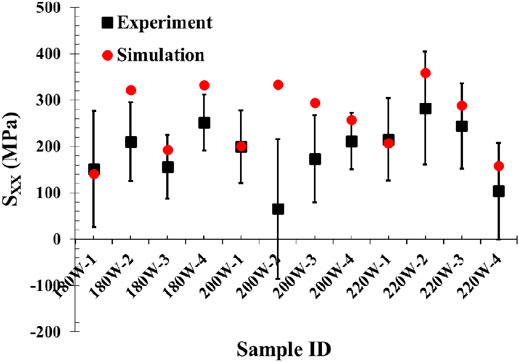
FIGURE 10. Comparison between the measured and predicted residual stresses in the X-direction (Sxx) evaluated at the center of the specimens. For each specimen ID, the first number refers to the laser power and the second number represents the scanning strategy given in Figure 1.
For most LPBF conditions, the simulated stress falls within the measured standard deviation. The maximum and minimum variations between the experimental and simulated SXX stress components are 121 and 1 MPa, respectively. Most simulations overpredict the measured residual stresses. This is likely due to the stress relaxation associated with the metallographic preparation. The removal of materials has been shown in (Ding 2012; Robinson et al., 2018) to relieve the residual stresses. The specimen 200 W-2 shows larger deviation compared to the simulation (268 MPa). It is unlikely that the measured residual stress varies between tension and compression. This error is attributed to the difficulty of aligning the X-ray beam over the small sample area (2.5 mm2). Acquiring residual stress measurements from multiple samples with the same printing conditions would provide additional statistical data and improve compatibility with the simulation results. Overall, the trends of increasing and decreasing the residual stresses with laser power and scanning patterns is well captured by the HL part-scale model.
4.3.1 Effect of Laser Power on Residual Stresses
Currently, there is no consensus on the effect of laser power on residual stress. Some researchers have shown that laser power has little effect on residual stress (C. Chen et al., 2020), while others have demonstrated both positive and negative correlation on residual stress (Xiao et al., 2020). In Part I of this series, it is shown that the laser power has a strong effect on the melt pool size but a limited effect on the cooling rate. Therefore, it is expected that the laser power will have a small impact on the simulated residual stresses.
The simulated residual stresses obtained with laser powers of 180 and 220 W are shown in Figure 11. Only the perpendicular scanning patterns (see Figure 1) are shown here as the other scanning patterns exhibit similar results. The part-scale models are sectioned through the center to show the internal stresses. There is minute difference in the residual stress magnitudes and distributions for the different laser powers observed in Figure 11. It should be noted that the laser powers in these studies are limited to a small range. A larger laser power range could have a larger effect on the residual stresses.
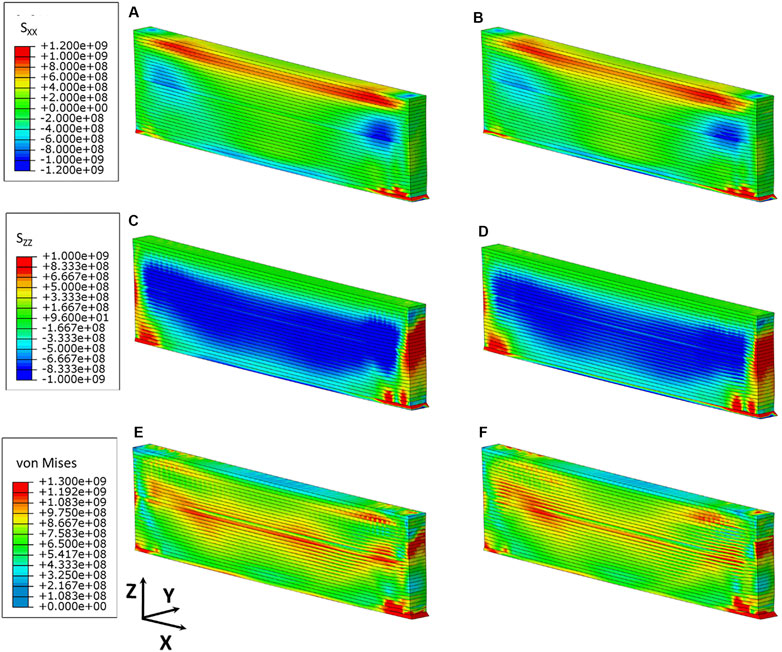
FIGURE 11. Residual stress (Pa) comparison between the three laser powers for the transverse scanning patterns in Figure 1. The residual stresses are shown along a centerline cross section of the part-scale simulations. Longitudinal stress (Sxx) for laser power (A) 180 W and (B) 220 W. Build direction stress (Szz) for laser power (C) 180 W and (D) 220 W. Von Mises stress for laser power (E) 180 W and (F) 220 W.
The longitudinal stress component (SXX) in Figure 11A–B is highest close to the top of the build. However, the SZZ and the von Mises stress in Figure 11C–F shows the largest stresses at the center of the part. The SZZ stress is near-zero at the top of the parts due to the free surface. The stress at the bottom of the part is reduced due to relaxation of the boundary conditions described in HL Part Scale Model. The SYY stress is not presented because it does not change with laser scanning pattern and provides smaller contributions to the stress state. This is due to plate theory, which states that only limited load can be supported through the thickness direction in thin wall structures, as shown in (Chakraborty et al., 2021). Note that the inconsistency in the stress distribution around the center line is due to the mesh-to-mesh mapping, as shown in (Hajializadeh and Ince 2019).
The distributions of the cooling rates (not shown here) are similar for the three laser powers considered in this study. The maximum in-process cooling rate is 5.3
4.3.2 Effect of Scanning Patterns on Residual Stresses
Laser printing patterns have been previously investigated by other researchers (Kruth et al., 2012; Setien et al., 2019; Serrano-Munoz et al., 2021). Generally, the scan strategy affects the final microstructure and part distortion more than the laser power (Xiao et al., 2020). Important parameters for investigating the effect of laser scanning strategy are the vector length (laser path length) and the laser path rotation angle between the layers. Kruth et al. (Kruth et al., 2012) found that longer laser passes increase part distortion. Laser path rotation reduces the directionality of the residual stresses and creates a more homogenous quasi-isotropic stress state (Parry et al., 2016; Setien et al., 2019). However, these studies focused mainly on “island” scanning patterns for thick part components (Cheng and Chou 2015; Serrano-Munoz et al., 2021). To the authors knowledge, there have been no studies on the effect of scanning patterns on thin-wall structures.
This study focuses on thin-wall geometries where perpendicular and longitudinal scanning patterns have short and long vector lengths, respectively. Moreover, two rotation angles (90° and 45°) between the layers are investigated. The predicted residual stresses for the four different scanning strategies are shown in Figures 12, 13, 14 for the longitudinal (SXX), build (SZZ) and transverse (SYY) directions, respectively. For each case, limits are placed on the contour plots to eliminate numerical artifacts from stress concentrations at the edge of the parts or due to mesh-to-mesh mapping (Hajializadeh and Ince 2019).
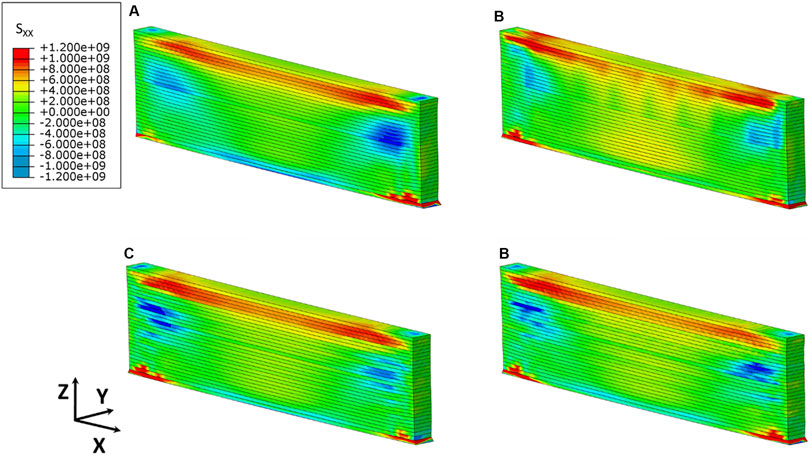
FIGURE 12. Longitudinal residual stress (Sxx (Pa)) comparison between the four scanning patterns described in Figure 1 (A) Perpendicular, (B) longitudinal, (C) 90° rotation and (D) 45° rotation. The residual stresses are shown along a centerline cross section of the part-scale simulations.
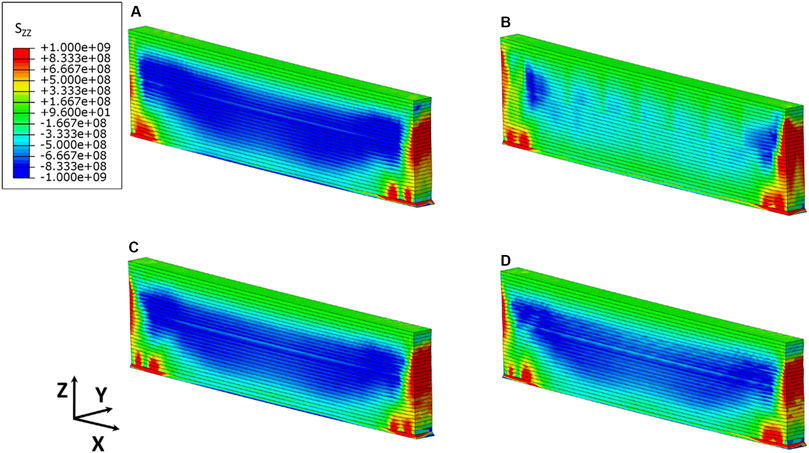
FIGURE 13. Build direction residual stress (SZZ (Pa)) comparison between the four scanning patterns described in Figure 1 (A) Perpendicular, (B) longitudinal, (C) 90° rotation, and (D) 45° rotation. The residual stresses are shown along a centerline cross section of the part-scale simulations.
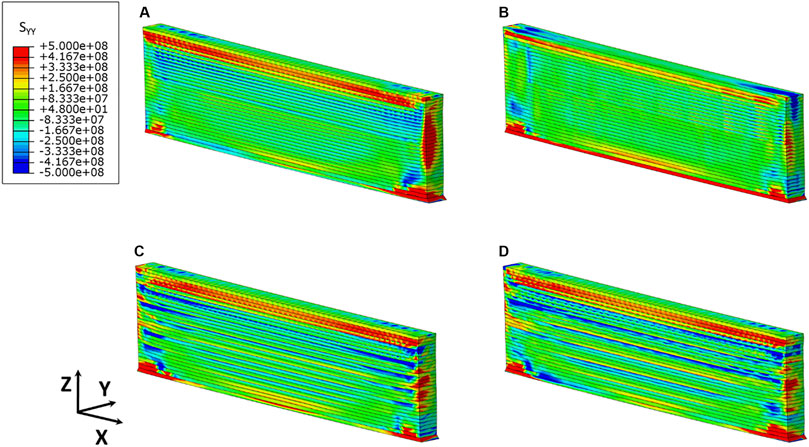
FIGURE 14. Transverse residual stress (SYY (Pa)) comparison between the four scanning patterns described in Figure 1 (A) Perpendicular, (B) longitudinal, (C) 90° rotation and (D) 45° rotation. The residual stresses are shown along a centerline cross section of the part-scale simulations.
Maximum stresses are observed in the longitudinal direction (Sxx) for all scan strategies and have the same peak magnitude as the single-track simulations in Figure 7A. In the single-track simulation, it is observed that the stress along the build direction (SZZ) is negligible. However, for the part-scale simulation, there is an accumulation of SZZ stress at the center of the part height. This indicates the importance of considering both build geometry and height to compare residual stresses in LPBF. The SYY stress plots in Figure 14 shows layer-laminated structure for the 90° and 45° rotation patterns. This is due to the directional stresses and mismatches between the layers, resulting in a non-homogenous stress distribution as discussed in (Kruth et al., 2012; Parry et al., 2016; Serrano-Munoz et al., 2021). The SYY component is significantly lower (>2X lower than Sxx) than the other directions due to the thin wall builds, as explained in Effect of Laser Power on Residual Stresses.
There is increased residual stress along the laser travel direction. This is shown in Figure 12B, where the laser runs parallel to the part, and in Figure 14A, where the laser travels perpendicular to the part. The long vector length generates more tensile residual stress (average SXX
The minimization of the tensile residual stress comes at the cost of increasing compressive residual stresses in the build direction, shown in Figure 13. The short vector length in Figure 13A drastically increases the compressive residual stress in the build direction compared to the long vector length in Figure 13B. The difference is approximately 3 times higher for the short vector length. This increase in compressive residual stress will negatively impact the limiting build height in thin-wall components, as observed in (Chakraborty et al., 2021).
The two rotation patterns shown in parts of Figures 12C,D, 13C,D, 14C,D have a layered quasi-isotropic residual stress distribution. This is consistent with previous studies showing more isotropic stress distribution when the laser path is rotated from layer to layer (Parry et al., 2016). It is more apparent in Figures 12, 14 where the longitudinal and transverse stresses are dominant due to the variation from layer to layer in the sectioned plane (Z-X). The stress distribution for the rotation patterns is a combination of both perpendicular and longitudinal patterns, with the 45° rotation pattern exhibiting less variation between neighboring layers.
5 Conclusion
In the second part of this series, a new track-scale thermo-mechanical model is developed to predict the residual stress distribution during the LPBF process. The elasto-plastic properties of R65 are considered in the prediction of the residual stresses. The simulation results are first compared with a beam-scale (ED) simulation of a single laser track. There is good agreement between the track-scale (HL) and beam-scale models for residual stress prediction within 3 and 5% variation on the SXX and von Mises stresses.
The time step increment size of the mechanical model has a smaller effect on the computational time compared to the thermal model. The mechanical track-scale HL model is six times faster when
The accuracy of the HL model is also evaluated with part-scale specimens. X-ray diffractions are completed to measure the SXX stress components on specimens built with 3 different laser powers and 4 different scanning patterns. The measured stresses ranged between 282 and 65 MPa. The predicted stresses were within the standard deviation (average deviation of 54 MPa) of residual stresses for most cases. The simulation typically over-predicted the residual stresses due to the sample preparation procedure, however the trends match.
Laser powers between 180 and 220 W have minimal effect, whereas the scanning pattern leads to more variation in residual stress distribution. While long vector lengths result in more tensile stresses along the longitudinal direction, short vector lengths cause less tensile stresses due to the part thickness. However, this leads to more compressive residual stresses in the build direction. Laser rotation patterns lead to a preferential combination of properties from both short and long vector lengths. This study shows that the model is capable of accurately predicting the residual stress variation due to laser parameters and scanning strategies at the part scale.
Data Availability Statement
The original contributions presented in the study are included in the article/Supplementary Material, further inquiries can be directed to the corresponding author.
Author Contributions
RT: Developed the thermo-mechanical model, evaluated the simulation results, measured the residual stress using XRD, and analyzed both simulation and experimental results along with writing the manuscript. TS: Contributed to the development of the modeling process and writing and editing the manuscript. AC: Prepared the samples for the residual stress experiment: mounting, grinding, and polishing; and reviewed the manuscript. LY: Printed the components for XRD measurements and reviewed model development. NK: Provided the RENÉ 65 powder for the LPBF machine, funded the project, edited the manuscript, and reviewed the XRD measurement process. ÉM: supervised the project and contributed to writing the manuscript.
Conflict of Interest
The authors declare that the research was conducted in the absence of any commercial or financial relationships that could be construed as a potential conflict of interest.
Publisher’s Note
All claims expressed in this article are solely those of the authors and do not necessarily represent those of their affiliated organizations, or those of the publisher, the editors and the reviewers. Any product that may be evaluated in this article, or claim that may be made by its manufacturer, is not guaranteed or endorsed by the publisher.
Acknowledgments
The authors are thankful to Natural Sciences and Engineering Research Council of Canada (NSERC) under Grant Nos. RGPIN-2019-04073. The authors would also like to thank Amber Andreaco, from GE Additive, for supplying the powder material used in this study.
References
Attallah, M. M., Jennings, R., Wang, X., and Carter, L. N. (2016). Additive Manufacturing of Ni-Based Superalloys: The Outstanding Issues. MRS Bull. 41 (10), 758–764. doi:10.1557/mrs.2016.211
Bandyopadhyay, A., and Traxel, K. D. (2018). Invited Review Article: Metal-Additive Manufacturing-Modeling Strategies for Application-Optimized Designs. Addit. Manuf. 22, 758–774. doi:10.1016/j.addma.2018.06.024
Bugatti, M., and Semeraro, Q. (2018). Limitations of the Inherent Strain Method in Simulating Powder Bed Fusion Processes. Addit. Manuf. 23, 329–346. doi:10.1016/j.addma.2018.05.041
Carter, L. N., Attallah, M. M., and Reed, R. C. (2012). Laser Powder Bed Fabrication of Nickel-Base Superalloys: Influence of Parameters; Characterisation, Quantification and Mitigation of Cracking. Superalloys 2012 (6), 2826–2834. doi:10.7449/2012/superalloys_2012_577_586
Chakraborty, A., Tangestani, R., Batmaz, R., Muhammad, W., Plamondon, P., Wessman, A., et al. (2021). In-Process Failure Analysis of Thin-Wall Structures Made by Laser Powder Bed Fusion Additive Manufacturing. J. Mater. Sci. Techn. 98, 233. doi:10.1016/j.jmst.2021.05.017
Chen, C., Xiao, Z., Zhu, H., and Zeng, X. (2020). Distribution and Evolution of Thermal Stress during Multi-Laser Powder Bed Fusion of Ti-6Al-4 V Alloy. J. Mater. Process. Techn. 284, 116726. doi:10.1016/j.jmatprotec.2020.116726
Chen, Q., Liang, X., Hayduke, D., Liu, J., Cheng, L., Oskin, J., et al. (2019). An Inherent Strain Based Multiscale Modeling Framework for Simulating Part-Scale Residual Deformation for Direct Metal Laser Sintering. Addit. Manuf. 28, 406–418. doi:10.1016/j.addma.2019.05.021
Cheng, B., and Chou, K. (2015). “Melt Pool Evolution Study in Selective Laser Melting,” in 26th Annual International Solid Freeform Fabrication Symposium-An Additive Manufacturing Conference, Austin, TX, United States, August 2015 (Austin, TX, USA), 1182–1194.
Delbergue, D., Texier, D., Lévesque, M., and Bocher, P. (2016). “Comparison of Two X-Ray Residual Stress Measurement Methods: Sin2 ψ and Cos α, through the Determination of a Martensitic Steel X-Ray Elastic Constant,” in Residual Stresses 2016: ICRS-10, Sydney, Australia, July 2016, 55–60.
Ding, J. (2012). Thermo-Mechanical Analysis of Wire and Arc Additive Manufacturing Process. Ph. D. Thesis. School of Applied Science, Cranfield University.
Eftekhari, N., Muhammad, W., Haftlang, F., Zarei-Hanzaki, A., and Martin, É. (2020). Microstructural Evolution and Corrosion Behavior of Sanicro 28 during Thermomechanical Processing. Mater. Today Commun. 24, 101228. doi:10.1016/j.mtcomm.2020.101228
Gabb, T. P., Gayda, J., Pete, K., Biles, T., and Konkel, W. (2001). “The Tensile Properties of Advanced Nickel-Based Disk Superalloys during Quenching Heat Treatments,” in Fall Meeting, Indianapolis, IN, United States, November 2001 (TMS Indiana).
Gouge, M., Denlinger, E., Irwin, J., Li, C., and Pan, M. (2019). Experimental Validation of Thermo-Mechanical Part-Scale Modeling for Laser Powder Bed Fusion Processes. Addit. Manuf. 29, 100771. doi:10.1016/j.addma.2019.06.022
Hajializadeh, F., and Ince, A. (2019). Finite Element-Based Numerical Modeling Framework for Additive Manufacturing Process. Mat Des. Process. Comm. 1 (1), e28. doi:10.1002/mdp2.28
Hodge, N. E., Ferencz, R. M., and Vignes, R. M. (2016). Experimental Comparison of Residual Stresses for a Thermomechanical Model for the Simulation of Selective Laser Melting. Addit. Manuf. 12, 159–168. doi:10.1016/j.addma.2016.05.011
Huang, H., Wang, J., Li, L., and Ma, N. (2016). Prediction of Laser Welding Induced Deformation in Thin Sheets by Efficient Numerical Modeling. J. Mater. Process. Techn. 227, 117–128. doi:10.1016/j.jmatprotec.2015.08.002
Huang, H., Wang, Y., Chen, J., and Feng, Z. (2021). A Comparative Study of Layer Heating and Continuous Heating Methods on Prediction Accuracy of Residual Stresses in Selective Laser Melted Tube Samples. Integr. Mater. Manuf. Innov. 10 (2), 218–230. doi:10.1007/s40192-021-00217-4
Irwin, J., and Michaleris, P. (2016). A Line Heat Input Model for Additive Manufacturing. J. Manuf. Sci. Eng. 138 (11), 111004. doi:10.1115/1.4033662
Jayanath, S., and Achuthan, A. (2018). A Computationally Efficient Finite Element Framework to Simulate Additive Manufacturing Processes. J. Manuf. Sci. Eng. 140 (4), 41009. doi:10.1115/1.4039092
Kruth, J.-P., Deckers, J., Yasa, E., and Wauthlé, R. (2012). Assessing and Comparing Influencing Factors of Residual Stresses in Selective Laser Melting Using a Novel Analysis Method. Proc. Inst. Mech. Eng. B: J. Eng. Manuf. 226 (6), 980–991. doi:10.1177/0954405412437085
Li, C., Liu, Z. Y., Fang, X. Y., and Guo, Y. B. (2018). Residual Stress in Metal Additive Manufacturing. Proced. Cirp 71, 348–353. doi:10.1016/j.procir.2018.05.039
Liu, S., Zhu, H., Peng, G., Yin, J., and Zeng, X. (2018). Microstructure Prediction of Selective Laser Melting AlSi10Mg Using Finite Element Analysis. Mater. Des. 142, 319–328. doi:10.1016/j.matdes.2018.01.022
Lu, Y., Wu, S., Gan, Y., Huang, T., Yang, C., Junjie, L., et al. (2015). Study on the Microstructure, Mechanical Property and Residual Stress of SLM Inconel-718 Alloy Manufactured by Differing Island Scanning Strategy. Opt. Laser Techn. 75 (Complete), 197–206. doi:10.1016/j.optlastec.2015.07.009
Luo, Z., and Zhao, Y. (2019). Numerical Simulation of Part-Level Temperature Fields during Selective Laser Melting of Stainless Steel 316L. Int. J. Adv. Manuf. Techn. 104 (5), 1615–1635. doi:10.1007/s00170-019-03947-0
Parry, L., Ashcroft, I. A., and Wildman, R. D. (2016). Understanding the Effect of Laser Scan Strategy on Residual Stress in Selective Laser Melting through Thermo-Mechanical Simulation. Addit. Manuf. 12, 1–15. doi:10.1016/j.addma.2016.05.014
Reed, R. C. (2006). The Superalloys: Fundamentals and Applications. Cambridge: Cambridge University Press. doi:10.1017/CBO9780511541285
Robinson, J., Ashton, I., Fox, P., Jones, E., and Sutcliffe, C. (2018). Determination of the Effect of Scan Strategy on Residual Stress in Laser Powder Bed Fusion Additive Manufacturing. Addit. Manuf. 23, 13–24. doi:10.1016/j.addma.2018.07.001
Scime, L., and Beuth, J. (2019). Melt Pool Geometry and Morphology Variability for the Inconel 718 Alloy in a Laser Powder Bed Fusion Additive Manufacturing Process. Addit. Manuf. 29, 100830. doi:10.1016/j.addma.2019.100830
Serrano-Munoz, I., Ulbricht, A., Fritsch, T., Mishurova, T., Kromm, A., Hofmann, M., et al. (2021). Scanning Manufacturing Parameters Determining the Residual Stress State in LPBF IN718 Small Parts. Adv. Eng. Mater. 23, 2100158. doi:10.1002/adem.202100158
Setien, I., Chiumenti, M., van der Veen, S., San Sebastian, M., Garciandía, F., and Echeverría, A. (2019). Empirical Methodology to Determine Inherent Strains in Additive Manufacturing. Comput. Math. Appl. 78 (7), 2282–2295. doi:10.1016/j.camwa.2018.05.015
Stinville, J. C., Martin, E., Karadge, M., Ismonov, S., Soare, M., Hanlon, T., et al. (2018). Fatigue Deformation in a Polycrystalline Nickel Base Superalloy at Intermediate and High Temperature: Competing Failure Modes. Acta Material. 152, 16–33. doi:10.1016/j.actamat.2018.03.035
Taira, S., Tanaka, K., and Yamasaki, T. (1978). A Method of X-Ray Microbeam Measurement of Local Stress and its Application to Fatigue Crack Growth Problems. J. Soc. Mater. Sci. Jpn. 27 (294), 251–256. doi:10.2472/jsms.27.251
Tangestani, R., Sabiston, T., Chakraborty, A., Muhammad, W., Lang, Y., and Martin, É. (2021). An Efficient Track-Scale Model for Laser Powder Bed Fusion Additive Manufacturing: Part 1- Thermal Model. Front. Mater. doi:10.3389/fmats.2021.753040
Tawfik, S. M., Nasr, M. N. A., and El Gamal, H. A. (2019). Finite Element Modelling for Part Distortion Calculation in Selective Laser Melting. Alexandria Eng. J. 58 (1), 67–74. doi:10.1016/j.aej.2018.12.010
Thatte, A., Martin, E., and Hanlon, T. (2017). “A Novel Experimental Method for LCF Measurement of Nickel Base Super Alloys in High Pressure High Temperature Supercritical CO2,” in Turbo Expo: Power for Land, Sea, and Air (Charlotte, NC, United States: American Society of Mechanical Engineers). 50961:V009T38A030. doi:10.1115/gt2017-65169
Tremsin, A. S., Gao, Y., Makinde, A., Bilheux, H. Z., Bilheux, J. C., An, K., et al. (2021). Monitoring Residual Strain Relaxation and Preferred Grain Orientation of Additively Manufactured Inconel 625 by In-Situ Neutron Imaging. Addit. Manuf. 46, 102130. doi:10.1016/j.addma.2021.102130
Walker, T. R., Bennett, C. J., Lee, T. L., and Clare, A. T. (2019). A Validated Analytical-Numerical Modelling Strategy to Predict Residual Stresses in Single-Track Laser Deposited IN718. Int. J. Mech. Sci. 151, 609–621. doi:10.1016/j.ijmecsci.2018.12.004
Wang, Y., Shi, J., and Liu, Y. (2019). Competitive Grain Growth and Dendrite Morphology Evolution in Selective Laser Melting of Inconel 718 Superalloy. J. Cryst. Growth 521, 15–29. doi:10.1016/j.jcrysgro.2019.05.027
Withers, P. J., and Bhadeshia, H. K. D. H. (2001a). Residual Stress. Part 1 - Measurement Techniques. Mater. Sci. Techn. 17 (4), 355–365. doi:10.1179/026708301101509980
Withers, P. J., and Bhadeshia, H. K. D. H. (2001b). Residual Stress. Part 2–Nature and Origins. Mater. Sci. Techn. 17 (4), 366–375. doi:10.1179/026708301101510087
Xiao, Z., Chen, C., Zhu, H., Hu, Z., Nagarajan, B., Guo, L., et al. (2020). Study of Residual Stress in Selective Laser Melting of Ti6Al4V. Mater. Des. 193, 108846. doi:10.1016/j.matdes.2020.108846
Keywords: laser powder bed fusion, finite element modelling, residual stress, laser scanning pattern, superalloys
Citation: Tangestani R, Sabiston T, Chakraborty A, Yuan L, Krutz N and Martin É (2021) An Efficient Track-Scale Model for Laser Powder Bed Fusion Additive Manufacturing: Part 2—Mechanical Model. Front. Mater. 8:759669. doi: 10.3389/fmats.2021.759669
Received: 16 August 2021; Accepted: 18 October 2021;
Published: 03 November 2021.
Edited by:
Roberto Brighenti, University of Parma, ItalyReviewed by:
Catherine Tonry, University of Greenwich, United KingdomHui Huang, Oak Ridge National Laboratory (DOE), United States
Copyright © 2021 Tangestani, Sabiston, Chakraborty, Yuan, Krutz and Martin. This is an open-access article distributed under the terms of the Creative Commons Attribution License (CC BY). The use, distribution or reproduction in other forums is permitted, provided the original author(s) and the copyright owner(s) are credited and that the original publication in this journal is cited, in accordance with accepted academic practice. No use, distribution or reproduction is permitted which does not comply with these terms.
*Correspondence: Étienne Martin, ZXRpZW5uZS5tYXJ0aW5AcG9seW10bC5jYQ==