 Baitao Fan1
 Xiucheng Ni
 Xiaowei Cheng
- 1CNOOC Research Institute Co., Ltd., Beijing, China
- 2China National Petroleum Corporation Southwest Oil and Gas Field Branch Exploration Division, Chengdu, China
- 3State Key Laboratory of Oil and Gas Reservoir Geology and Exploitation, Southwest Petroleum University, Chengdu, China
In shale gas production, secondary fracturing technology is often used to improve shale gas production capacity. However, the toughness of cement stone used in Class G oil wells is poor, and the cement sheath is easily damaged by impact load during fracturing, resulting in cement sheath sealing failure. To solve this problem, this paper proposes to improve the strength and toughness of cement paste by optimizing the mineral composition of Class G oil well cement. The cement clinker is burned in the laboratory, and the microstructure differences of clinker under different mineral composition ratios are observed by reflection microscope. The mechanical properties of cement paste before and after optimization are analyzed, and the best mineral composition ratio is obtained. The petrographic structure, hydration products and microstructure of high ferrite oil well cement were analyzed by petrography, X-ray diffraction analysis (XRD), thermal analysis (TG/DTG) and scanning electron microscopy (SEM), analyzed and explored its enhancement mechanism. The results show that the best mineral composition mass ratios of C3S, C2S, C3A and C4AF in high ferrite oil well cement are 58.34%, 16.39%, 1.51% and 17.94% respectively. Compared with grade G oil well cement, the compressive strength and flexural strength of curing 28 days are increased by 14.11% and 19.51%, respectively. The stress-strain results show that high ferrite oil well cement has better toughness. The petrographic results show that the lithofacies structure of high ferrite oil well cement is evenly distributed and the particle size is moderate; XRD, TG/DTG and microanalysis show that there are more hydration products in high ferrite oil well cement, the hydration products are closely combined, the hydration degree is more thorough, and the structure of cement paste is more compact. High ferrite oil well cement has the advantages of high strength and good toughness, which has potential advantages for shale gas cementing.
1 Introduction
Shale gas is composed of unconventional natural gas stored in the pores of shale or mudpaste, with long production cycle and long life (Gao et al., 2020; Bageri et al., 2021). It has a wide range of applications (Afagwu et al., 2020) and huge resource potentials (Kinnaman, 2011; Yuan et al., 2015). The use of natural gas was first discovered in the United States, with significant progress in resource development over the past century (Wang et al., 2017; Soeder, 2018). The exploration and development research on shale gas in China was introduced in 1996, and it has been developed rapidly since 2008 (Li et al., 2016; Li et al., 2020a). At present, China’s domestic proven recoverable shale gas reserves reach more than 456 billion cubic meters (Li et al., 2020b).
Currently, shale gas production mostly adopts horizontal wells (Wenbin et al., 2009; Nobakht et al., 2013; Yuan et al., 2016), with large-scale hydraulic fracturing (Guo et al., 2018), staged fracturing (Williams-Kovacs and Clarkson, 2016) and repeated fracturing (Rahman and Rahman, 2010) as the major completion strategies through which the main purpose is to connect the natural fractures using secondary fracturing techniques (Rammay and Awotunde, 2016) in order to obtain a larger discharge area and increase the productivity of the shale gas wells (Kulga et al., 2017; Dahim et al., 2020). However, during the fracturing process, the cement sheath will be subjected to multiple changes in temperature and higher static loads, cyclic loads, and shock loads, and its integrity will be compromised (Kuanhai et al., 2020; Wang et al., 2021; Xi et al., 2021; Zhang et al., 2022). It is worth mentioning that the conventional Class G oil well cement currently being used has poor toughness (Zhao et al., 2019; Zhou et al., 2019). The liquid impact force, high internal pressure, and alternating pressure during fracturing cause serious impact damages to the cement paste (Liu et al., 2017; Guo et al., 2018), causing cement sheath cracking (Xi et al., 2020). It seriously affects the sealing quality and cementing safety (Sobhaniaragh et al., 2018; Kuanhai et al., 2020), and hinders the industrialization and mass production of shale gas (Tian et al., 2015; Kuanhai et al., 2020). At present, the main technique used in the industry to improve the strength and toughness of the cement paste is through addition of toughening materials such as nanomaterials (Huang and Cheng, 2004; Khandaker et al., 2013; Wang et al., 2013; Lv et al., 2016; Al Wakeel et al., 2019), whiskers (Jafariesfad et al., 2017a), fibers (Low and Beaudoin, 1994; Berndt and Philippacopoulos, 2002; Nelson et al., 2002; Banthia and Sappakittipakorn, 2007; Won et al., 2012; Cheng et al., 2018), elastoplastic granular materials (Barkoula et al., 2008; Jafariesfad et al., 2017b; Xiaowei et al., 2017) and corresponding polymers (Kang et al., 2017; Zhang et al., 2018; Yang et al., 2019). It has been shown through experimental studies that the mechanical performance of this type of cement slurry system is relatively good (Yao and Hua, 2007). However, the increasingly severe construction conditions as well as the increasingly complex operating environments resulted in a series of shortcomings such as low hydration activity of the toughened materials (Cheng et al., 2015), complex compositions (Li et al., 2004), poor compatibility, poor suspension stability, and high cost (Liu et al., 2018), which all have made it difficult for the traditional oilwell cement to meet the working condition requirements.
At present, the relatively new and feasible technical method for cement development is to start from the cement-based material by focusing on its four basic minerals in order to adjust and optimize the mineral composition ratio of the Class G oil well cement in order to improve its mechanical performance. The four basic phases of the G-class oil well cement are (Nwankwo et al., 2020): Tricalcium Silicate (C3S), Dicalcium silicate (C2S), Tricalcium Aluminate (C3A), and Tetra calcium aluminoferrite (C4AF). These four components act synergistically in the process of cement hydration for production of strong and tough cement paste. There are some studies in the literature focusing on the hydration process, hydration characteristics and related hydration products of the single minerals through different characterization methods (Black et al., 2006; Zhang et al., 2021). In this study, we adjusted the cement raw material ratios and optimized the cement calcination process conditions by firing cement in the laboratory conditions. In this manuscript, we discuss the difference between the rock phase distribution and crystal structure of cement clinker under different conditions, and elaborate on changing its mechanical properties using different curing conditions. By adjusting the phase composition of Class G oil well cement, the developed cement was optimized, and the changes of its chemical composition, lithofacies distribution, mechanical properties and microstructure were analyzed. This enables the high ferrite oil well cement to withstand the shock loads and alternating loads generated by large-scale hydraulic fracturing during the drilling of shale gas formations, enhancing its strength and toughness, thereby ensuring the sealing integrity of the cement sheath.
2 Materials and methods
2.1 Raw materials
The raw materials used to make the cement included sandpaste, iron slag, aluminum ore waste rock, and limepaste, which were provided by Sichuan Jiahua Special Cement Co., Ltd. The macroscopic appearance of the raw materials is shown in Figure 1. The chemical composition of the raw materials is shown in Table 1.
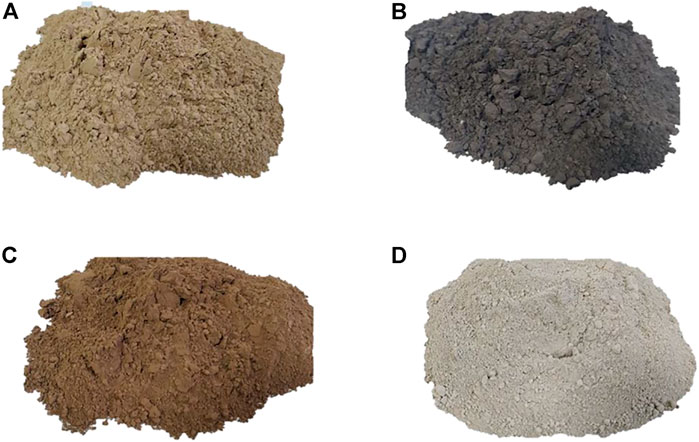
FIGURE 1. Sandpaste (A), iron slag (B), aluminum ore waste rock (C), limepaste (D) used in cement firing raw materials.
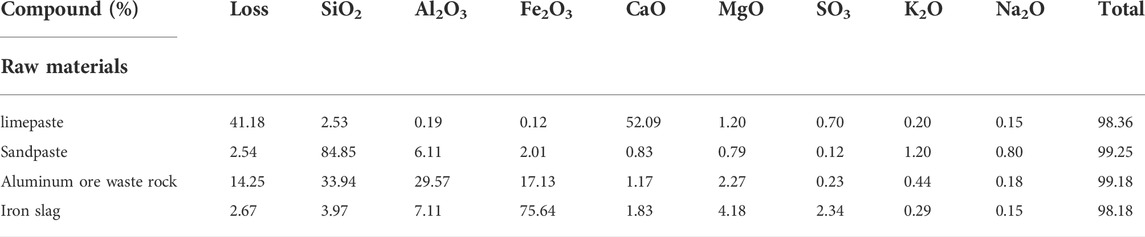
TABLE 1. Chemical composition of raw materials.
The cement clinker mixed with retarder dihydrate gypsum was provided by the China Building Materials Research Institute Co., Ltd., and its macroscopic appearance is shown in Figure 2.
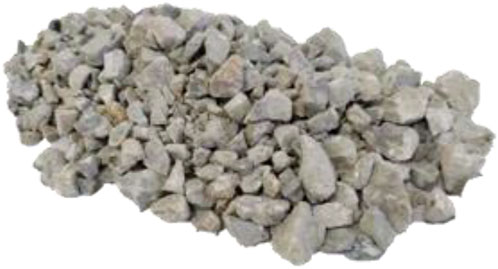
FIGURE 2. Dihydrate gypsum.
The Class G oil well cement was provided by Sichuan Jiahua Special Cement Co., Ltd., with the mineral and chemical compositions provided in Table 2.

TABLE 2. Chemical composition and mineral composition of the Class G oil well cement.
For the experiments, ordinary tap water was used.
2.2 Experimental methods
The experiments in this study were all conducted based on API standard guideline as well as the Chinese national standard GB/T19139-2015 ″Oil Well Cement Test Method". (American Petroleum Institute, 2013; General Administration of Quality Supervision, 2015a).
2.2.1 Preparation of the cement
Various firing cement raw materials were thoroughly mixed with different ratios from weighed, dried and compressed raw materials. Then, it was calcined in a high-temperature electric furnace. After the calcining process, the clinker was taken out and quenched, mixed with a certain amount of gypsum, and grounded to a certain fineness to obtain the finished cement product.
2.2.2 Chemical composition
S8 TIGER X-ray fluorescence spectrometer (Bruck AXS, Germany) was used to test the mineral composition and chemical composition of the samples at 25 °C, with an applicable power supply of 380 V ± 10%, a frequency of 50HZ, and an external argon supply with a purity of 99.999%.
2.2.3 Mechanical performance test
Using TYE-300B electronic hydraulic pressure testing machine (Beijing Haizhi Technology Development Center), the compressive strength test for the 50.8 mm × 50.8 mm×50.8 mm cube cement samples was carried out with a loading rate of 2 kN/min. A 50 mm × 50 mm×120 mm rectangular cement sample was also tested for flexural strength with a loading speed of 20 N/min. All the tests were carried out at room temperature.
The RTR-1000 triaxial rock mechanics tester (CCTS, United States) was used to perform triaxial compression test on the sample to determine its stress-strain curve at 20°C with a confining pressure of 20.7 MPa.
2.2.4 Analysis of the lithofacies structure for the cement clinker
Performed sample preparation and polishing on the fired cement clinker using a metallographic polishing machine in order to make the surfaces smooth and scratch-free. The sample was then eroded with water for 5–6 s, followed by 50% nitric acid alcohol for 7–8 s. The sample was finally cleaned with alcohol for 10–15 s. A lycra DM4 P polarized light-reflective dual-purpose microscope (Lycra, Germany) was used to observe the petrographic microstructure and the crystal size and development distribution of various single minerals through 100 times, 200 times and 500 times magnifications.
2.2.5 Mechanical integrity test
A cement sheath integrity evaluation device developed by Chengdu Rockcore Technology Co., Ltd. Was used to test the mechanical integrity of the sample. The test parameters are temperature 110°C, internal pressure 55 MPa and annular pressure 35 MPa. The working principle of the device is to first put the cured cement sheath into the rubber sleeve, and use the pressurized pump to inject fluid (i.e., oil or water) into the annular space between the rubber sleeve and the kettle body. The actual temperature and pressure are transmitted to the cement sheath through the rubber sleeve to simulate the effect of formation pressure on the cement sheath. The set temperature of the heating jacket on the wall of the kettle is then used to simulate the formation temperature, and the pressure-relief pumps are used to inject fluid (i.e., oil or water) into the casing to simulate the effect of pressure changes in the casing on the cement sheath. Nitrogen gas is also injected through the end face of the cement sheath to dynamically detect the sealing state of the cement sheath in the real environment. Through several readouts from the setup components including the pressure gauge, gas flow meter, and whether the gas cylinder has bubbles coming out, it can be determined whether the cement sheath is damaged or even cracked.
2.2.6 Microstructure characterization
A DX-2000 X-ray diffractometer (Dandong Haoyuan Instrument Co., Ltd.) was used to test the phase composition of the samples. The test angle was 5–80°, the step angle was 0.02, and the sampling time was 0.03. The samples were analyzed by thermogravimetry using DSC823TGA/SDTA85 (METTLER TOLEDO, Switzerland) at a temperature range of 40–1,000°C with a heating rate of 20°C/min. A Quanta-450 environmental scanning electron microscope (FEI, United States) was used to study the microscopic morphology of the samples.
3 Mineral composition design
3.1 Raw materials ratio
The raw materials including limepaste, sandpaste, aluminum ore waste slag and iron slag were mixed and blended following a design principle to appropriately adjust the C4AF content. The same design principle was used for the existing Class G cement clinker mineral composition (General Administration of Quality Supervision, 2015b). According to the utilized design ratio, the ferrite phase was set at a gradient of 13%–21% (mass ratio), and the contents of the other three minerals were appropriately adjusted. The designed compositions for various minerals are shown in Table 3.
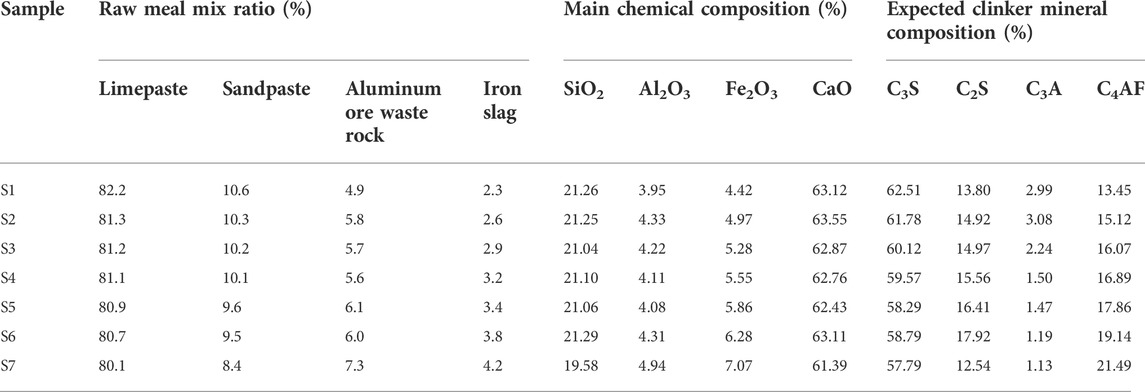
TABLE 3. Design of clinker mineral composition.
3.2 Calcining system
In order to obtain the optimal calcination system of cement clinker, the cement raw meal was first calcined with a small amount of samples, as shown in Figure 3. The raw meal was ground with a ball mill and then mixed evenly and sieved through a standard 80 µm sieve mesh with a sieve residue of 10% ± 1%. Then, 100 g of the raw material was placed in a clean container, and 10 ml of distilled water was added while stirring and mixing evenly. 3.6 ± 0.1 g of the wet raw material was collected each time, and put into the specimen forming mold. A press was then used to make a small specimen of Φ13 mm with a force of 10.6 kN. They were dried in an oven at 105°C for more than 60 min. Then the samples were calcined in high-temperature furnaces at 1,350°C, 1,400°C and 1,450°C, and then quenched in the air to obtain the required clinker. The content OF f-CaO in each sample was measured by titration, from which it was determined whether the firing temperature of the sample was appropriate or not. The experimental results are shown in Table 4 and Figure 4.
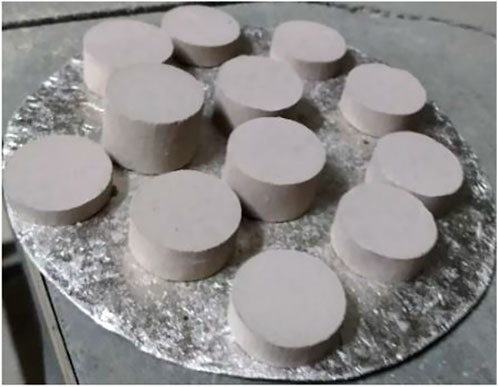
FIGURE 3. Cement raw meal-calcined small samples.
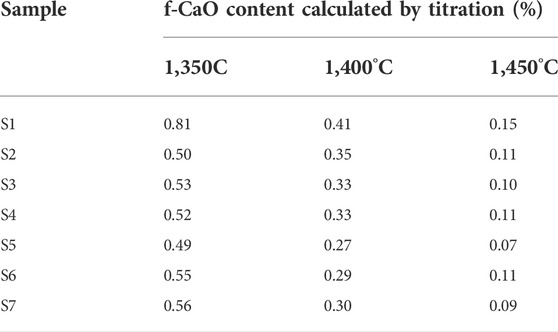
TABLE 4. Burnability test results for the cement raw meal under different preparation conditions.
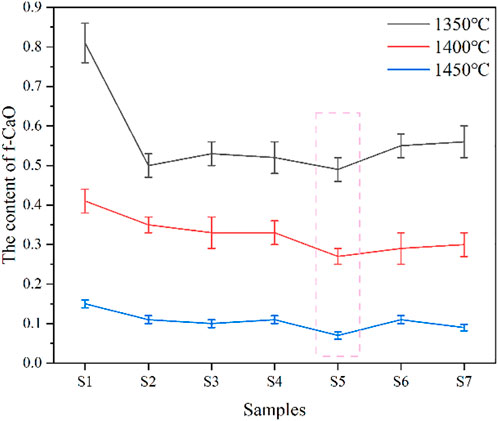
FIGURE 4. Test results of burnability of cement raw meal under different batching schemes.
At different firing temperatures, there were some differences in the f-CaO content of each cement clinker sample. At 1,450°C, the least f-CaO content of the cement clinker was obtained. The f-CaO content in the cement clinker samples at three temperature points showed a decreasing and then increasing trend, reaching to the lowest at sample S5. In order to ensure sufficient calcination of the large samples of the cement raw meal was achieved, the temperature point of 1,450°C was chosen as the final calcination temperature in this study. The cement raw material samples is shown in Figure 5.
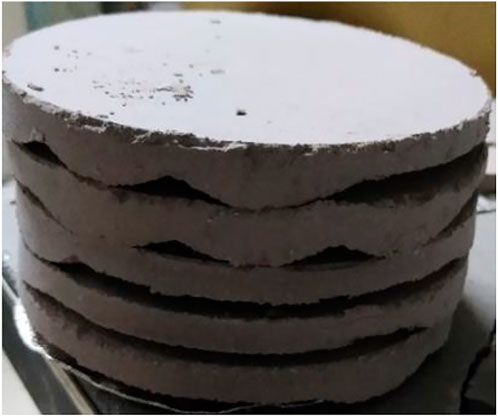
FIGURE 5. Cement raw meal-calcined large samples.
The calcination system designed in this study, along with the common cement calcination system is shown in Table 5.

TABLE 5. Calcination system.
Similar to the calcination protocol for the small samples, the raw materials of each proportion were weighted and mixed separately. Water at 8%–10% of the raw meal mass was then added, and the wet materials were then pressed into a Φ11.5 cm × 2 cm test cake under a pressure of 25 ± 5 MPa. The final weight was about 200–220 g, with one side corrugated to ensure heat transfer during the calcination process. The test cake was then dried to constant weight for a duration of at least 2 h at 105°C. The dried test cakes were then calcined according to the calcination system shown in Table 5. The calcinated test cakes were then quickly taken out and naturally cooled in air to obtain the finished cement clinker product.
4 Results and discussion
4.1 Chemical analysis
The calcined clinker with large sample was sampled and ground, and the free calcium oxide (f-CaO) and chemical composition were analyzed (Table 6) from which it was determined if the prepared clinker met the requirements set by the design criteria.

TABLE 6. Chemical composition analysis of the cement clinker.
According to Table 6, the f-CaO content of the cement clinker after firing the large sample was relatively low, and the deviation of the chemical composition and mineral composition from the design ratio was small, which all agreed with the design requirements.
4.2 Compressive and flexural strength analysis
The compressive strengths and flexural strengths of samples S1-S7 and Class G oil well cement (denoted as S8) were all tested. The curing temperature was 60°C. The results are shown in Figures 6, 7:
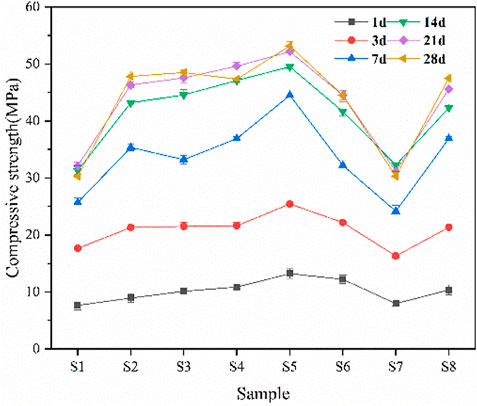
FIGURE 6. Compressive strength.
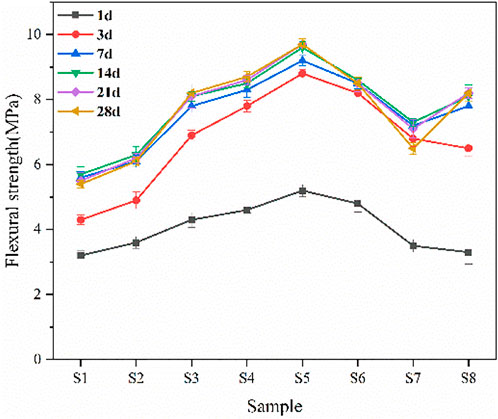
FIGURE 7. Flexural strength.
The elastic modulus of different samples are shown in Table 7:
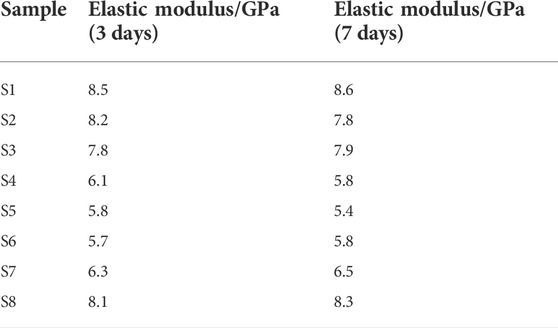
TABLE 7. Elastic modulus of samples with different phase composition.
It can be seen from Figures 6, 7 that the compressive strength and flexural strength of sample S5 are the best, and there is no strength shrinkage phenomenon in the later stage of curing. The 7 days compressive strength reached 45.3 MPa, and the 28 days compressive strength reached the maximum value of 54.2 MPa, which were both greater than that of S8. The 3 days elastic modulus of sample S5 is 5.8 GPa, and the 7 days elastic modulus is 5.4 GPa, both of which are the lowest among all the samples. This shows that the mechanical properties of sample S5 are the best among all the samples.
4.3 Clinker lithofacies microstructure analysis
The mechanical properties of samples S1-S7 are different due to different ratios of C3S, C2S, C3A, and C4AF. The lithofacies microstructures of samples S1-S8 cement clinker under a reflective microscope are shown in Figure 8.
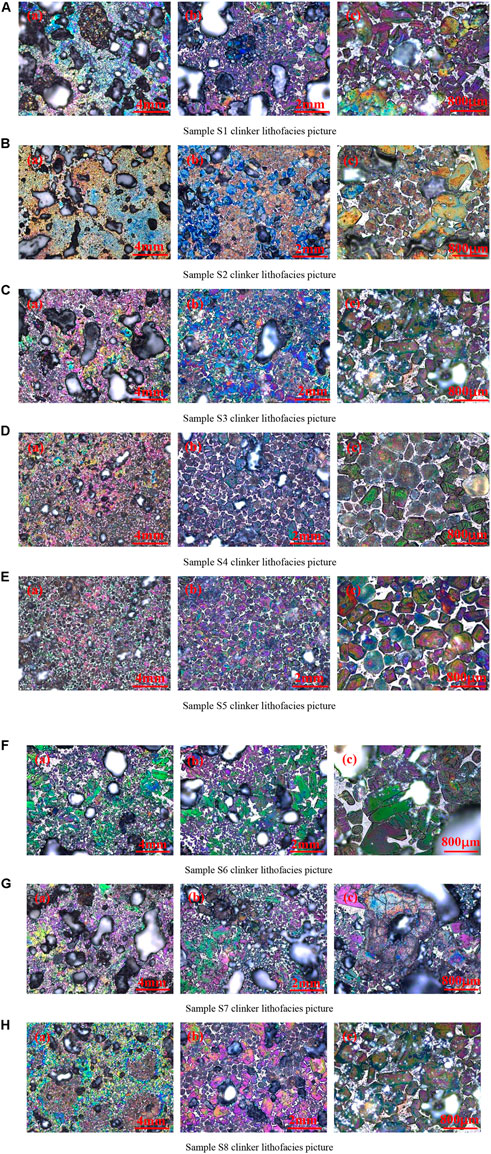
FIGURE 8. The lithofacies pictures of different cement clinker samples observed under a reflective microscope (A) Sample S1 clinker lithofacies picture. (B) Sample S2 clinker lithofacies picture (C) Sample S3 clinker lithofacies picture. (D) Sample S4 clinker lithofacies picture (E) Sample S5 clinker lithofacies picture. (F) Sample S6 clinker lithofacies picture (G) Sample S7 clinker lithofacies picture. (H) Sample S8 clinker lithofacies picture.
There are four main types of cement clinker minerals, namely Alite (C3S), also known as Mine A, which is generally prismatic crystals with larger particles; Belite (C2S), also known as B Mine, which is generally round and lighter in color than alite. The obvious double crystal stripes can be observed on the surface of B Mine; it is particle size is smaller than that of A Mine, and it is generally distributed in a concentrated band. The third main mineral is Aluminum phase solid solution (C3A), also known as black intermediate phase; and the fourth one is ferrite phase solid solution (C4AF), also known as white intermediate phase. Under the reflective microscope, the gray-white background between the A and B Mine is the aluminum phase solid solution and the iron phase solid solution. The colors of the two are similar, and it is not easy to distinguish under normal circumstances. In addition, there is free calcium oxide (f-CaO), which is generally distributed in piles with irregular shapes. Due to its very small content, its existence is generally not observed in the lithofacies photos. It can be seen from Figure 8 that the lithofacies structure of samples S1-S8 has obvious differences. The S1 and S7 samples have more pores, and the mineral crystal form is not fully developed, the structure is relatively loose. In samples S1 to S5, the mineral crystals are gradually tightly connected, and the internal pores are gradually reduced. In samples S5 to S7, the connections between the sample mineral crystals became loose, and the pores gradually increased. In samples S1 to S7, the lithofacies structure of sample S5 is the most excellent. It can be seen from the lithofacies photos of different magnifications in Figure 8E that there are almost no pores in the clinker, and the mineral crystals are well developed and the connections are very close. Compared with the lithofacies structure of the sample S8, the lithofacies structure of sample S5 is still better. The clinker has fewer internal pores, tighter connections between mineral crystals, and better crystal form development.
The micro-morphology of sample S5 and S8 clinker were observed under the scanning electron microscope, the results are shown in Figure 9. In the microscopic morphology of sample S8 at a lower magnification, as shown in Figure 9A 1) and 2), it is apparent that there are many holes inside. According to 3) and 4) in Figure 9A under a larger magnification, there are more obvious cracks in the cement clinker. According to Figure 9B, although there are holes and cracks in the micro-morphology of the cement clinker of sample S5, there are much less than that of S8, and the overall microstructure is denser, this is consistent with the petrographic structure of the two.
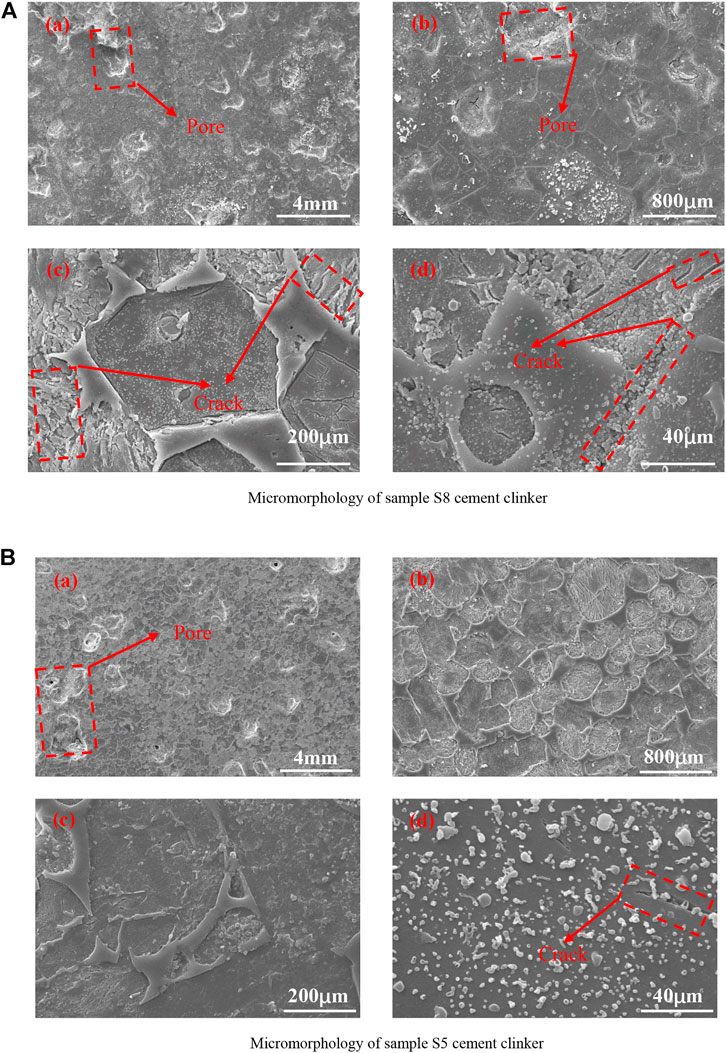
FIGURE 9. The microscopic morphology of different cement clinker samples (A) Micromorphology of sample S8 cement clinker. (B) Micromorphology of sample S5 cement clinker.
4.4 High ferrite oil well cement performance optimization
The particle size of cement has a great impact on the hydration and strength of the cement. The finer the cement, the larger the specific surface area, the more fully and faster the hydration, and the greater the strength; however, when the cement particles are too fine, it is inconvenient to store the cement because it easily reacts with CO2 and water in the air, and at the same time, it requires more energy consumption and higher costs. Gypsum is a retarder added to meet the condensation time of the oilwell cement. When its content is small, it cannot meet the retarding requirements. When it is mixed in too much, it will cause false setting of the cement slurry, and its mechanical properties will be reduced.
Based on the above discussion, we selected sample S5 to explore the effects of different SO3 content (i.e., different gypsum content) and different specific surface areas on its physical properties and strength, respectively, numbered as X1-X8. The experimental results are shown in Table 8 and Figures 10, 11.
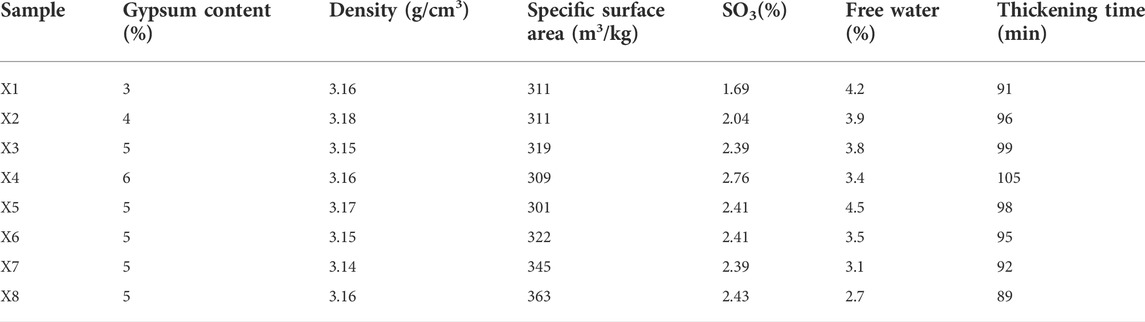
TABLE 8. The influence of different SO3 contents on cement performance.
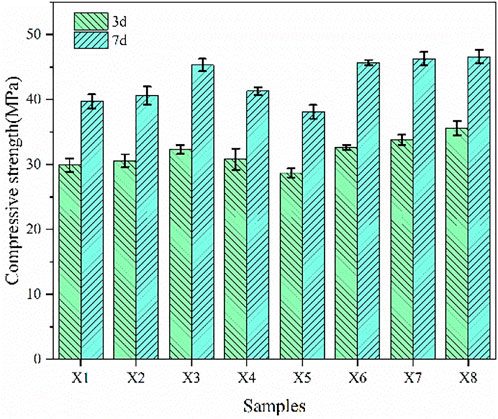
FIGURE 10. Compressive strength with different SO3 content.
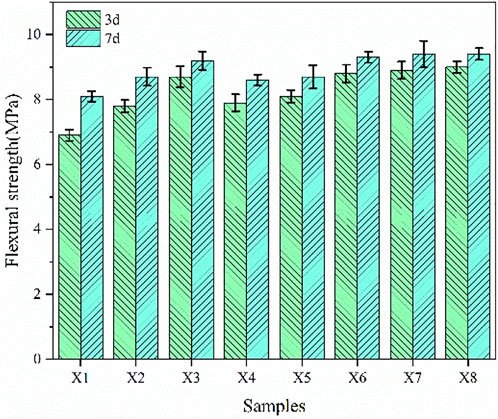
FIGURE 11. Flexural strength with different SO3 content.
According to Table 8 for cement samples with different gypsum contents under similar specific surface area, the free liquid decreases and the thickening time is prolonged as the content of anhydrite increases. The compressive and flexural strengths increase first and then decrease. The mechanical properties are relatively good when the anhydrite content is at 5%. At 5% anhydrite content, the free liquid decreases, the thickening time is shortened, and its strength continues to increase as the specific surface area increases. Considering the cost and mechanical properties, so selected sample X6 as the best sample for this experiment, that is, the anhydrite content is 5% and the specific surface area is 320 m3/kg.
According to the experimental results, it is determined that sample X6 is the best sample. Because the addition of anhydrite will cause subtle changes in the chemical composition of the cement, the finished cement product after addition of anhydrite was again subjected to fluorescence test analysis to obtain its precise chemical and mineral composition. The result is shown in Table 9.

TABLE 9. Chemical composition and mineral composition of sample X6.
From the above analysis, the Al2O3 and Fe2O3 content of sample X6 were greater than those of sample S8, while SiO2 and CaO were smaller. In terms of mineral composition, the C4AF content of sample X6 was about 3% greater than that of sample S8, the C2S content was about 1.5% greater, and the C3S was about 3.8% smaller.
4.5 Toughness and integrity analysis
4.5.1 Stress-strain cruve
Triaxial stress-strain tests were performed on samples X6 and S8 (Class G oil well cement), and the results are shown in Figure 12.

FIGURE 12. Cement paste stress-strain curve.
According to Figure 12, the elastic modulus and Poisson’s ratio of sample X6 are lower than that of sample S8, and the maximum peak stress is greater than that of sample S8, reaching 35.9 MPa. The maximum strain of cement paste reached 2.41%, which was much greater than that of sample S8. This shows that sample X6 has better toughness and better mechanical properties performance when resisting external forces. This because sample X6 contains more C4AF in the mineral composition, which reacts with Ca(OH)2 produced by cement hydration to form iron (aluminum)-rich gels: CAH, CFH. Such hydration products are filled in the pores of the hardened cement paste, and more bridging effects are generated between the hydration products, which makes the internal structure of the cement paste denser and solid. At the same time, it can withstand a certain degree of impact damage, can resist large external forces without damage and failure, and then exhibit greater strength and toughness.
4.5.2 Mechanical integrity of the cement sheath
Samples X6 and S8 were formed into a cement sheath and placed in a high-temperature and high-pressure curing kettle to simulate the downhole curing conditions. The macroscopic appearance of the cement sheath after curing is shown in Figure 13. It is clear that the overall integrity of the cement sheath is well. The mechanical integrity test was then performed on the cement sheath. The appearance of the cement sheath after failure is shown in Figure 14.
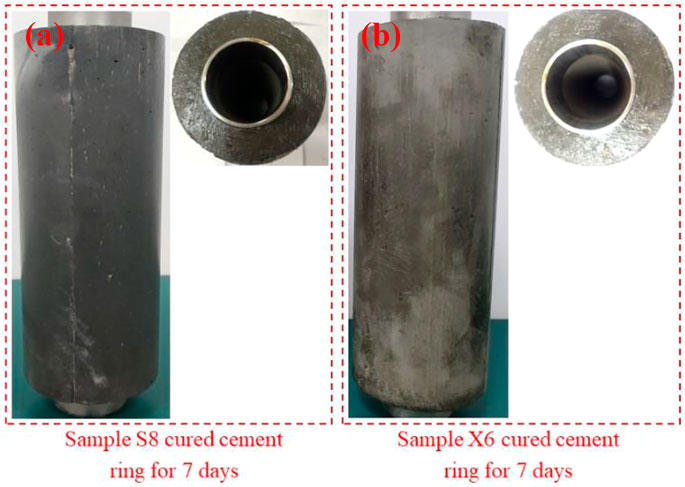
FIGURE 13. Macro morphology of cement sheath after curing at 60C for 7 days.

FIGURE 14. Macromorphology of cement sheath after cracking.
The protocol followed for the integrity evaluation test is as follows: the cement sheath was placed in the integrity evaluation device. The confining pressure and internal pressure were then applied. When the cement sheath structure was complete, no change in the number displayed on the screen indicates that there was no gas channeling in the device. However, if the display number changed, it is an indication of gas channeling, i.e. destroy of integrity structure of the cement sheath. The experimental results show that under similar confining pressure and internal pressure, the time required for sample X6 to break was longer than that of sample S8. From Figure 14, it is also clear that the cement sheath was damaged, with large cracks appearing on sample S8 that penetrated over the entire cement paste. In addition, the cemented surface between the cement sheath and the casing showed obvious shedding, indicating that it was completely destroyed. When the same test was done on X6 cement sheath, only a slight crack appeared. Cement sheath and casing were well cemented, and the integrity of cement sheath was good. This shows that X6 had better strength and toughness. Compared with the ordinary S8, it has better downhole sealing performance, better mechanical integrity, and is less prone to gas channeling.
4.6 Heat of hydration analysis
After the cement is mixed with water, heat will be generated due to the effects of hydration, hydrolysis and crystallization, which is also accompanied by the hardening of the cement sample. When cement and water first come into contact, there will be a very short but very violent exothermic process. Thereafter, the hydration products (i.e., calcium silicate hydrate, calcium sulfoaluminate hydrate and Ca(OH)2) form a coating layer with the un-hydrated cement particles, and the hydration rate sharply decreases. Under the action of osmotic pressure and crystallization pressure, the formed coating layer will gradually be destroyed, and the hydration rate of cement particles will be significantly accelerated. With the continuous progress of hydration, the cement particles as well as their hydration rate gradually decrease, and the heat of hydration gradually approaches zero. The hydration exotherms of samples S8 and X6 are shown in Figures 15, 16, respectively, as well as in Table 10.
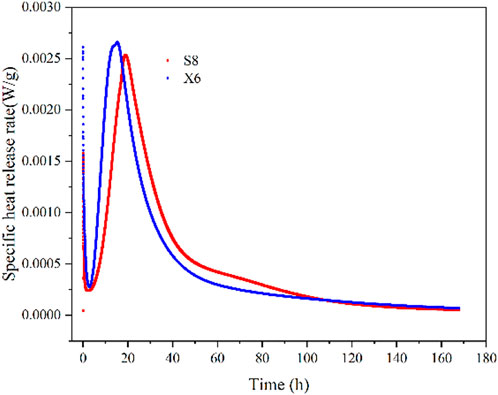
FIGURE 15. Speed of hydration heat release.
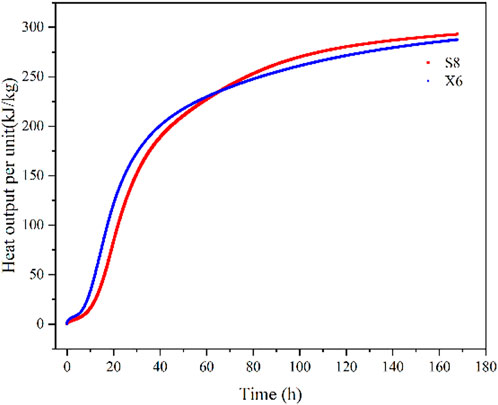
FIGURE 16. Total hydration heat release.
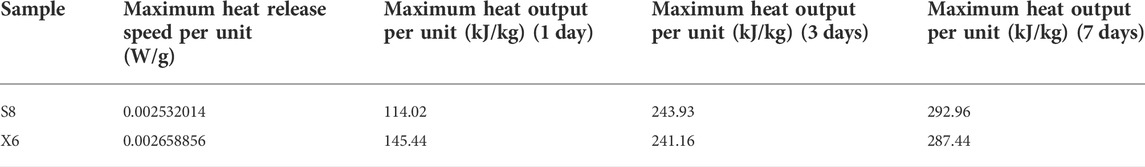
TABLE 10. Heat of hydration of samples at different ages.
According to Figures 15, 16 and Table 10, there is little difference in the overall hydration heat release between the two samples. The maximum heat release rate for sample X6 is slightly greater than that of sample S8, but the overall heat release is lower than that of sample S8. This is because of the difference in the mineral composition of the two, which leads to subtle differences in their hydration characteristics. The lower heat of hydration has a certain positive impact on reducing the thermal expansion of the cement paste.
4.7 Phase analysis
In order to explore the hydration products, XRD tests were performed on samples S8 and X6, and the results are shown in Figure 17 and Figure 18, respectively. As can be seen from the figure, the phases in S8 and X6 cement stones are similar, which are hydration product CH and unhydrated C4AF, C3S and C2S respectively. With the increase of curing time, the diffraction peak intensity of C3S in cement decreases continuously, the peak intensity of C4AF also decreases, while the peak intensity of C2S does not change significantly, and the peak intensity of CH does not increase significantly. This is due to the reaction of partial hydration product CH with partial C4AF. Comparing the XRD patterns of S8 and X6, it can be seen that the peak intensity of C4AF in X6 is higher at 1day, while the intensity of C4AF decreases significantly when curing to 7days, the peak intensity of C3S is lower, and the intensity of CH peak is stronger, which indicates that X6 The degree of hydration is more thorough, which is consistent with the previous results of mechanical property analysis.
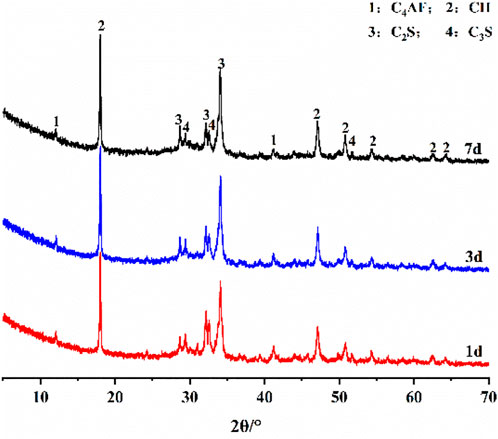
FIGURE 17. XRD pattern of sample S8.
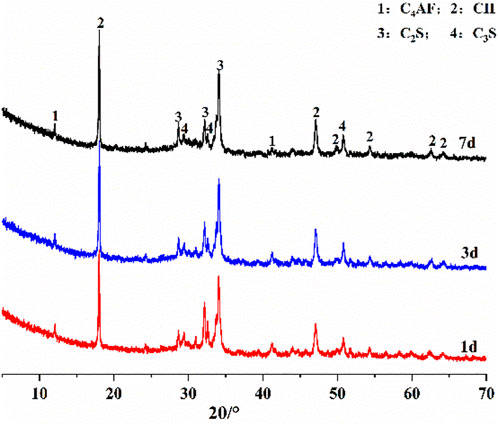
FIGURE 18. XRD pattern of sample X6.
4.8 Thermal analysis
A thermal analysis test was also performed on samples S8 and X6, and the results are shown in Figure 19.
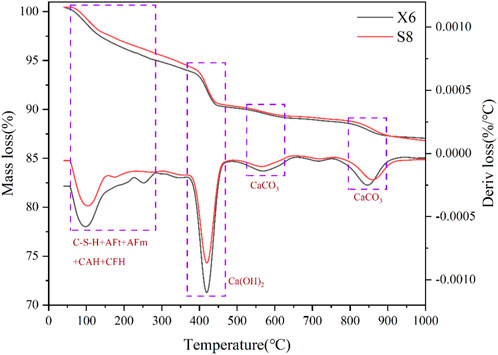
FIGURE 19. TG-DTG test.
When the temperature was in the range of 100–250°C, it was mainly water that was lost from the hydration products, i.e., C-S-H, AFt, AFm, CAH and CFH. Due to the different locations of water between the layers, the temperature associated with the water loss was also slightly different. At 400–500°C, the bond water in Ca(OH)2 was removed, and CaO was formed. At 550–600°C, CaCO3 was thermally decomposed, and CO2 was released, but at this time, CaCO3 was not completely decomposed. When the temperature reached at about 850°C, the remaining CaCO3 was decomposed. Comparing the two weight loss curves, it is seen that there is no difference in the types of hydration products, but the overall weight loss curve peak value of X6 is greater than that of S8, indicating that there are more hydration products, which also confirms the previously discussed XRD results.
4.9 Microstructural analysis
The microstructure analysis of the Class G oil well cement (S8) as well as X6 sample were carried out by scanning electron microscope, and the results are shown in Figure 20, Figure 21.
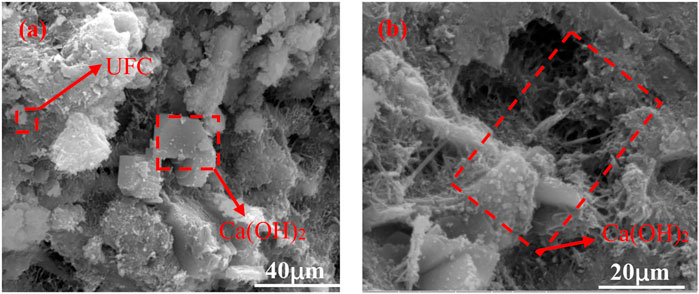
FIGURE 20. Microscopic morphology of sample S8.
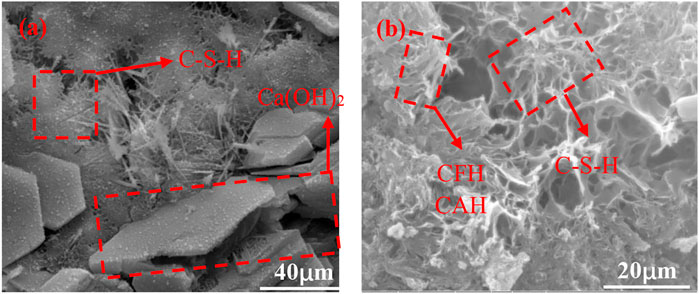
FIGURE 21. Microscopic morphology of sample X6.
Among the cement hydration products, the flaky portlandite (Ca(OH)2) crystals as well as the fiber network structure C-S-H gel constitute the main structure of the cement hardening paste. C-S-H gel is an amorphous flocculent or colloidal object, which plays a major role in the strength of cement paste. During the early stages of cement hydration, most of the cement particles will produce a gel-like film on the surface, forming Ca(OH)2 crystals and fine ettringite crystals, accompanied by some un-hydrated cement particles (UFC), as shown in Figure 20A. During this stage, there are fewer hydration products, the crystal size is smaller, and the bridge structure cannot be formed between the particles. As the curing age increases, a large amount of C-S-H gel and Ca(OH)2 are formed. At this time, a partial coating layer forms, and the cement hydration is hindered; however, the interior of the hardened cement paste is not initially connected into a network, and the strength is correspondingly improved. When the coating layer is gradually destroyed under the action of osmotic pressure and crystallization pressure, the cement particles can be further hydrated, and the resulting hydration products intersect each other and gradually connect into a whole until the cement particles are basically hydrated. In this process, the content of C-S-H, Ca(OH)2, C4 (A, F)H13 and other hydration products increase, and the gradually accumulated hydration products fill the space that was previously occupied by water, making the cement paste structure continuously dense and the strength continuously improved.
There is no obvious difference in the types of hydration products for samples S8 and X6; however, more C-S-H gels were observed in sample X6 with sizes larger than that of Class G oil well cement, intertwined with each other, with thick Ca(OH)2 crystals interposed between them, as shown in Figure 21A. Since X6 sample contains more C4AF in its mineral composition, more C4 (A, F)H13 (i.e., calcium ferrite hydrate and calcium aluminate hydrate) are seen in its microscopic appearance. Such hydration products fill the pores of the hardened cement paste, and create more bridging effects inside the cement paste, and as a result, its overall structure is denser. This allows the cement paste to withstand greater impacts without being damaged, and maintains the integrity of its mechanical structure when encountering greater external forces. In general, the high ferrite oil well cement developed in this study has good strength and toughness, which is important when it comes to the safe and efficient production of shale gas by ensuring the sealing integrity of the downhole cement sheath.
5 Conclusion
In this study, the mineral composition of oilwell cement was adjusted, and its effects on petrographic microstructure, mechanical properties and microstructure of cement clinker were analyzed. The following conclusions are derived from this research work:
1) In this study, cement samples with better mechanical properties were obtained through adjusting the mineral composition of Class G oil well cement. The 7 days compressive strength reached 45.3 ± 0.5 MPa. The 28 days strength reached a maximum value of 54.2 ± 0.5 MPa. The 7 days flexural strength reached 8.7 ± 0.2 MPa, and the 28 days flexural strength reached 9.8 ± 0.2 MPa.
2) The optimal mineral compositions (i.e., contents of C3S, C2S, C3A, and C4AF) of the new oilwell cement developed in this study were 58.34%, 16.39%, 1.51%, and 17.94% respectively, with much better compressive and flexural strength performance compared to those of the Class G oil well cement.
3) The rock facies minerals in the high ferrite oil well cement were more closely distributed, with well-developed crystal form and no obvious holes and cracks inside and at the same time excellent mechanical properties.
4) The triaxial test showed that the high ferrite oil well cement had lower elastic modulus and greater peak stress. The integrity test of the cement sheath also showed that its toughness was better, and the cement sheath and casing were cemented well.
5) The results of XRD, TG and SEM showed that more C-S-H gel and C4 (A, F)H13 were generated in the hydration product. The bridges between the hydration products were closer, the overall structure was denser, and the strength and toughness were better than those of the Class G oil well cement.
Data availability statement
The original contributions presented in the study are included in the article/supplementary material, further inquiries can be directed to the corresponding author.
Author contributions
BF: Conceptualization, Investigation, Writing—Original Draft, Data Curation KH: Validation, Resources, Writing—Review and Editing, Supervision. XY: Formal analysis, Project administration XN: Formal analysis, Project administration ZW: Resources, Funding acquisition XC: Methodology, Conceptualization.
Funding
The CNOOC’s preliminary project: Feasibility study of Wenchang 9-7 oilfield (2021PFS-05).
Acknowledgments
The authors appreciate the support of the CNOOC’s preliminary project: Feasibility study of Wenchang 9-7 oilfield (2021PFS-05). The authors would also like to thank the Advanced Cementing Materials Research Center of SWPU for their kind assistance with the experiments.
Conflict of interest
Authors BF, XY, and ZW were employed by CNOOC Research Institute Co., Ltd.
The remaining authors declare that the research was conducted in the absence of any commercial or financial relationships that could be construed as a potential conflict of interest.
Publisher’s note
All claims expressed in this article are solely those of the authors and do not necessarily represent those of their affiliated organizations, or those of the publisher, the editors and the reviewers. Any product that may be evaluated in this article, or claim that may be made by its manufacturer, is not guaranteed or endorsed by the publisher.
References
Afagwu, C., Abubakar, I., Kalam, S., Al-afnan, S. F., and Awotunde, A. A. (2020). Pressure-Transient analysis in shale gas reservoirs: A review. J. Nat. Gas. Sci. Eng. 78, 103319. doi:10.1016/j.jngse.2020.103319
Al Wakeel, S., Němeček, J., Li, L., Xi, Y., and Hubler, M. (2019). The effect of introducing nanoparticles on the fracture toughness of well cement paste. Int. J. Greenh. Gas Control 84, 147–153. doi:10.1016/j.ijggc.2019.03.009
American Petroleum Institute (2013). API RP 10B-2, Recommended practice for testing well cements, Washington, D.C., United States: American Petroleum Institute.
Bageri, B., Ahmed, A., Al Jaberi, J., Elkatatny, S., and Patil, S. (2021). Effect of perlite particles on the properties of oil-well class G cement. J. Pet. Sci. Eng. 199, 108344. doi:10.1016/j.petrol.2021.108344
Banthia, N., and Sappakittipakorn, M. (2007). Toughness enhancement in steel fiber reinforced concrete through fiber hybridization. Cem. Concr. Res. 37, 1366–1372. doi:10.1016/j.cemconres.2007.05.005
Barkoula, N. M., Alcock, B., Cabrera, N. O., and Peijs, T. (2008). Fatigue properties of highly oriented polypropylene Tapes and all-polypropylene composites. Polym. Polym. Compos. 16, 101–113. doi:10.1177/096739110801600203
Berndt, M. L., and Philippacopoulos, A. J. (2002). Incorporation of fibres in geothermal well cements. Geothermics 31, 643–656. doi:10.1016/S0375-6505(02)00028-7
Black, L., Breen, C., Yarwood, J., Phipps, J., and Maitland, G. (2006). In situ Raman analysis of hydrating C3A and C4AF pastes in presence and absence of sulphate. Adv. Appl. Ceram. 105, 209–216. doi:10.1179/174367606X120179
Cheng, X., Long, D., Huang, S., Li, Z., and Guo, X. (2015). Time effectiveness of the low-temperature plasma surface modification of ground tire rubber powder. J. Adhes. Sci. Technol. 29, 1330–1340. doi:10.1080/01694243.2015.1026958
Cheng, X. W., Khorami, M., Shi, Y., Liu, K. Q., Guo, X. Y., Austin, S., et al. (2018). A new approach to improve mechanical properties and durability of low-density oil well cement composite reinforced by cellulose fibres in microstructural scale. Constr. Build. Mat. 177, 499–510. doi:10.1016/j.conbuildmat.2018.05.134
Dahim, S., Taghavinejad, A., Razghandi, M., Rahimi Rigi, H., Moeini, K., Jamshidi, S., et al. (2020). Pressure and rate transient modeling of multi fractured horizontal wells in shale gas condensate reservoirs. J. Pet. Sci. Eng. 185, 106566. doi:10.1016/j.petrol.2019.106566
Gao, S., Dong, D., Tao, K., Guo, W., Li, X., and Zhang, S. (2020). Experiences and lessons learned from China's shale gas development: 2005–2019. J. Nat. Gas. Sci. Eng. 85, 103648. doi:10.1016/j.jngse.2020.103648
General Administration of Quality Supervision (2015). Inspection and quarantine of the people’s Republic of China. Beijing: Oil Well Cement Test Method. GB/T19139-2015.
General Administration of Quality Supervision (2015). Inspection and quarantine of the people’s Republic of China. Beijing: Oil Well Cement. GB/T10238-2015.
Guo, B., Shan, L., Jiang, S., Li, G., and Lee, J. (2018). The maximum permissible fracturing pressure in shale gas wells for wellbore cement sheath integrity. J. Nat. Gas. Sci. Eng. 56, 324–332. doi:10.1016/j.jngse.2018.06.012
Huang, J. S., and Cheng, C. K. (2004). Fracture toughness variability of foamed alumina cements. Cem. Concr. Res. 34, 883–888. doi:10.1016/j.cemconres.2003.11.006
Jafariesfad, N., Geiker, M. R., Gong, Y., Skalle, P., Zhang, Z., and He, J. (2017). Cement sheath modification using nanomaterials for long-term zonal isolation of oil wells: Review. J. Pet. Sci. Eng. 156, 662–672. doi:10.1016/j.petrol.2017.06.047
Jafariesfad, N., Khalifeh, M., Skalle, P., and Geiker, M. R. (2017). Nanorubber-modified cement system for oil and gas well cementing application. J. Nat. Gas. Sci. Eng. 47, 91–100. doi:10.1016/j.jngse.2017.10.002
Kang, S. H., Hong, S. G., and Moon, J. (2017). Absorption kinetics of superabsorbent polymers (SAP) in various cement-based solutions. Cem. Concr. Res. 97, 73–83. doi:10.1016/j.cemconres.2017.03.009
Khandaker, M., Li, Y., and Morris, T. (2013). Micro and nano MgO particles for the improvement of fracture toughness of bone-cement interfaces. J. Biomech. 46, 1035–1039. doi:10.1016/j.jbiomech.2012.12.006
Kinnaman, T. C. (2011). The economic impact of shale gas extraction: A review of existing studies. Ecol. Econ. 70, 1243–1249. doi:10.1016/j.ecolecon.2011.02.005
Kuanhai, D., Yue, Y., Yi, H., Zhonghui, L., and Yuanhua, L. (2020). Experimental study on the integrity of casing-cement sheath in shale gas wells under pressure and temperature cycle loading. J. Pet. Sci. Eng. 195, 107548. doi:10.1016/j.petrol.2020.107548
Kulga, B., Artun, E., and Ertekin, T. (2017). Development of a data-driven forecasting tool for hydraulically fractured, horizontal wells in tight-gas sands. Comput. Geosci. 103, 99–110. doi:10.1016/j.cageo.2017.03.009
Li, G., Stubblefield, M. A., Garrick, G., Eggers, J., Abadie, C., and Huang, B. (2004). Development of waste tire modified concrete. Cem. Concr. Res. 34, 2283–2289. doi:10.1016/j.cemconres.2004.04.013
Li, Y., Li, Y., Wang, B., Chen, Z., and Nie, D. (2016). The status quo review and suggested policies for shale gas development in China. Renew. Sustain. Energy Rev. 59, 420–428. doi:10.1016/j.rser.2015.12.351
Li, Y., Zhou, D.-H., Wang, W.-H., Jiang, T.-X., and Xue, Z.-J. (2020). Development of unconventional gas and technologies adopted in China. Energy Geosci. 1, 55–68. doi:10.1016/j.engeos.2020.04.004
Li, Y., Zhou, D., Wang, W., Jiang, T., and Xue, Z. (2020). Development of unconventional gas and technologies adopted in China. Energy Geosci. 1, 55–68. doi:10.1016/j.engeos.2020.04.004
Liu, K., Cheng, X., Zhang, X., Guo, X., and Zhuang, J. (2018). Design of low-density cement optimized by cellulose-based fibre for oil and natural gas wells. Powder Technol. 338, 506–518. doi:10.1016/j.powtec.2018.07.016
Liu, K., Gao, D., Wang, Y., and Yang, Y. (2017). Effect of local loads on shale gas well integrity during hydraulic fracturing process. J. Nat. Gas. Sci. Eng. 37, 291–302. doi:10.1016/j.jngse.2016.11.053
Low, N. M. P., and Beaudoin, J. J. (1994). The flexural toughness and ductility of portland cement-based binders reinforced with wollastonite micro-fibres. Cem. Concr. Res. 24, 250–258. doi:10.1016/0008-8846(94)90050-7
Lv, S. H., Deng, L. J., Yang, W. Q., Zhou, Q. F., and Cui, Y. Y. (2016). Fabrication of polycarboxylate/graphene oxide nanosheet composites by copolymerization for reinforcing and toughening cement composites. Cem. Concr. Compos. 66, 1–9. doi:10.1016/j.cemconcomp.2015.11.007
Nelson, P. K., Li, V. C., and Kamada, T. (2002). Fracture toughness of microfiber reinforced cement composites. J. Mat. Civ. Eng. 14, 384–391. doi:10.1061/(asce)0899-1561(2002)14:5(384)(2002)14:5(384)
Nobakht, M., Clarkson, C. R., and Kaviani, D. (2013). New type curves for analyzing horizontal well with multiple fractures in shale gas reservoirs. J. Nat. Gas. Sci. Eng. 10, 99–112. doi:10.1016/j.jngse.2012.09.002
Nwankwo, C. O., Bamigboye, G. O., Davies, I. E. E., and Michaels, T. A. (2020). High volume portland cement replacement : A review. Constr. Build. Mat. 260, 120445. doi:10.1016/j.conbuildmat.2020.120445
Rahman, M. M., and Rahman, M. K. (2010). A review of hydraulic fracture models and development of an improved pseudo-3D model for stimulating tight oil/gas sand. Energy Sources Part A Recovery Util. Environ. Eff. 32, 1416–1436. doi:10.1080/15567030903060523
Rammay, M. H., and Awotunde, A. A. (2016). Stochastic optimization of hydraulic fracture and horizontal well parameters in shale gas reservoirs. J. Nat. Gas. Sci. Eng. 36, 71–78. doi:10.1016/j.jngse.2016.10.002
Sobhaniaragh, B., Mansur, W. J., and Peters, F. C. (2018). The role of stress interference in hydraulic fracturing of horizontal wells. Int. J. Rock Mech. Min. Sci. (1997). 106, 153–164. doi:10.1016/j.ijrmms.2018.04.024
Soeder, D. J. (2018). The successful development of gas and oil resources from shales in North America. J. Pet. Sci. Eng. 163, 399–420. doi:10.1016/j.petrol.2017.12.084
Tian, Z., Shi, L., and Qiao, L. (2015). Problems in the wellbore integrity of a shale gas horizontal well and corresponding countermeasures. Nat. Gas. Ind. B 2, 522–529. doi:10.1016/j.ngib.2015.12.006
Wang, B., Han, Y., and Liu, S. (2013). Effect of highly dispersed carbon nanotubes on the flexural toughness of cement-based composites. Constr. Build. Mat. 46, 8–12. doi:10.1016/j.conbuildmat.2013.04.014
Wang, L., Tian, Y., Yu, X., Wang, C., Yao, B., Wang, S., et al. (2017). Advances in improved/enhanced oil recovery technologies for tight and shale reservoirs. Fuel 210, 425–445. doi:10.1016/j.fuel.2017.08.095
Wang, Y., Liu, K., and Gao, D. (2021). Investigation of the interface cracks on the cement sheath stress in shale gas wells during hydraulic fracturing. J. Pet. Sci. Eng. 205, 108981. doi:10.1016/j.petrol.2021.108981
Wenbin, C., Zhaomin, L., Xialin, Z., Bo, Z., and Qi, Z. (2009). Horizontal well fracturing technology for reservoirs with low permeability. Petroleum Explor. Dev. 36, 80–85. doi:10.1016/S1876-3804(09)60112-9
Williams-Kovacs, J. D., and Clarkson, C. R. (2016). A modified approach for modeling two-phase flowback from multi-fractured horizontal shale gas wells. J. Nat. Gas. Sci. Eng. 30, 127–147. doi:10.1016/j.jngse.2016.02.003
Won, J. P., Hong, B. T., Choi, T. J., Lee, S. J., and Kang, J. W. (2012). Flexural behaviour of amorphous micro-steel fibre-reinforced cement composites. Compos. Struct. 94, 1443–1449. doi:10.1016/j.compstruct.2011.11.031
Xi, Y., Li, J., Tao, Q., Guo, B., and Liu, G. (2020). Experimental and numerical investigations of accumulated plastic deformation in cement sheath during multistage fracturing in shale gas wells. J. Pet. Sci. Eng. 187, 106790. doi:10.1016/j.petrol.2019.106790
Xi, Y., Lian, W., Fan, L., Tao, Q., and Guo, X. (2021). Research and engineering application of pre-stressed cementing technology for preventing micro-annulus caused by cyclic loading-unloading in deep shale gas horizontal wells. J. Pet. Sci. Eng. 200, 108359. doi:10.1016/j.petrol.2021.108359
Xiaowei, C., Sheng, H., Xiaoyang, G., and Wenhui, D. (2017). Crumb waste tire rubber surface modification by plasma polymerization of ethanol and its application on oil-well cement. Appl. Surf. Sci. 409, 325–342. doi:10.1016/j.apsusc.2017.03.072
Yang, J., Wang, F., Liu, Z., Liu, Y., and Hu, S. (2019). Early-state water migration characteristics of superabsorbent polymers in cement pastes. Cem. Concr. Res. 118, 25–37. doi:10.1016/j.cemconres.2019.02.010
Yao, X., and Hua, S. D. (2007). Design of a novel composite agent for improving the toughness of oilwell cement sheath. Proc. - SPE Int. Symp. Oilf. Chem., 191–197. doi:10.2523/106010-ms
Yuan, J., Luo, D., and Feng, L. (2015). A review of the technical and economic evaluation techniques for shale gas development. Appl. Energy 148, 49–65. doi:10.1016/j.apenergy.2015.03.040
Yuan, J., Yu, Y., Liu, S., Xu, M., Li, L., and Shen, J. (2016). Technical difficulties in the cementing of horizontal shale gas wells in Weiyuan block and the countermeasures. Nat. Gas. Ind. B 3, 260–268. doi:10.1016/j.ngib.2016.05.011
Zhang, C., Li, Y., Cheng, X., Liang, S., Guo, X., Zhao, H., et al. (2018). Effects of plasma-treated rock asphalt on the mechanical properties and microstructure of oil-well cement. Constr. Build. Mat. 186, 163–173. doi:10.1016/j.conbuildmat.2018.07.133
Zhang, G., Ren, Q., He, J., Jiang, S., Cheng, X., Yu, Y., et al. (2021). New understanding of early hydration of C4AF under surface vitrification. Powder Technol. 377, 372–378. doi:10.1016/j.powtec.2020.08.098
Zhang, G., Wu, Z., Cheng, X., Sun, X., Zhang, C., and Zhou, M. (2022). Mechanical properties of high-ferrite oil-well cement used in shale gas horizontal wells under various loads. Constr. Build. Mat. 319, 126067. doi:10.1016/j.conbuildmat.2021.126067
Zhao, C., Li, J., Liu, G., and Zhang, X. (2019). Analysis of the influence of cement sheath failure on sustained casing pressure in shale gas wells. J. Nat. Gas. Sci. Eng. 66, 244–254. doi:10.1016/j.jngse.2019.04.003
Keywords: oil well cement, mineral composition, cement clinker, lithofacies, mechanical properties
Citation: Fan B, Huang K, Yang X, Wu Z, Ni X and Cheng X (2022) Study on mineral composition design and mechanical properties improvement mechanism of high ferrite oil well cement. Front. Mater. 9:1003776. doi: 10.3389/fmats.2022.1003776
Received: 26 July 2022; Accepted: 29 August 2022;
Published: 05 October 2022.
Edited by:
Hanfeng Liang, Xiamen University, ChinaReviewed by:
Qiu Jiang, University of Electronic Science and Technology of China, ChinaRenata Lorenzoni, Pontifical Catholic University of Rio de Janeiro, Brazil
Copyright © 2022 Fan, Huang, Yang, Wu, Ni and Cheng. This is an open-access article distributed under the terms of the Creative Commons Attribution License (CC BY). The use, distribution or reproduction in other forums is permitted, provided the original author(s) and the copyright owner(s) are credited and that the original publication in this journal is cited, in accordance with accepted academic practice. No use, distribution or reproduction is permitted which does not comply with these terms.
*Correspondence: Xiaowei Cheng, Y2hlbmd4d0Bzd3B1LmVkdS5jbg==