 Memduh Karalar
 Turhan Bilir2
 Murat Çavuşlu
 Yasin Onuralp Özkiliç
 Mohanad Muayad Sabri Sabri
- 1Department of Civil Engineering, Zonguldak Bulent Ecevit University, Zonguldak, Turkey
- 2Department of Civil Engineering, Istanbul-Cerrahpasa University, Istanbul, Turkey
- 3Department of Civil Engineering, Necmettin Erbakan University, Konya, Turkey
- 4Peter the Great St. Petersburg Polytechnic University, St. Petersburg, Russia
In this research, it is studied the crack and flexural behavior of reinforced concrete beams with various bottom ash ratios (BARs) considered as fine aggregate in an experimental and numerical investigation. For experimental purposes, different concrete series are considered varying aggregate sizes ranging from 0 to 25 mm. To supplement concrete, bottom ash is put to use in conjunction with material from 0–5 mm in size aggregate particles as replacement for fine aggregates with ratios of 25%, 50%, 75%, and 100%. Experiments were done to investigate the behavior of the beams and how flexural and fracture behaviors are represented. 75% BARs gave optimum results in terms of displacement capacity. Increasing BAR to 100% decrease deflection capacity of the beam. Also, ANSYS software is used to build 3D finite element models (FEMs) of beams to compare with experiment data. Experimental and 3D numerical tests show exceptionally tight flexural and fracture behaviors. Following this, a computer-generated structure is made by running SAP 2000, and the strength of the beams is then utilised in an RC structural model. Every stage of the building’s construction is thoroughly assessed utilizing multiple types of seismic testing, employing the SAP2000 program, with the resulting analysis providing significant findings on how the seismic force of 75% BAR affects horizontal displacement of each floor. The results showed that the weight of the structure dramatically decreases as the number of columns and RCBs are raised while also increasing the number of BARs. Moreover, the magnitude of earthquake and BAR have a significant effect on the horizontal displacement behavior of reinforced concrete structures. The strength of the concrete structure varies between close- and far-fault earthquakes, and for close-fault earthquakes, concrete strength is stronger than for far-fault earthquakes. This brings us to the second disadvantage of BAR which is the 75% strain produces a severe displacement of reinforced concrete structures. Besides, it was seen that the simulations and experiments yield tiny cracks with very identical configurations.
1 Introduction
Building and engineering structures suffer extensive damage from loading, including bending and cracking, under reinforced concrete. In addition, concrete structures may have structural load-bearing deterioration and column collapse. In load-bearing elements such as reinforced concrete beams (RCBs), supports, columns and floors, that are responsible for the integrity of the whole structure, the most dangerous fractures seem. For this reason, a close examination of the load-bearing parts’ bending and cracking habits is necessary to estimate the longevity and security of reinforced concrete structures. Structural elements are judged on structural safety using numerical analysis and experimental methods. In the past, researchers have measured local deformation and used 3D models to examine RCB fracture and flexural behavior. Following are the outcomes of a study into the flexibility and cracking behaviour of RCBs. One of the experiments that Kim et al. conducted was on (2021). In this experiment, a total of 20 concrete containing bottom ash (CCBA) mixtures were examined. These mixtures were divided according to their water/cement (W/C) and bottom ash aggregate (BAA) mixing ratios, and their workability and mechanical qualities were tested. The experiment results indicated that the amount of coarse BAA or lack thereof was the predominant determinant in the concrete’s mechanical characteristics and that rates of mechanical property loss caused by replacing fine BAA with coarse BAA may be moderated by other design elements such as W/C (Kim et al., 2021). An investigation in cellular concrete reinforced with fibers made of bottom ash as aggregate has yielded results that differ in findings from those obtained in an earlier study. Bottom ash from the burning of coal could serve as a good building material that helps in compressive strength, but more importantly, it can provide relief from waste concerns, according to the study (Lee et al., 2010). In yet another research, Tuncbilek Thermal Power Plant in Turkey’s coal bottom ash (CBA) was evaluated as an aggregate in aerated concrete production (Kurama et al., 2009). In this experiment, the researchers saw a notable strength boost from the autoclaved aerated concrete. The benefit is particularly obvious with concrete that contains 25% and 50% BA (Kurama et al., 2009). A research done on concrete made using ground fly ash, bottom ash, and rice husk ash looks at how much chloride penetrated the concrete. The study investigated how compressive strength and chloride penetration resistance are affected by testing the impacts of mixing together the ground fly ash (GFA), ground bottom ash (GBA), and ground rice husk ash (GRHA) with cement as a partial substitute (Inthata and Cheerarot, 2014). An exhaustive investigation was conducted on the mechanical qualities of concrete, comparing various mixes with different proportions of waste bottom ash as natural aggregate. This research compiled an assessment and comparison of all major international code systems. In addition, new models for determining the mechanical properties of concrete containing base ash were proposed (Nikbin et al., 2016). Sintayehu and Dessalegn (Sintayehu and Mamaru, 2019) conducted another study. The weight of the cubes reduced as the proportion of corncob ash rose; concrete cubes weighed less than 15% after using corncob ash to replace. Additionally, another experiment was conducted to examine the unique properties of concrete that are mixed with both Rice Husk Ash (RHA) and Fly Ash (FA) as a substitute for cement (Andrade et al., 2007). The major purpose of this investigation is to examine the outcome of concrete during slump tests, together with indirect tensile and compressive strength. In comparison to the standard sample, the compressive strength was 16.14 percent higher, and the indirect tensile strength was 15.20 percent higher in the sample with 5 percent RHA+5 percent FA after 28 days (Andrade et al., 2007). The study by Mangi et al. (Mangi et al., 2019) aimed to investigate how using coal bottom ash for concrete works and what effects the particle fineness has on the material’s strength. Using ground CBA as a partial cement replacement in some samples, the material was varied from having zero to 30 percent of the cement’s weight replaced by CBA. Workability was reduced since more ground CBA has soaked up extra water, which makes it heavier and harder to utilize (Mangi et al., 2019). In a study, there is strong evidence showing that using CBA (up to 10 percent as a replacement material for Portland cement) will be beneficial to concrete. This can be advantageous to the concrete business, especially as it relates to its mechanical qualities (Kurama and Kaya, 2007). A research demonstrated that transverse crack widths were nearly unchanged by reinforcement corrosion, but transverse crack spacing varied only little from the effects of reinforcement corrosion (Zhang et al., 2018). The final study comes from Karalar. (2020). This investigation studied and modeled how experimental and 3D finite element analysis reflected the impacts of bottom ash on RCBs. It was found that the flexural and crack impacts on the RCBs were varied for each ash ratio in the concrete mixture based on the results of the experiment and the numerical simulation. Further, another report talked about rice husk ash serving as a substitute cement ingredient like 5%, 10%, and 15% (with 10%, 20%, 30%, and 40% of fine aggregates substituted with coal bottom ash) in concrete (Bheel et al., 2021). Workability and water absorption decreased with greater amounts of rice husk ash and coal bottom ash, as found in the study (Bheel et al., 2020). Additionally, Andrade et al. ran a second investigation (Andrade et al., 2007). In this investigation, a report on the use of thermoelectric power station waste, also known as bottom ash, as a substitute for natural sand in the manufacturing of concrete was presented. The study findings demonstrated that the bottom ash in concrete gets wetter, which correlates with worse moisture transfer (Andrade et al., 2007). Rafieizonooz et al. (2016) investigated the coal bottom ash and fly ash in concrete as replacement for sand and cement. It was seen that flexural and splitting tensile strengths of the experimental mix containing 75% bottom ash and 20% fly ash exceeded much more than the control sample. As can be seen from the previous studies, there are many studies on concrete performance using waste materials (Ghafoori and Bucholc, 1996; Topçu and Bilir, 2009; Topçu et al., 2009; Topçu and Bilir, 2010a; Bilir, 2012; Singh and Siddique, 2013; Bilir, 2016; Lee et al., 2019; Karalar et al., 2022; Çelik et al., 2022; Qaidi et al., 2022; Aksoylu et al., 2022a) and other materials such as composite (Alam and Hussein, 2017; Truonga et al., 2017; Araba and Ashour, 2018; Bicer et al., 2018; Deng et al., 2018; Mahmood et al., 2018; Xu et al., 2018; Marvila et al., 2019; Azevedo et al., 2020; Wang et al., 2020; Azevedo et al., 2021; Özkılıç et al., 2021; Akın et al., 2022; Al-Rousan and Al-Muhiedat, 2022; Aksoylu et al., 2022b; Gemi et al., 2022; Huang et al., 2022; Lu et al., 2022; Tran et al., 2022; Özkılıç et al., 2022) in the literature. Researchers have identified differences in the properties of concrete, but few have discussed how the trade-offs of using a fine natural aggregate in place of a typical Portland cement (PC) mix. Another problem is that investigations into the weight of the final concrete building built using a base ash ratio to replace fine aggregate are nearly non-existent. The study backs up numerous ideas in the literature.
2 Aim of study
The impact of BARs on the fracture and flexural behavior of RCBs is examined in depth in this work. Five different RCBs (300 × 400 × 2000 mm) are produced in the laboratory for this purpose, and five different BARs are employed in these RCBs. These BARs are used to replace 0–5 mm grain size aggregates in the following proportions: 0%, 25%, 50%, 75%, and 100%, respectively. The impact of various BARs on the consistency of fresh concrete is first investigated. Five separate slump tests are performed for these various BARs for this reason. Then, to make standard cube specimens, 15 distinct concrete specimens (CSs) for different BARs (3 CSs for each BAR) are formed into molds with dimensions of 150 × 150 × 150 mm. These cube specimens are kept in water for 28 days to cure. These RCBs’ mechanical properties are then determined (e.g., elasticity modulus). These samples are put through a compressive strength test to determine their compressive strength. One of the main goals of this research is to see how different bottom ash fine aggregate ratios affect the fracture and flexural behavior of RCBs. In the laboratory, the RCBs generated in this manner were subjected to bending and cracking tests. RCBs are subjected to a total of 20 tons of vertical loads during testing. With the use of experimental experiments, the bends and cracks in RCBs are researched and shown in depth. In addition, in this study, 3D numerical analyses are performed and verified by comparing experimental data. ANSYS is used to model 3D FEMs of RCBs for this purpose. Bending and cracking are determined in 3D models of RCBs using numerical analyses, and these cracks and bends are found to be very close to experimental fracture data. This study then evaluates the influence of bottom ash replacement ratio on the weight of reinforced concrete structures. The impacts of these BARs on the overall weight of a reinforced concrete structure are modeled using SAP2000 software, and the effects of these BARs on the total weight of the structure are evaluated in detail. Finally, the influence of 75% BAR (as an average ratio to provide acceptable concrete strength and unit weight) on the nonlinear seismic horizontal displacement behavior of a reinforced concrete structure is investigated, using three separate earthquakes as an example. The impacts of bottom ash fine aggregate replacement ratio on the seismic displacement behavior of concrete structures are clearly explained in detail based on seismic analysis results.
3 Experimental test set-up and material properties
3.1 Tests for material properties
Bottom ash from coal must be recycled to safeguard the environment. In other words, the fly and coal bottom ash utilized in Zonguldak, Turkey, helps the country’s sustainability significantly. In addition, determining the current and future safety of structures that use reinforced concrete by examining the cracks and bends in the beams is crucial. Bottom ash with a variety of proportions is recycled depending on the ratio of bottom ash in each RCB. It will be necessary to learn about concrete’s mechanical properties by using laboratory tests. The results of the experiments, shown in Table 1, detail the specific concrete mixes that were made in the lab for various proportions kinds. Experimental test methods involve the use of multiple various BARS. These figures are 0%, 25%, 50%, 75%, and 100%. Bottom ash is used in concrete formulations to replace 0–5 mm particle size aggregates. The mixing ratios are explained thoroughly in Table 2.
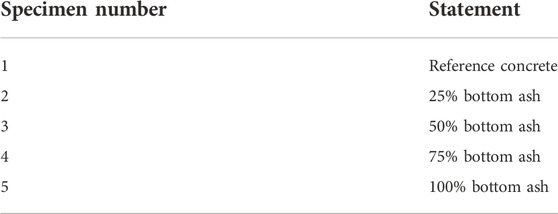
TABLE 1. CSs for different BARs.
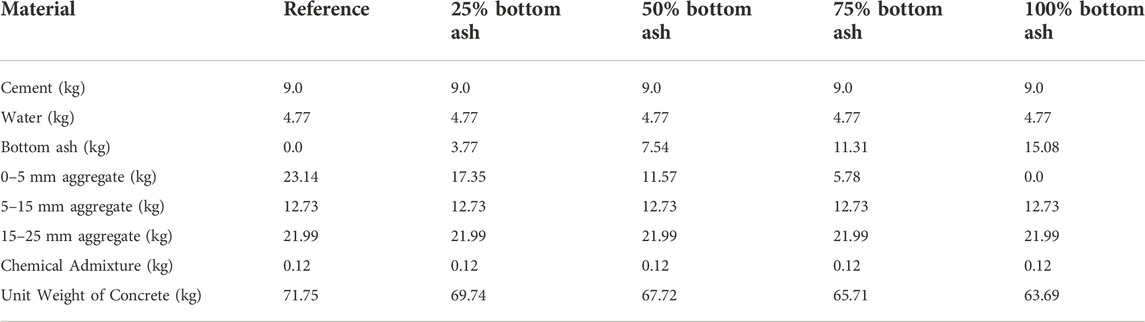
TABLE 2. Components in the CSs and weight per unit of components (Karalar, 2020; Karalar et al., 2020).
The table reveals that the reference concrete has no bottom ash fine fines, and the increase in the percentage of CSs (compressive strength) from 0% to 100%. The cube examples were produced with 15.0832 kg of concrete and a 100% yield for maximum strength. The two main elements of concrete cube examples are 9 kg cement and 4.77 kg water. Pozzolanic cement that uses CEM IV/B (P) 32.5 N/R is used in the concrete samples. Table 3 contains cement composition. In addition, local tap water is used in Zonguldak. Five concrete mixture series are created using aggregate weights of 5–15 mm and 15–25 mm. The actual weight of aggregates is approximately 12.732 kg (5–15 mm aggregate) and 21.990 kg (15–25 mm aggregate). Superplasticizer is used in concrete mixes to both reduce the amount of water necessary and increase the durability of concrete. The bottom ash utilized as fine material at the Çatalağzı Fossil Fuel Thermal Power Plant comes from Zonguldak. When looking at five samples of different concretes, the reference concrete’s maximum unit weight is 71.76 kg, and 100% base ash ratio has a minimum unit weight of 63.70 kg. The findings in this experiment show that the lower the base ash ratio in the concrete mixture, the lower the concrete’s unit weight will be. Next, slump tests are done for each concrete mixture. Figure 1 shows the results of the slump test for many CSs. Slump levels increased depending on bar placement. Concrete slump measurement values were obtained, and a reference value of 4.9 cm was observed.
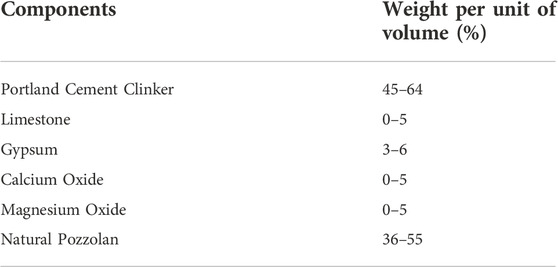
TABLE 3. Cement composition (Karalar, 2020; Karalar et al., 2020).
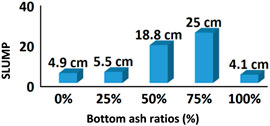
FIGURE 1. Slump test results for different BARs in the concrete.
When 5.5 cm slump is acquired for 25% BAR, this has been shown to have an influence on concrete consistency. 50% of them think it gets 18.8 cm of the droop, and 25 cm is the most possible. There is a 75% drop in the price of BAR. But in this situation, it is rather evident that the slump value dropped, and 4.1 cm is the minimal slump in concrete for 100 percent BAR. This data clearly demonstrates that when the base ash ratio of the concrete mixture was increased from 0% to 75%, the concrete consistency increased significantly. Similarly, we’ve found in the concrete mix a rise in the proportion of material with higher consistency. These experimental results are employed in the 3D analysis of RCB cracks and flexures. To understand how much force is behind this concrete series, concrete blocks with a wide range of BARs are cast into a mold with dimensions of 150 mm × 150 mm x 150 mm. 15 distinct concrete strengths (CSs) are generated using standard cube specimens collected from five concrete series with varying levels of bottom ash replacement. They spent 28 days at temperatures of between 20 and 22°C. Then, the concrete samples are removed from the moulds, and their compressive strengths are examined. In order to analyze 3D cracks in RCBs, one needs to use compressive strength and concrete grades. The following load-carrying capacity-time graphics are shared for the different CSs. Additionally, you will see the compressive strength outcomes from each concrete in Table 4.
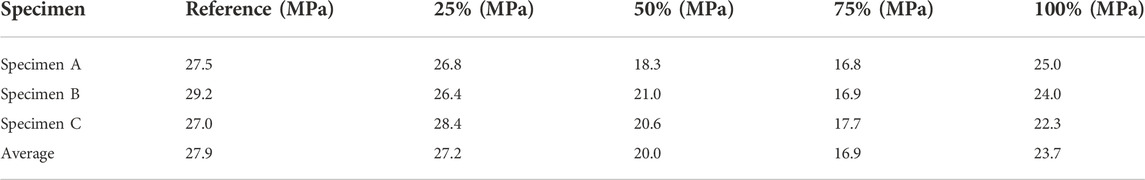
TABLE 4. Compressive strength test results for concrete series.
TS EN 12390–3 standard was taken into consideration while performing pressure tests. According to this standard, while performing compressive tests, a fixed load is applied as 0.6 MPa/s (N/mm2.s). The load shall be applied to the sample at a constant speed until the maximum load is reached, without the effect of impact, so that the deviation from the selected speed does not exceed ±10%. The load-time graphic is included in Figure 2A for reference purposes. On average, we get 627.66 kN of load-carrying capability from the use of three distinct CSs. Specimen A’s compressive strength is 27.517 MPa. For comparison, both specimens are also thought to have similar compressive strengths: 29.219 MPa for Specimen B and 27.011 MPa for Specimen C. For context, here’s what we know about compressive strength: it's 27.915 MPa. It is apparent that the bearing load of the reference concrete is greater than the average max. bearing the load of the three concrete samples. Specimen B’s peak load is measured at 639 kN, whereas the total load carrying capacity of the three CSs at 25% is 612.3 kN. The compressive strength of this BAR is additionally 27.231 MPa. Figure 2C exhibits the compressive strength outcomes at 50% BAR. A big increase in the amount of steel in the concrete resulted in the maximum load-carrying capacity for concrete falling. For Specimen C, a maximum load of 473 kN is seen, while Specimen A exhibits a minimum load of 412 kN. 50% BAR compressive strength is at 20.010 MPa. According to Figure 2D, 386 kN max. load carrying capacity is observed for Specimen B and 381.66 kN average carrying load is found for three different CSs. Constant decreases in max. load bearing capacity is found when 0 percent, 25 percent, 50 percent, and 75 percent BARs are related to one other. Though the researchers noted that maximum weights were between 75% and 100% heavier for 3 CSs, they discovered that concrete with 100% BARs had a load of up to 562 kN.
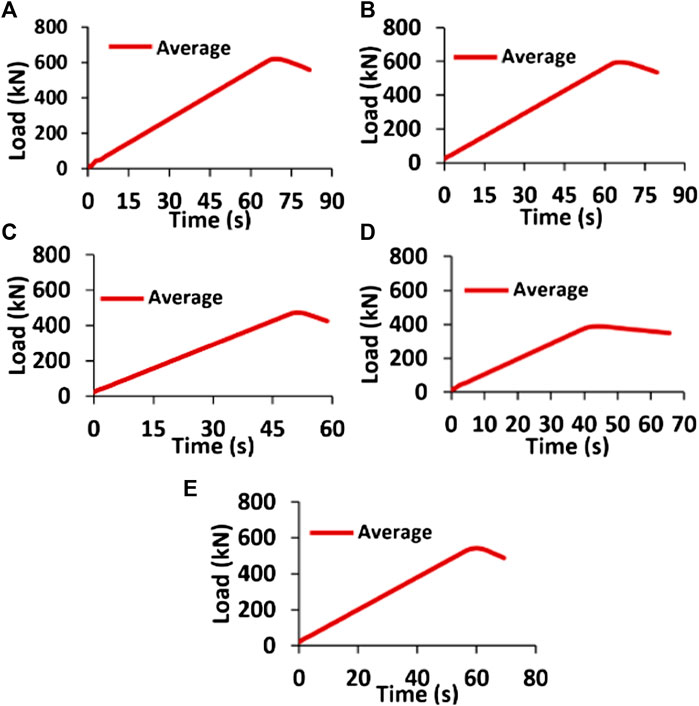
FIGURE 2. Load-Time graphics for; (A) reference concrete, (B) 25% bottom ash, (C) 50% bottom ash, (D) 75% bottom ash, (E) 100% bottom ash.
3.2 Experimental set-up
The details of the experimental RCB set-up are described in this section. Figure 3 shows the test setup. Figure 3 and Figure 4A shows the RCB is supported by one pin and one roller. The LVDT utilized to detect displacement at the RCBs is ±250 mm long, as is illustrated in Figure 3. The load-cell, an instrument that can measure a ton’s worth of weight, is also utilized to test the strength of the RCBs. Moreover, the experimental fowchart is shown in Figure 4B. The vertical load exerted and displacements are measured by a TDG-Ai8b model data-logger and stored on a hard-disk connected to the device via computer (Karalar, 2020). Moreover, the Turkish Earthquake Code was taken into account while conducting the experiments.
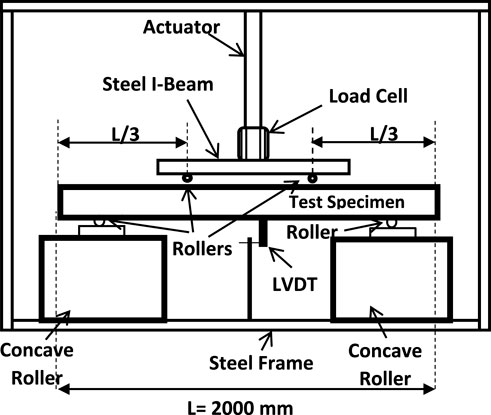
FIGURE 3. Loading configuration for static testing (Karalar, 2020; Karalar et al., 2020).
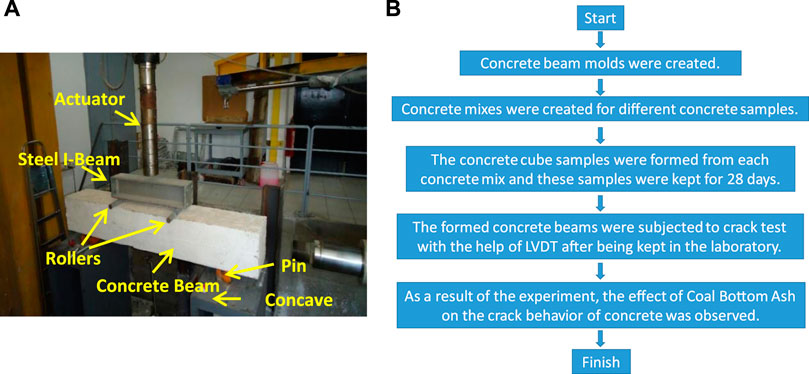
FIGURE 4. (A) Static testing apparatus (Karalar, 2020), (B) experimental flowchart.
4 Experimental test results and discussion
In this part, we can see how Bar has affected crack and flexure behavior in RCBs. The RCBs that are created in the lab are then tested for cracks and flexing. It’s noticed that the RCBs were cracked in several places, and after they examined each location closely, it’s been discovered that each fracture pattern was unique. Deflections were seen in each RCB’s results, and these might be attributed to the varying dimensions of the BARs used. Different RCBs are loaded differently, which is critical to analyzing the impact of BAR on the RCB’s cracking and flexural behavior. Table 5 illustrates that five separate RCBs have been confirmed as being authentic in this study.
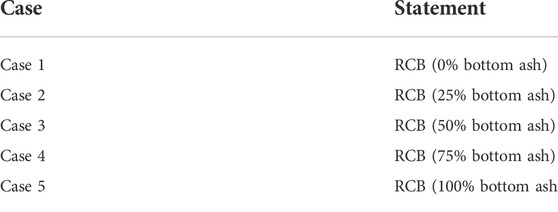
TABLE 5. RCBs for five different experimental test cases.
4.1 Case 1: Deflection behavior under static loading of reinforced concrete beams with cracks
A study found significant cracks around the vertical load of the reference RCB, as discovered via experiments. In this section, the results of the deflections in the reference RCB under vertical load are shown. These were measured with the LVDT device, and the results were reported. The 3.96 cm crack occurred in the RCB gap during the 85th second of the test. The results demonstrate the extent of the fracture clearance, which may be expected for vertical loading. This illustration shows an important crack could appear in RCBs when there is a heavy load and that dangerous flexural cracks are occurring. It is clear that vertical fissures are possible in the RCB, as these locations demonstrate. More importantly, the reference RCB has vertical cracks 150 mm apart. The locations of the max shear cracks are clear: the top of the RCB where the load was applied, then to the bottom of the beam. Reference RCB load-deflection curve Figure 5 displays. Based on the results in Figure 5, the maximum deflection of 3.89 cm was recorded when the beam had already become unable to hold any more weight. And therefore, the RCB can support 228.9 kN and exhibit a 3.89 cm deflection under vertical load. The results shown plainly include a wealth of information on the reference RCBs’ load-carrying capacity.
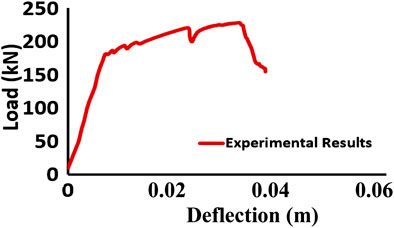
FIGURE 5. Load-Deflection behaviour of reference RCB under vertical loads.
4.2 Case 2: Crack and load of 25 percent bottom ash reinforced concrete beams deflection behavior
This portion contains a detailed evaluation of the effects of 25% BAR on the crack and flexural behavior of the RCBs. The RCB vertical loads bring the deflections to light. Looking at Figure 6, it is apparent that the recorded displacements are provided. It is necessary to examine the load-deflection behavior of an RCB having 25% bottom ash, which is what this graph helps us to accomplish. It was shown that, with a 3.81 cm deflection, the load-carrying capability of this RCB is 219.0 kN (Figure 6). Furthermore, a maximum deflection of 4.01 cm and a load of 153.0 kN is detected at the end of the test. Bottom ash is definitely visible in how it influenced the deflection-load behavior of the RCB. In contrast to 25% bottom ash reference RCB, critical cracks and deflection variations are seen. Reference RCB’s 25% bottom ash mixed concrete detects a greater number of deflections compared to mixing the same amount of bottom ash with the concrete.
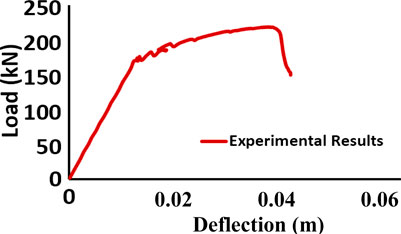
FIGURE 6. Crack-Time behaviour of RCB with 25% bottom ash.
4.3 Case 3: Crack and load-deflection behaviour of 50% bottom ash reinforced concrete beams under static loading
This section investigates the influence of half a bar on the crack and deflection behavior of RCBs. There are noticeable cracks and deflections in the RCB because of 50% BAR. Figure 7 show the test findings. Flexural cracks are visible in the RCB, and the maximum number of flexural cracks was found to be located in the middle of the RCB. Also, the highest flexural crack was found where vertical loads were applied. When 25 percent and 50 percent RCBs are compared to each other, it was found that 50 percent BAR had the largest cracks. Based on the results, we can conclude that the performance of RCBs was affected by BAR. The maximum deflection in the RCB, according to Figure 7, is 4.24 cm. When the RCB hits its maximum cracks, the experiment is over, and the maximum load is 163.0 kN. Comparing reference RCB (which contains 25% and 50% bottom ash) with RCB- 25%, it is easy to see that the greater the percentage of bottom ash in the concrete, the more pronounced the movement (i.e., deflection) of the load will be.
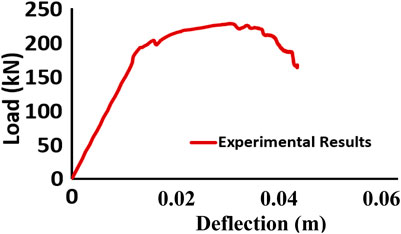
FIGURE 7. Crack-Time behaviour of RCB with 50% bottom ash.
4.4 Case 4: Crack and load-deflection behaviour of 75% bottom ash reinforced concrete beams under static loading
This study tests the effects of 75% BAR on the cracking and bending behavior of RCBs. In Figure 8, the experimental test results for 75% BAR are provided. The maximum crack width of 4.03 cm was measured, and it occurs where the force is applied. It is clear observed this that 75 percent BAR is the worst of the bunch. In short, the percentage of bottom ash you mix in is proportionate to the cracks you get in your RCB. This finding illustrates how BAR changes crack behaviors in RCBs. In Figure 8, you will find a vertical load load-deflection graphic of RCB. The Max. load-carrying capability of RCB is found to be 238.0 kN, as seen in Figure 8. Furthermore, the RCB is known to have a max. deflection of 5.86 cm. This finding appears quite meaningful. The bottom ash with a higher ash content has the greatest deflection in comparison to the ash of 25 percent, 50 percent, and 75 percent. To sum it up, as vertical load goes up, so does the maximum deflection as long as the length of BAR grows.
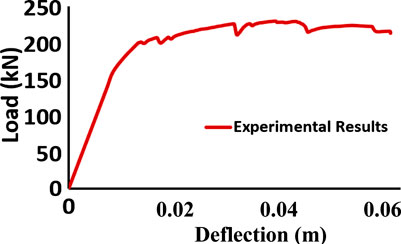
FIGURE 8. Crack and flexure behaviour of RCB with 75% bottom ash.
4.5 Crack and load-deflection behaviour of 100% bottom ash reinforced concrete beams under static loading
The influence of a 100% BAR bar load on the crack and flexure behaviors of the RCB is studied in this section. Deflection in the RCB is tracked with the help of an LVDT, and the results are seen in Figure 9. Vertical cracks in the RCB are an important evaluation criterion for the safety of RCBs. It was discovered that the widest cracks in the structure occur where a vertical load is applied, similar to earlier RCB designs. The load-deflection curve for 100% bottom ash fine aggregate in RCB is shown in Figure 9. Deflection occurs when an RCB is carrying a load of 244.2 kN, and this measurement is taken (Figure 9). Deflection increases under vertical stress as the bottom ash replacement ratio rises with five RCB series under comparison. Deflection in the RCB increases when the BAR climbs from 0 percent to 75 percent. While deflection value falls for 75% and 100% BARs, this is not the case for the 25% and 75% BARs.
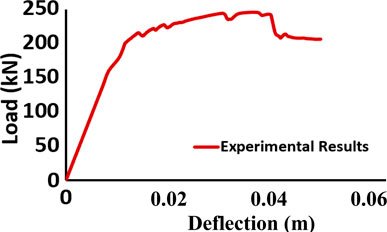
FIGURE 9. Crack and flexure behaviour of RCB with 100% bottom ash.
5 3D finite element model of reinforced concrete beams
3D finite element modelling is a smart way to display cracks and flexures in RCBs. Therefore, experimental tests are definite by 3D finite element analyses and 3D model of RCB is made according to planned dimensions of beam. While building 3D models of RCBs, original beam specimens formed in the laboratory are taken into account. 3D FEMs of RCBs are displayed using ANSYS (ANSYS, 1998) software based on the FEM. For five different 3D FEMs, all compression reinforcements, tension reinforcements and stirrups are modelled considering original geometries of RCBs (Karalar, 2020; Karalar et al., 2020). Total two reinforcements are used for compression reinforcements at top section of the beam and three reinforcements are considered for tension reinforcements at bottom of the beam (Karalar, 2020; Karalar et al., 2020). 12 mm diameter reinforcements are used for compression and tension reinforcements. Moreover, 8 mm diameter reinforcements are taken into account for stirrups. In the numerical analyses, special element types and material models for concrete and reinforcement are used. SOLİD65 nonlinear element type is considered for concrete, and LINK80 element type is used for compression and tension reinforcements (Karalar, 2020; Karalar et al., 2020). This element types are not randomly considered in this study. In the ANSYS software, these special element types are created for concrete and reinforces and these element types are taken into account for concrete and reinforces (Karalar, 2020; Karalar et al., 2020). In addition, for concrete, nonlinear multilinear misses’ plasticity material model is used and nonlinear bilinear misses’ plasticity material model is used for compression and tension reinforcements (Karalar, 2020; Karalar et al., 2020). These material models are special models for concrete and reinforces in the ANSYS software (Karalar, 2020; Karalar et al., 2020). Planned reinforced concrete beam for 3D finite element model is presented in Figure 10. Moreover, stirrups, compression and tension reinforces in the concrete beam are shown in Figures 10, 11. Details of 3D model of RCB is reported in Figure 11.
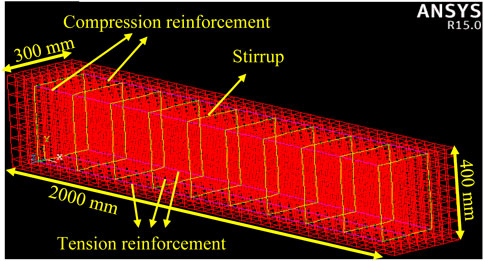
FIGURE 10. View of stirrups, compression and tensile reinforcements in the 3D model of RCB (Karalar, 2020).
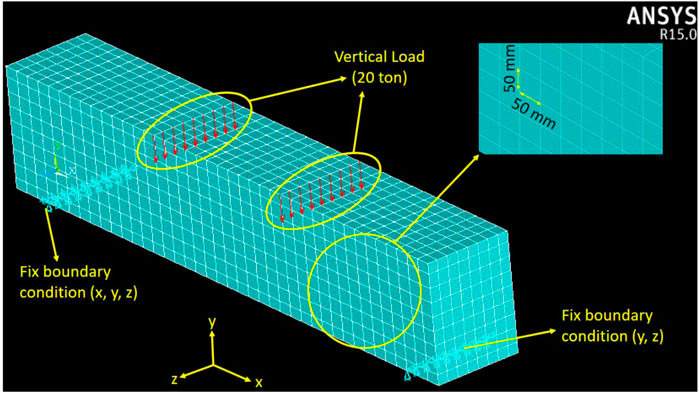
FIGURE 11. View of vertical loads and boundary conditions in the 3D model of RCB (Karalar, 2020).
6 3D finite element analysis results
The section focuses on studying how different BARs influence 3D FEM outcomes with different RCBs. 3D evaluations are conducted for different BARs of RCBs with 5. Figure 12 demonstrates the flexure and crack studies for RCBs. Figure 13 includes 3D numerical findings for the reference RCB. The middle of the RCB had maximum deflection, whereas the sides of the reference RCB demonstrated minimum deflection. Max. RCB deflection is −3.88 cm. This finding shows how vertical load impacts the movement of RCBs. The maximum deflection of reference RCB (3.89 cm) and RCB’s 3D-model maximum deflection (3.88 cm) were identical. The RCB’s maximum deflection results are nearly identical. Reference RCB’s experimental results are obviously accurate based on the new 3D numerical analysis. Cracks in the RCB are influenced by vertical stress (as seen in Figures 13B,C). These cracks are near the experimental results’ results. The RCB has many large vertical and bending cracks. Place where there are vertical loads also cracked the most.
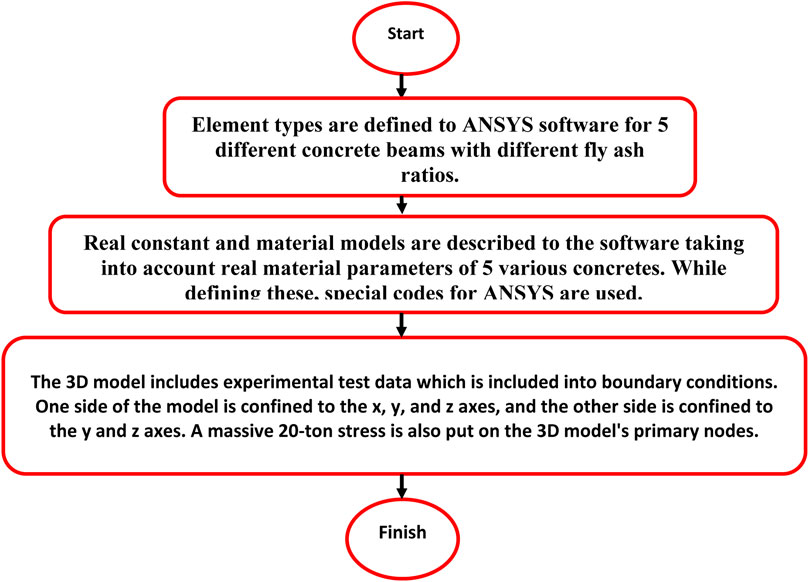
FIGURE 12. Numerical analysis algorithm for numerical analyses.
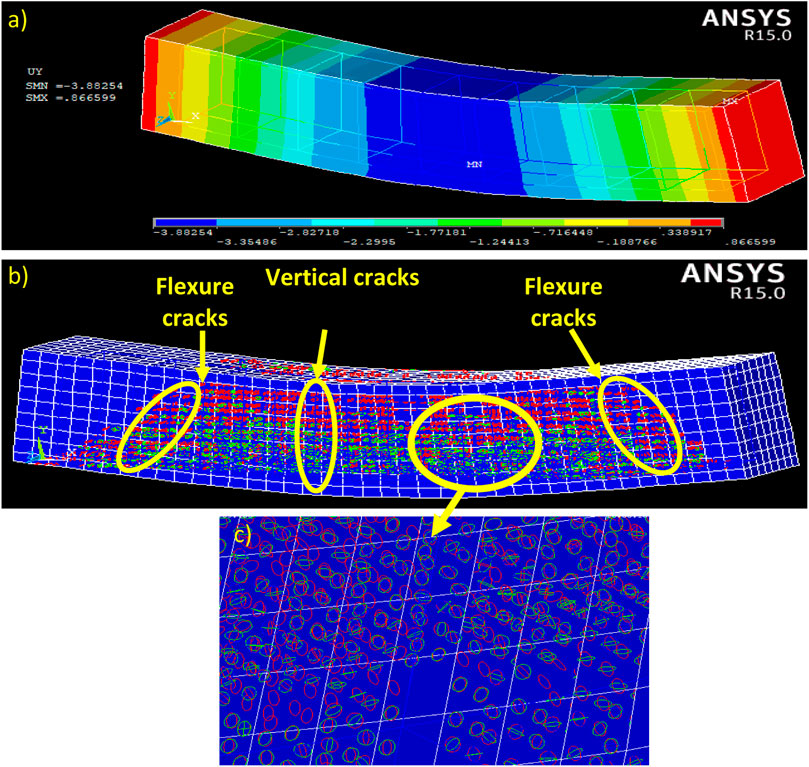
FIGURE 13. 3D finite element analysis results for reference concrete, consisting of a contour plot (A), an image of cracks in the RCB (B), and close-up images of cracks (C).
In Figures 14–17, contour plots display fracture and flexure characteristics for four different RCB series. These RCBs have noticeable variations in the size and shape of their structural cracks and flexures, as discovered in the 3D FEM modeling. Figure 14 shows how RCB with 25% BAR can be accomplished. At the midpoint of the RCB, it had the most degree of deflection, while at the ends, it had the least. The two extremes were found to be 0.89 cm and -4.02 cm. The result of the experimental test with an expected deflection of -4.01 can be confirmed by a 3D finite element analysis. A close-up view of fissures with 25% bottom ash (Figure 14B) is included as well. At the middle of the RCB, the greatest number of cracks were recorded, and at the top, the smallest number of cracks appeared. The 3D models and the experimental findings do not have a large variance between the cracks.
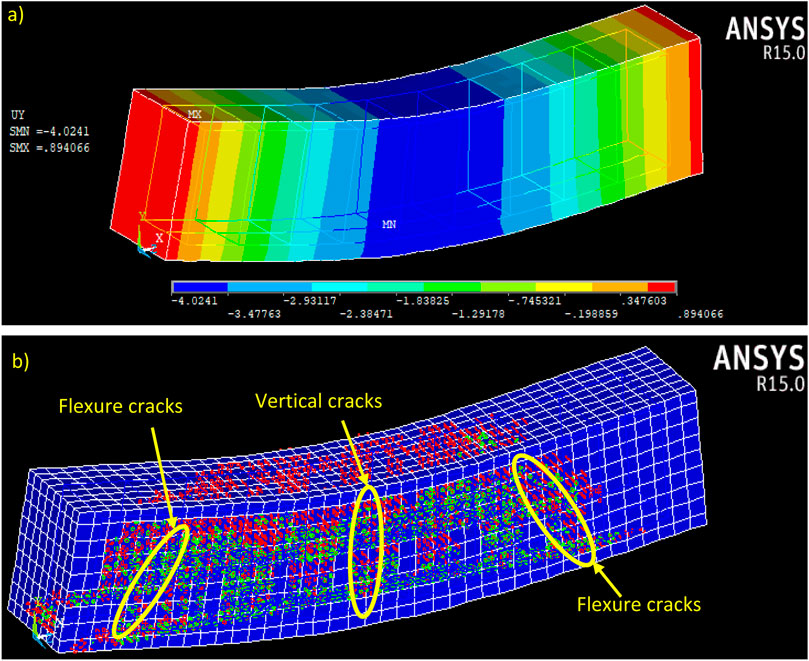
FIGURE 14. Bottom ash added to concrete causes cracks in the RCB. Bottom ash increases the width of the cracks. 3D finite element analysis results are displayed in (A) as a contour plot and (B) showing the cracks.
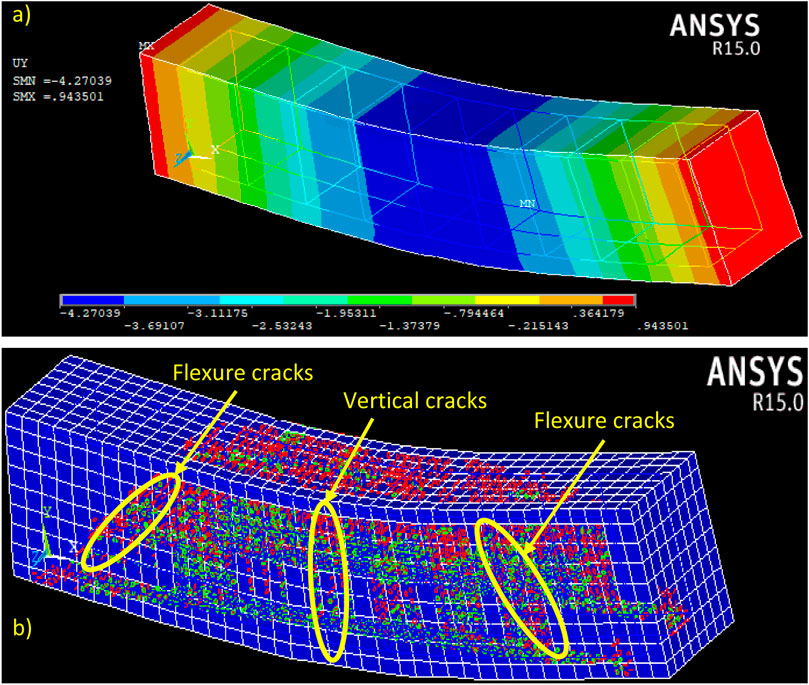
FIGURE 15. The 3D finite element analysis on concrete with 50% bottom ash shows results that may be seen on (A) contour plots, and (B) a view of the fractures in the RCB.
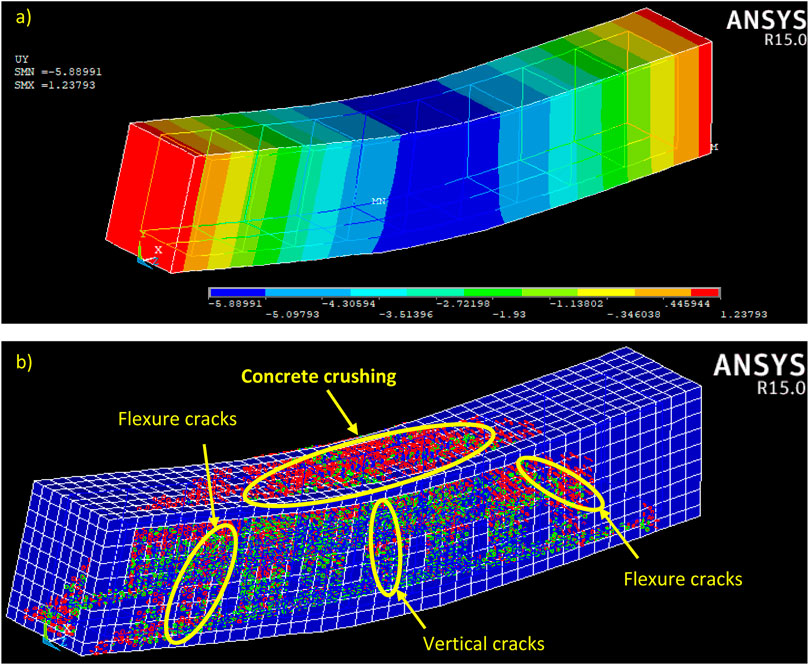
FIGURE 16. The 3D finite element analysis on concrete with 75% bottom ash shows results that may be seen on (A) contour plots, and (B) a view of the fractures in the RCB.
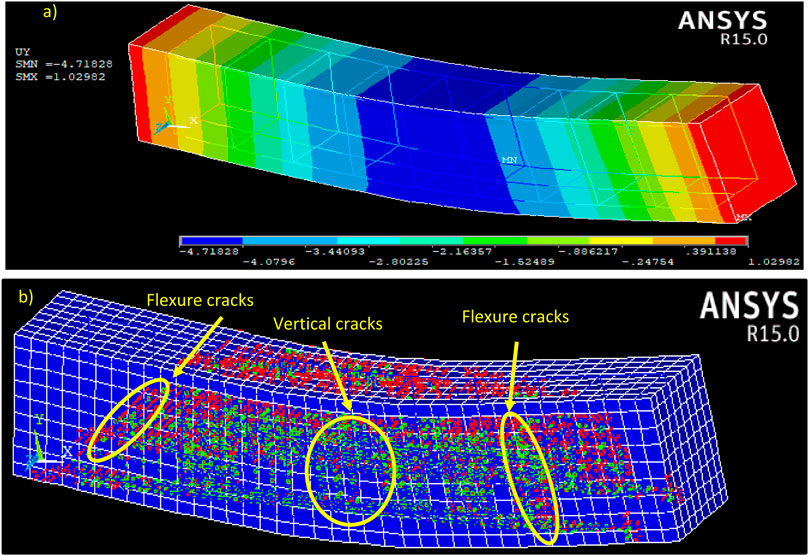
FIGURE 17. The 3D finite element analysis on concrete with 100% bottom ash shows results that may be seen on (A) contour plots, and (B) a view of the fractures in the RCB.
As discovered by RCB, using half of the bottom ash gives completely different fracture and flexure values than other numerical results (Figure 15). -4.27 cm at most as the RCB moves to the middle, it picks up some deflection, and only slight deviations appear at the sides of the RCB. Deflection for RCB is improved when using 50% of BAR, rather than 0% or 25% of BAR. Experimental and numerical results are extremely similar, as is typical for RCBs with a fine aggregate mix of 25% BAR. Experiments show +4.24 cm max. The centre of the RCB experienced deflection of -4.27 cm, as 3D numerical calculations revealed. Experimental findings are corroborated using 3D computer models. The RCB was found to have a multitude of significant cracks, which are right next to the experimental crack. More notably, vertical cracks and flexure cracks were discovered at the point where the load was applied and where vertical cracks had happened in the middle of the RCB.
Large cracks and deflections are seen in the RCB with 75% BAR, as seen in Figure 16. The midsection of the RCB recorded the most deflection (–5.88 cm). Bottom ash RCB results in 5.86 cm deflection for 75% of the experiments. And hence, the experimental and numerical results appear quite near to one another, as seen in Figure 16B.
Figure 17 represents the deflection and cracking behavior of RCB with 100% bottom ash. Max. The RCB deflected at about its midpoint, and the number is -4.71 cm. Besides, experimental max. deflection value of 100% bottom ash added RCB is measured as -4.73 cm. The cracks we’ve obtained are quite a bit farther along than expected and extend all the way to the edges of the door. In most numerical models, it is found that increasing the amount of bottom ash fine aggregate to up to 75% in concrete mixture yields the highest strength. When put into RCB, deflection values go up, as confirmed by the results of an experimental test. Additionally, when BAR goes from 75% to 100% in the RCB, compressive strength and deflection value fall.
7 Finite element studies vs. experimental results comparisons
In this part, we see how the experimental crack and deflection data for the RCB compare to 3D FEA models. Table 6 shows both theoretical and actual values for maximum displacement in the RCB. Also displayed in Figure 18 is the comparison of the experimental and numerical studies. Based on Table 6, the deflection is -3.89 cm, and it was measured in the middle of the RCB. When numeric data is evaluated, the experimental data’s deflection values are practically the same as those found in the 3D numerical analysis results. Deflection calculations give -3.88 cm. Not only did the numerical analysis (Figure 18A) match experimental results, but it showed that significant load-deflection occurred, too. Furthermore, results from experimental and numerical tests on the RCB with 25% bottom ash (Case 2) are nearly identical:
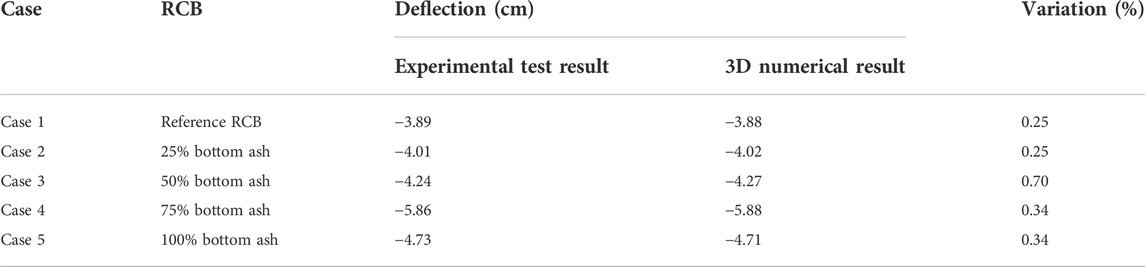
TABLE 6. Deflection data under vertical force, which were obtained by experiments and computer simulations.
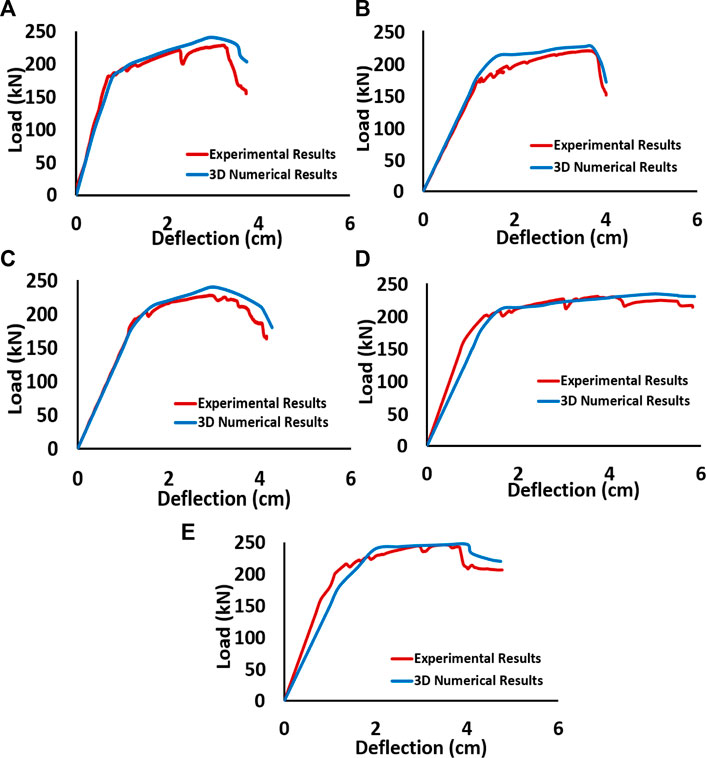
FIGURE 18. To better understand the differences between RCB structures with higher-level and traditional cement, comparative analyses of 3D numerical and experimental deflection findings for (B) 25 percent BAR, (C) 50 percent BAR, (D) 75 percent BAR, (E) 100 percent BAR.
−4.01 cm of deflection for the real test and −4.02 cm of deflection for the 3D numerical model. This verification tells us the accuracy of the experiments’ results. For Case 2, the experimental and numerical results had a variance of +/- 25% in numbers. Figures 18B, 19B (a visual representation of the load-deflection data) reveal that loads show deflection close to that expected for the experimental and analytical results in this set of experiments. In 3D numerical simulations, a maximum deflection of −4.27 cm occurred in the centre of the RCB, while -4.24 cm deflection was recorded for experimental tests.
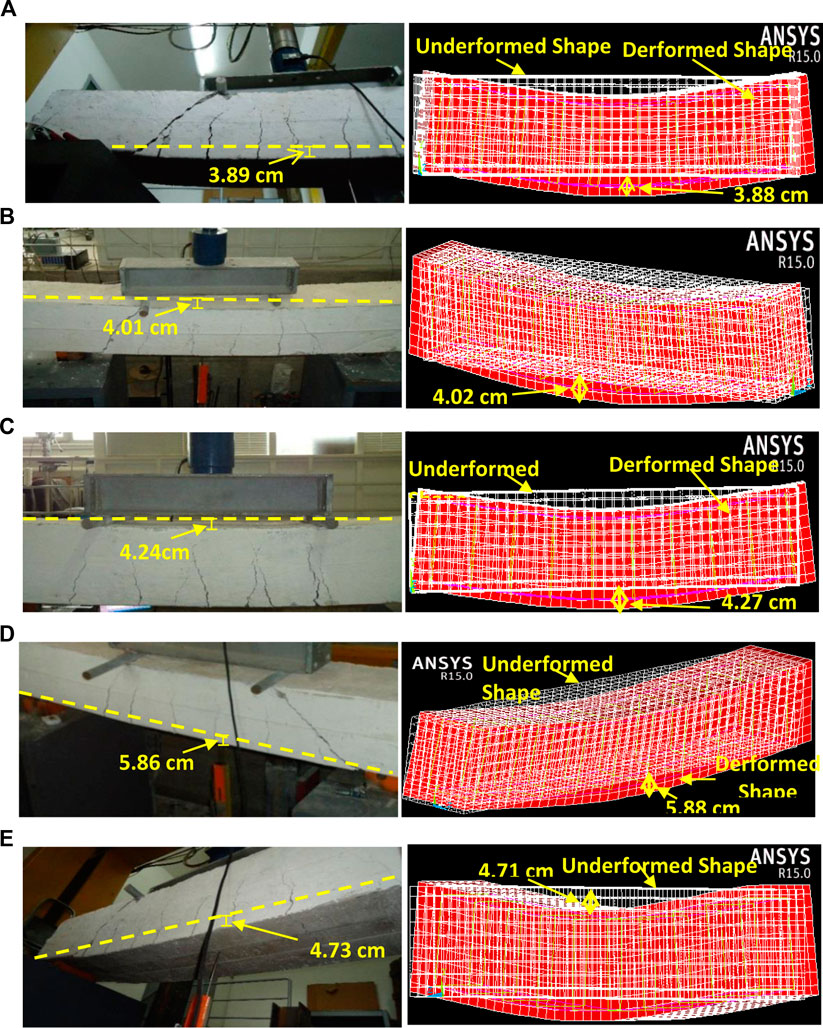
FIGURE 19. Deflection effects were determined using RCB experimental tests and 3D numerical analysis, showing different results for reference tests (A–E).
For the experiment, deflection variance was at about 3 mm, which is well within expected parameters. Figure 18C also shows this. Deflection in the centre of the RCB for the experimental test is recorded at -5.86 cm, while finite element calculations obtain -5.88 cm deflection. This number looks spot-on after having it double-checked using experiments and 3D numerical analysis. A 34% difference between the two types of experimental findings was discovered for Case 4. Load-deflection graphs in Figure 18D show the deflection of Case 4, with relatively similar deflection lines in both test results. Finally, the maximal deflection of -4.73 cm is found in the RCB for experimental data, whereas the same value is obtained in numerical studies. As well, the difference between the practical and theoretical test results are nearly identical (Figure 18E). This study’s numerical analysis results, which were created using 3D data, are verified by experimental testing, according to these findings. Furthermore, it is noteworthy that, for experimental test results, it is reported that when the concrete mixture’s BAR content moves from 0% to 75%, the deflection value under vertical force in the RCB grows. Nevertheless, a rise in the percentage of compressive replacement strength diminishes when the percentage of replacement is set to 100 percent. There is the same behavior seen in all RCB series when it comes to 3D numerical analysis. Moreover, the testing and computational simulations identified the same vertical and flexure cracks. 3D numerical evaluations help to verify experimental tests of the flexural behavior of RCBs shown in Figure 19.
8 Case study
Next, it will show how to use SAP 2000 (SAP 2000, 2008) software to create RC structures and describe how various bottom ash replacement ratios affect the weight of the RC structure. The analysis also considers the effects of 75% of the original BAR (the most critical BAR for reinforced RCBs). Example concrete structures use various fine-aggregate contents with varying replacement ratios (as discussed in the prior sections). We’ve also established that this construction is an office building in Turkey. It has four storeys, each measuring 16 × 16 m. It also measures over 14.5 m in height. As you’re making this, you enter the building’s original proportions into the 3D model. The materials for all columns and RCBs were based on experimental testing performed on five different concrete cube series, each of which had different characteristics. Figure 20 provide the 2D versions of this structure.
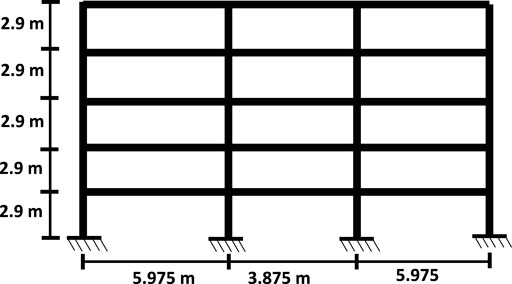
FIGURE 20. Viewing two-dimensional model of concrete structure (Karalar, 2020).
After using SAP 2000 (SAP 2000, 2008) software to model the concrete structure, five material characteristics were given to the software, and the construction was collapsed under its own weight. Significant weight disparities have been discovered in several cases. Figure 21 showcases these significant findings.

FIGURE 21. Numerical analysis results of the concrete structure.
When the overall weight of the structure is taken into account, it is obvious that the maximum structure weight is gained for reference RC, with a numerical value of 18,107 kN. The results of a total of 17,722 kN structure weight for concrete with 25% BAR are found, and this finding is crucial to assessing the effect of BAR on the weights of RC structures. Structure weights are also obtained: 16,938 kN for concrete with 50% BARs and 17,333 kN for concrete with 75% BARs. It turns out the lightest structure results when 100% BAR is used. Because a heavier concrete structure is undesirable, the numbers demonstrate that BAR in the concrete mixture makes it less heavy. Bottom ash is less dense than natural sand, so it's utilized in concrete construction to reduce weight. It was also explored how 75% BAR, which is important for RCBs, affects the nonlinear seismic horizontal displacement behavior of RC structures. For the seismic analysis, three important earthquakes are utilized. As you can see from the table, the 1989 Loma Prieta earthquake was comprised of three parts: near-fault, middle-fault, and far-fault. Table 7.
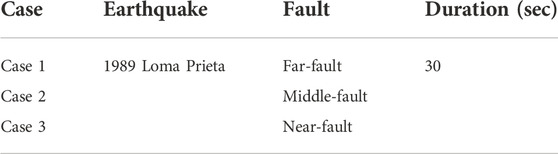
TABLE 7. Three different cases for the 1989 Loma Prieta earthquake (Karalar, 2020).
In addition, the far-fault earthquake is gaining 0.53865 m/s2 of speed. On the flip side, max of 2.2124 m/s2 and 6.1398 m/s2 are 2.2124 m/s2 and 6.1398 m/s2, respectively. Differences in the rate of the average middle-fault and near-fault earthquakes. Earthquake simulations utilize SAP2000 software, which provides a model for the RC structure. The earthquakes are then applied to the structure’s bottom. As reported by nonlinear seismic analysis, to find out how the horizontal displacement in RC structure would change, reference concrete series and the concrete series with 75% CTE are used to calculate the displacement behaviour of each level.
The results of the seismic analyses of three critical earthquakes are detailed in Figure 22. For the 1989 Loma Prieta earthquake, Figure 22A shows how displacement of each floor in the structure is influenced by the effects of bottom ash. The top level of the structure experienced a maximum horizontal displacement of 0.56 cm due to the earthquake. Moreover, for Case 1, up to 1.12 cm of horizontal displacement can be achieved with a 75% design basis earthquake (DBE). Although the bottom ash concrete series obtained greater horizontal displacements, as compared to Case 1 and 3, more horizontal displacement (84 cm) was seen for the bottom ash concrete series for Case 2. Finally, the structure exhibits a maximum displacement of 2.08 cm at the highest floor when considering only concrete (Figure 22B). Bottom ash significantly impacts reinforced concrete structures, causing them to be more sensitive to seismic vertical displacement. In Figure 22C, we see that seismic effects from the BAR contribute to the displacement behavior of the structure, and these effects are examined more closely below. The earthquake caused pure concrete to shift 8.02 cm to the side, whereas the additional concrete moved 11.87 cm.
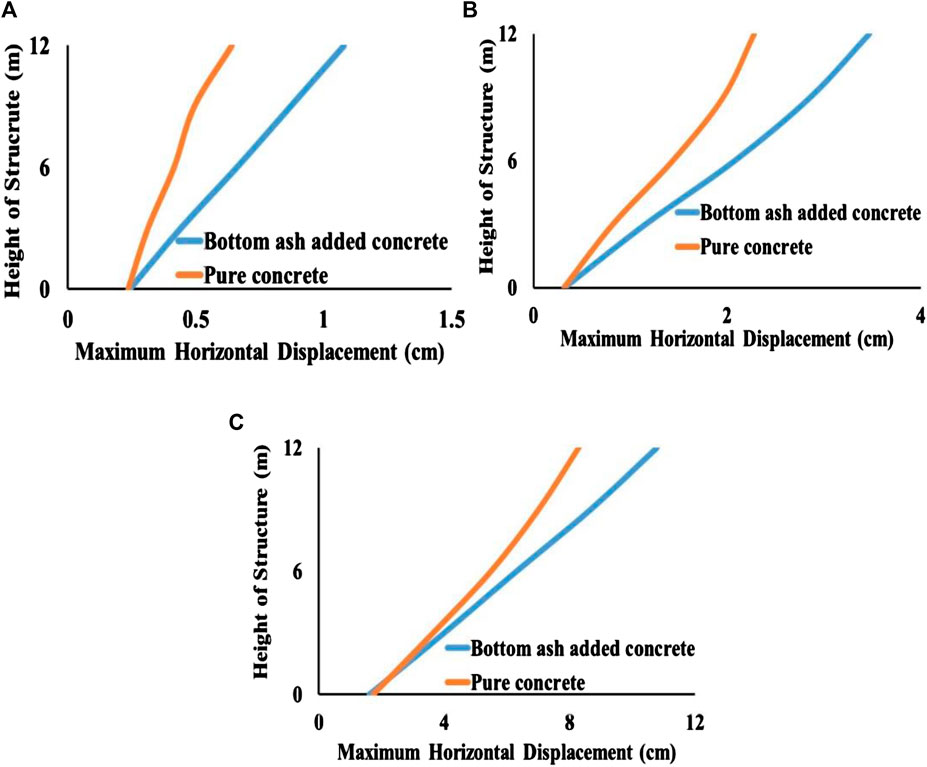
FIGURE 22. Nonlinear seismic analysis results for; (A) Case 1, (B) Case 2, (C) Case 3.
9 Conclusion
To ensure the safety of structures, it is essential to analyze how cracks and other forms of concrete failure develop. In this study, physical tests and 3D numerical modeling were used to investigate how different RCBs are affected by their ability to bend under load and the way they break under this type of strain. Load-dependent deflection behaviors are analyzed and evaluated in-depth for these RCBs because of this. The following bottom ash fine aggregate ratios are used in the concrete compositions, where 0% and 100% are both represented, followed by 25%, 50%, and 75%. To study the crack and flexural behaviors of RCBs, tests and 3D numerical analyses are used. The following information is key:
➢According to experiment results, it is evident that BAR in the concrete mixture is more effective, with an increase in the maximum RCB deflection. Maximal deflection of the RCB occurs near the middle of the RCB, with 75% BAR. Yet, raising BAR from 75% to 100% will clearly reduce RCB deflection.
➢According to the experimental results, the amount of deflection occurring in beams containing 0% and 25% bottom ash is 3.89 cm and 4.01 cm, respectively. In addition, static deflection amounts took place in beams containing 50%, 75% and 100% bottom ash are respectively 4.24 cm, 5.86 cm and 4.73 cm.
➢The behavior of RCBs cracks is affected by the fine aggregate ratio of bottom ash. Large vertical and flexural cracks were found to be affected by BAR, depending on the RCB. Cracks in the RCBs grow when the BAR fluctuates from 0% to 75%, and the crack widths are influenced by the change in BAR.
➢The simulations and experiments yield tiny cracks with very identical configurations. This suggests that finite element simulation may be a superb substitute for damaging laboratory experiments that can produce variances in findings, as both types of testing have their advantages and disadvantages. Bottom ash fine aggregates can be evaluated by finite element simulation and can thus be effectively utilized to forecast the real behavior of RCBs.
➢The weight of a concrete structure has been analyzed in terms of its RCBs and columns. Multiple BARs are used within RCBs and columns, and the effect of these on the structure’s weight is thoroughly described. The weight of the structure dramatically decreases as the number of columns and RCBs are raised while also increasing the number of BARS. The total weights of the structure containing 0% and 25% bottom ash are 18,107 kN and 17,722 kN, respectively. Furthermore, the weights of structures with 50%, 75% and 100% bottom ash are 17,333 kN, 16,938 kN and 16,548 kN, respectively.
➢It is apparent from all of the results of seismic analyses that the magnitude of earthquake and BAR have a significant effect on the horizontal displacement behavior of RC structures. The strength of the concrete structure varies between close- and far-fault earthquakes, and for close-fault earthquakes, concrete strength is stronger than for far-fault earthquakes. This brings us to the second disadvantage of BAR: the 75% strain produces a severe displacement of reinforced concrete structures.
Data availability statement
The raw data supporting the conclusions of this article will be made available by the authors, without undue reservation.
Author contributions
Conceptualization, MK; Methodology, MK; Data curation, MÇ; Investigation, MK and MÇ. Writing-original draft preparation, MK, TB, MÇ, YOÖ, and MMSS; Writing-review and editing, MK, TB, MÇ, YOÖ, and MMSS; Funding acquisition, MMSS All authors have read and agreed to the published version of the manuscript.
Funding
The research is partially funded by the Ministry of Science and Higher Education of the Russian Federation under the strategic academic leadership program 'Priority 2030' (Agreement 075-15-2021-1333 dated 30.09.2021).
Conflict of interest
The authors declare that the research was conducted in the absence of any commercial or financial relationships that could be construed as a potential conflict of interest.
Publisher’s note
All claims expressed in this article are solely those of the authors and do not necessarily represent those of their affiliated organizations, or those of the publisher, the editors and the reviewers. Any product that may be evaluated in this article, or claim that may be made by its manufacturer, is not guaranteed or endorsed by the publisher.
References
Akın, S. K., Kartal, S., Müsevitoglu, A., Sancıoglu, S., Zia, A. J., and İlgün, A. (2022). Macro and micro polypropylene fiber effect on reinforced concrete beams with insufficient lap splice length. Case Stud. Constr. Mater. 16, e01005. doi:10.1016/j.cscm.2022.e01005
Aksoylu, C., Özkılıç, Y. O., and Arslan, M. H. (2022). Mechanical steel stitches: An innovative approach for strengthening shear deficiency in undamaged reinforced concrete beams. Buildings 12 (10), 1501. doi:10.3390/buildings12101501
Aksoylu, C., Özkılıç, Y. O., Hadzima-Nyarko, M., Işık, E., and Arslan, M. H. (2022). Investigation on improvement in shear performance of reinforced-concrete beams produced with recycled steel wires from waste tires. Sustainability 14, 13360. doi:10.3390/su142013360
Al-Rousan, R. Z., and Al-Muhiedat, J. N. (2022). The behavior heated-damaged reinforced concrete beams retrofitted with different CFRP strip length and number of transverse groove. Case Stud. Constr. Mater. 16, e00896. doi:10.1016/j.cscm.2022.e00896
Alam, M. S., and Hussein, A. (2017). Relationship between the shear capacity and the flexural cracking load of FRP reinforced concrete beams. Constr. Build. Mater. 154, 819–828. doi:10.1016/j.conbuildmat.2017.08.006
Andrade, L. B., Rocha, J. C., and Cheriaf, M. (2007). Evaluation of concrete incorporating bottom ash as a natural aggregates replacement. Waste Manag. 27 (9), 1190–1199. doi:10.1016/j.wasman.2006.07.020
Araba, A. M., and Ashour, A. F. (2018). Flexural performance of hybrid GFRP-Steel reinforced concrete continuous beams. Compos. Part B Eng. 154, 321–336. doi:10.1016/j.compositesb.2018.08.077
Azevedo, A. R. G. d., Marvila, M. T., Antunes, M. L. P., Rangel, E. C., and Fediuk, R. (2021). Technological perspective for use the natural pineapple fiber in mortar to repair structures. Waste Biomass Valorization 12, 5131–5145. doi:10.1007/s12649-021-01374-5
Azevedo, A. R., Marvila, M. T., Zanelato, E. B., Alexandre, J., Xavier, G. C., and Cecchin, D. (2020). Development of mortar for laying and coating with pineapple fibers. Rev. Bras. Eng. Agric. Ambient. 24, 187–193. doi:10.1590/1807-1929/agriambi.v24n3p187-193
Bheel, N., Jokhio, M. A., Abbasi, J. A., Lashari, H. B., Qureshi, M. I., and Qureshi, A. S. (2020). Rice husk ash and fly ash effects on the mechanical properties of concrete. Eng. Technol. Appl. Sci. Res. 10 (2), 5402–5405. doi:10.48084/etasr.3363
Bheel, N., Keerio, M. A., Kumar, A., Shahzaib, J., Ali, Z., Ali, M., et al. (2021). An investigation on fresh and hardened properties of concrete blended with rice husk ash as cementitious ingredient and coal bottom ash as sand replacement material. Silicon 14, 677–688. doi:10.1007/s12633-020-00906-3
Bicer, K., Yalciner, H., Balkıs, A. P., and Kumbasaroglu, A. (2018). Effect of corrosion on flexural strength of reinforced concrete beams with polypropylene fibers. Constr. Build. Mater. 185, 574–588. doi:10.1016/j.conbuildmat.2018.07.021
Bilir, T. (2012). Effects of non-ground slag and bottom ash as fine aggregate on concrete permeability properties. Constr. Build. Mater. 26, 730–734. doi:10.1016/j.conbuildmat.2011.06.080
Bilir, T. (2016). Investigation of performances of some empirical and composite models for predicting the modulus of elasticity of high strength concretes incorporating ground pumice and silica fume. Constr. Build. Mater. 127, 850–860. doi:10.1016/j.conbuildmat.2016.10.054
Çelik, A. İ., Özkılıç, Y. O., Zeybek, Ö., Özdöner, N., and Tayeh, B. A. (2022). Performance assessment of fiber-reinforced concrete produced with waste lathe fibers. Sustainability 14 (19), 11817. doi:10.3390/su141911817
Deng, M., Ma, F., Ye, W., F., and Li, F. (2018). Flexural behavior of reinforced concrete beams strengthened by HDC and RPC. Constr. Build. Mater. 188, 995–1006. doi:10.1016/j.conbuildmat.2018.08.124
Gemi, L., Alsdudi, M., Aksoylu, C., Yazman, Ş., Özkılıç, Y. O., and Arslan, M. H. (2022). Behavior of CFRP-strengthened RC beams with circular web openings in shear zones: Numerical study. Structures 41, 1369–1389. doi:10.1016/j.istruc.2022.05.061
Ghafoori, N., and Bucholc, J. (1996). Investigation of lignite-based bottom ash for structural concrete. J. Mat. Civ. Eng. 8, 128–137. doi:10.1061/(asce)0899-1561(1996)8:3(128)
Huang, Y., Lee, M-G., Kan, Y-C., Wang, W-C., Wang, Y-C., and Pan, W-B. (2022). Reinforced concrete beams retrofitted with UHPC or CFRP. Case Stud. Constr. Mater. 17, e01507. doi:10.1016/j.cscm.2022.e01507
Inthata, S., and Cheerarot, R. (2014). Chloride penetration resistance of concrete containing ground fly ash, bottom ash and rice husk ash. Comput. Concr. 13 (1), 17–30. doi:10.12989/cac.2014.13.1.017
Karalar, M., Bilir, T., and Çavuşli, M. (2020). 3D experimental and numerical investigation on crack behaviour of RC beams under %75 bottom ash ratio. Seoul, Korea: Structures20 Congress, 25–28.
Karalar, M. (2020). Experimental and numerical investigation on flexural and crack failure of reinforced concrete beams with bottom ash and fly ash. Iran. J. Sci. Technol. Trans. Civ. Eng. 44, 331–354. doi:10.1007/s40996-020-00465-y
Karalar, M., Özkılıç, Y. O., Deifalla, A. F., Aksoylu, C., Arslan, M. H., Ahmad, M., et al. (2022). Improvement in bending performance of reinforced concrete beams produced with waste lathe scraps. Sustainability 14 (19), 12660. doi:10.3390/su141912660
Kim, Y. H., Kim, H. Y., Yang, K. H., and Ha, J. S. (2021). Effect of concrete unit weight on the mechanical properties of bottom ash aggregate concrete. Constr. Build. Mater. 273, 121998. doi:10.1016/j.conbuildmat.2020.121998
Kurama, H., and Kaya, M. (2007). Usage of coal combustion bottom ash in concrete mixture. Constr. Build. Mater. 22 (9), 1922–1928. doi:10.1016/j.conbuildmat.2007.07.008
Kurama, H., Topçu, İ. B., and Karakurt, C. (2009). Properties of the autoclaved aerated concrete produced from coal bottom ash. J. Mater. Process. Technol. 209 (2), 767–773. doi:10.1016/j.jmatprotec.2008.02.044
Lee, H. K., Jim, H. K., and Hwang, E. A. (2010). Utilization of power plant bottom ash as aggregates in fiber-reinforced cellular concrete. Waste Manag. 30, 274–284. doi:10.1016/j.wasman.2009.09.043
Lee, K. H., Yang, K. H., Mun, J. H., and Van Tuan, N. (2019). Effect of sand content on the workability and mechanical properties of concrete using bottom ash and dredged soil-based artificial lightweight Aggregates. Int. J. Concr. Struct. Mat. 13, 13. doi:10.1186/s40069-018-0306-z
Lu, X., Zhu, Z., Mohibullah, M., and Wang, K. (2022). Nonlinear analysis of flexural performance of reactive powder concrete beams reinforced with hybrid GFRP and steel bars. Case Stud. Constr. Mater. 17, e01450. doi:10.1016/j.cscm.2022.e01450
Mahmood, S. M., Agarwal, A., Foster, S. J., and Valipour, H. (2018). Flexural performance of steel fibre reinforced concrete beams designed for moment redistribution. Eng. Struct. 177, 695–706. doi:10.1016/j.engstruct.2018.10.007
Mangi, S. A., Ibrahim, M. H. W., Norwati, J., Arshad, M. F., and Mudjanarko, S. W. (2019). Recycling of coal ash in concrete as a partial cementitious resource. Resources 8 (2), 99. doi:10.3390/resources8020099
Marvila, M. T., Azevedo, A. R. G., Alexandre, J., Zanelato, E. B., Azeredo, N. G., Simonassi, N. T., et al. (2019). Correlation between the properties of structural clay blocks obtained by destructive tests and Ultrasonic Pulse Tests. J. Build. Eng. 16, 100869. doi:10.1016/j.jobe.2019.100869
Nikbin, I. M., Rahimi, S., Allahyari, H., and Damadi, M. (2016). A comprehensive analytical study on the mechanical properties of concrete containing waste bottom ash as natural aggregate replacement, Construction and Building. Materials 121, 746–759. doi:10.1016/j.conbuildmat.2016.06.078
Özkılıç, Y. O., Aksoylu, C., and Arslan, M. H. (2021). Numerical evaluation of effects of shear span, stirrup spacing and angle of stirrup on reinforced concrete beam behaviour. Struct. Eng. Mech. Int'l J. 79 (3), 309–326.
Özkılıç, Y. O., Aksoylu, C., Gemi, L., and Arslan, M. H. (2022). Behavior of CFRP-strengthened RC beams with circular web openings in shear zones: Numerical study. In Structures. Elsevier 41, 1369–1389.
Qaidi, S., Najm, H. M., Abed, S. M., Özkılıç, Y. O., Al Dughaishi, H., Alosta, M., et al. (2022). Concrete containing waste glass as an environmentally friendly aggregate: A review on fresh and mechanical characteristics. Materials 15 (18), 6222. doi:10.3390/ma15186222
Rafieizonooz, M., Mirza, J., Salim, M. R., Hussin, M. W., and Khankhaje, E. (2016). Investigation of coal bottom ash and fly ash in concrete as replacement for sand and cement. Constr. Build. Mater. 116, 15–24. doi:10.1016/j.conbuildmat.2016.04.080
SAP2000 (2008). Integrated finite elements analysis and design of structures. Berkeley, CA, USA: Computers and Structures, Inc.
Singh, M., and Siddique, R. (2013). Effect of coal bottom ash as partial replacement of sand on properties of concrete. Resour. Conservation Recycl. 72, 20–32. doi:10.1016/j.resconrec.2012.12.006
Sintayehu, A., and Mamaru, D. (2019). Production of lightweight concrete using corncob ash as replacement of cement in concrete. Am. J. Civ. Eng. 7 (1), 17–20. doi:10.11648/j.ajce.20190701.13
Topçu, İ. B., and Bilir, T. (2010a). Experimental investigation of drying shrinkage cracking of composite mortars incorporating crushed tile fine aggregate. Mater. Des. 31, 4088–4097. doi:10.1016/j.matdes.2010.04.047
Topçu, İ. B., and Bilir, T. (2009). Experimental investigation of some fresh and hardened properties of rubberized self-compacting concrete. Mater. Des. 30, 3056–3065. doi:10.1016/j.matdes.2008.12.011
Topçu, İ. B., Bilir, T., and Uygunoğlu, T. (2009). Effect of waste marble dust content as filler on properties of self-compacting concrete. Constr. Build. Mater. 23, 1947–1953. doi:10.1016/j.conbuildmat.2008.09.007
Tran, C. T. N., Nguyen, X. H., Le, D. D., and Nguyen, H. C. (2022). Deformation capacity of shear-strengthened concrete beams reinforced with FRP bars: Experimental and analytical investigations. Case Stud. Constr. Mater. 17, e01411. doi:10.1016/j.cscm.2022.e01411
Truonga, B. T., Buia, T. T., Limama, A., Larbib, A. S., Nguyenc, K. L., and Michela, M. (2017). Experimental investigations of reinforced concrete beams repaired/reinforced by TRC composites. Compos. Struct. 168, 826–839. doi:10.1016/j.compstruct.2017.02.080
Wang, J. H., Sun, Y. P., Takeuchi, T., and Koyama, T. (2020). Seismic behavior of circular fly ash concrete columns reinforced with low-bond high-strength steel rebar. Structures 27, 1335–1357. doi:10.1016/j.istruc.2020.07.005
Xu, T., Castel, A., and Gilbert, R. I. (2018). On the reliability of serviceability calculations for flexural cracked reinforced concrete beams. Structures 13, 201–212. doi:10.1016/j.istruc.2018.01.001
Keywords: bending behavior, aggregate replacement, recycled, bottom ash, reinforced concrete beam
Citation: Karalar M, Bilir T, Çavuşlu M, Özkiliç YO and Sabri Sabri MM (2022) Use of recycled coal bottom ash in reinforced concrete beams as replacement for aggregate. Front. Mater. 9:1064604. doi: 10.3389/fmats.2022.1064604
Received: 08 October 2022; Accepted: 21 October 2022;
Published: 22 November 2022.
Edited by:
Roman Fediuk, Far Eastern Federal University, RussiaReviewed by:
Vadim Potapov, Research Geotechnological Center (RAS), RussiaQianqian Zhao, Northeast Agricultural University, China
Zbyšek Pavlík, Czech Technical University in Prague, Czechia
Afonso Azevedo, State University of the North Fluminense Darcy Ribeiro, Brazil
Alexandr Kolesnikov, M.Auezov South Kazakhstan State University, Kazakhstan
Svetlana Samchenko, NRU MGSU, Russia
Copyright © 2022 Karalar, Bilir, Çavuşlu, Özkiliç and Sabri Sabri. This is an open-access article distributed under the terms of the Creative Commons Attribution License (CC BY). The use, distribution or reproduction in other forums is permitted, provided the original author(s) and the copyright owner(s) are credited and that the original publication in this journal is cited, in accordance with accepted academic practice. No use, distribution or reproduction is permitted which does not comply with these terms.
*Correspondence: Yasin Onuralp Özkiliç, eW96a2lsaWNAZXJiYWthbi5lZHUudHI=