 Huanqing Li1†
 Yuhong Zhao
- 1College of Materials Science and Engineering, North University of China, Taiyuan, China
- 2College of Materials Science and Engineering, Taiyuan University of Science and Technology, Taiyuan, China
- 3Beijing Advanced Innovation Center for Materials Genome Engineering, University of Science and Technology Beijing, Beijing, China
The grain-boundary dislocation arrangement and decomposition during constant-volume deformation of a nanoscale bi-crystal system in fcc-structured materials were studied by using the two-mode phase-field crystal (2PFC) method. The effects of different grain boundary misorientations (GBMs) and tensile deformation directions on the dislocation arrangement and decomposition are analyzed. In three different symmetrical tilt grain boundaries evaluated by PFC, the atomic density profile of grain boundaries changed periodically at equilibrium. The initial grain boundary dislocation arrangement of the three samples is almost the same when tensile deformation is applied to the samples in the x- or y- direction, and all are symmetrically arranged in a “bowknot ”structure. The stress at the grain boundary is concentrated with the increase of strain, and dislocation decomposition can effectively reduce the stress concentration. The time steps of dislocation decomposition at grain boundaries decreases with increasing strain rate. This work facilitates the application of PFC in the analysis of grain-boundary mechanics in an extended range of materials.
Introduction
The mechanical behavior of materials is affected by defects such as dislocations and grain boundaries, which are related to atomic structure (Hirouchi et al., 2010). The study of the grain-boundary structure and dislocation movement mechanism is conducive to understanding the evolution law of material microstructure and can provide some theoretical support for optimizing processes and improving material properties to a certain extent (Kumar et al., 2003; Hou et al., 2020; Park et al., 2021; Roy et al., 2022).
The study of material properties has become more and more thorough with the progress of experimental technology. The tensile deformation behaviors under different conditions were studied by experiments. For example, tensile response and fracture behavior (Mahabadi et al., 2014), dislocation configuration near the tensile fracture (Liu et al., 2012), the change of grain orientation before and after tensile deformation, and the yield strength of the alloy can be observed by using a scanning electron microscope (SEM), orientation imaging microscopy (OIM), transmission electron microscope (TEM), and electron backscattered diffraction (EBSD) (Suh et al., 2017; Xia et al., 2019; Li et al., 2020; Yan et al., 2021). The high-resolution transmission electron microscope (HRTEM) (Bian et al., 2017) was used to observe the microstructure on a smaller scale (Yang et al., 2020; Volnistem et al., 2021; Guo et al., 2021). However, experimental inquiry alone is not enough in scientific research. Because the process of material microstructure formation and its performance characteristics are essentially multi-scale coupling. So far, the experimental study of the microstructure of materials has some limitations. Atomic simulation can supplement it, especially in the study of scale (Xin et al., 2021; Kuang et al., 2018; Zhao et al., 2018; Guo et al., 2019). With the rapid development of computer simulation, such as the phase-field method (PF) (Peng et al., 2021), molecular dynamics (MD) (Song et al., 2014), and phase-field crystal method (PFC) (Zhao et al., 2014). The evolution morphology of multi-scale material microstructure is vividly given (Zhang et al., 2018; Zhao et al., 2019). Combined with EBSD (Nielsen et al., 2020; Zhao et al., 2021) and HRTEM (Zhang et al., 2019; Shuai et al., 2021) technology, the research efficiency is greatly improved. It is worth mentioning that the phase-field crystal method is more suitable for studying the microstructure defects of crystals. Because the PF method generally studies mesoscopic scale, it is difficult to provide atomic-scale information, and the time scale
Elder et al. (2002) proposed the PFC method which closely a coupled model between atom and microscale according to Ginzburg Landau's theory. The evolution of crystal patterns simulated (Qi et al., 2020; Chen and Zhao, 2021), which can quantitatively reproduce some key characteristics affecting the evolution of microstructure (Tian et al., 2021), and clearly describe the dislocation structure of grain boundary (Qi et al., 2019). The model is expressed in terms of experimentally measurable physical quantities such as liquid structure factors (Hu et al., 2020). Now it has successfully simulated dislocation movement, grain-boundary pre-melting, growth of crystals. The model cannot describe the dislocation motion in a two-dimensional square lattice. Therefore, Wu et al. (2010) and Asadi and Zaeem (2015) modified the free energy function and proposed the 2PFC model. The study of phase diagrams makes the experiment and simulation more closely combined (Greenwood et al., 2010; Can et al., 2013). The 2PFC model studies the deformation and morphology of small-angle asymmetric grain boundaries (Zhang et al., 2014), the migration and dislocation reaction of grain boundaries under deviatoric deformation (Hu et al., 2016a), and the solidification law (Yang et al., 2014) of square phase grains under low, medium, and high driving force during phase transformation. These simulation studies reveal the microstructure phenomena under different conditions on a smaller atomic scale.
In this work, we focus on the dislocation decomposition and dislocation arrangement of low-angle symmetrically tilt grain boundaries under different tensile deformation directions. In the following, we will first describe the model and method in Section 2. The tensile response of grain boundary at x and y tensile deformation directions are presented in Section 3, followed by strain rate, deformation direction, and misorientation angle that affect the critical strain value for grainboundary dislocation decomposition discussed in Section 4. The final conclusion is presented in Section 5.
Models and Methods
Two-Mode Phase-Field Crystal Model
The two-mode PFC model (Wu et al., 2010) simulates the crystal structure and the free energy of a system is as
where
To minimize the number of parameters, we define the dimensionless parameters
substituting the abovementioned definitions into Eq. 1 yields the dimensionless form
where
The Fourier amplitudes of the first and second reciprocal lattice vectors (RLV) denote by
where
The free energy density in the solid-state is
where
The phase diagram is derived by taking the derivative of free energy for the density field of the square phase and liquid phase respectively and using the common tangent rule, as shown in Figure 1.
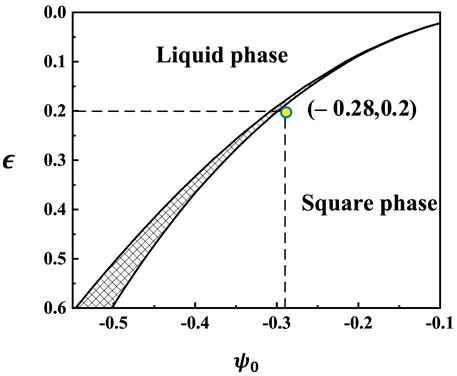
FIGURE 1. Two-dimensional phase diagram of two-mode approximate calculation.
Application of Applied Stress
First, we apply tensile stress along the x-direction to the system. We employ the isovolumetric numerical scheme (Hirouchi et al., 2009; Berry et al., 2015) during the deformation process:
The grid sizes after
similarly, when tensile stress along the y-direction to the system, we have
where
Numerical Calculation Method and Parameter Setting
Since the atomic density field is a conserved value, the dimensionless time evolution equation
By transforming the partial differential equation into a sequence of ordinary differential equations in Fourier space, we apply a Fourier-spectral approximation to Equation 10, we have
Where
The parameters of the simulation system in this work are set as follows: the simulation region of periodic boundary conditions in all directions is
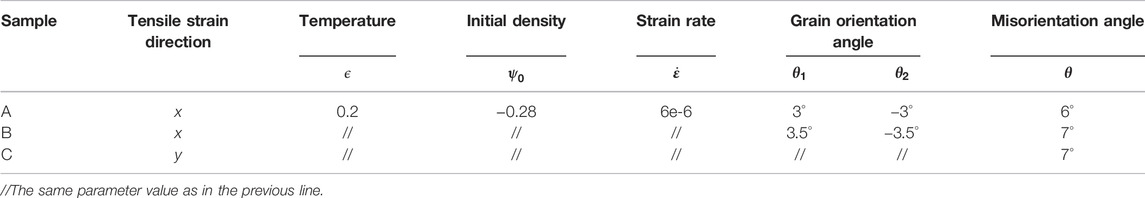
TABLE 1. Parameters for sample preparation.
We let the system relax for a period of
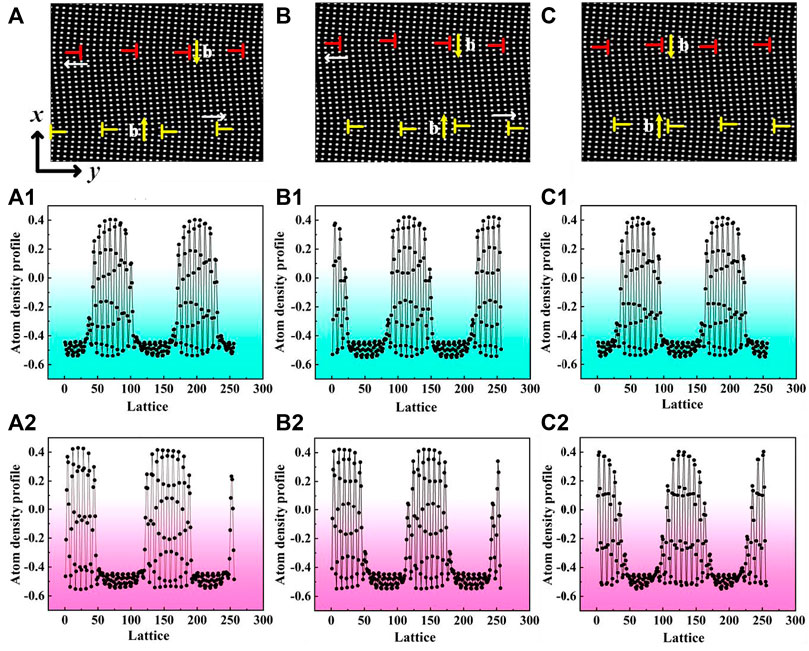
FIGURE 2. (A), (B) Bi-crystal structure with grain boundary misorientation angles of
Results and Analysis
The Arrangement and Movement of Edge Dislocations Under X-Direction Tensile Strain
The detailed arrangement and movement process of GBDs under x-direction tensile strain is illustrated in Figures 3, 4. The free energy curve of the system during the deformation process is illustrated in Figure 5.
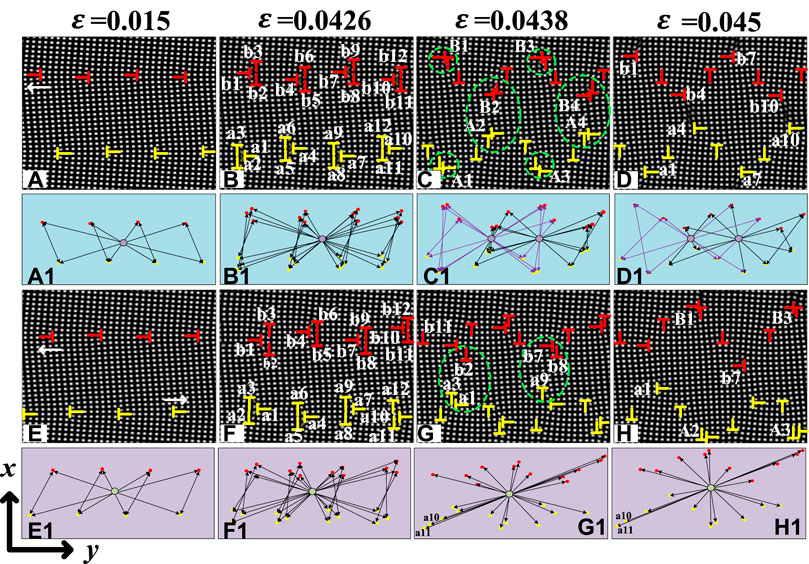
FIGURE 3. (A–D), (A1-D1) The evolution and arrangement of grain boundary dislocations when the GBM are
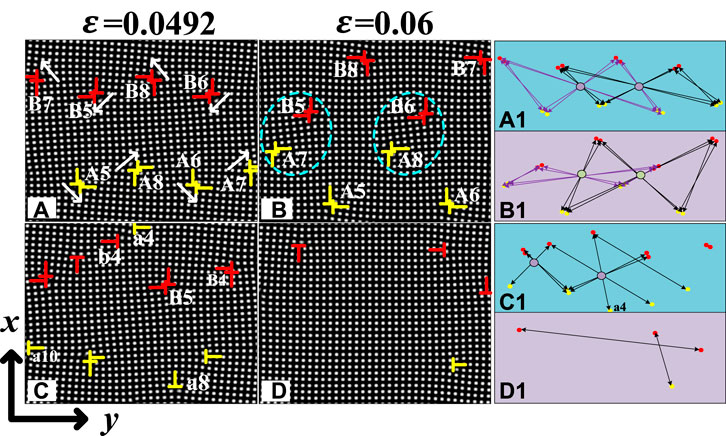
FIGURE 4. (A–D) The dislocation evolution of
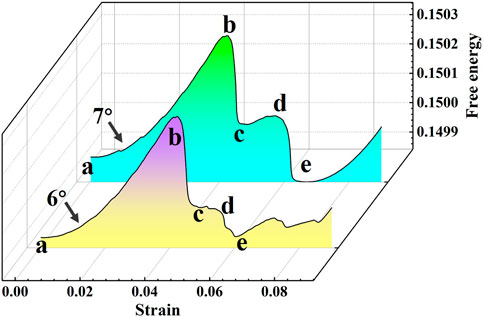
FIGURE 5. The free energy curve of
As shown in Figures 3A–H, all-grain boundary dislocations are arranged in symmetrical structure from
At
In Figure 5, we found that the energy trend of Figures 5A–C stage in the evolution of the two systems from bi-crystal to single crystal is the same, and the peak value with large GBMs is higher. From Figures 5C,D, the energy curve of the GBMs
Relationship Between the Direction of Tensile Strain and the Symmetry of Dislocations Arrangement
Different tensile deformation directions of samples affect the dislocation movement direction and dislocation arrangement symmetry in the system. The y-direction tensile strain is applied to sample B. The evolution and symmetrical distribution of grain boundary dislocations of the same strain are shown in Figure 6, and the corresponding change of free energy is shown in Figure 7.
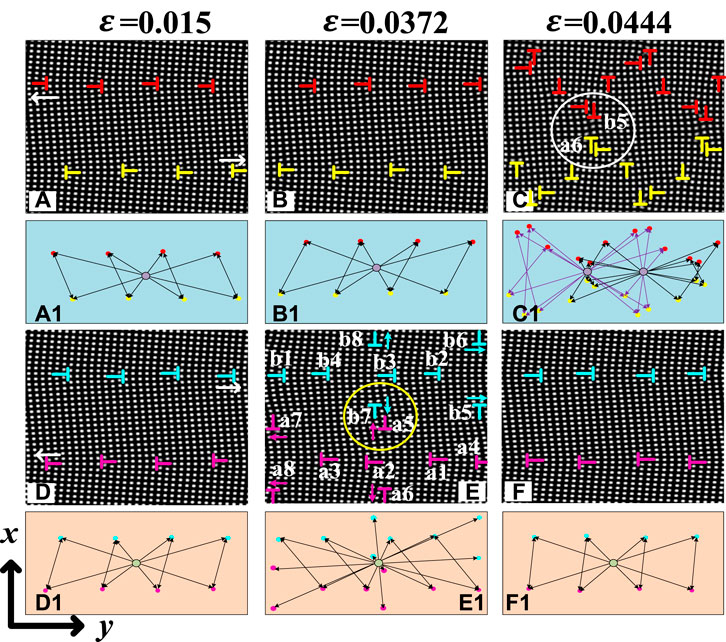
FIGURE 6. (A–C), (D–F) The evolution process of grain boundary dislocations under tensile deformation in x-direction and y-direction with
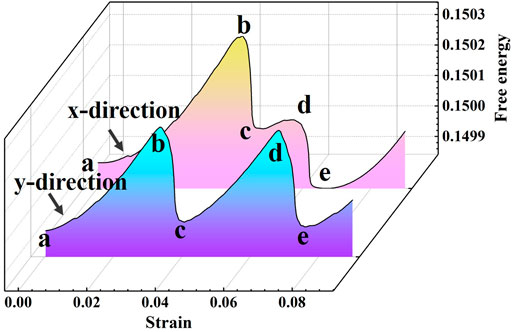
FIGURE 7. Free energy curve of misorientation angle of
In the system of grain-boundary misorientation 7°, the number of grain-boundary dislocations doesn’t change but the climbing direction of grain-boundary dislocations is opposite, as shown in Figures 6A,D. In the meantime, the grain-boundary dislocations arrangement is a highly symmetrical “bowknot” structure, as shown in Figures 6A1,D1. At
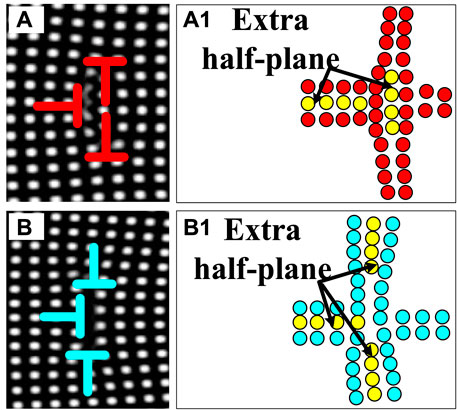
FIGURE 8. (A), (A1) Dislocation decomposition under x-direction tensile strain and its atomic structure diagram. (B), (B1) Dislocation decomposition under y-direction tensile strain and its atomic structure diagram.
With the increase of strain, there is no formation of dislocation pairs in the y-direction tensile strain system and the dislocation reactions are between single edge dislocations. In the x-direction tensile strain system, there are the formations and reactions of dislocation pairs and the annihilations of dislocations reduce the system energy, corresponding to the stage (b∼c) in Figure 7. Two-grain boundaries are re-observed in Figure 6F when
Discussion
The effect of different strain rates
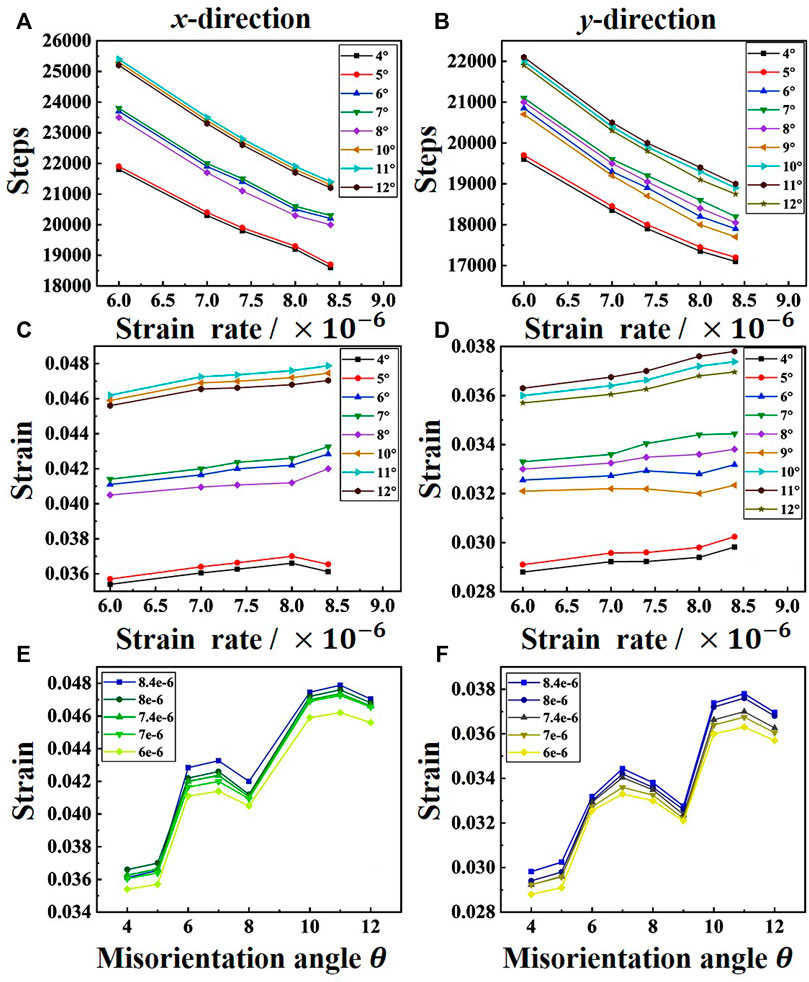
FIGURE 9. Critical strain distribution of dislocations decomposition under different strain rates and GBMs conditions. (A), (C), (E) The critical strain distribution of tensile deformation in the x-direction; (B) (D), (F) the critical strain distribution of tensile deformation in the y-direction.
Through Figure 9A,B, we can find that when the grain boundary misorientations remain unchanged, the critical time steps of dislocation decomposition decrease with the increase of strain rate. This is because the critical strain required for dislocation decomposition in the same system is fixed. It can be seen from the formula
In Figure 9C, we found that the critical strain value of grain boundary dislocation decomposition increases with the increase of grain boundary misorientations. This is because grain boundary dislocations increase with the grain boundary misorientations increase, thus the required critical strain value is larger. What we need to pay attention to is that
In summary, the critical strain
Conclusion
In this study, the phase-field crystal model of two modes is used to study the symmetry of grain boundary dislocation arrangement and the critical strain of grain boundary dislocation decomposition under different grain boundary misorientations and tensile strain directions. The results show that:
1) The x-direction tensile deformation is applied to the simulated samples with GBMs
2) The y-direction tensile deformation is applied to the
3) The critical strains of dislocations decomposition are related to strain rate and GBM. The critical strain can be reached preferentially by increasing the strain rate appropriately or reducing the GBM.
Data Availability Statement
The original contributions presented in the study are included in the article/Supplementary Material; further inquiries can be directed to the corresponding author.
Author Contributions
HL: writing—original draft and editing. XW: writing—original draft, and formal analysis. HZ: writing—original draft, and formal analysis. XT: methodology and visualization. HH: conceptualization and formal analysis. YZ: editing, supervision, and project administration.
Funding
This work was supported by the National Natural Science Foundation of China (No. 52074246).
Conflict of Interest
The authors declare that the research was conducted in the absence of any commercial or financial relationships that could be construed as a potential conflict of interest.
Publisher’s Note
All claims expressed in this article are solely those of the authors and do not necessarily represent those of their affiliated organizations, or those of the publisher, the editors, and the reviewers. Any product that may be evaluated in this article, or claim that may be made by its manufacturer, is not guaranteed or endorsed by the publisher.
Supplementary Material
The Supplementary Material for this article can be found online at: https://www.frontiersin.org/articles/10.3389/fmats.2022.875519/full#supplementary-material
References
Asadi, E., and Zaeem, M. A. (2015). A Modified Two-Mode Phase-Field Crystal Model Applied to Face-Centered Cubic and Body-Centered Cubic Orderings. Comput. Mater. Sci. 105, 110–113. doi:10.1016/j.commatsci.2015.04.004
Berry, J., Rottler, J., Sinclair, C. W., and Provatas, N. (2015). Atomistic Study of Diffusion-Mediated Plasticity and Creep Using Phase Field Crystal Methods. Phys. Rev. B 92, 134103. doi:10.1103/physrevb.92.134103
Bian, M. Z., Sasaki, T. T., Suh, B. C., Nakata, T., Kamado, S., and Hono, K. (2017). A Heat-Treatable Mg-Al-Ca-Mn-Zn Sheet Alloy with Good Room Temperature Formability. Scr. Mater. 138, 151–155. doi:10.1016/j.scriptamat.2017.05.034
Blixt, K. H., and Hallberg, H. (2022). Evaluation of Grain Boundary Energy, Structure and Stiffness from Phase Field Crystal Simulations. Model. Simul. Mat. Sci. Eng. 30, 014002. doi:10.1088/1361-651x/ac3ca1
Can, G., Zhi-Jun, W., Jin-Cheng, W., Yao-Lin, G., and Sai, T. (2013). Effect of the Direct Correlation Function on Phase Diagram of the Two-Mode Phase Field Crystal Model. Acta Phys. Sin. 62, 108104. doi:10.7498/aps.62.108104
Chen, L., and Zhao, Y. (2021). From Classical Thermodynamics to Phase-Field Method. Prog. Mat. Sci. 122, 100868. doi:10.1016/j.pmatsci.2021.100868
Elder, K. R., Katakowski, M., Haataja, M., and Grant, M. (2002). Modeling Elasticity in Crystal Growth. Phys. Rev. Lett. 88, 245701. doi:10.1103/physrevlett.88.245701
Gao, Y.-J., Deng, Q.-Q., Liu, Z.-y., Huang, Z.-J., Li, Y.-X., and Luo, Z.-R. (2020). Modes of Grain Growth and Mechanism of Dislocation Reaction under Applied Biaxial Strain: Atomistic and Continuum Modeling. J. Mater. Sci. Technol. 49, 236–250. doi:10.1016/j.jmst.2020.01.030
Greenwood, M., Provatas, N., and Rottler, J. (2010). Free Energy Functionals for Efficient Phase Field Crystal Modeling of Structural Phase Transformations. Phys. Rev. Lett. 105 (4), 045702. doi:10.1103/PhysRevLett.105.045702
Guo, H., Zhao, Y., Sun, Y., Tian, J., Hou, H., Qi, K., et al. (2019). Phase Field Crystal Study of Grain Boundary Structure and Annihilation Mechanism in Low-Angle Grain Boundary. Superlattices Microstruct. 129, 163–175. doi:10.1016/j.spmi.2019.03.020
Guo, S., Chen, H., and Wang, M. (2021). Research on the Dislocation Differences of CoCrFeMnNi with Different Local Chemical Orders during Room Temperature Tensile Test. J. Alloys Compd. 868, 159215. doi:10.1016/j.jallcom.2021.159215
Hirouchi, T., Takaki, T., and Tomita, Y. (2009). Development of Numerical Scheme for Phase Field Crystal Deformation Simulation. Comput. Mater. Sci. 44, 1192–1197. doi:10.1016/j.commatsci.2008.08.001
Hirouchi, T., Takaki, T., and Tomita, Y. (2010). Effects of Temperature and Grain Size on Phase-Field-Crystal Deformation Simulation. Int. J. Mech. Sci. 52, 309–319. doi:10.1016/j.ijmecsci.2009.09.036
Hou, X.-W., Tang, X.-Z., Zu, Q., and Guo, Y.-F. (2020). Plastic Deformation Mechanisms of Hierarchical Double Contraction Nanotwins in Mg. J. Mat. Sci. 55, 11701–11713. doi:10.1007/s10853-020-04789-y
Hu, S., Chen, Z., Peng, Y.-Y., Liu, Y.-J., and Guo, L.-Y. (2016b). Modeling and Simulation of Microcrack Propagation Behavior under Shear Stress Using Phase-Field-Crystal. Comput. Mater. Sci. 121, 143–150. doi:10.1016/j.commatsci.2016.04.035
Hu, S., Chen, Z., Yu, G.-G., Xi, W., and Peng, Y.-Y. (2016a). Phase-field-crystal Study on the Reaction Mechanisms of Opposite Sign Edge Dislocations Appearing in the Deformation Processes of Asymmetric Tilt Sub-grain Boundary System. Comput. Mater. Sci. 124, 195–203. doi:10.1016/j.commatsci.2016.07.030
Hu, S., Fan, J., Liu, Q., Li, J., and Wang, J. (2020). Phase-field-crystal Study on Shear-Induced Coupled Evolution of Intragranular Crack and Grain Boundary in Nanoscale Bicrystal System. Eur. Phys. J. B 93 (11), 212. doi:10.1140/epjb/e2020-10349-1
Kuang, W., Wang, H., Li, X., Zhang, J., Zhou, Q., and Zhao, Y. (2018). Application of the Thermodynamic Extremal Principle to Diffusion-Controlled Phase Transformations in Fe-C-X Alloys: Modeling and Applications. Acta Mater. 159, 16–30. doi:10.1016/j.actamat.2018.08.008
Kumar, K. S., Van Swygenhoven, H., and Suresh, S. (2003). Mechanical Behavior of Nanocrystalline Metals and alloys11The Golden Jubilee Issue-Selected Topics in Materials Science and Engineering: Past, Present and Future, Edited by S. Suresh. Acta Mater. 51, 5743–5774. doi:10.1016/j.actamat.2003.08.032
Li, X., Sha, A., Chen, B., and Chu, J. (2020). Effect of Microstructure on Tensile Deformation Behavior of Ti-3Al-4.5V-5Mo Titanium Alloy. J. Aeronaut. Mater 40, 45–52. doi:10.11868/j.issn.1005-5053.2020.000111
Liu, Y., Wang, L., He, S., Eng, F., Lv, X., and Zhang, B. (2012). Effect of Long-Term Aging on Dynamic Tensile Deformation Behavior of GH4169 Alloy. Acta Metall. Sin. 48, 49–55. doi:10.3724/sp.j.1037.2011.00435
Mahabadi, O. K., Tatone, B. S. A., and Grasselli, G. (2014). Influence of Microscale Heterogeneity and Microstructure on the Tensile Behavior of Crystalline Rocks. J. Geophys. Res. Solid Earth 119, 5324–5341. doi:10.1002/2014jb011064
Nielsen, B. F., Linga, G., Christensen, A., and Mathiesen, J. (2020). Substrate Curvature Governs Texture Orientation in Thin Films of Smectic Block Copolymers. Soft Matter 16, 3395–3406. doi:10.1039/c9sm02389e
Park, J. M., Yang, D. C., Kim, H.-J., Kim, D. G., Lee, S., Kim, H. S., et al. (2021). Ultra-strong and Strain-Hardenable Ultrafine-Grained Medium-Entropy Alloy via Enhanced Grain-Boundary Strengthening. Mater. Res. Lett. 9, 315–321. doi:10.1080/21663831.2021.1913768
Peng, F., Huang, W., Zhang, Z. Q., Guo, T. F., Ma, Y. E., and Zhang, Y. (2021). Conservational Integrals of the Fourth-Order Phase Field Model for Brittle Fracture via Noether Theorem. Eng. Fract. Mech. 245, 107590. doi:10.1016/j.engfracmech.2021.107590
Qi, K., Zhao, Y., Guo, H., Tian, X., and Hua, H. (2019). Phase Field Crystal Simulation of the Effect of Temperature on Low-Angle Symmetric Tilt Grain Boundary Dislocation Motion. Acta Phys. Sin-Ch Ed. 68, 80–89. doi:10.7498/aps.68.20190051
Qi, K., Zhao, Y., Tian, X., Peng, D., Sun, Y., and Hua, H. (2020). Phase Field Crystal Simulation of Effect of Misorientation Angle on Low-Angle Asymmetric Tilt Grain Boundary Dislocation Motion. Acta Phys. Sin-Ch Ed. 69, 69–78. doi:10.7498/aps.69.20200133
Roy, A., Devanathan, R., Johnson, D. D., and Balasubramanian, G. (2022). Grain-size Effects on the Deformation in Nanocrystalline Multi-Principal Element Alloy. Mater. Chem. Phys. 277, 125546. doi:10.1016/j.matchemphys.2021.125546
Shuai, X., Wang, Z. J., Mao, H., Tang, S., Kong, Y., and Du, Y. (2021). Atomic-scale Study of Compositional and Structural Evolution of Early-Stage Grain Boundary Precipitation in Al-Cu Alloys through Phase-Field Crystal Simulation. J. Mat. Sci. 56, 12700–12715. doi:10.1007/s10853-021-06064-0
Song, H. Y., Li, Y. L., and An, M. R. (2014). Atomic Simulations of the Effect of Twist Grain Boundaries on Deformation Behavior of Nanocrystalline Copper. Comput. Mater. Sci. 84, 40–44. doi:10.1016/j.commatsci.2013.11.052
Suh, B.-C., Kim, J. H., Bae, J. H., Hwang, J. H., Shim, M.-S., and Kim, N. J. (2017). Effect of Sn Addition on the Microstructure and Deformation Behavior of Mg-3Al Alloy. Acta Mater. 124, 268–279. doi:10.1016/j.actamat.2016.11.020
Tian, X.-l., Zhao, Y.-h., Peng, D.-w., Guo, Q.-w., Guo, Z., and Hou, H. (2021). Phase-field Crystal Simulation of Evolution of Liquid Pools in Grain Boundary Pre-melting Regions. Trans. Nonferrous Metals Soc. China 31, 1175–1188. doi:10.1016/s1003-6326(21)65570-x
Volnistem, E. A., Macková, L., Muniz, R. F., Estrada, F. R., de Nóbrega, S. M., Dias, G. S., et al. (2021). On the Effects of Dislocations on the Magnetism of BiFeO3 Nanoparticles. J. Alloys Compd. 887, 161421. doi:10.1016/j.jallcom.2021.161421
Wu, K. A., Adland, A., and Karma, A. (2010). Phase-field-crystal Model for Fcc Ordering. Phys. Rev. E Stat. Nonlin Soft Matter Phys. 81, 061601. doi:10.1103/PhysRevE.81.061601
Xia, Q., Liang, Y., Yang, C., Zhang, S., and Ou, M. (2019). Tensile Deformation Behavior of TC4 Titanium Alloy. RATE Met. 43, 765–773. doi:10.13373/j.cnki.cjrm.xy18040023
Xin, T., Zhao, Y., Mahjoub, R., Jiang, J., Yadav, A., Nomoto, K., et al. (2021). Ultrahigh Specific Strength in a Magnesium Alloy Strengthened by Spinodal Decomposition. Sci. Adv. 7, 1–9. doi:10.1126/sciadv.abf3039
Yan, M., Yuan, F., and Wu, X. (2021). Dynamic Shear Behaviors and Microstructural Deformation Mechanisms in FeNiAlC Dual-phase High Strength Alloy. Explos. Shock Waves 41 (1), 34–45. doi:10.11883/bzycj-2020-0224
Yang, T., Zhang, J., Long, J., Long, Q.-H., and Chen, Z. (2014). Phase Field Crystal Study of the Crystallization Modes within the Two-phase Region. Chin. Phys. B 23, 088109. doi:10.1088/1674-1056/23/8/088109
Yang, Y., Zhao, Y., Tian, X., and Hou, H. (2020). Microscopic Phase-Field Simulation for Precipitation Process of Ni60Al20V20 Medium Entropy Alloy. Acta Phys. Sin-Ch Ed. 69, 29–38. doi:10.7498/aps.69.20200154
Zhang, J., Wang, H., Kuang, W., Zhang, Y., Li, S., Zhao, Y., et al. (2018). Rapid Solidification of Non-stoichiometric Intermetallic Compounds: Modeling and Experimental Verification. Acta Mater. 148, 86–99. doi:10.1016/j.actamat.2018.01.040
Zhang, S., Chen, Z., and Yang, Y. (2014). Simulation of Structure and Deformation of Asymmetrical Tilt Grain Boundaries with Small Misorientation Angles by Two-Mode Phase Field Crystal Method. Rare Metal. Mat. Eng. 43, 610–614. 1002-185X(2014)03-0610-05.
Zhang, X., Huang, L. K., Zhang, B., Chen, Y. Z., Duan, S. Y., Liu, G., et al. (2019). Enhanced Strength and Ductility of A356 Alloy Due to Composite Effect of Near-Rapid Solidification and Thermo-Mechanical Treatment. Mater. Sci. Eng. A 753, 168–178. doi:10.1016/j.msea.2019.03.039
Zhao, Y.-H., Tian, X.-L., Zhao, B., Sun, Y., Guo, H., Dong, M., et al. (2018). Precipitation Sequence of Middle Al Concentration Alloy Using the Inversion Algorithm and Microscopic Phase Field Model. Sci. Adv. Mater 10, 1793–1804. doi:10.1166/sam.2018.3430
Zhao, Y., Chen, Z., Long, J., and Yang, T. (2014). Influence of Temperature on the Inverse Hall-Petch Effect in Nanocrystalline Materials: Phase Field Crystal Simulation. Acta Metall. Sin. Engl. Lett.) 27, 81–86. doi:10.1007/s40195-014-0027-5
Zhao, Y., Jing, J., Chen, L., Xu, F., and Hou, H. (2021). Current Research Status of Interface of Ceramic-Metal Laminated Composite Material for Armor Protection. Acta Metall. Sin. 57, 1107–1125. doi:10.11900/0412.1961.2021.00051
Keywords: phase-field crystal method, grain-boundary dislocation, grain-boundary misorientation, dislocation arrangement, dislocation decomposition, deformation
Citation: Li H, Wang X, Zhang H, Tian X, Hou H and Zhao Y (2022) Arrangement and Decomposition of Grain Boundary Dislocations: Two-Mode Phase-Field Crystal Simulation. Front. Mater. 9:875519. doi: 10.3389/fmats.2022.875519
Received: 14 February 2022; Accepted: 28 April 2022;
Published: 28 June 2022.
Edited by:
Zhenyu Li, University of Science and Technology of China, ChinaReviewed by:
Qing Wang, Dalian University of Technology, ChinaJichen Dong, Institute of Chemistry (CAS), China
Copyright © 2022 Li, Wang, Zhang, Tian, Hou and Zhao. This is an open-access article distributed under the terms of the Creative Commons Attribution License (CC BY). The use, distribution or reproduction in other forums is permitted, provided the original author(s) and the copyright owner(s) are credited and that the original publication in this journal is cited, in accordance with accepted academic practice. No use, distribution or reproduction is permitted which does not comply with these terms.
*Correspondence: Yuhong Zhao, emhhb3l1aG9uZ0BudWMuZWR1LmNu
†These authors have contributed equally to this work